Carbon Cycle Through Earth Systems
Begin
16 pages · ~32 min
Carbon Cycle Through Earth Systems
In this training, learners explore how carbon moves through Earth's systems—atmosphere, biosphere, hydrosphere, and geosphere—to understand the carbon cycle's role in climate and life.
What you’ll learn
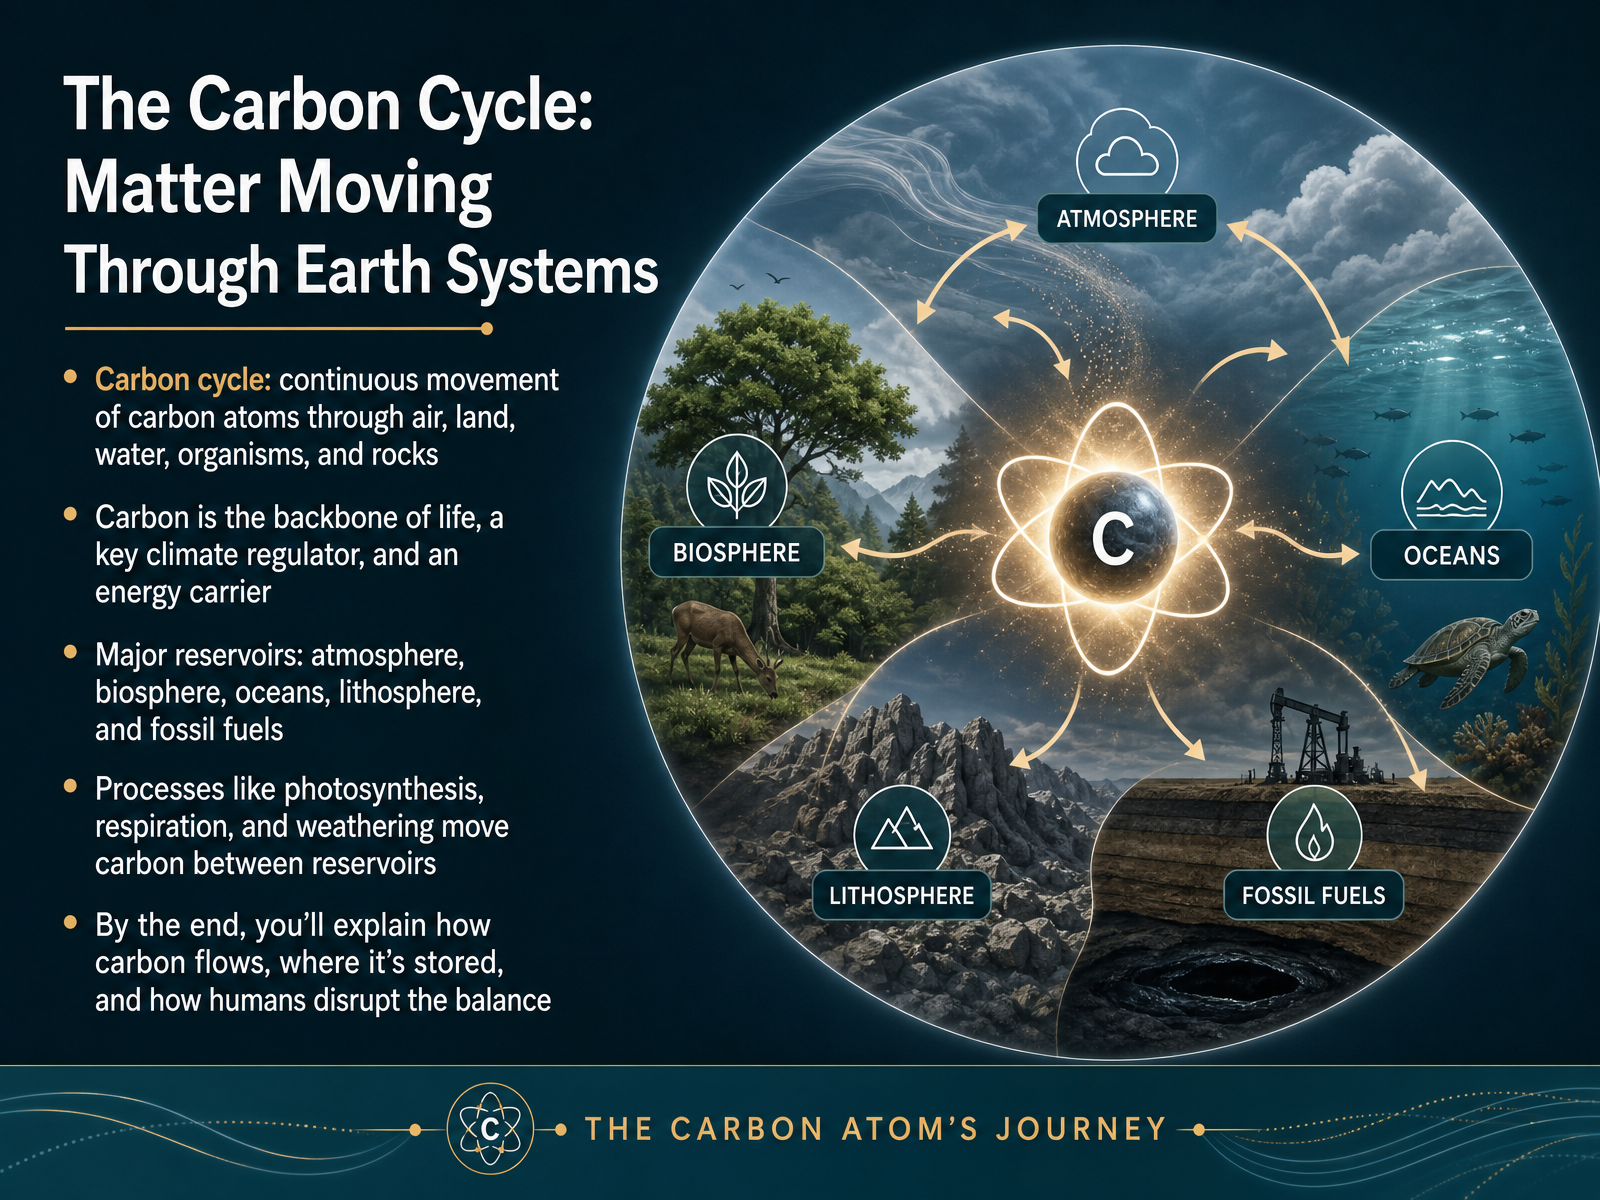
- 01The Carbon Cycle: Matter Moving Through Earth SystemsWelcome. I'm glad your digital human instructor. Today we're going to explore the carbon cycle—the continuous movement of carbon atoms through the air, land, water, living organisms, and even rocks. Carbon is the backbone of life, it helps regulate our climate, and it carries energy through ecosystems. We'll walk through the major reservoirs where carbon is stored: the atmosphere, the biosphere, the oceans, the solid earth, and fossil fuels. Along the way, we'll define a few key terms like 'reservoir' and 'flux' so you can follow the flow with confidence. We'll also talk about the processes that move carbon between these reservoirs—things like photosynthesis, respiration, and weathering. By the end of our time together, you'll be able to explain how carbon flows, where it's stored, and how human activities are disrupting the natural balance. Let's begin by looking at Earth's carbon reservoirs and where the carbon actually is.icos-cp.euessd.copernicus.orgpure.iiasa.ac.at+21 min
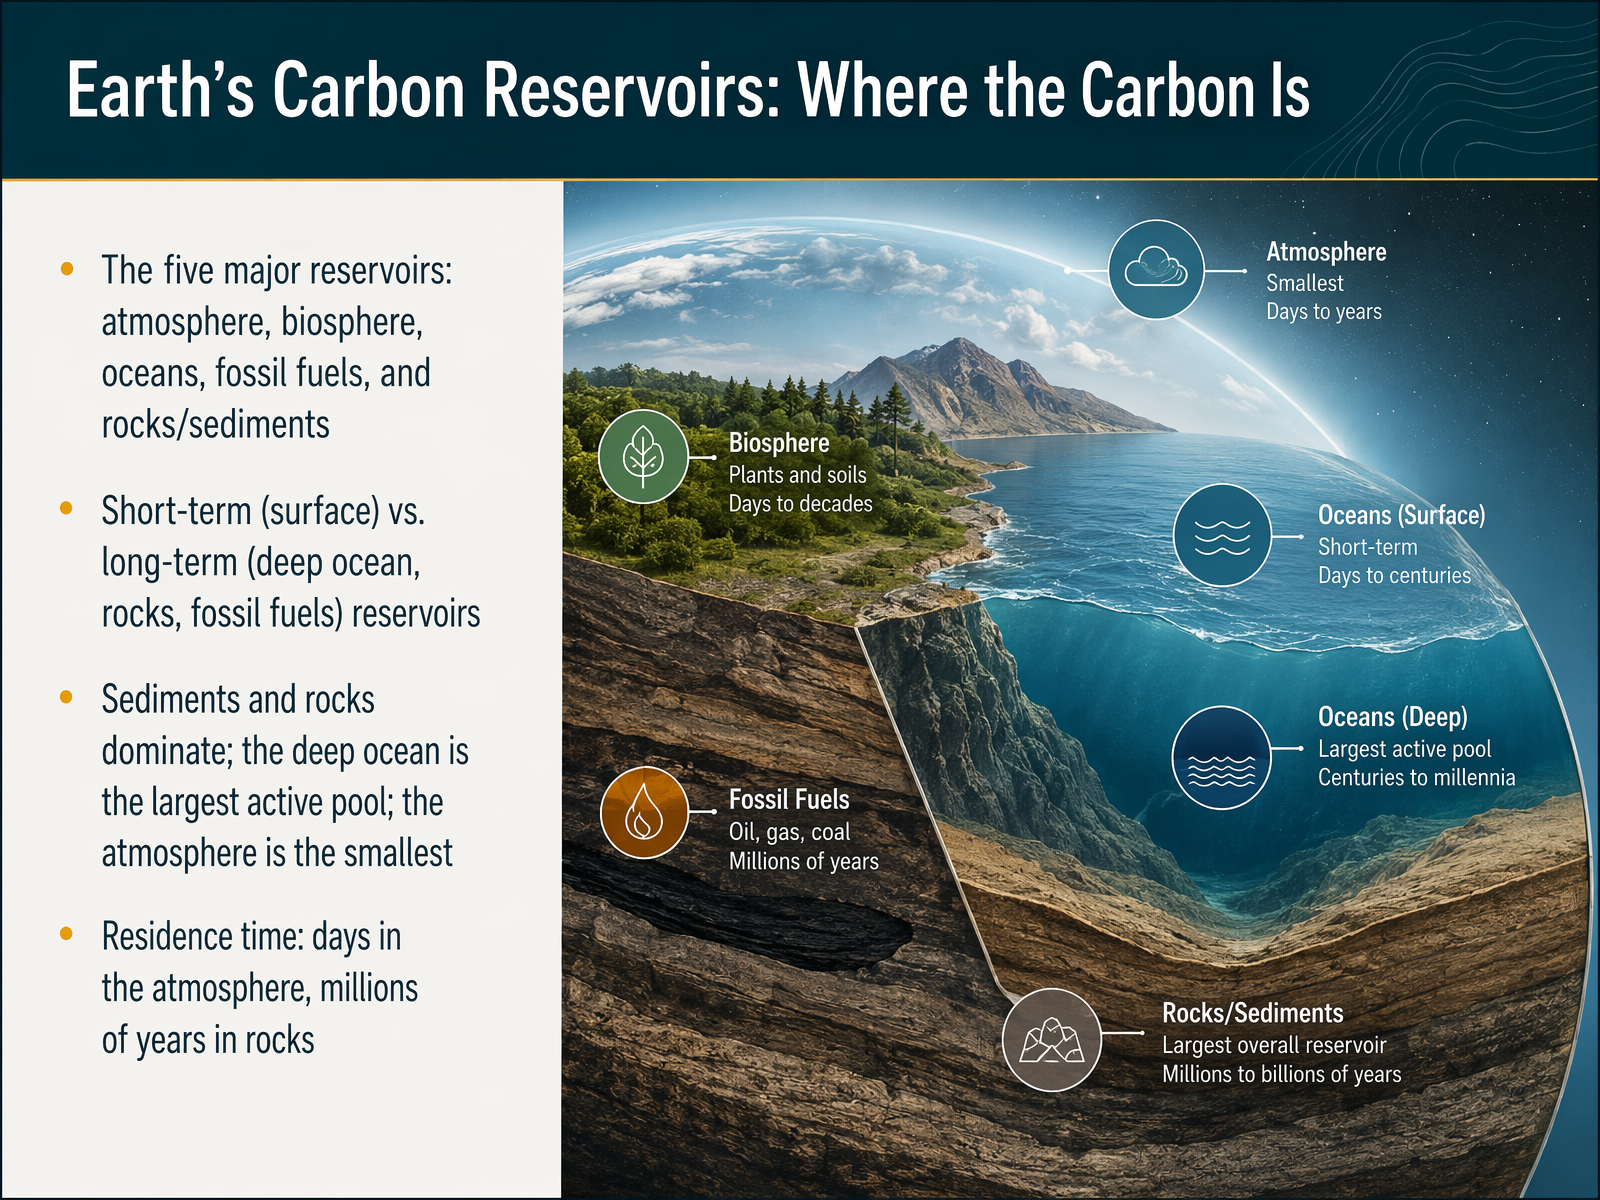
- 02Earth's Carbon Reservoirs: Where the Carbon IsWhere Earth's carbon actually sits. We call these storage spaces reservoirs, and there are five major ones. The atmosphere, the biosphere which means all living things, the oceans, fossil fuels, and rocks and sediments. We can group them by how quickly carbon moves through. The atmosphere, land biosphere, and surface ocean are short-term, surface reservoirs. The deep ocean, fossil fuels, and rocks are long-term reservoirs where carbon can stay locked away for a very long time. Here's the big picture. Sediments and rocks hold the vast majority of Earth's carbon. The deep ocean is the largest active pool. And the atmosphere, even though it drives our climate story, is actually the smallest reservoir. To understand the pace of change, we use a concept called residence time, the average time a carbon atom spends in a reservoir. For carbon in the atmosphere, that's only a few years. But in rocks, it can be millions of years. That contrast will be key as we start tracing the actual movement. Next, we'll dive into the fast carbon cycle, where photosynthesis, respiration, and air-sea exchange constantly move carbon between the surface reservoirs.
 pmel.noaa.govgml.noaa.govgml.noaa.gov+22 min
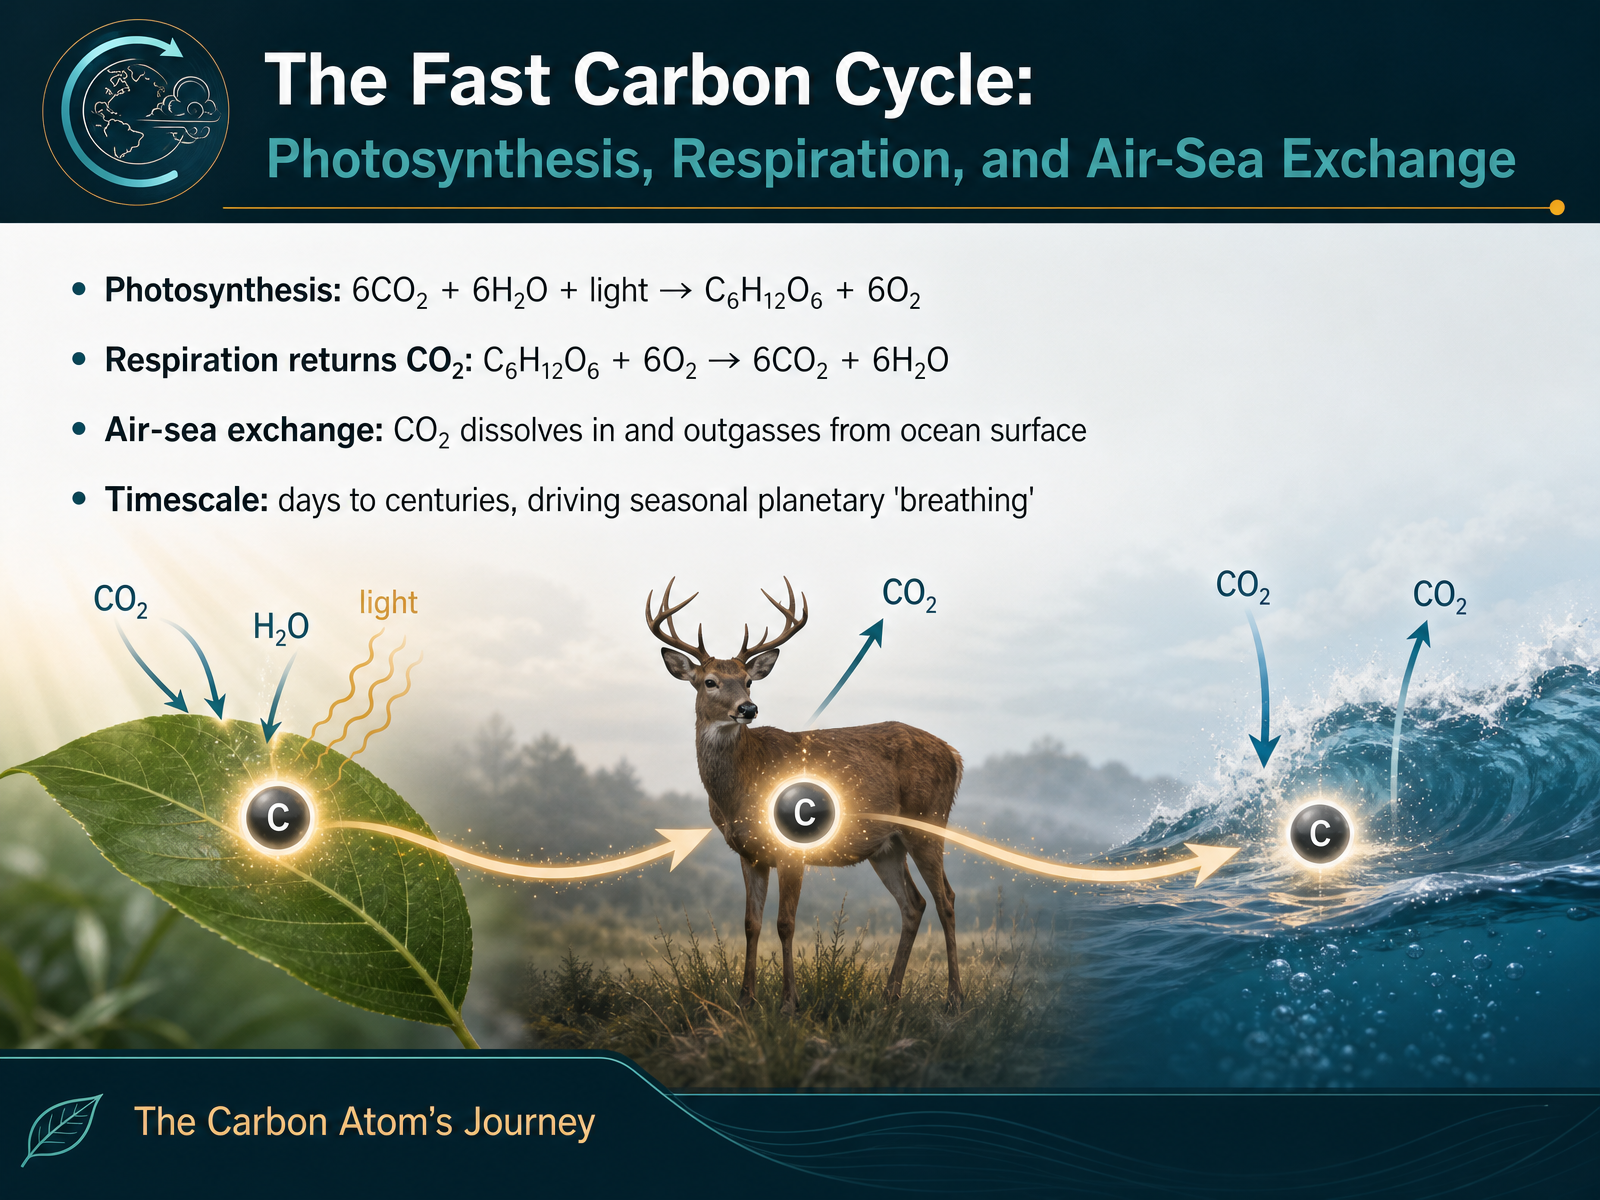
 - 03The Fast Carbon Cycle: Photosynthesis, Respiration, and Air-Sea ExchangeNow let's look at the engine that drives the fast carbon cycle. On land, it starts with photosynthesis. Plants take carbon dioxide and water, add sunlight, and produce sugar to build their tissues, releasing oxygen as a byproduct. You can see the balanced chemical equation right here on the slide. Respiration does the reverse. When living things break down that sugar for energy, they return carbon dioxide to the atmosphere. So photosynthesis pulls carbon in, and respiration sends it back out. Over the ocean, we get a different kind of exchange. Carbon dioxide dissolves directly into the surface water, and it can also outgas back into the air, depending on the concentration difference. These processes operate on timescales from days to centuries, and together they create a seasonal rhythm. During spring and summer, photosynthesis dominates in the Northern Hemisphere, pulling global carbon dioxide levels down. In fall and winter, respiration takes over, and those levels rise again. Scientists often call this the planet's breathing. Next, we'll see how this breathing is recorded in one of the most famous graphs in climate science, as we move into reading the planet's breath with the Keeling Curve and the seasonal cycle.
 keelingcurve.ucsd.edugml.noaa.govkeelingcurve.ucsd.edu+22 min
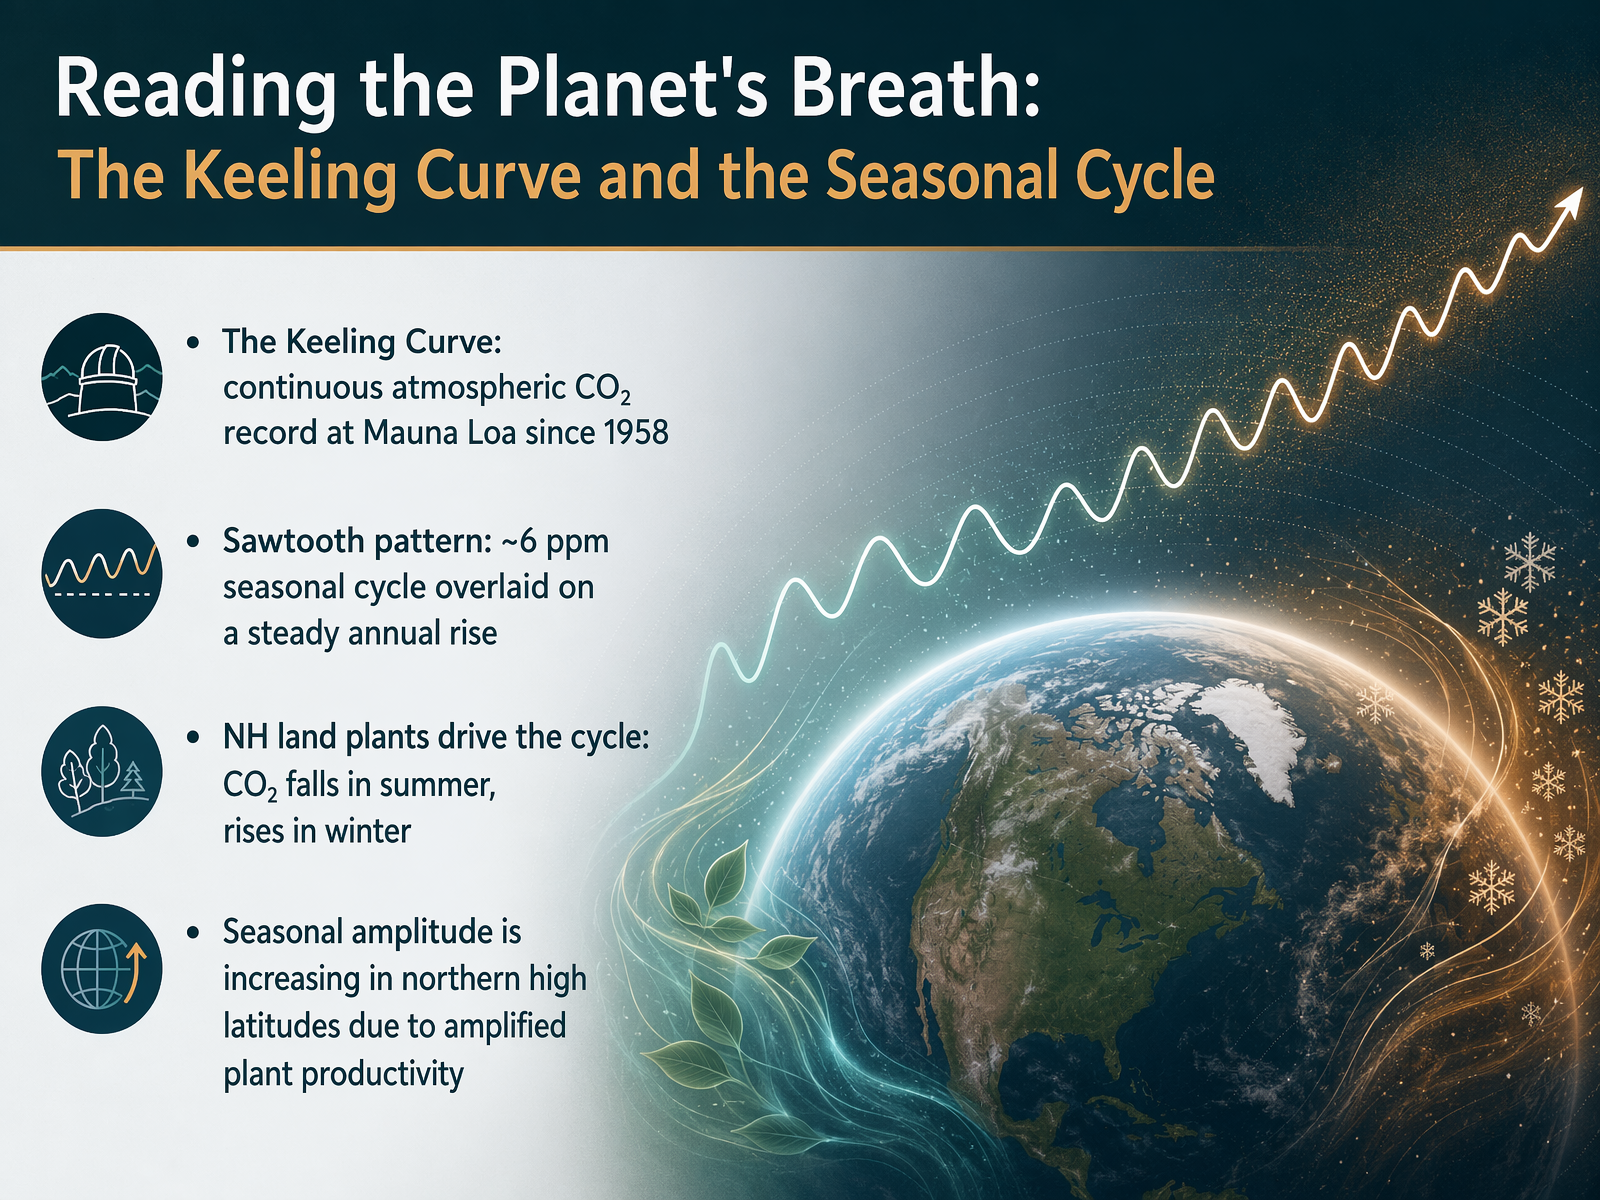
 - 04Reading the Planet's Breath: The Keeling Curve and the Seasonal CycleNow let's look at one of the most important graphs in climate science: the Keeling Curve. This is the continuous record of atmospheric carbon dioxide measured at the Mauna Loa Observatory in Hawaii, starting back in 1958. When Charles David Keeling began these measurements, he noticed something fascinating. The curve doesn't just go up in a straight line. It has a sawtooth pattern, a seasonal wobble of about 6 parts per million. Every year, CO2 rises to a peak in May, then falls as the Northern Hemisphere's plants wake up and pull carbon out of the air through photosynthesis. It reaches a low around September, before climbing again in autumn and winter as respiration and decay return CO2 to the atmosphere. So the planet is essentially breathing, and this record is like reading that breath. We also see that the seasonal swing is getting larger in the high northern latitudes. This is driven by amplified plant productivity, a longer growing season and more vegetation responding to warmer temperatures and higher CO2. Next, we'll shift gears from this fast annual cycle to the slow carbon cycle and Earth's geological thermostat.
 keelingcurve.ucsd.edugml.noaa.govkeelingcurve.ucsd.edu+22 min
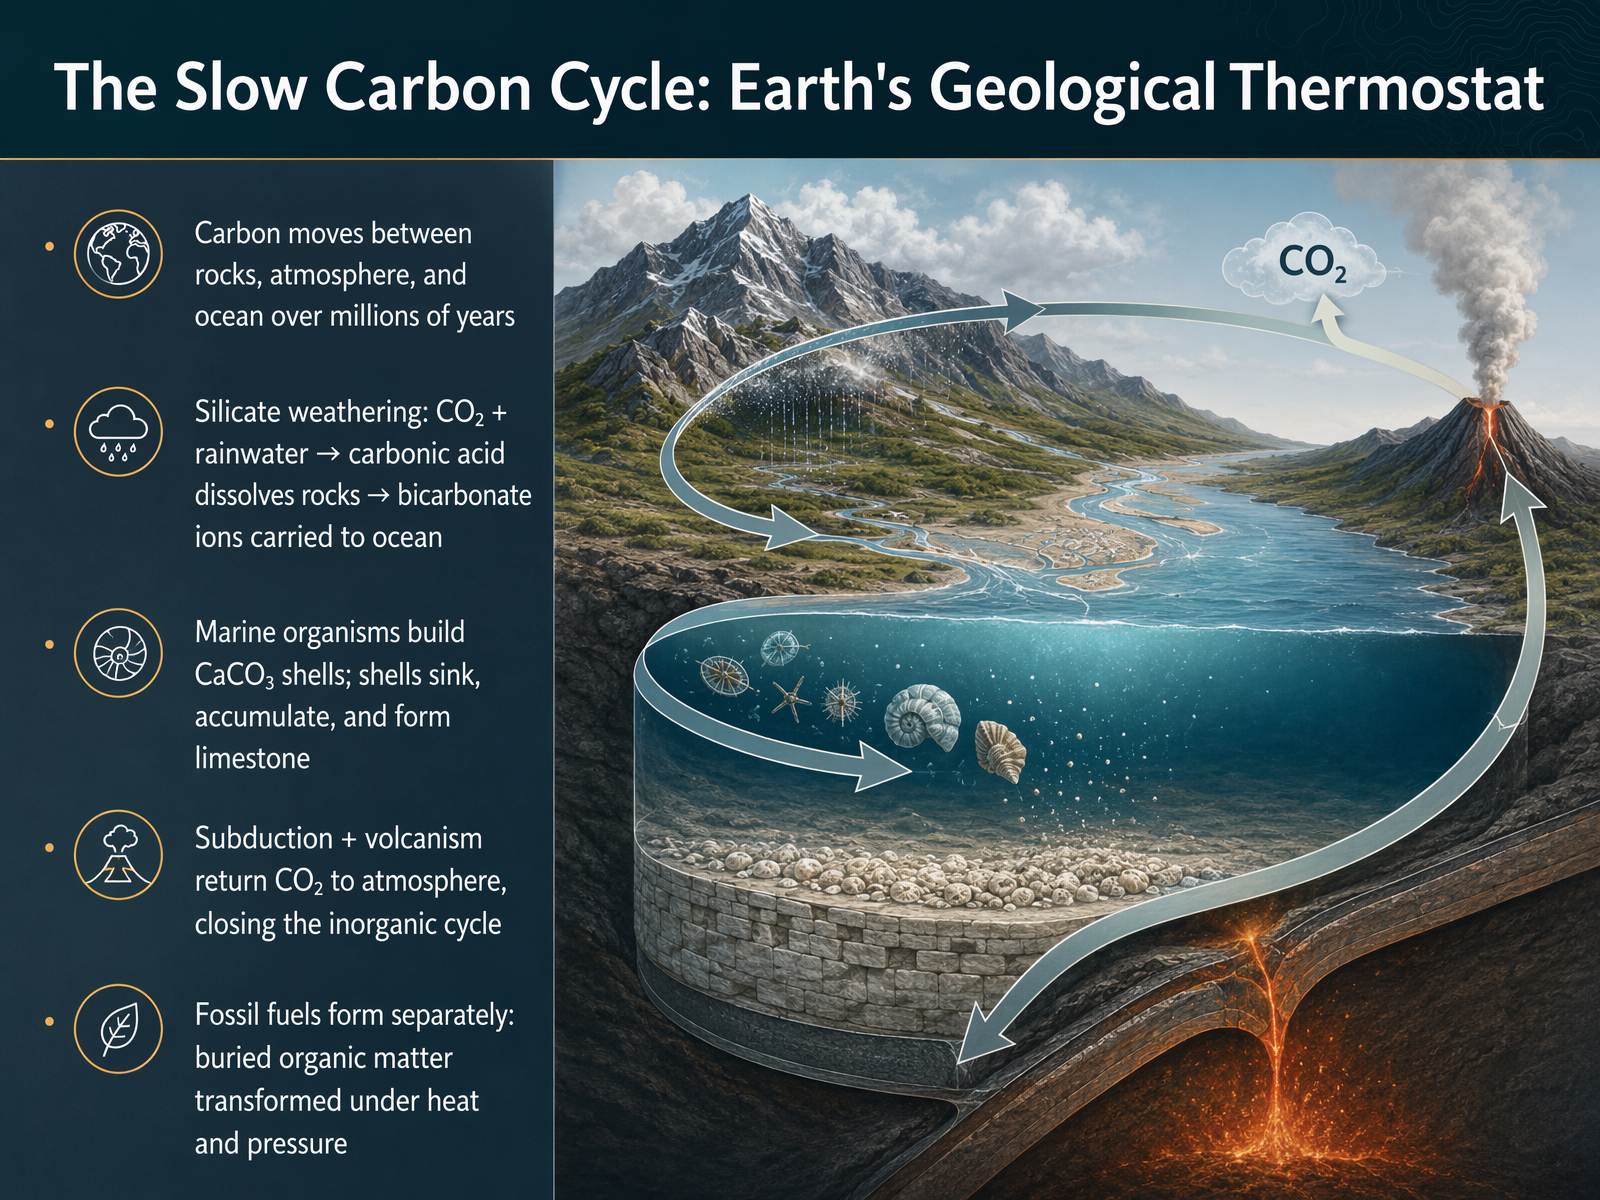
 - 05The Slow Carbon Cycle: Earth's Geological ThermostatNow let's zoom out to the slow carbon cycle, which acts like Earth's geological thermostat. This loop moves carbon among rocks, the atmosphere, and the ocean over millions of years. It starts with silicate weathering. When carbon dioxide in the air mixes with rainwater, it forms a weak carbonic acid. That acid dissolves silicate rocks on land, and the resulting bicarbonate ions are carried by rivers to the ocean. Once in the ocean, marine organisms use those ions to build calcium carbonate shells. When they die, their shells sink, accumulate on the seafloor, and eventually harden into limestone. Over immense timescales, plate tectonics pushes that seafloor down into subduction zones. The buried carbonate rocks heat up, break down, and release carbon dioxide back to the atmosphere through volcanoes, closing the inorganic loop. It’s important to note that fossil fuels form through a separate pathway. They come from buried organic matter, not from shell-building creatures, and are transformed by heat and pressure over millions of years. Next, we’ll look at how the ocean locks away carbon through its two main pumps.
 doi.orgfrontiersin.orgagupubs.onlinelibrary.wiley.com+22 min
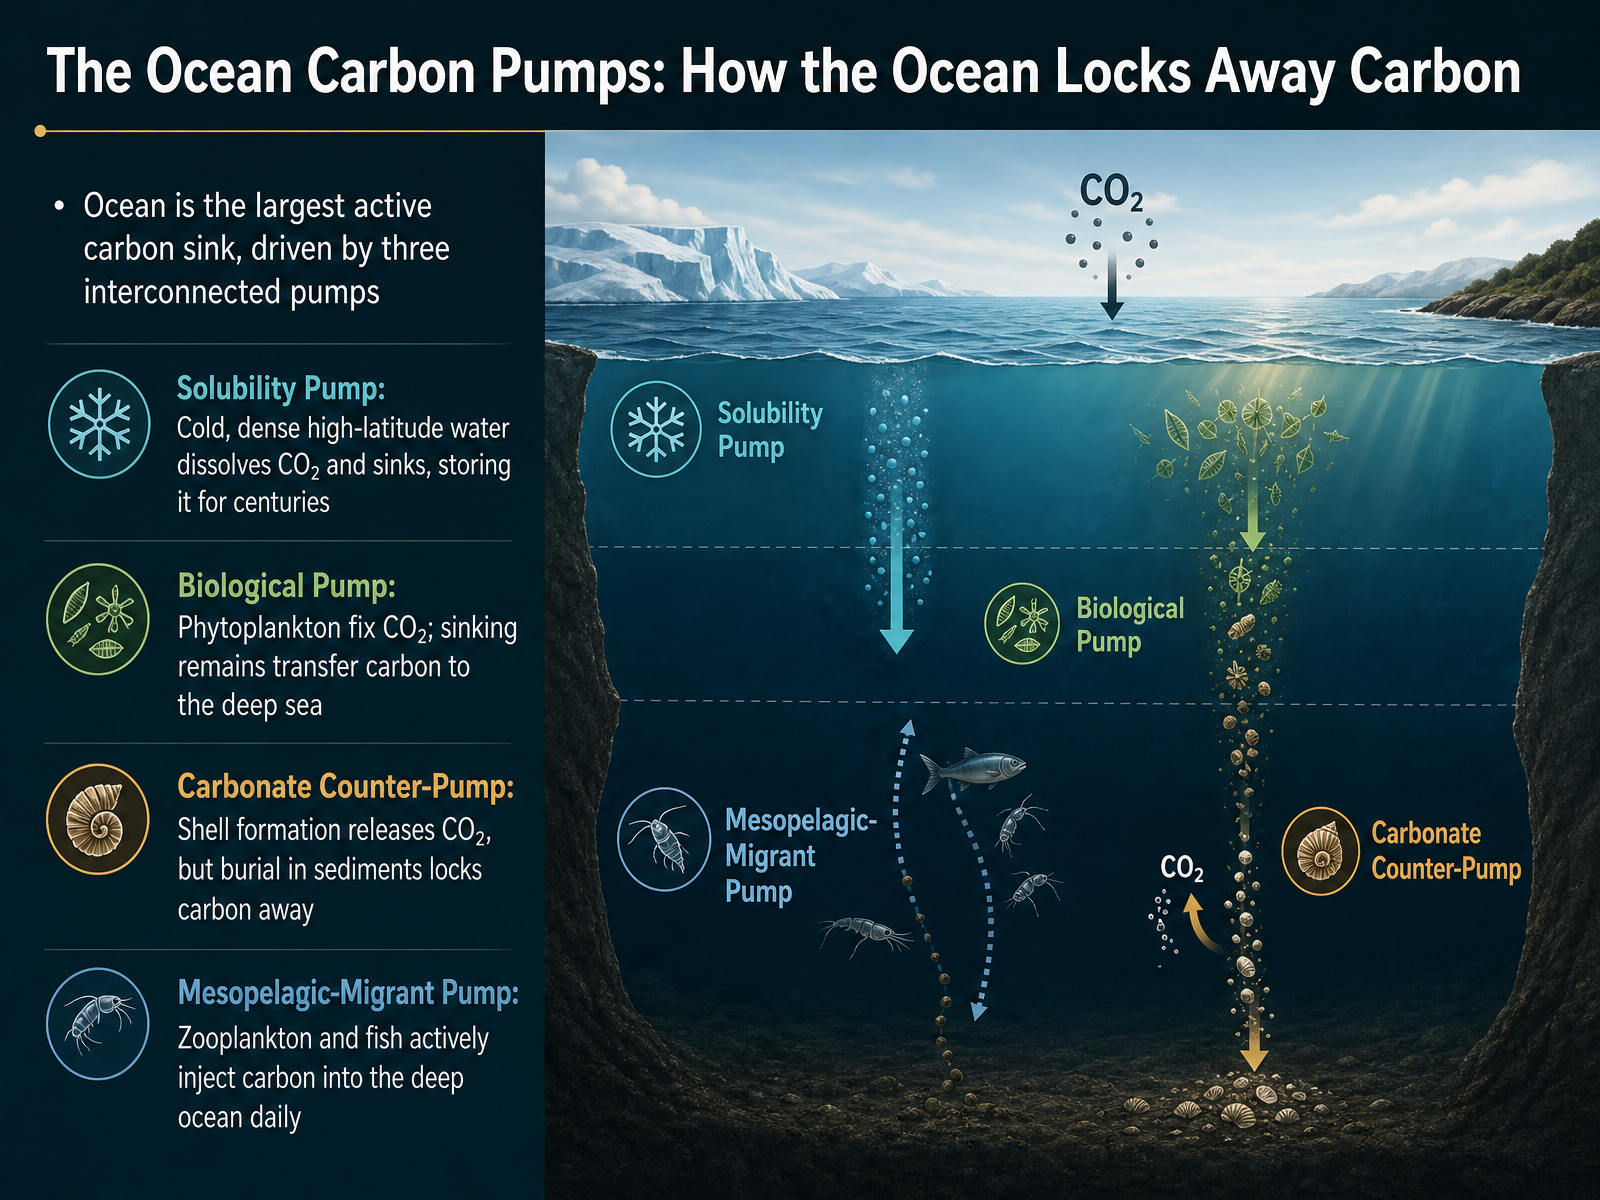
 - 06The Ocean Carbon Pumps: How the Ocean Locks Away CarbonNow let's explore the mechanisms that make the ocean such a massive carbon reservoir. We call these the ocean carbon pumps, and they work together to lock carbon away, often for centuries. The first is the solubility pump. Cold, dense water at high latitudes can hold more carbon dioxide, so it absorbs CO₂ from the atmosphere and sinks, carrying that carbon into the deep ocean. Next is the biological pump. Tiny phytoplankton near the surface fix carbon dioxide through photosynthesis. When they die or are consumed, their remains sink as 'marine snow,' transferring carbon to the deep sea. Recent research shows that the shape of these sinking particles matters a lot—dense, spherical aggregates sink faster and carry carbon deeper than porous flakes. We also have the carbonate counter-pump. Organisms build shells from carbonate, a process that releases some CO₂ back near the surface. But when those shells are buried in sediments, they lock carbon away long-term. Finally, there's the mesopelagic-migrant pump. Each day, zooplankton and small fish migrate to the surface to feed at night and return to the twilight zone during the day, actively injecting carbon into the deep ocean. In the Southern Ocean, this active pump can account for over a third of the total carbon export. These pumps collectively store about 38,000 gigatons of carbon, making the ocean our largest active carbon sink. Next, we'll shift to human interference and examine fossil fuels, land use, and the emission surge.
 bg.copernicus.orgpmel.noaa.govgml.noaa.gov+22 min
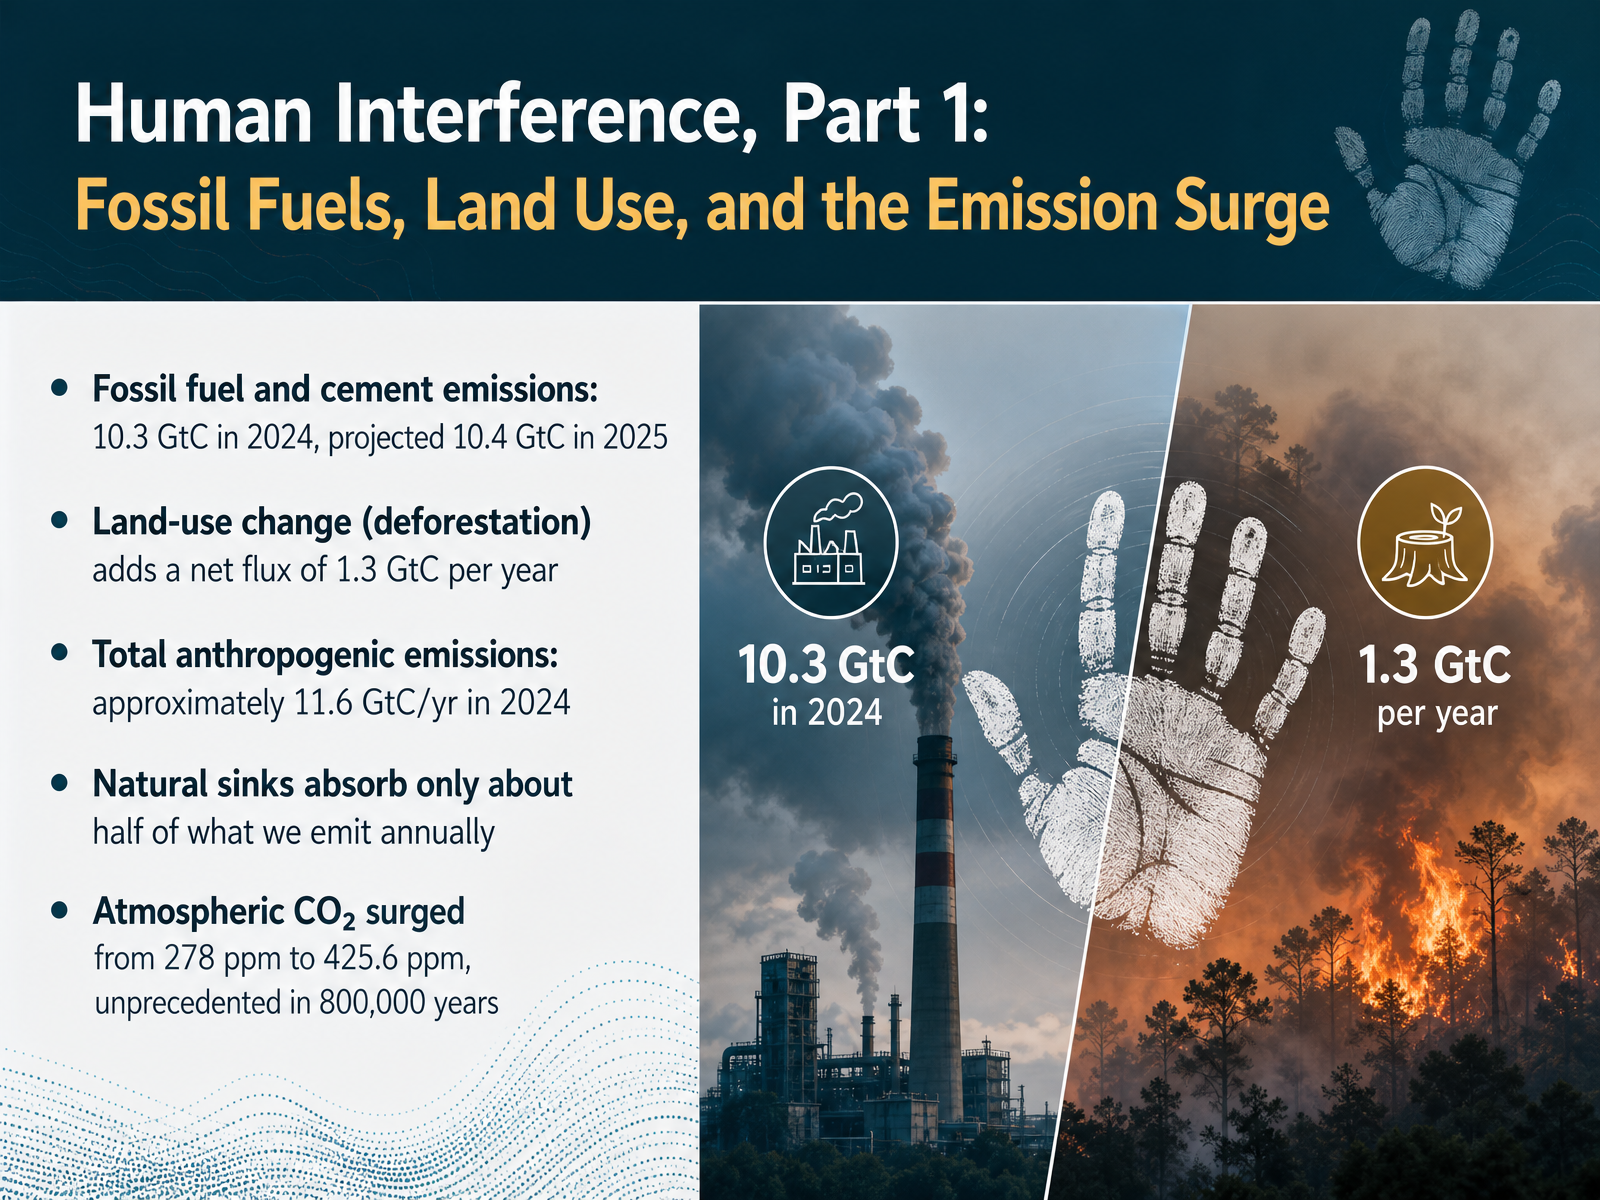
 - 07Human Interference, Part 1: Fossil Fuels, Land Use, and the Emission SurgeNow, let's turn to the human side of the carbon cycle. We're adding carbon to the system at a scale that's reshaping the planet's balance. In 2024, fossil fuel use and cement production released about 10.3 gigatons of carbon into the atmosphere. That's a massive number—and early data for 2025 projects it will rise again, to around 10.4 gigatons. On top of that, land-use change, mainly deforestation, adds a net flux of roughly 1.3 gigatons of carbon each year. When you add these up, you get total anthropogenic emissions of about 11.6 gigatons of carbon per year. Now, here's the critical point: natural sinks—the ocean and the land—only absorb about half of what we emit annually. The rest stays in the atmosphere. That's why atmospheric carbon dioxide has surged from approximately 278 parts per million before the industrial era to 425.6 parts per million today. That's a concentration of CO2 that is unprecedented in at least 800,000 years. We're fundamentally altering the composition of the air we all share. Next, we’ll explore how these rising emissions are driving the enhanced greenhouse effect and triggering powerful climate feedbacks.
 icos-cp.euessd.copernicus.orgpure.iiasa.ac.at+22 min
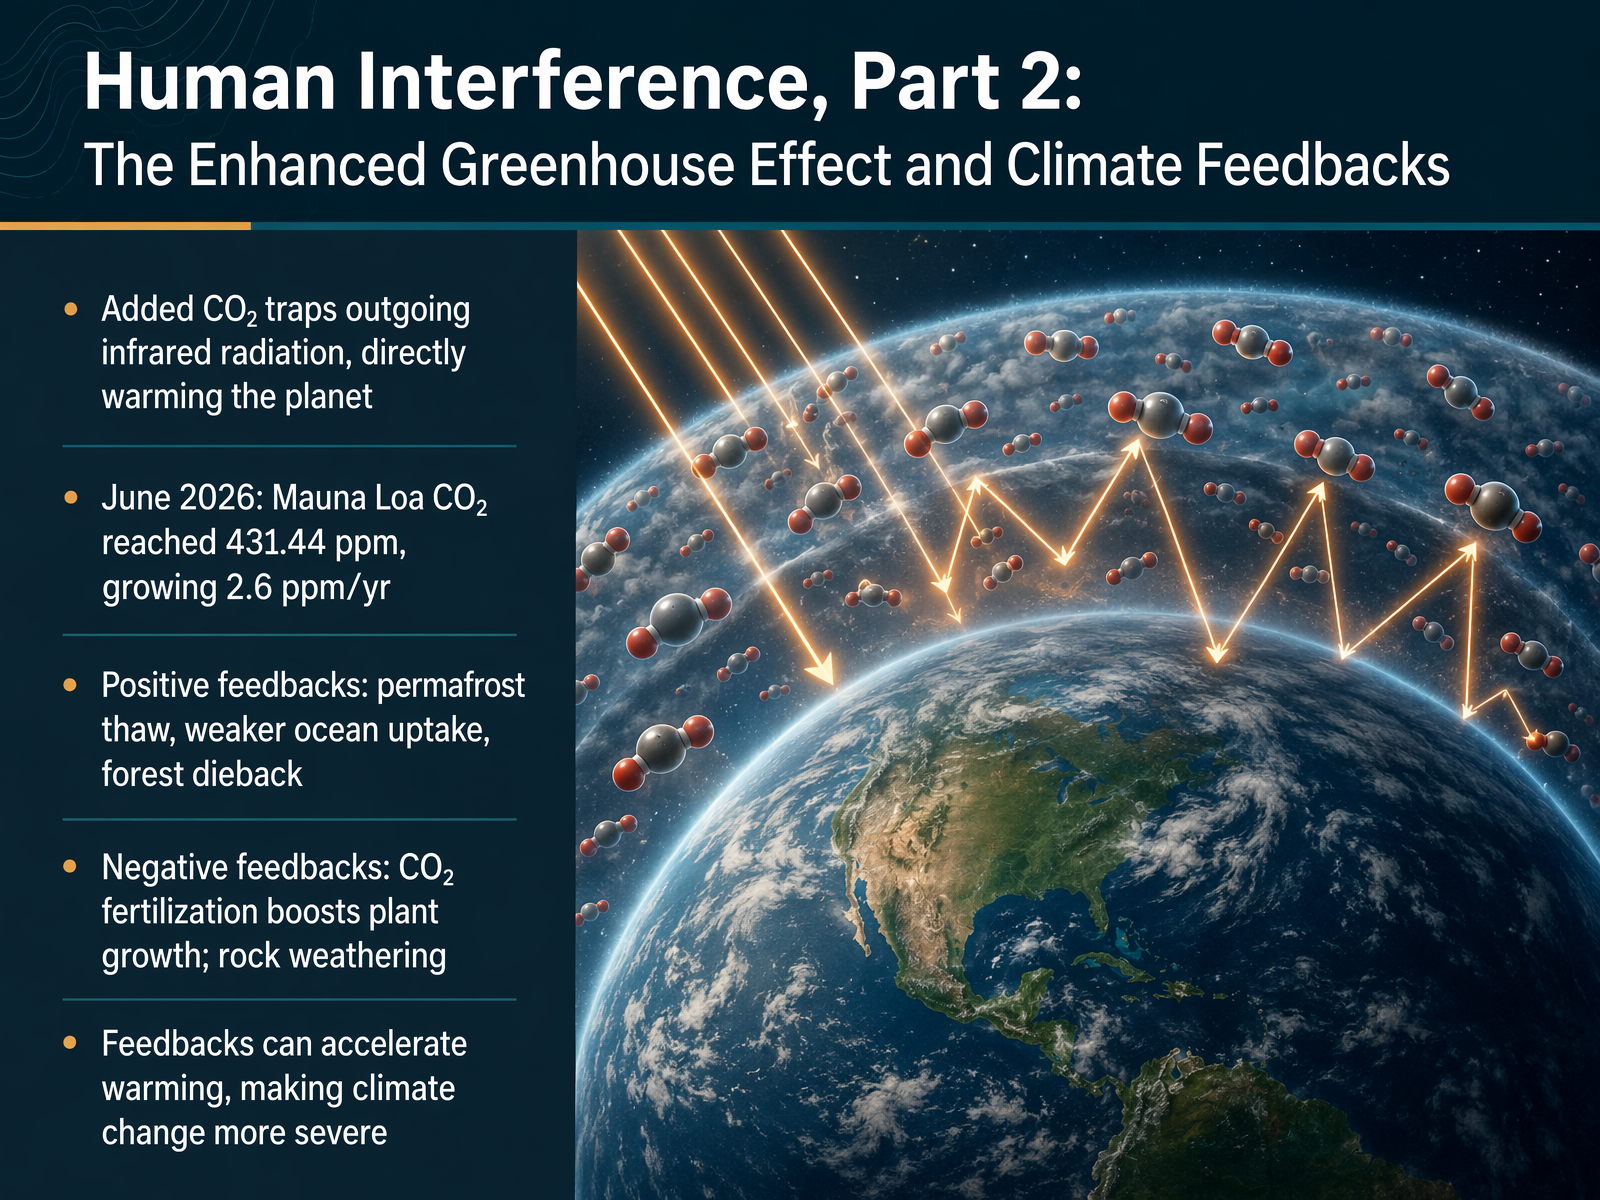
 - 08Human Interference, Part 2: The Enhanced Greenhouse Effect and Climate FeedbacksNow let's turn to the direct consequences of all that added carbon dioxide. The core mechanism is the enhanced greenhouse effect. Simply put, the extra CO two we emit traps more of the Earth's outgoing infrared radiation, which directly warms the planet. To give you a sense of scale, in June of twenty twenty-six, the Mauna Loa Observatory recorded a monthly average of four hundred thirty-one point four four parts per million. That's an increase of two point six parts per million per year. As the planet warms, it triggers feedback loops that can either amplify or dampen the change. Positive feedbacks accelerate warming. For example, thawing permafrost releases methane and CO two, while a warmer ocean absorbs less carbon, and forest dieback turns a carbon sink into a source. We do have some negative feedbacks working in the opposite direction, like CO two fertilization helping plants grow faster, and enhanced rock weathering. But the critical point is that the positive feedbacks are strong enough to make climate change more severe, potentially accelerating warming beyond what our emissions alone would cause. This brings us directly to one of the most concerning positive feedbacks: the permafrost carbon time bomb.
 essd.copernicus.orgcentaur.reading.ac.ukpar.nsf.gov+12 min
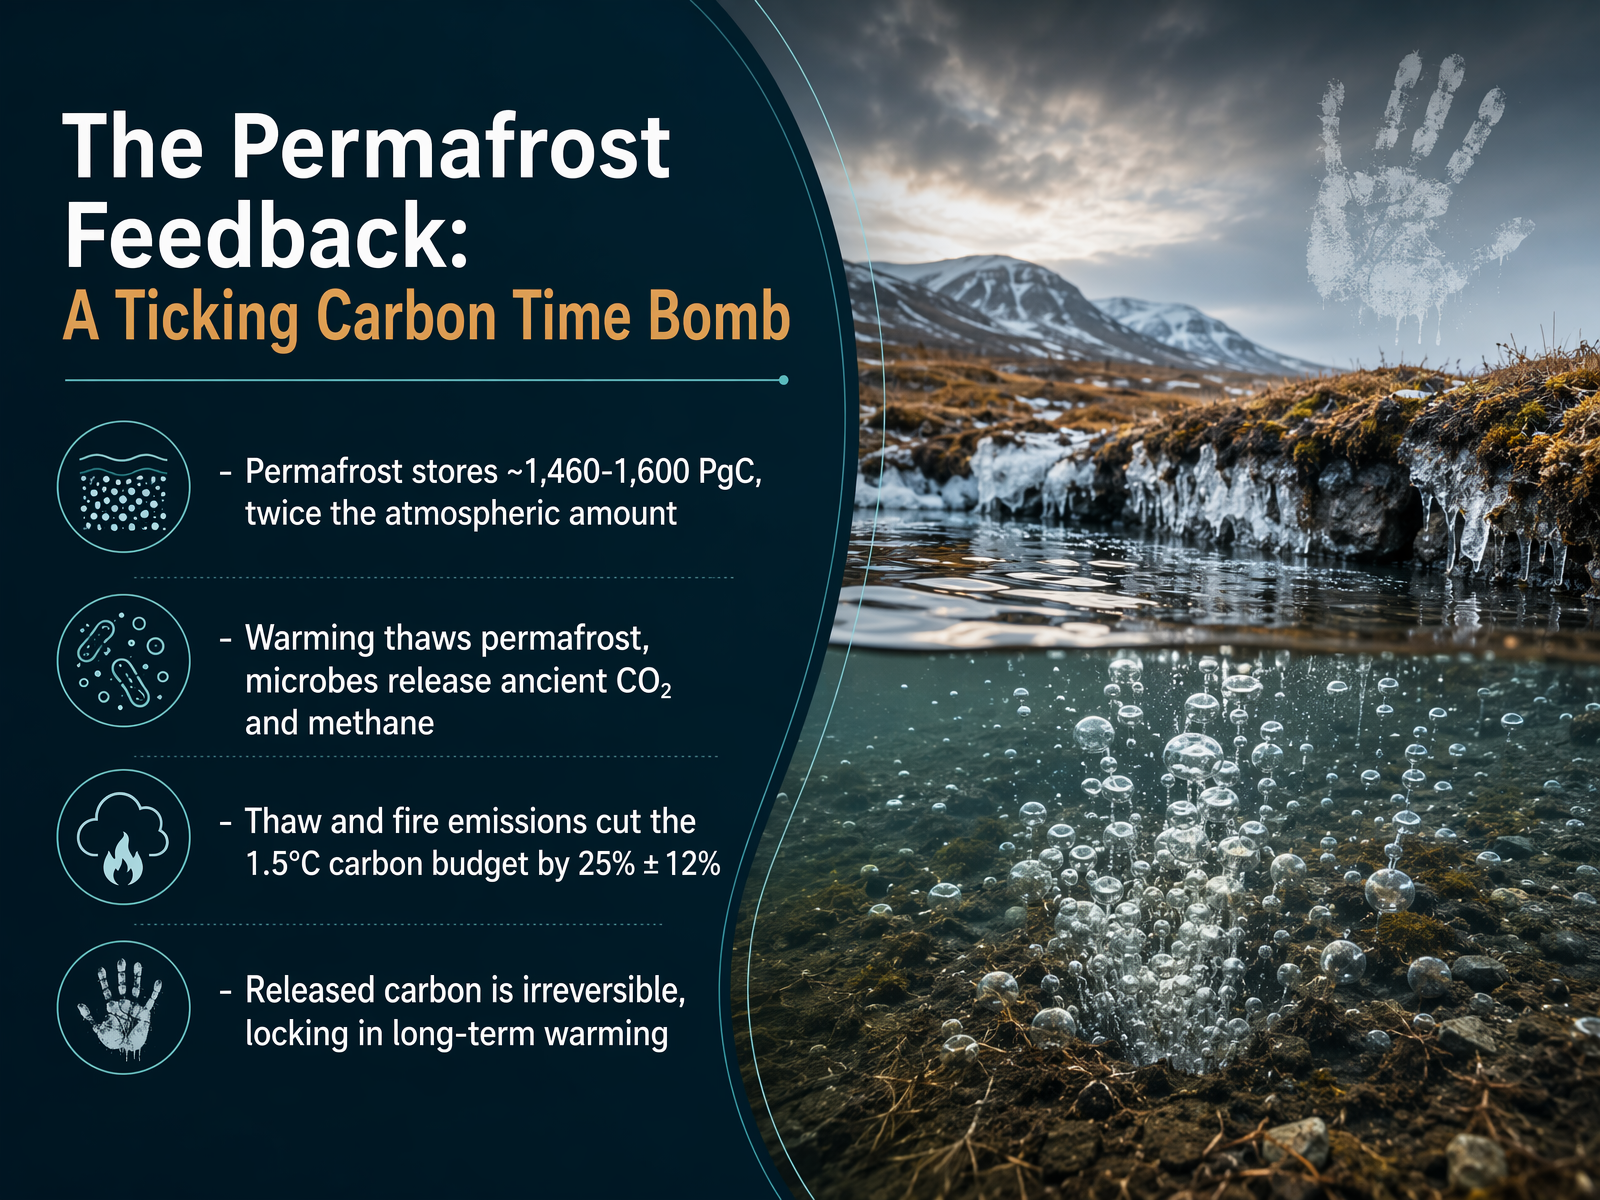
 - 09The Permafrost Feedback: A Ticking Carbon Time BombNow, let's turn to a carbon reservoir that is frozen but far from stable: permafrost. Think of it as a massive carbon bank, storing about fourteen hundred sixty to sixteen hundred petagrams of carbon—that's roughly twice the amount currently in our entire atmosphere. As the Arctic warms, this frozen ground thaws, and microbes wake up to break down ancient organic matter. They release carbon dioxide and the even more potent greenhouse gas, methane. This process is a dangerous feedback loop. The more we warm the planet, the more permafrost thaws, releasing more greenhouse gases that cause even more warming. Recent research shows that including these emissions, along with wildfires that burn the thawing soil, cuts our remaining carbon budget for the one-point-five degrees Celsius target by a full twenty-five percent, with an uncertainty of twelve percent. And because this carbon has been locked away for millennia, once it's released, it's effectively irreversible—locking in long-term warming for centuries. Let's see how this ticking time bomb fits into the budget we can still afford to spend, by looking at the global carbon budget next.
 2 min
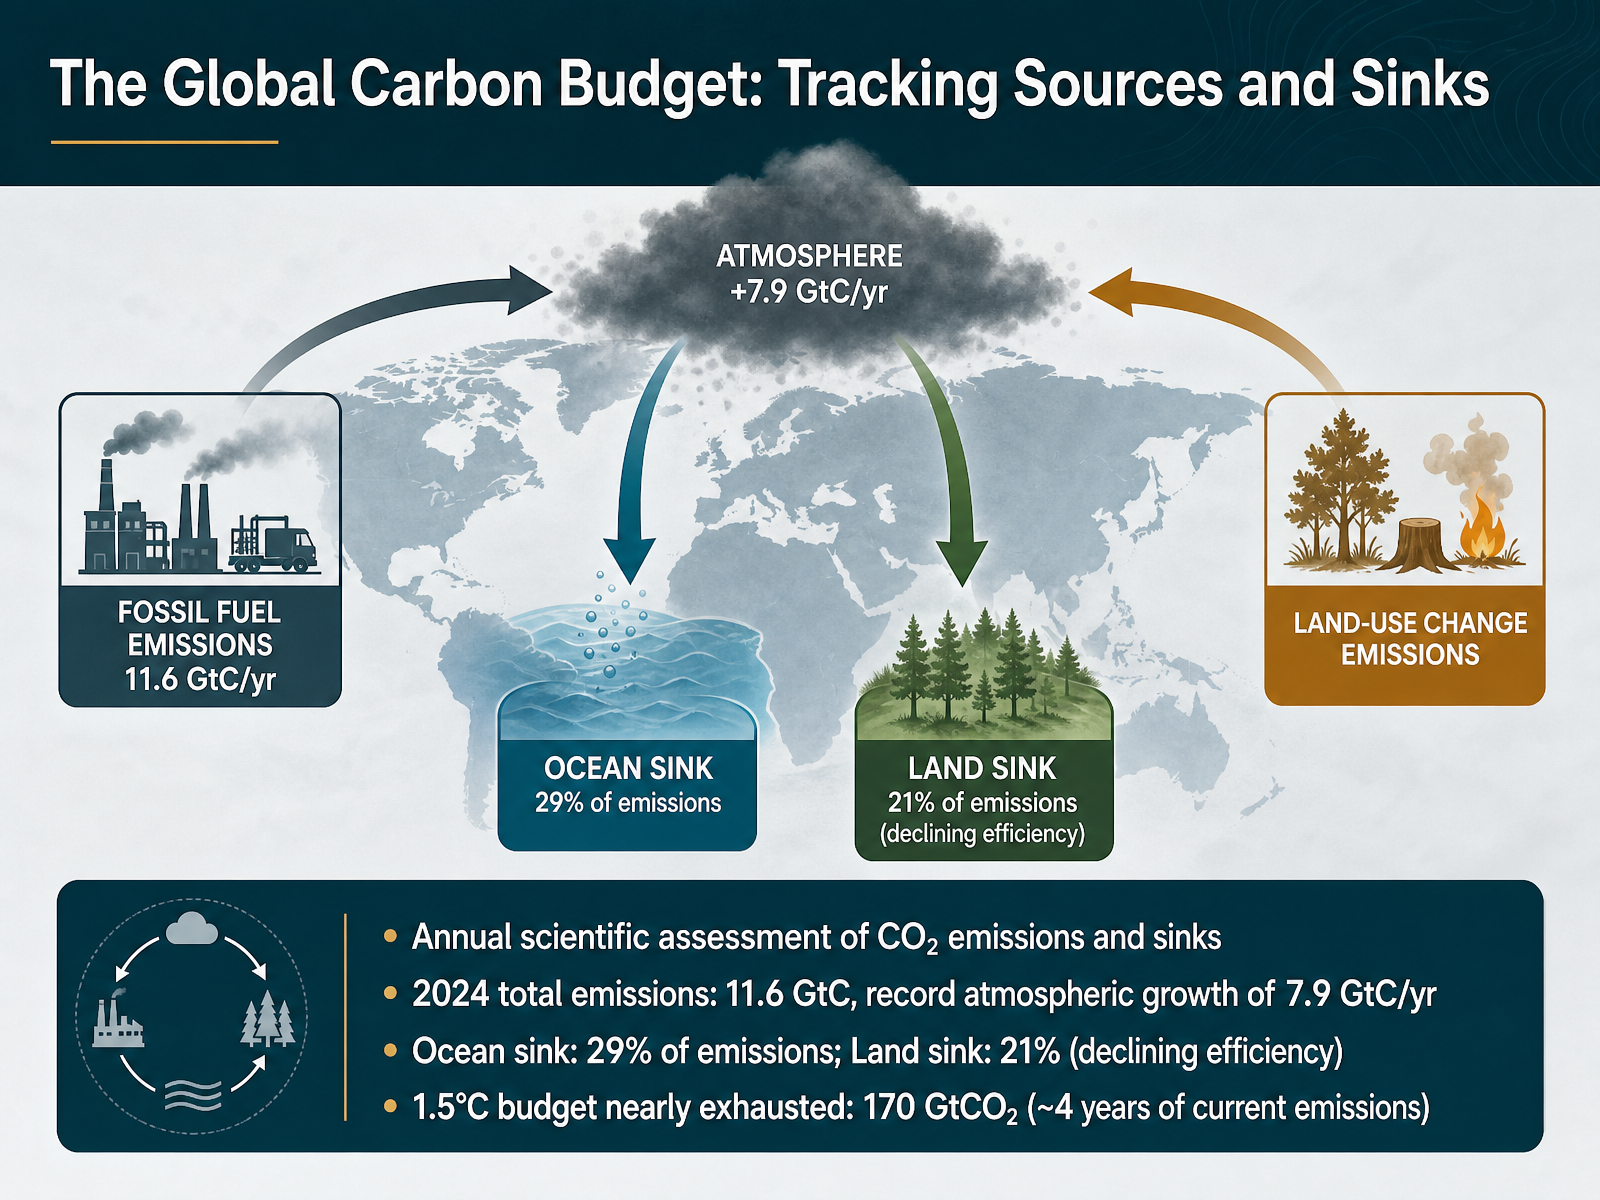
2 min - 10The Global Carbon Budget: Tracking Sources and SinksNow we turn to the numbers that make this cycle measurable: the global carbon budget. Think of this as an annual scientific assessment that tracks all the major sources of CO2 emissions against the natural sinks that absorb them. In 2024, total anthropogenic emissions reached eleven point six gigatons of carbon, while a record atmospheric growth rate of seven point nine gigatons of carbon per year was recorded. Over the past decade, the ocean sink has absorbed about twenty-nine percent of our emissions, and the land sink has taken up roughly twenty-one percent. But here’s the concerning part: the efficiency of both sinks is declining. Climate change itself is weakening the land and ocean’s ability to absorb carbon. The remaining carbon budget for a fifty percent chance of limiting warming to one point five degrees Celsius is now nearly exhausted. We have about one hundred and seventy gigatons of CO2 left, which at current emission rates gives us roughly four years. Let’s look next at how we actually measure these atmospheric changes, with the monitoring legacy that started it all.
 essd.copernicus.orgcentaur.reading.ac.ukpar.nsf.gov+22 min
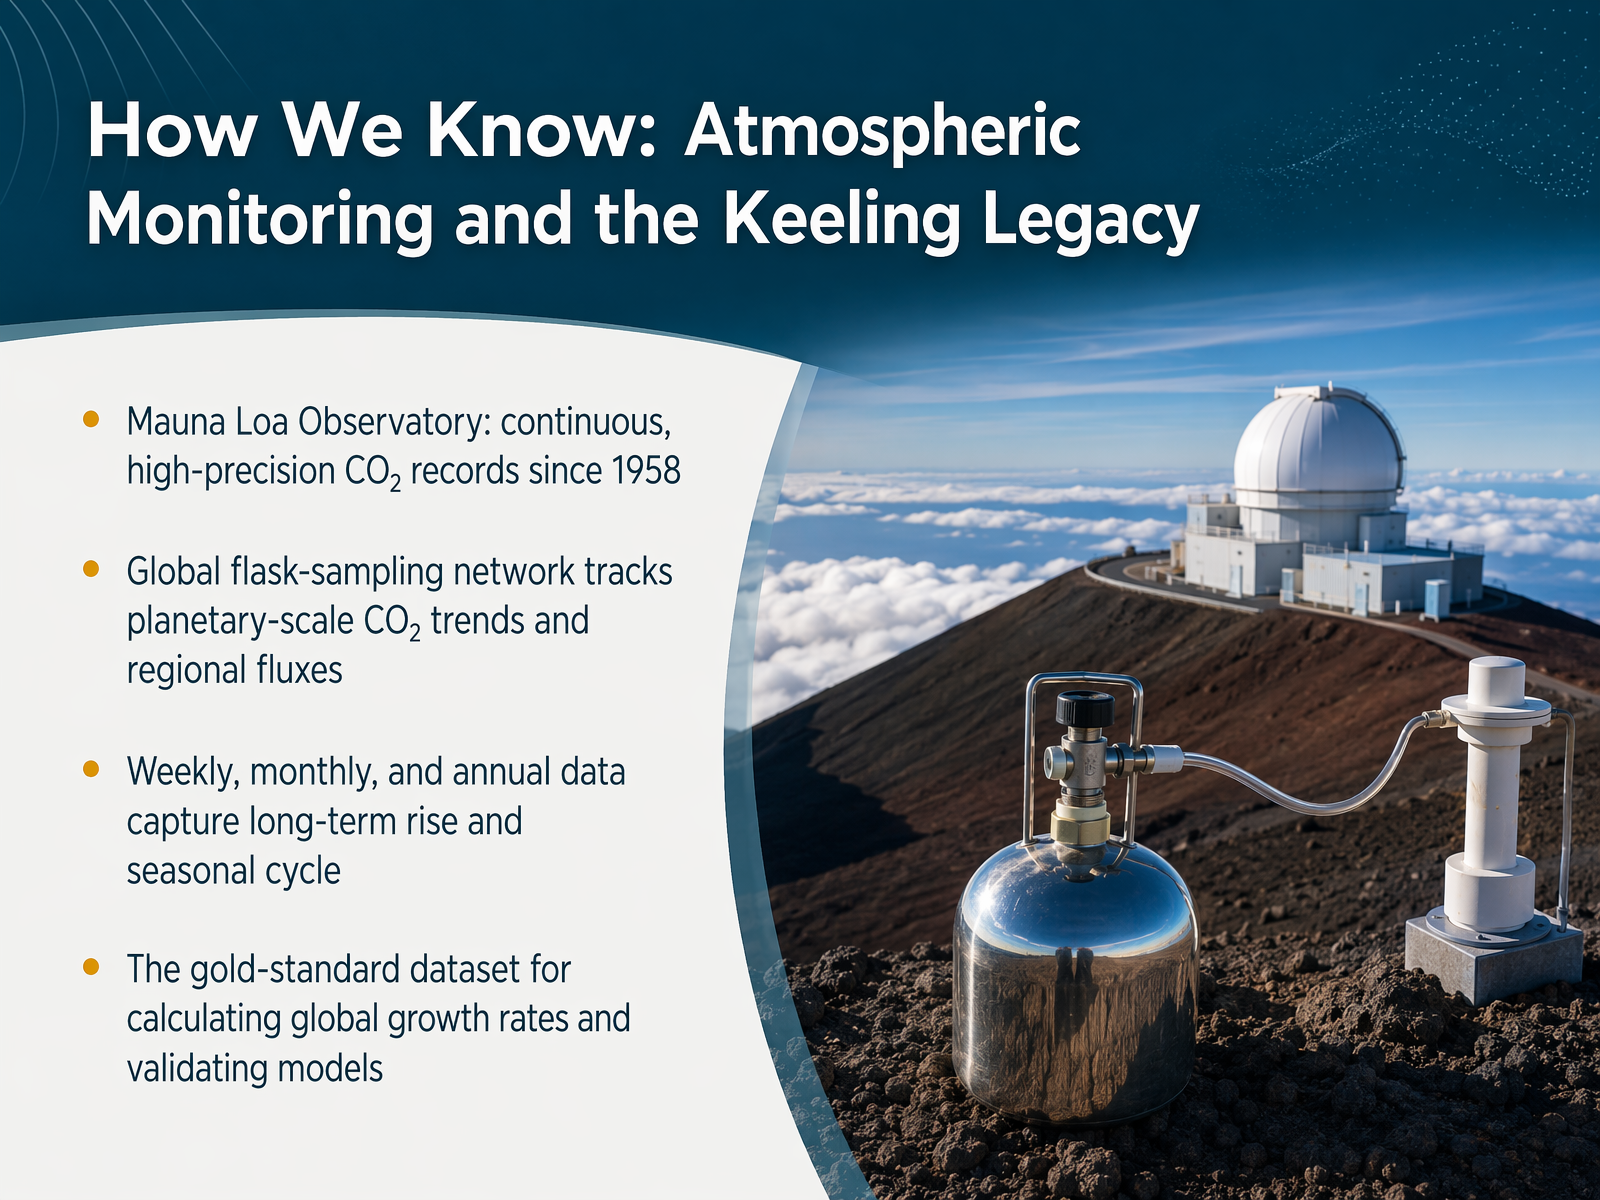
 - 11How We Know: Atmospheric Monitoring and the Keeling LegacyNow we turn to the question of how we actually know what carbon dioxide is doing in the atmosphere. The gold standard for this comes from a single observatory in Hawaii. In 1958, Charles David Keeling began continuous, high-precision CO2 measurements at the Mauna Loa Observatory, and that record continues today. It is the longest direct record we have, and the graph it produces is so famous it's called the Keeling Curve. The observatory sits at over eleven thousand feet elevation in the northern subtropics, which lets it sample well-mixed background air, not local pollution. What does the data show? A steady long-term rise, with June 2026 averaging 431.44 parts per million, up from 429.61 a year earlier. Layered on top of that rise is a regular seasonal cycle, a roughly six parts per million wiggle driven by the breathing of Northern Hemisphere forests. We also track CO2 on a global scale through a flask-sampling network that collects air at sites from the Arctic to the South Pole. Together, these weekly, monthly, and annual records give us the data we need to calculate global growth rates and to test whether our carbon cycle models are getting things right. Let's look next at how we extend this view far into the past with ice cores and satellites in "How We Know: Ice Cores, Satellites, and the View from Space."
 keelingcurve.ucsd.edugml.noaa.govkeelingcurve.ucsd.edu+22 min
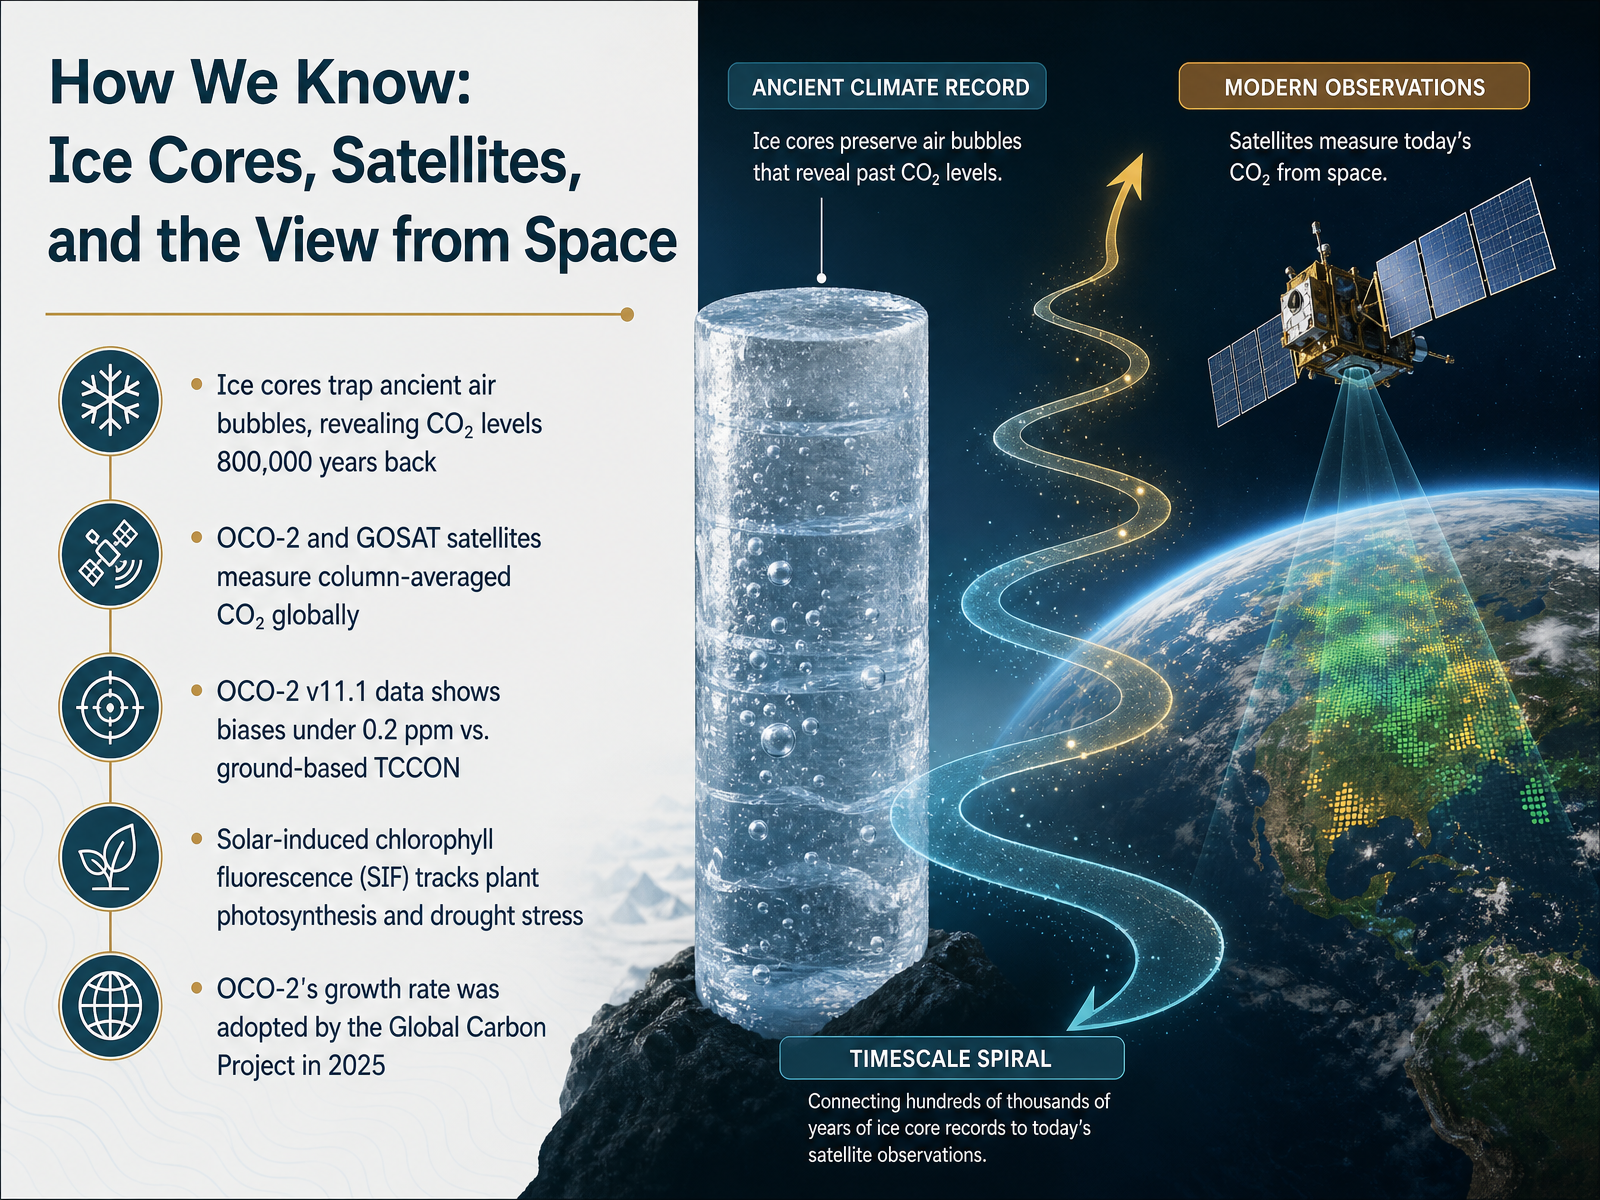
 - 12How We Know: Ice Cores, Satellites, and the View from SpaceSo how do we actually know what carbon dioxide levels were like before we started keeping direct records? We piece the story together from several powerful lines of evidence, from ancient ice to modern satellites. Let's start with ice cores. As snow compacts into glacial ice, tiny air bubbles get trapped inside. By drilling deep cores in places like Antarctica, we can extract those bubbles and directly measure the CO2 they hold. This gives us a record stretching back eight hundred thousand years. Now, to track carbon today, we turn to satellites. NASA's OCO-2 and Japan's GOSAT missions measure column-averaged CO2 across the entire planet. The latest OCO-2 data, version eleven point one, has been validated against a global ground-based network called TCCON. The results are impressive: biases are under zero point two parts per million globally, and over land the bias is just zero point zero three parts per million. That level of precision was recognized when the Global Carbon Project adopted the OCO-2 growth rate in its twenty twenty-five assessment. These satellites also capture solar-induced chlorophyll fluorescence, or SIF, which is essentially a glow that plants emit during photosynthesis. SIF helps us track where plants are thriving and where they are under drought stress, giving us a near real-time view of the biosphere's carbon uptake. Next, we'll explore how we bring all this data together into computer models to simulate the full carbon cycle.
 essd.copernicus.org2 min
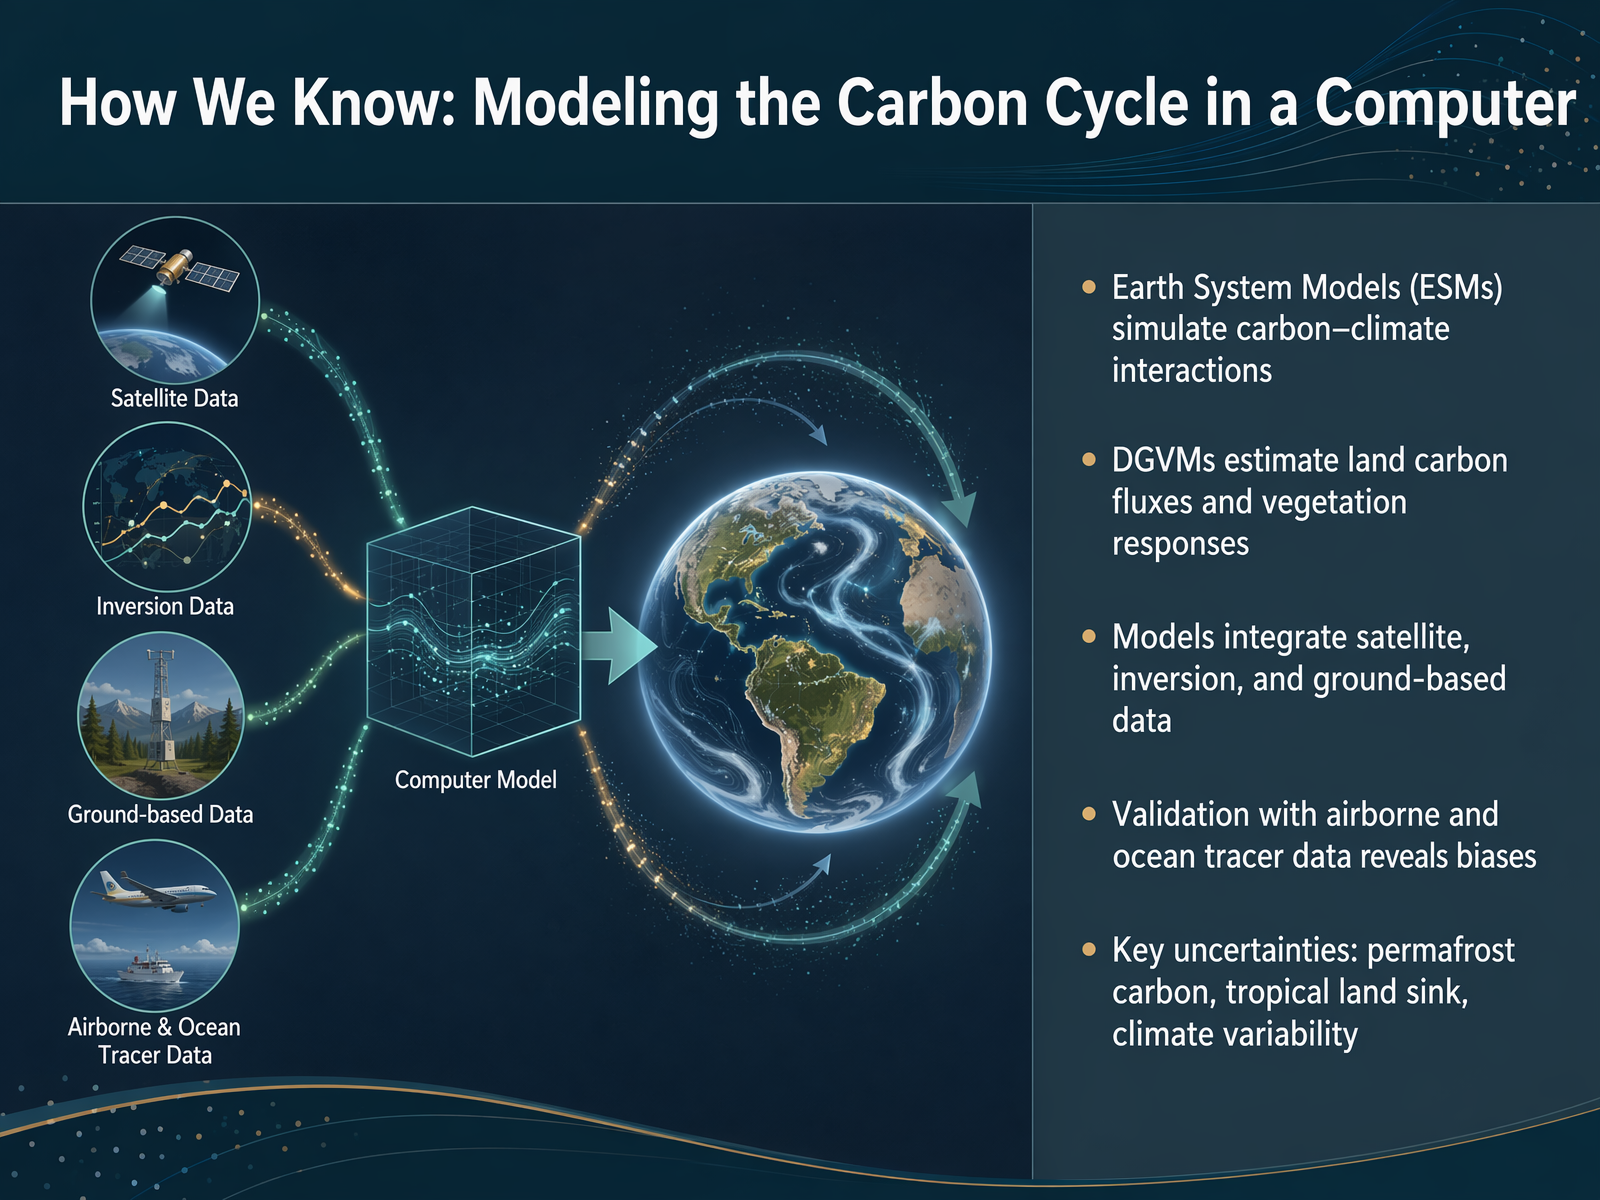
 - 13How We Know: Modeling the Carbon Cycle in a ComputerSo how do we actually know where the carbon is going? We rely on computer models. Earth system models, or ESMs, simulate the interactions between the carbon cycle and the climate. Within those, dynamic global vegetation models estimate land carbon fluxes and how vegetation might respond to change. These models aren't just guessing; they integrate real-world data from satellites, inversion studies, and ground-based stations. For example, NASA's OCO-2 satellite measures carbon dioxide from space with a proven bias of less than 0.2 parts per million globally. We then validate these models by comparing their output to independent airborne and ocean tracer measurements, which helps us identify and correct biases. Despite all this, significant uncertainties remain. Three of the biggest are the amount of carbon released from thawing permafrost, the strength of the tropical land carbon sink, and how natural climate variability influences year-to-year fluxes. Reducing these unknowns is a major focus of current research. Now, let's shift from how we track carbon to what we can do about it, in our next slide: Your Role in the Carbon Cycle.
 essd.copernicus.orgicos-cp.eupure.iiasa.ac.at+22 min
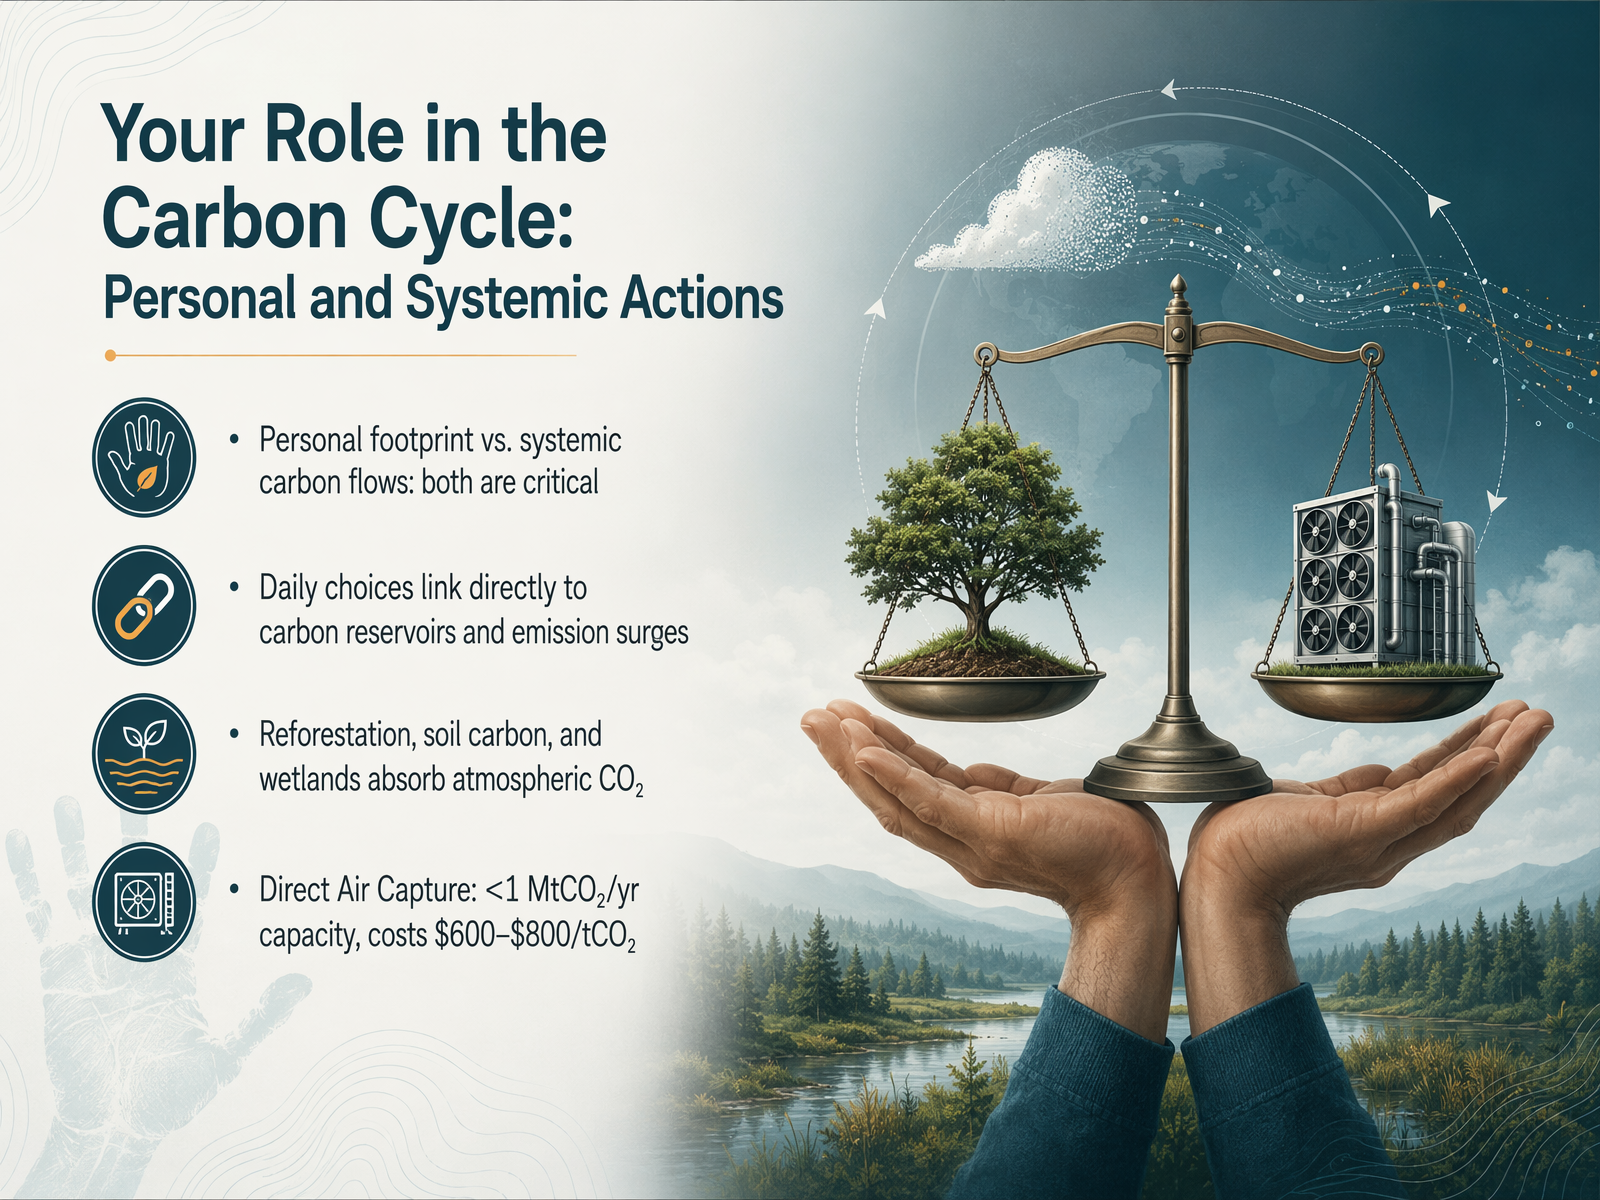
 - 14Your Role in the Carbon Cycle: Personal and Systemic ActionsWe have explored how carbon moves through massive planetary systems. Now let us bring it closer to home. Your personal carbon footprint and the huge systemic flows we have discussed are both critical parts of the same cycle. The daily choices you make, like what you eat, how you travel, and the energy you use, link directly to carbon reservoirs and can cause emission surges. But you also have a powerful role in strengthening natural sinks. Reforestation, protecting soil carbon, and restoring wetlands all pull carbon dioxide out of the atmosphere. These biological solutions are working for us right now. In contrast, engineered solutions like Direct Air Capture are still in their infancy. Current global capacity is less than one million metric tons of carbon dioxide per year, a tiny fraction of our emissions. The cost is also very high, ranging from six hundred to eight hundred dollars per ton of captured carbon dioxide. So, while we must invest in technology, we cannot rely on it yet. Your actions to protect and enhance the land and ocean sinks are the most immediate and impactful ways you participate in the global carbon cycle. Next, we will pull all these threads together and see the carbon cycle as a single connected system.
 essd.copernicus.orgcentaur.reading.ac.ukpar.nsf.gov+12 min
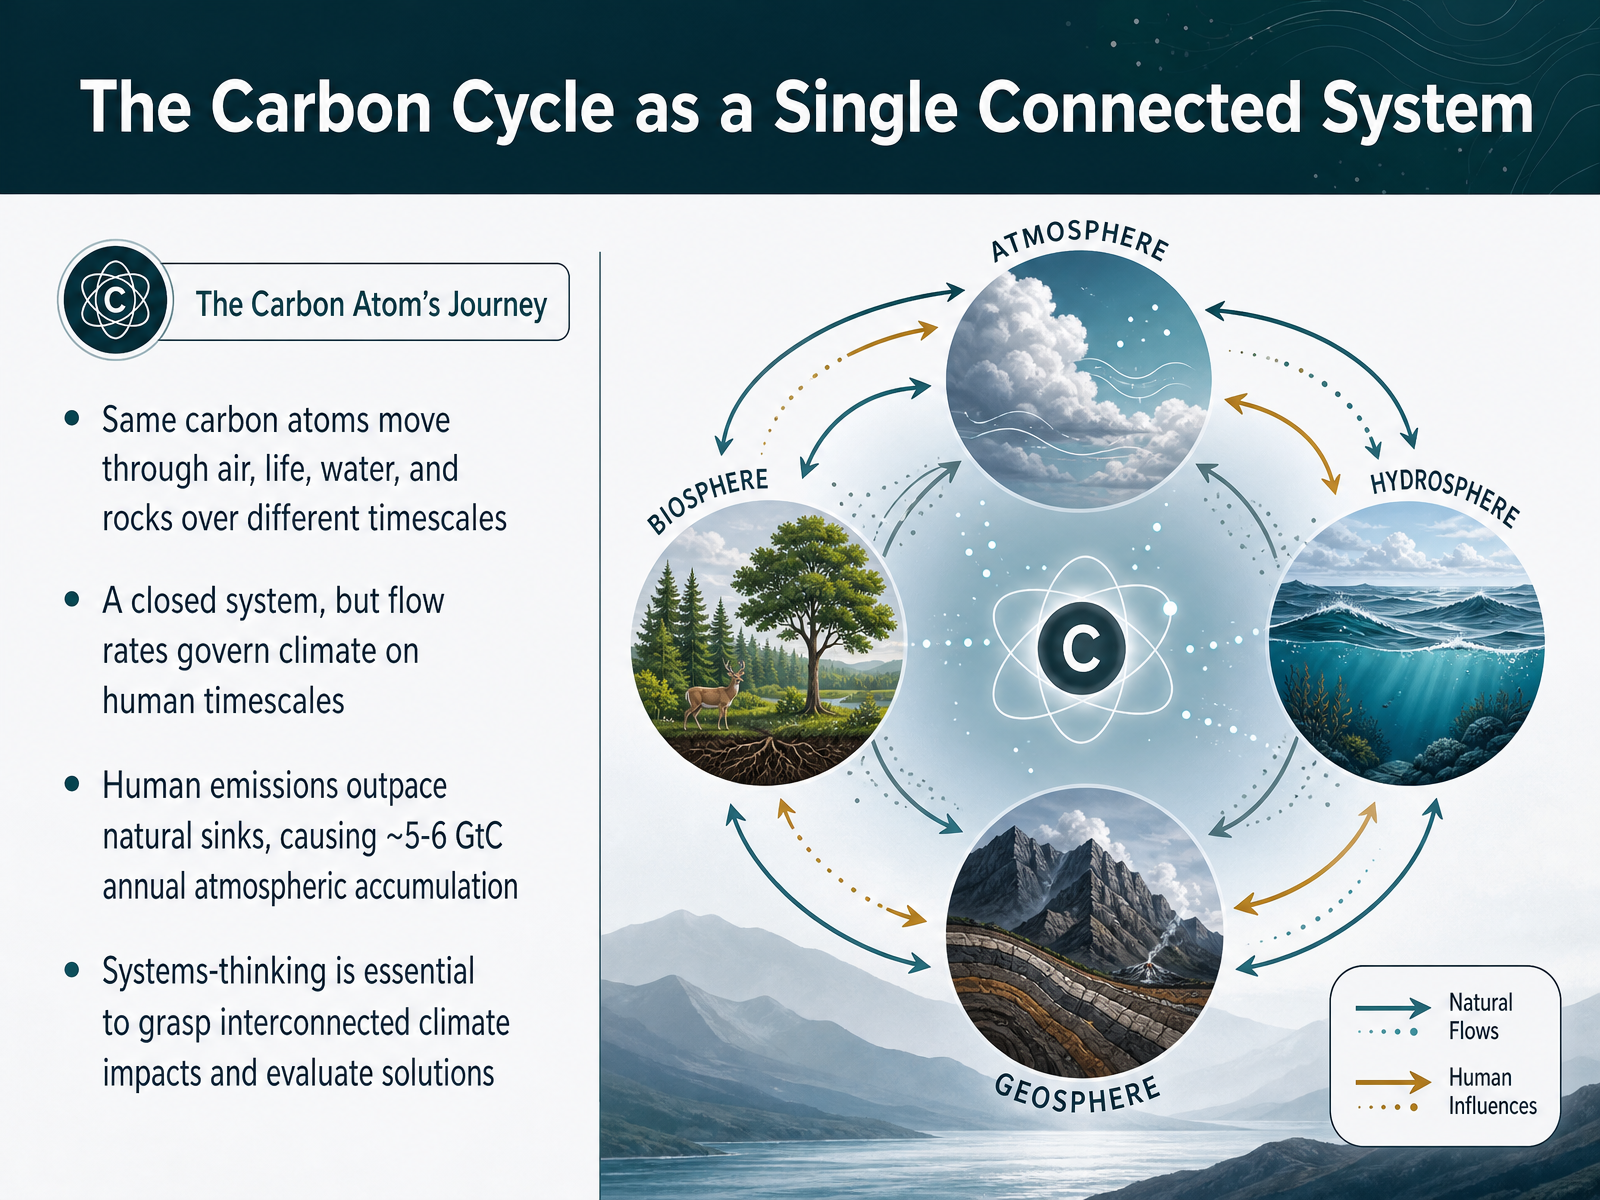
 - 15The Carbon Cycle as a Single Connected SystemNow let's pull all the pieces together and see the carbon cycle as a single connected system. The same carbon atoms are constantly moving—through the air, through living things, through the water, and through rocks—just on very different timescales. Some carbon cycles in days, some stays locked in rocks for millions of years. But the Earth as a whole is a closed system for carbon: the total amount stays the same, it just moves between reservoirs. What matters for climate on human timescales is the flow rates—how fast carbon moves from one reservoir to another. Right now, we're in a situation where human emissions are outpacing the natural sinks. Our fossil fuel emissions and land-use change put about eleven point six gigatons of carbon into the atmosphere every year. The ocean and land sinks together absorb only about half of that. The rest accumulates in the atmosphere—roughly five to six gigatons of carbon annually. That's the driver of rising carbon dioxide levels. Systems-thinking is what lets us connect these dots. When we see the carbon cycle as a whole, we can understand why climate impacts are interconnected, and we can evaluate solutions not just by their promise, but by how they actually shift the big carbon balance. This perspective is essential as we move into our final topic: applying carbon knowledge to science, policy, and personal decisions.
 essd.copernicus.orgcentaur.reading.ac.ukpar.nsf.gov+22 min
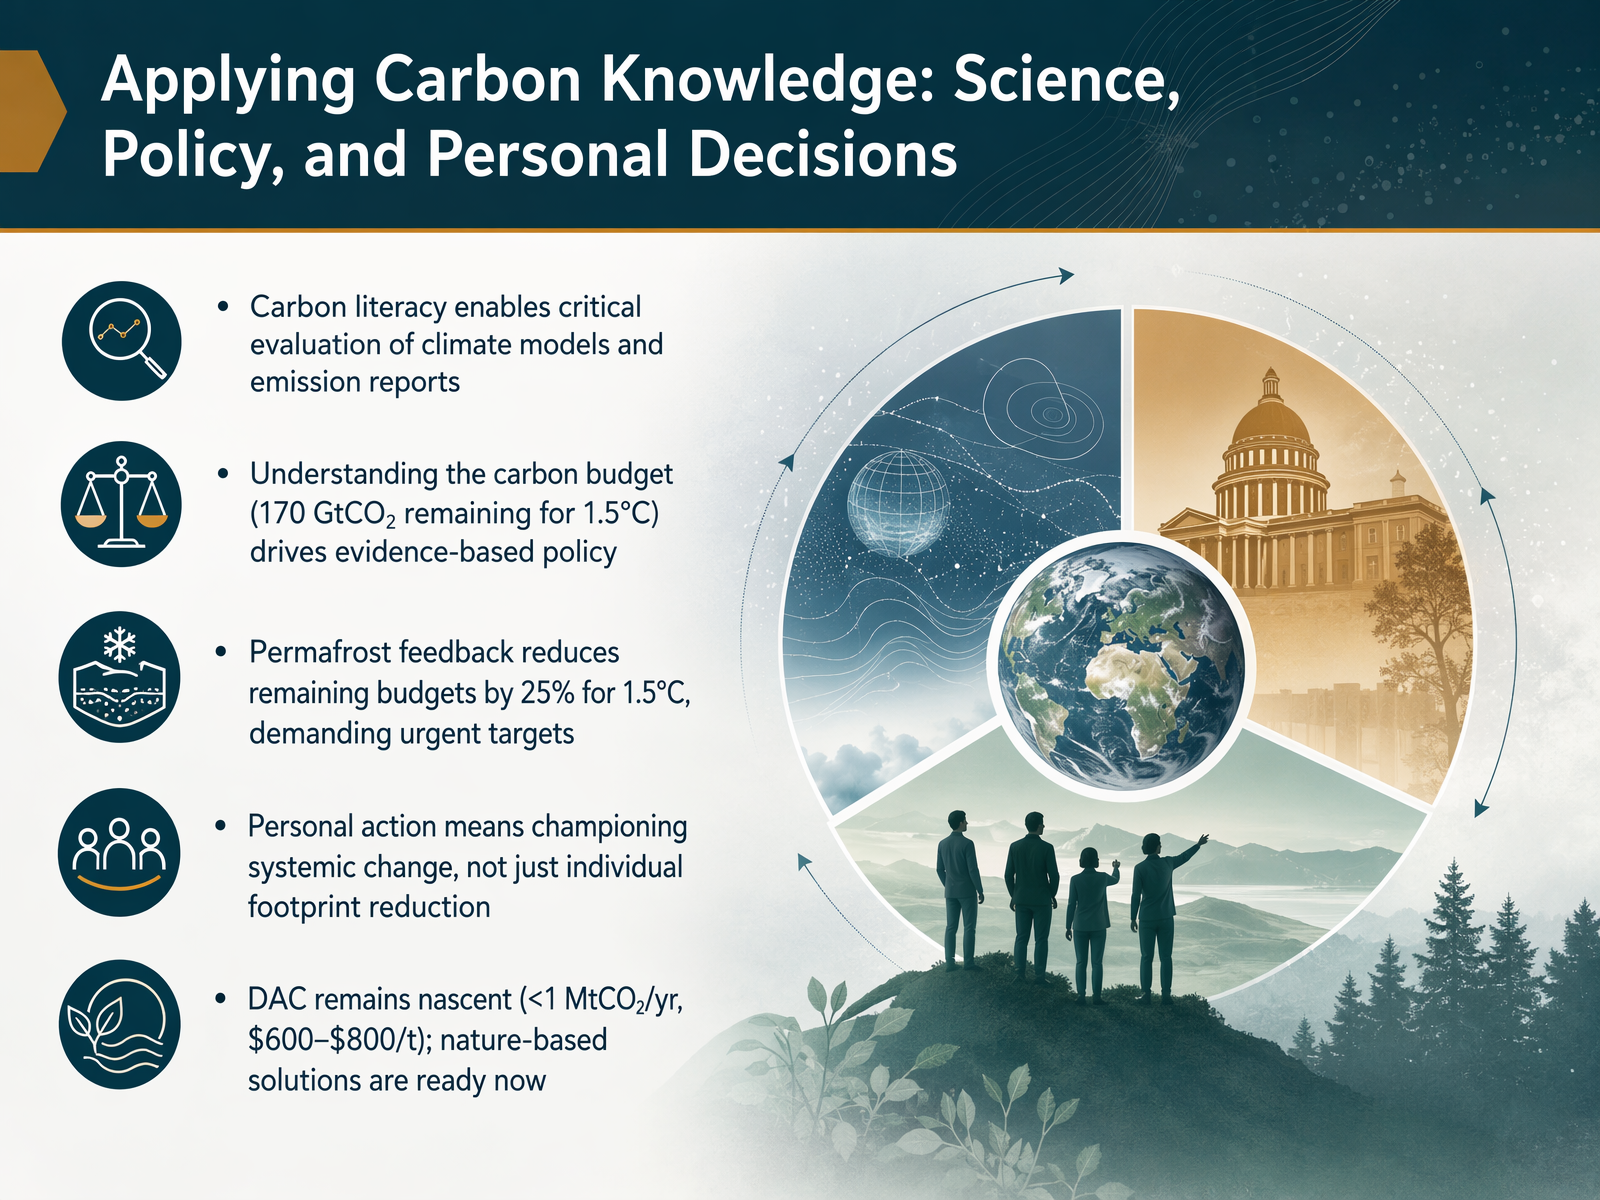
 - 16Applying Carbon Knowledge: Science, Policy, and Personal DecisionsAs we bring everything together, let's turn our carbon cycle knowledge into real-world action. First, the science: understanding reservoirs and fluxes lets us critically evaluate climate models and emission reports. When you see a headline about the carbon budget, you now know it refers to how much more carbon dioxide we can emit and still have a chance of limiting warming. That number for one point five degrees Celsius is about one hundred seventy billion tonnes of carbon dioxide, which is roughly four years of current emissions. But here is a crucial update—permafrost thaw and wildfires reduce that remaining budget by about twenty-five percent. The frozen ground is releasing carbon, and that makes the targets even more urgent. So what can we do? Personal action means championing systemic change, not just reducing your own footprint. Vote, advocate, and push for policies that decarbonize energy and land use. And while technologies like direct air capture are still in early stages, capturing less than one megatonne per year at costs of six hundred to eight hundred dollars per tonne, nature-based solutions like reforestation are ready and effective right now. Thank you for taking this journey through the carbon cycle. You now have the foundation to understand the science behind the headlines and to be a more informed voice for a sustainable future.
 essd.copernicus.orgcentaur.reading.ac.ukpar.nsf.gov+12 min
Take the deck with you
Download this course as a file — free, no sign-up needed.
- PDF handoutEvery slide page, ready to print or share.17 pages · 5.5 MBDownload
- Narrated PowerPointThe deck that presents itself — every slide carries the digital human's narration video.17 pages · 20.5 MBDownload
- PowerPoint slidesThe full deck as a .pptx — open it in PowerPoint, Keynote, or Google Slides.17 pages · 5.5 MBDownload
Free to use in your own training — please keep the PersonWise credit page at the end.
Have your own deck? Turn it into a course
Sources consulted
Web sources consulted while building this course.
- Data supplement to the Global Carbon Budget 2025 | ICOS — icos-cp.eu
- ESSD - Global Carbon Budget 2025 — essd.copernicus.org
- Global Carbon Budget 2025 — pure.iiasa.ac.at
- Global carbon budget 2025 — centaur.reading.ac.uk
- Global Carbon Budget 2025 | NSF Public Access Repository — par.nsf.gov
- Carbon Cycle — pmel.noaa.gov
- MATH APPLICATION ACTIVITY: THE GLOBAL CARBON BUDGET — gml.noaa.gov
- MATH APPLICATION ACTIVITY: THE GLOBAL CARBON BUDGET — gml.noaa.gov
- OCADS - NDP-045 - Background Information — ncei.noaa.gov
- Why are Seasonal CO2 Fluctuations Strongest at Northern ... — keelingcurve.ucsd.edu
- THE CHANGING CARBON CYCLE AT MAUNA LOA OBSERVATORY — gml.noaa.gov
- The Keeling Curve — keelingcurve.ucsd.edu
- Causes of slowing‐down seasonal CO2 amplitude at Mauna Loa — doi.org
- Enhanced seasonal CO2 exchange caused by amplified plant productivity in northern ecosystems | Science — science.org
- Carbonation and the Urey reaction — doi.org
- Frontiers | On the Role of the Urey Reaction in Extracting Carbon From the Earth's Atmosphere and Adding It to the Continental Crust — frontiersin.org
- Evolution of the Global Carbon Cycle and Climate Regulation on Earth — agupubs.onlinelibrary.wiley.com
- Carbonation and decarbonation reactions: Implications for planetary habitability — minsocam.org
- Silicate weathering as a feedback and forcing in Earth's climate and carbon cycle — sciencedirect.com
- BG - Marine snow morphology drives sinking and attenuation in the ocean interior — bg.copernicus.org