Begin
14 pages · ~28 min
Becoming a Business Intelligence Analyst: Practical Workflow
This training guides aspiring business intelligence analysts through a practical end-to-end workflow, from data preparation to reporting and insights delivery.
A digital instructor presents all 14 pages. Hold “Ask” at any point and ask out loud — the answer comes from this course. No sign-up needed.
What you’ll learn
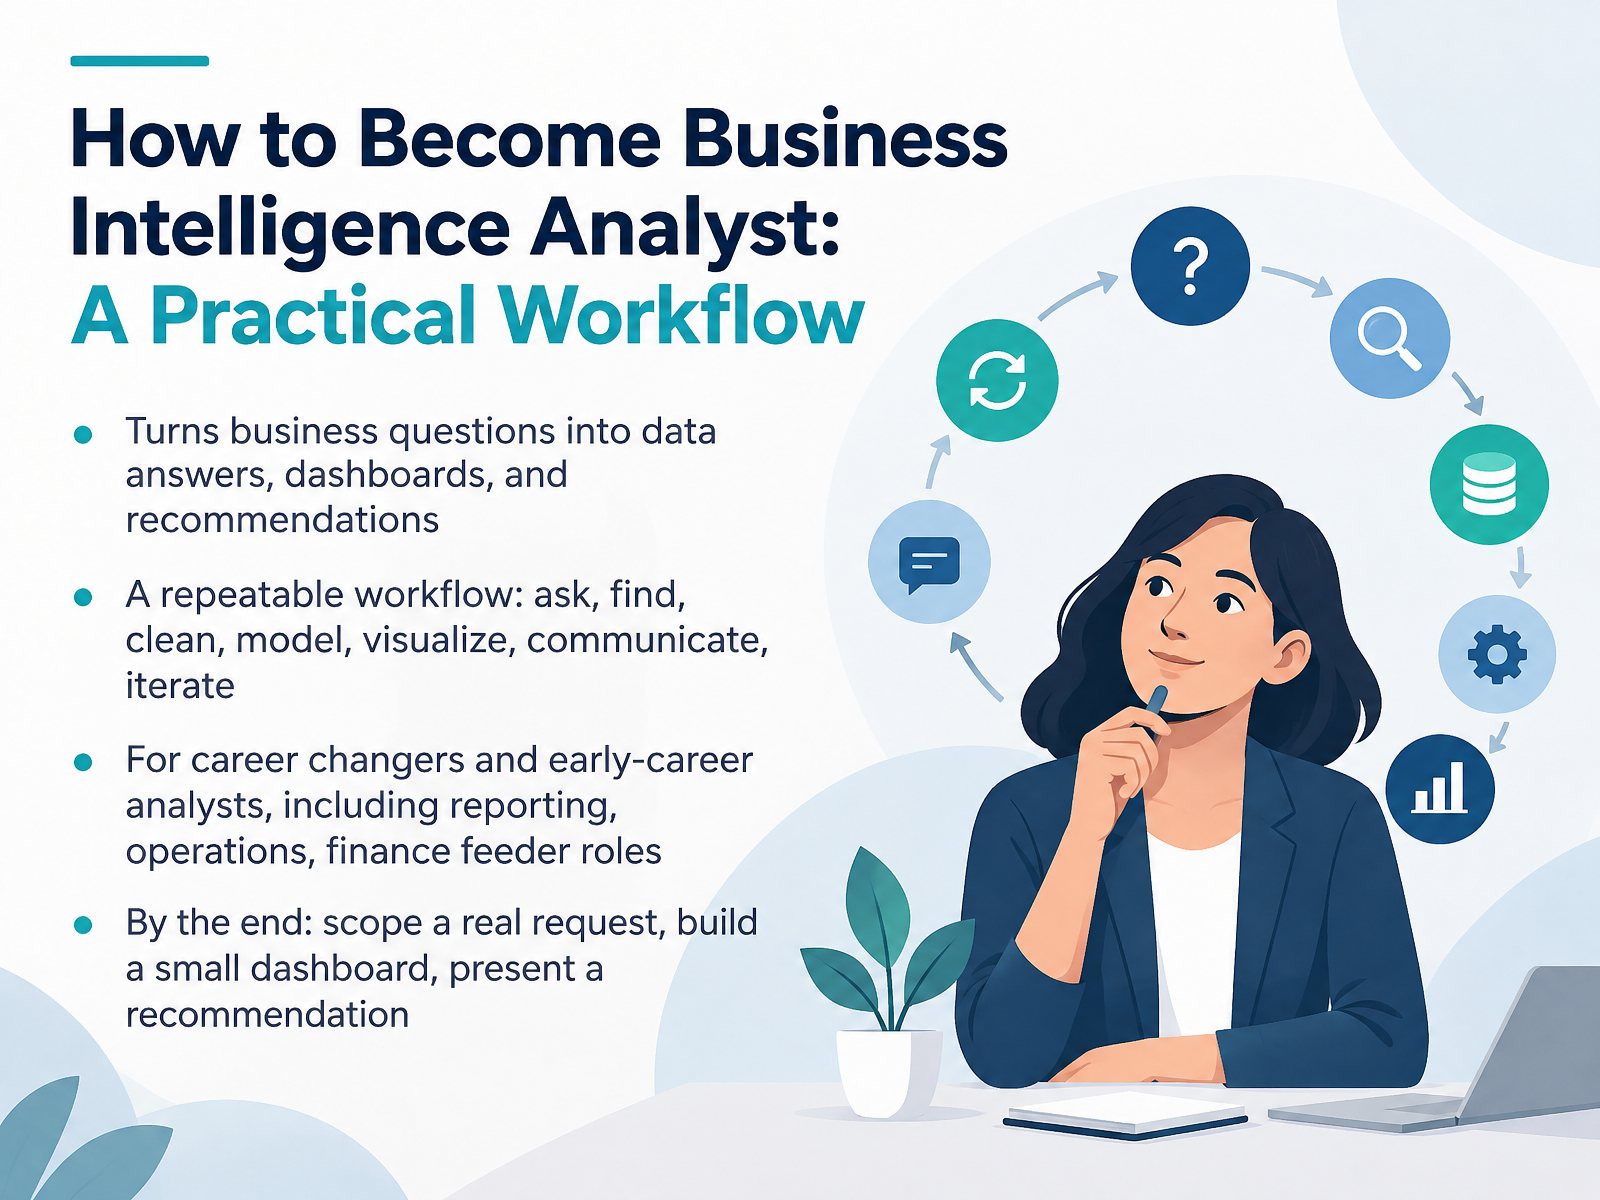
- 01How to Become Business Intelligence Analyst: A Practical WorkflowWelcome. I'm glad you're here. This course is for career changers and early-career analysts who want a clear, practical path into business intelligence. So let's start with what the job actually is. A business intelligence analyst, or BI analyst, turns business questions into data answers, dashboards, and recommendations that leaders use to make decisions. That might mean explaining why revenue dipped last quarter, not just showing a chart. The work follows a repeatable workflow: ask, find, clean, model, visualize, communicate, and iterate. You'll practice each step in order. Many people enter this role from reporting, operations, or finance, and those skills transfer directly. By the end of this course, you'll be able to scope a real request, build a small dashboard, and present a recommendation. Next, let's look at what the role really involves.resources.rework.comuk.indeed.comjobs.boeing.com+22 min
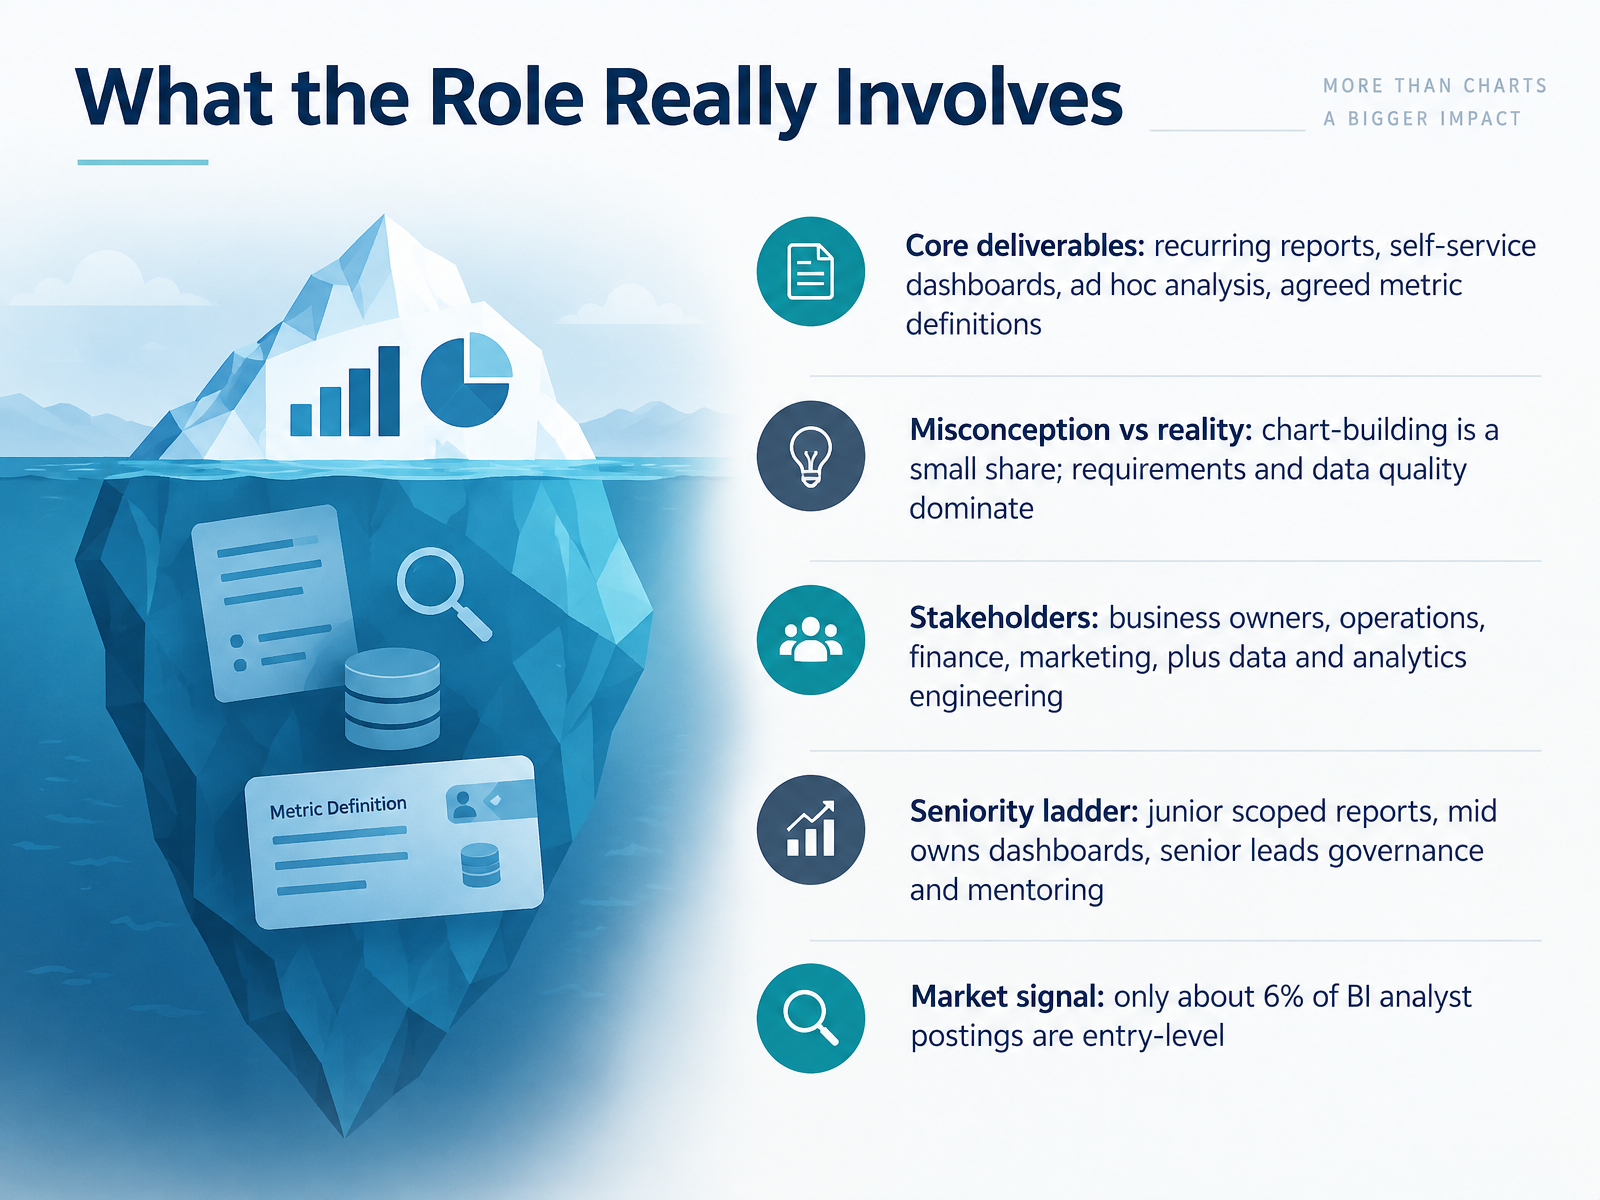
- 02What the Role Really InvolvesNow let's look at what the role really involves, beyond the job title. The core deliverables are recurring reports, self-service dashboards, ad hoc analysis, and agreed metric definitions. Metric definitions simply mean one shared, written rule for how a number is calculated, so finance and marketing stop comparing different revenue totals. Here's a common misconception. Chart-building is only a small share of the work. Requirements gathering and data quality take up most of your week. You'll partner with business owners in operations, finance, and marketing, plus data and analytics engineers. The seniority ladder is pretty clear. Juniors build scoped reports, mid-level analysts own dashboards, and seniors lead governance and mentor others. And one market signal matters: only about six percent of BI analyst postings are entry-level. So target junior titles and build evidence of real dashboards. Next, we'll compare this role with close neighbors: BI Analyst, Data Analyst, or Analytics Engineer?
 resources.rework.comuk.indeed.comjobs.boeing.com+22 min
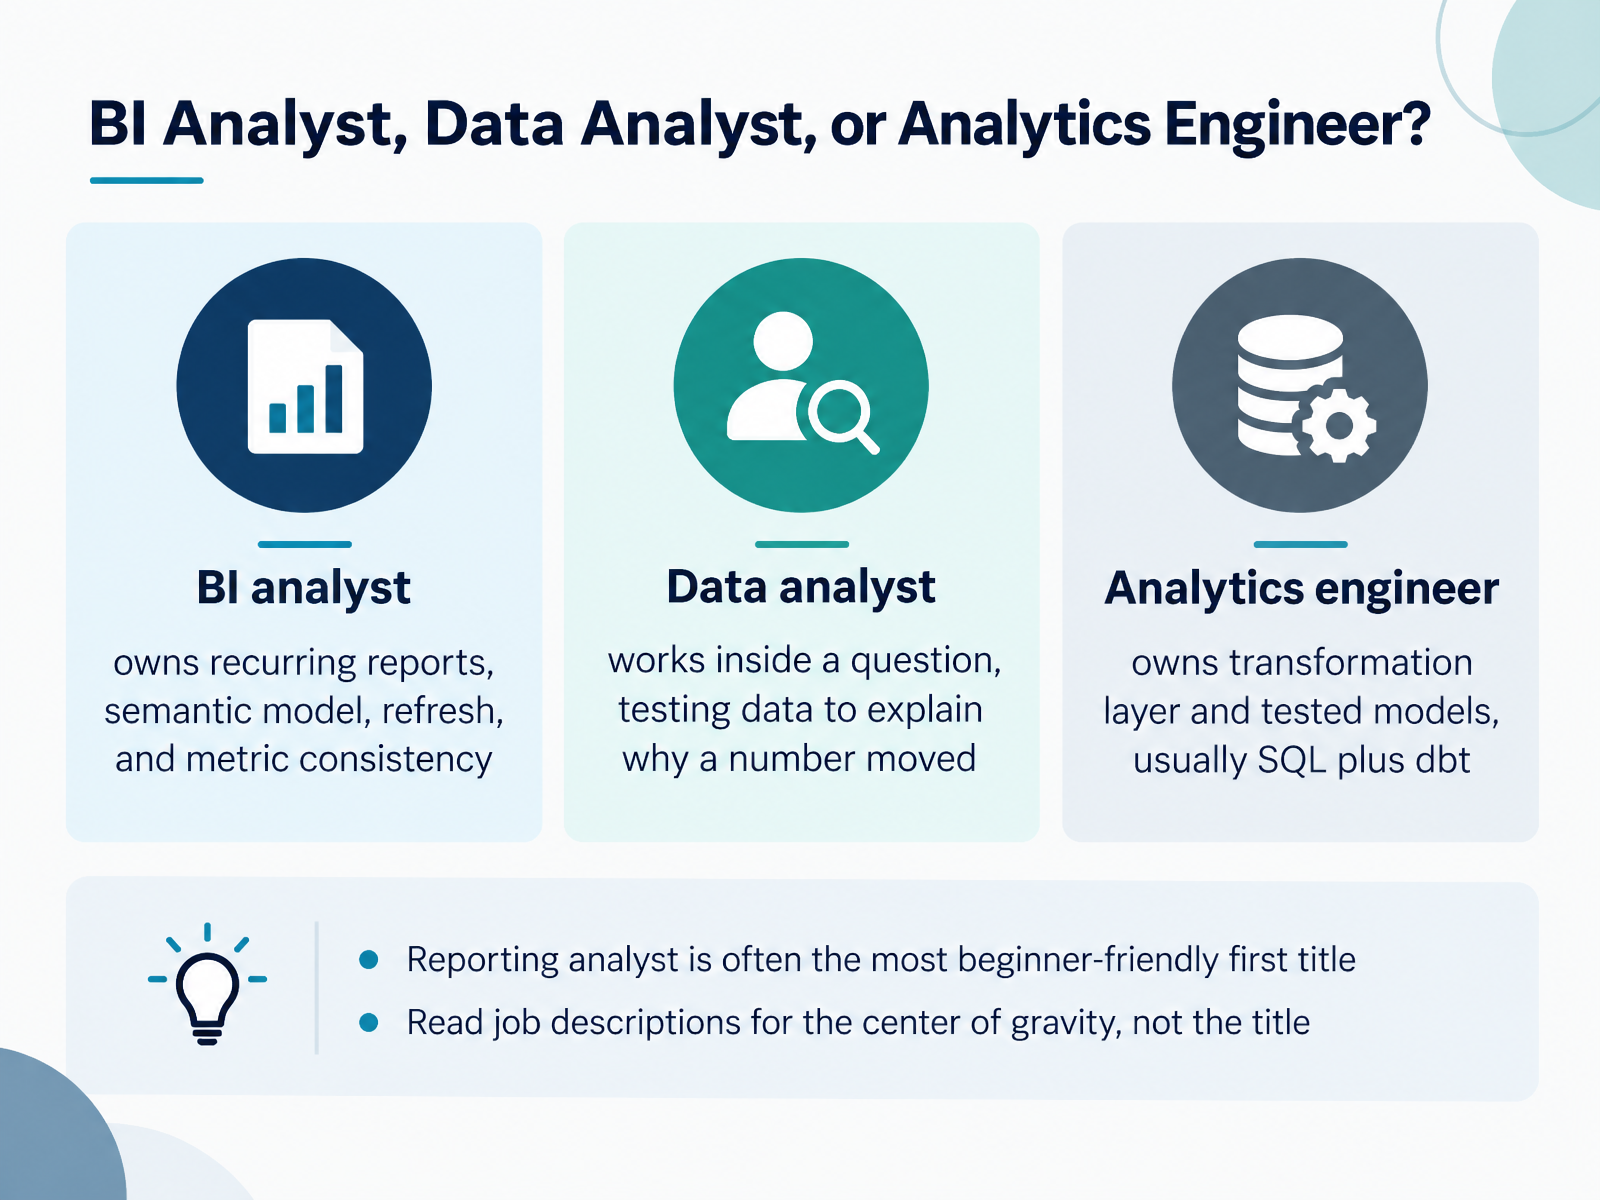
- 03BI Analyst, Data Analyst, or Analytics Engineer?Let's clear up the titles. A BI analyst owns the recurring reports, the semantic model, the refresh schedule, and metric consistency. A data analyst works inside a question, testing data to explain why a number moved. An analytics engineer owns the transformation layer and tested models, usually SQL plus dbt, a tool for building and testing those models. Don't assume a title tells you everything. Reporting analyst is often the most beginner-friendly first title. So read job descriptions for the center of gravity, meaning where the work actually sits. Next, we'll look at core skills and the 2026 tool landscape.
 snowflake.comdatagalaxy.comsdsmt.edu+21 min
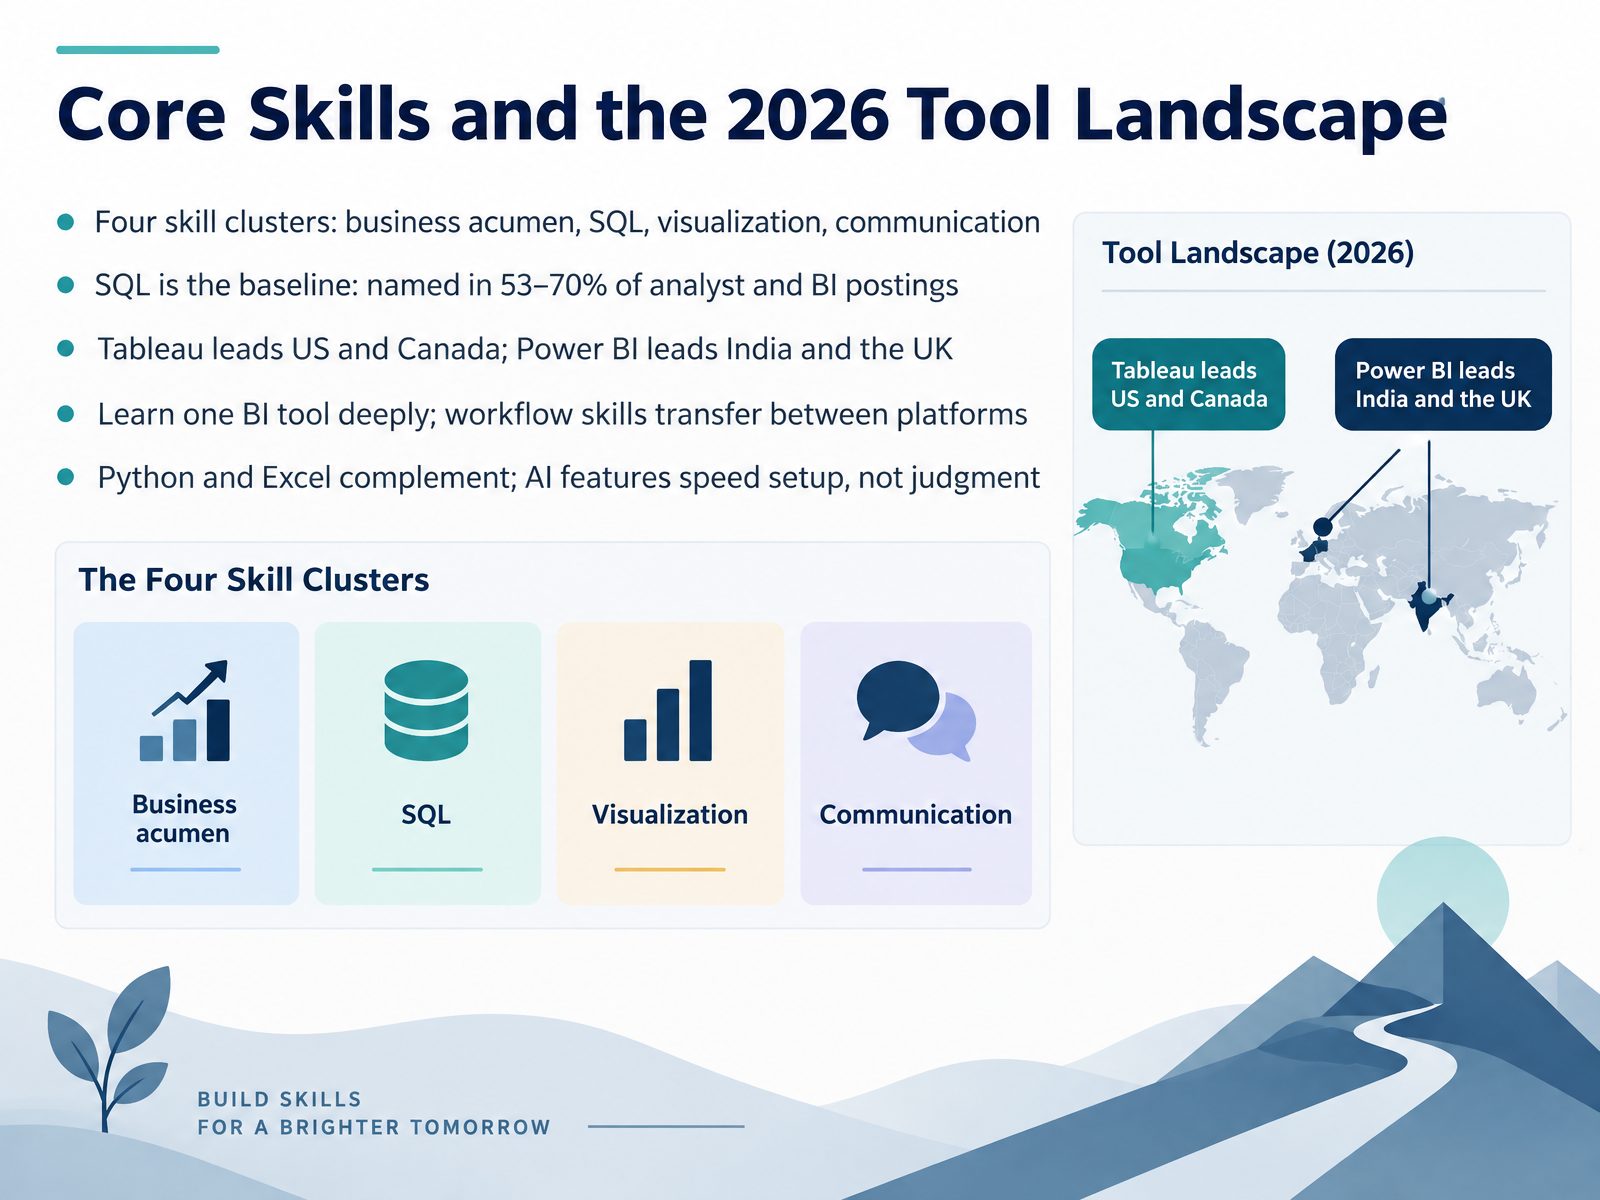
- 04Core Skills and the 2026 Tool LandscapeNow let's look at the skills employers actually ask for. There are four clusters. Business acumen, which means understanding how a company makes money. SQL, the language you use to pull data from databases. Visualization, turning data into charts people can read. And communication, explaining what the numbers mean. SQL is the baseline. Across studies of analyst and BI postings, it shows up in roughly fifty-three to seventy percent of listings. That's more than any single charting tool. Speaking of tools, demand shifts by region. Tableau leads in the United States and Canada, while Power BI leads in India and the United Kingdom. So check your target market before you commit. Here's the key move. Learn one tool deeply. Workflow skills like cleaning data and designing a dashboard transfer between platforms. Python and Excel round out your toolkit, and AI features can speed up setup, but they don't replace your judgment. Next, we start the workflow itself, with step one: ask the right business question.
 rolivajobs.comrealanalystjobs.comskillenai.com+21 min
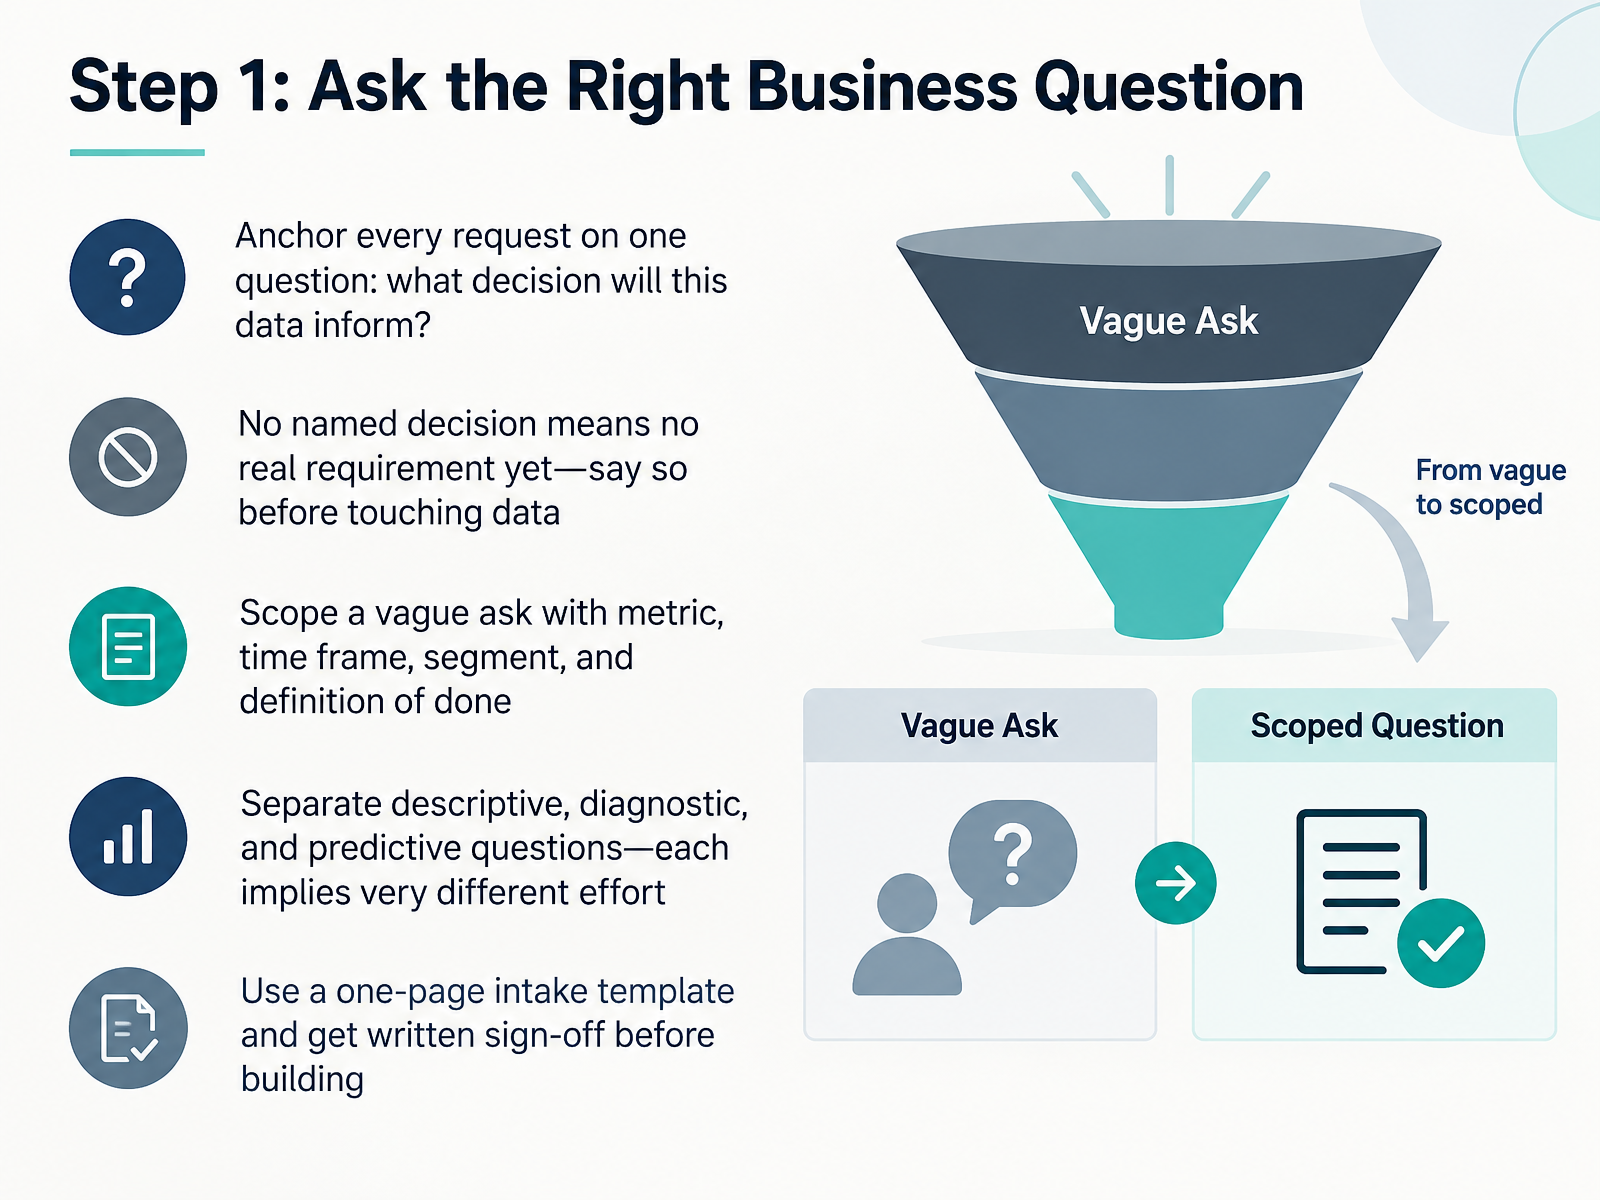
- 05Step 1: Ask the Right Business QuestionNow that you know the workflow, here is where every real project starts: asking the right business question. Anchor every request on one question. What decision will this data inform? If no one can name a decision, there is no real requirement yet, and you should say so before touching any data. Vague asks like show me sales are common, so scope them with four things: the metric, the time frame, the segment, and a definition of done. Also separate descriptive, diagnostic, and predictive questions, because each implies very different effort. Descriptive asks what happened. Diagnostic asks why. Predictive asks what is likely to come next. Finally, capture it all in a one-page intake template, and get written sign-off before you build. That single page protects you from days of work on the wrong thing. Next, we will walk through a scoped request and see how this intake looks in practice, in Intake in Practice: A Scoped Request Walkthrough.
 erickohlenberg.comgithub.cominforms.org+21 min
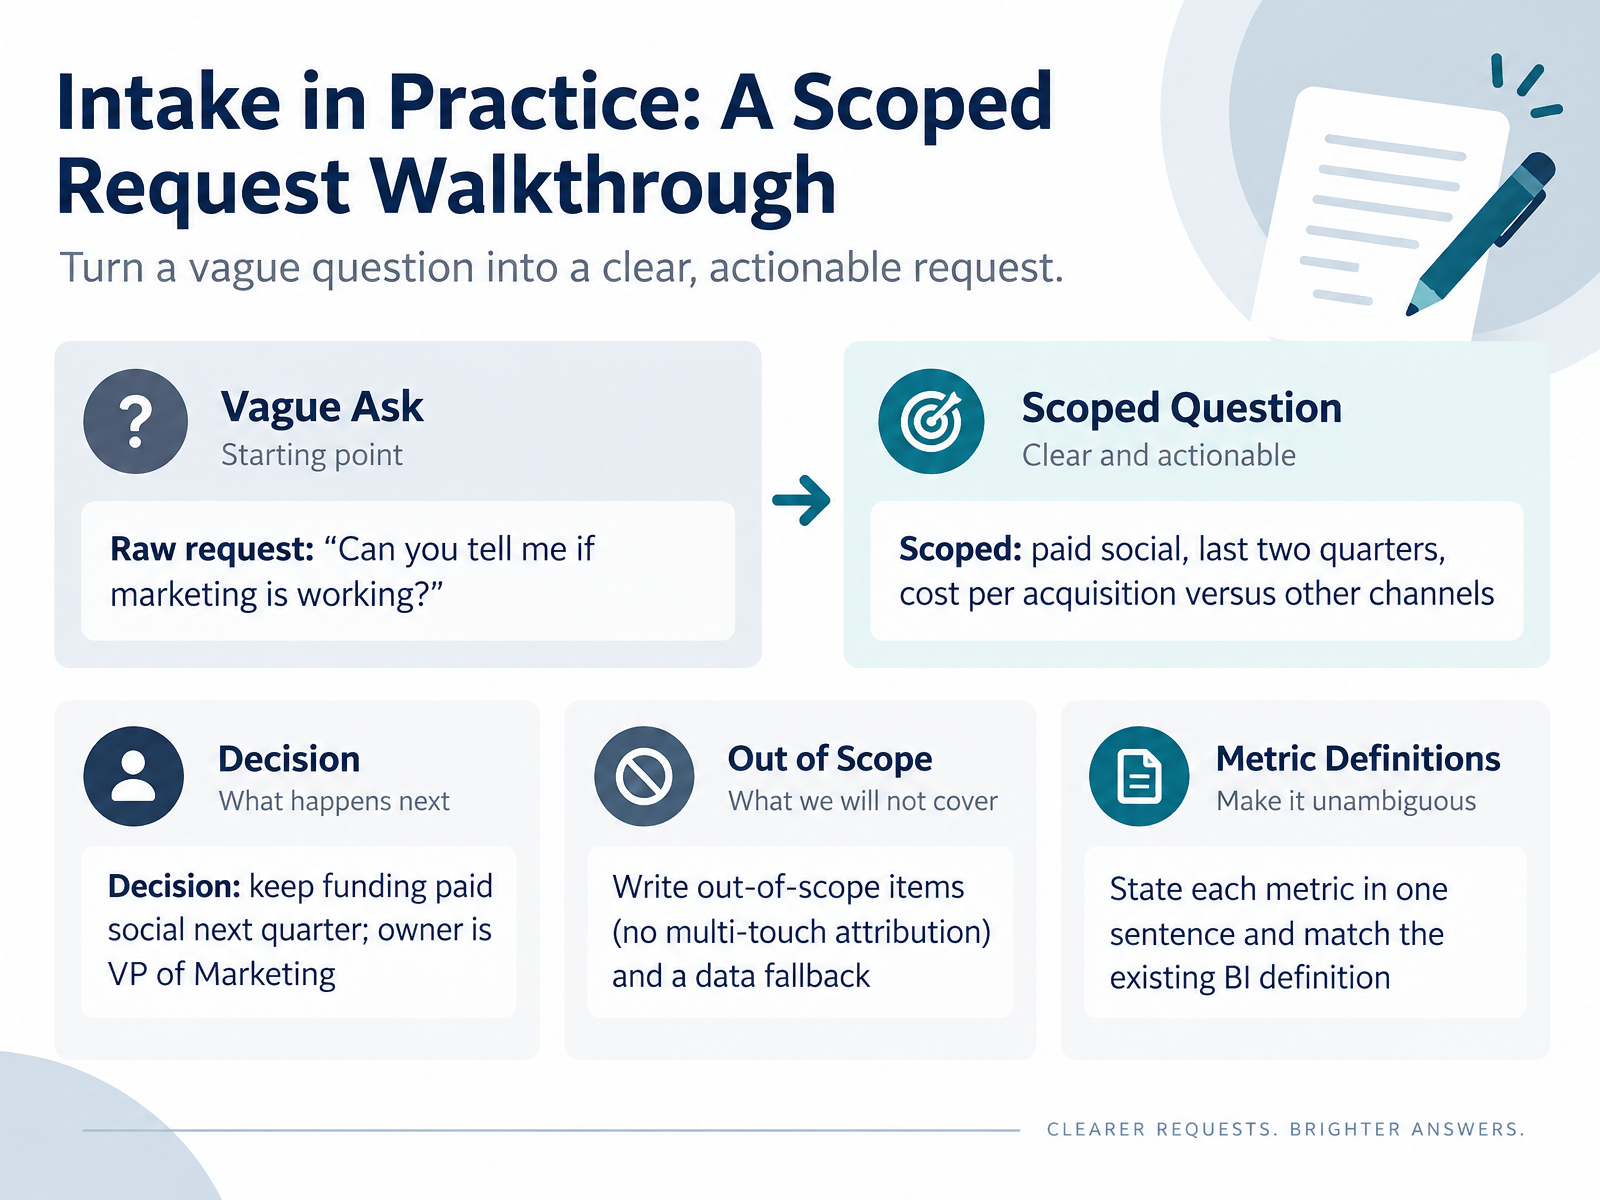
- 06Intake in Practice: A Scoped Request WalkthroughNow let's put intake into practice with a scoped request walkthrough. A stakeholder sends a raw request: can you tell me if marketing is working? That's too vague to build on. So you narrow it down. You ask which channel, which time period, and which comparison. The scoped question becomes: for paid social over the last two quarters, what is cost per acquisition, and how does it compare to our other channels? Cost per acquisition is the average spend to gain one customer. Next, name the decision. Here, it's whether to keep funding paid social next quarter, and the owner is the VP of Marketing. Then write down what's out of scope, such as no multi-touch attribution this round. Add a fallback: if channel-level spend is unreliable, report blended cost per acquisition and flag the gap. Finally, state each metric in one sentence, and match the existing BI definition so your numbers agree with everyone else's. That written scope protects you from building the wrong thing. Next, Step 2: Find and Validate the Data.
 erickohlenberg.comgithub.cominforms.org+22 min
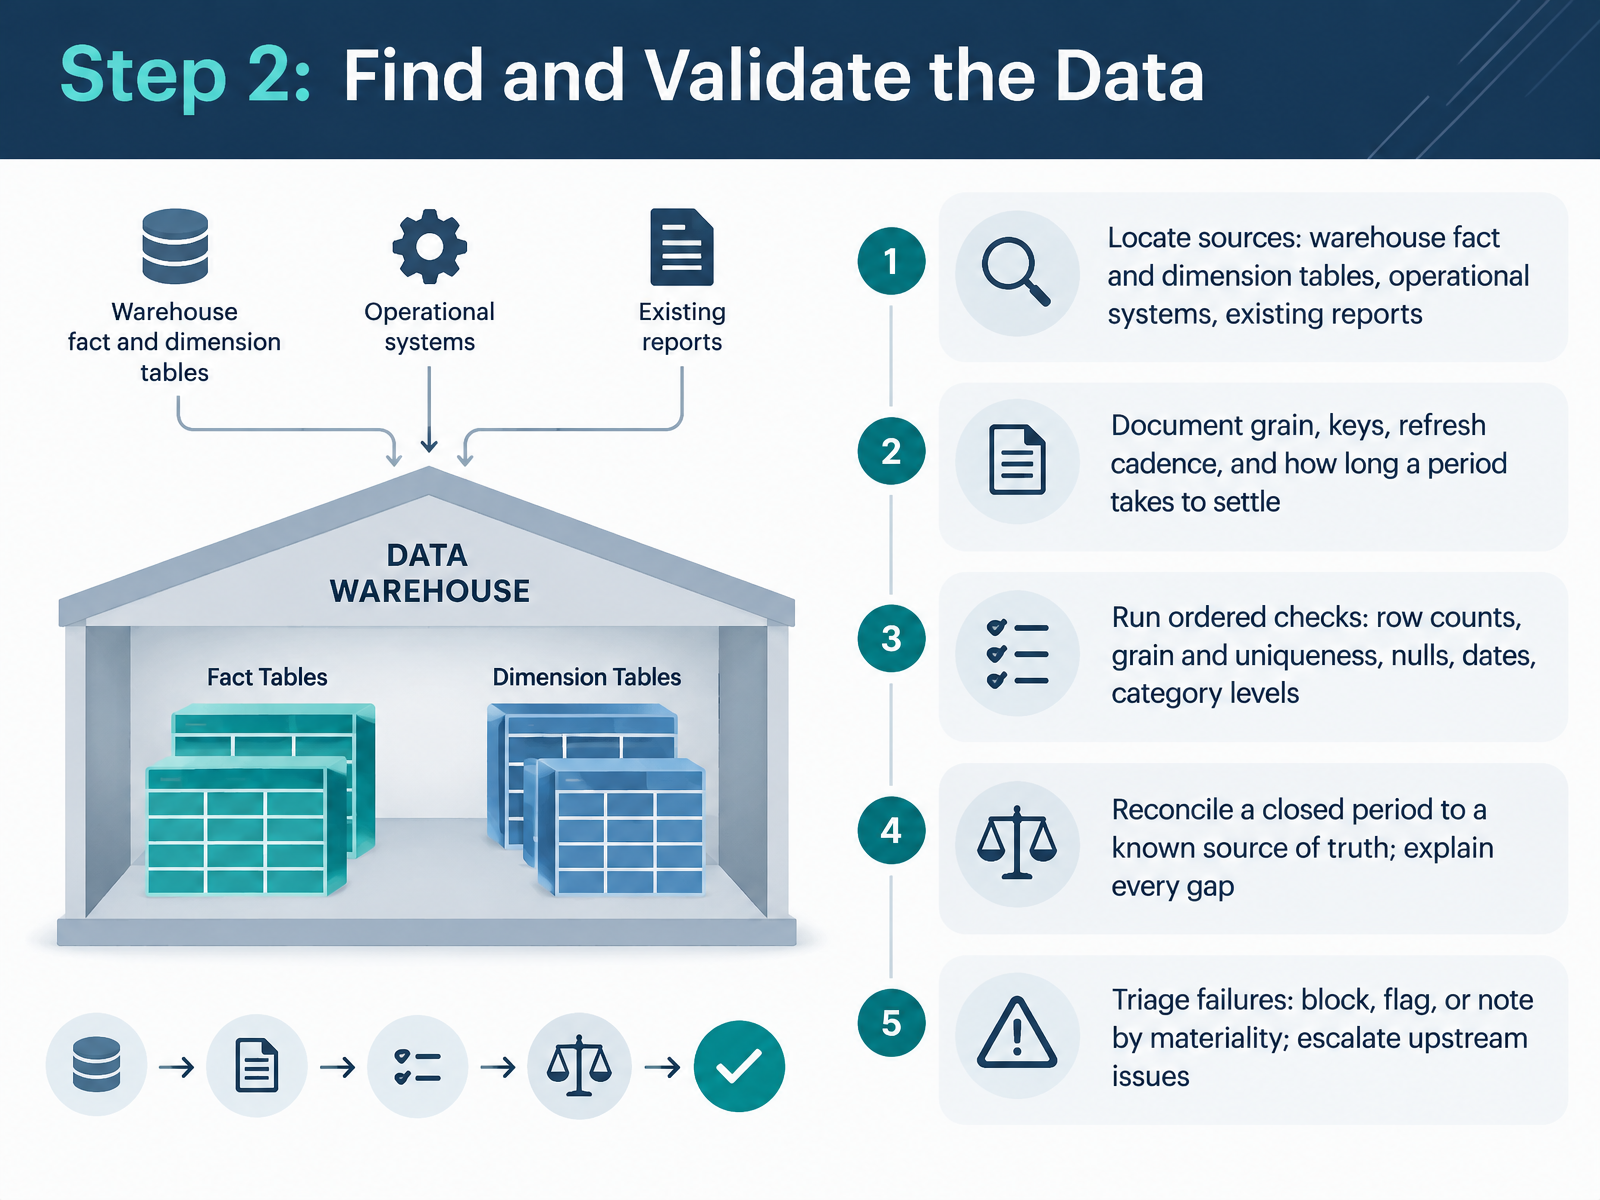
- 07Step 2: Find and Validate the DataNow that you have your business question, the next step is finding and validating the data. First, locate your sources. That means warehouse fact and dimension tables, operational systems, and existing reports. A fact table holds measurable events, like sales. A dimension table holds the descriptive context, like customer or product. Next, document four things for each source: the grain, meaning what one row represents; the keys that identify a row; the refresh cadence; and how long a period takes to settle before its numbers stop changing. Then run ordered checks. Start with row counts. Then grain and uniqueness, because a broken grain silently multiplies your totals. Then nulls, dates, and category levels. Finally, reconcile a closed period to a known source of truth, and explain every gap. When a check fails, triage it. Block if the defect could change the answer, flag it if it affects only a bounded slice, or note it if it is immaterial. Escalate upstream issues rather than fixing them silently. Next, Step 3: Clean and Prepare Data Reproducibly.
 2 min
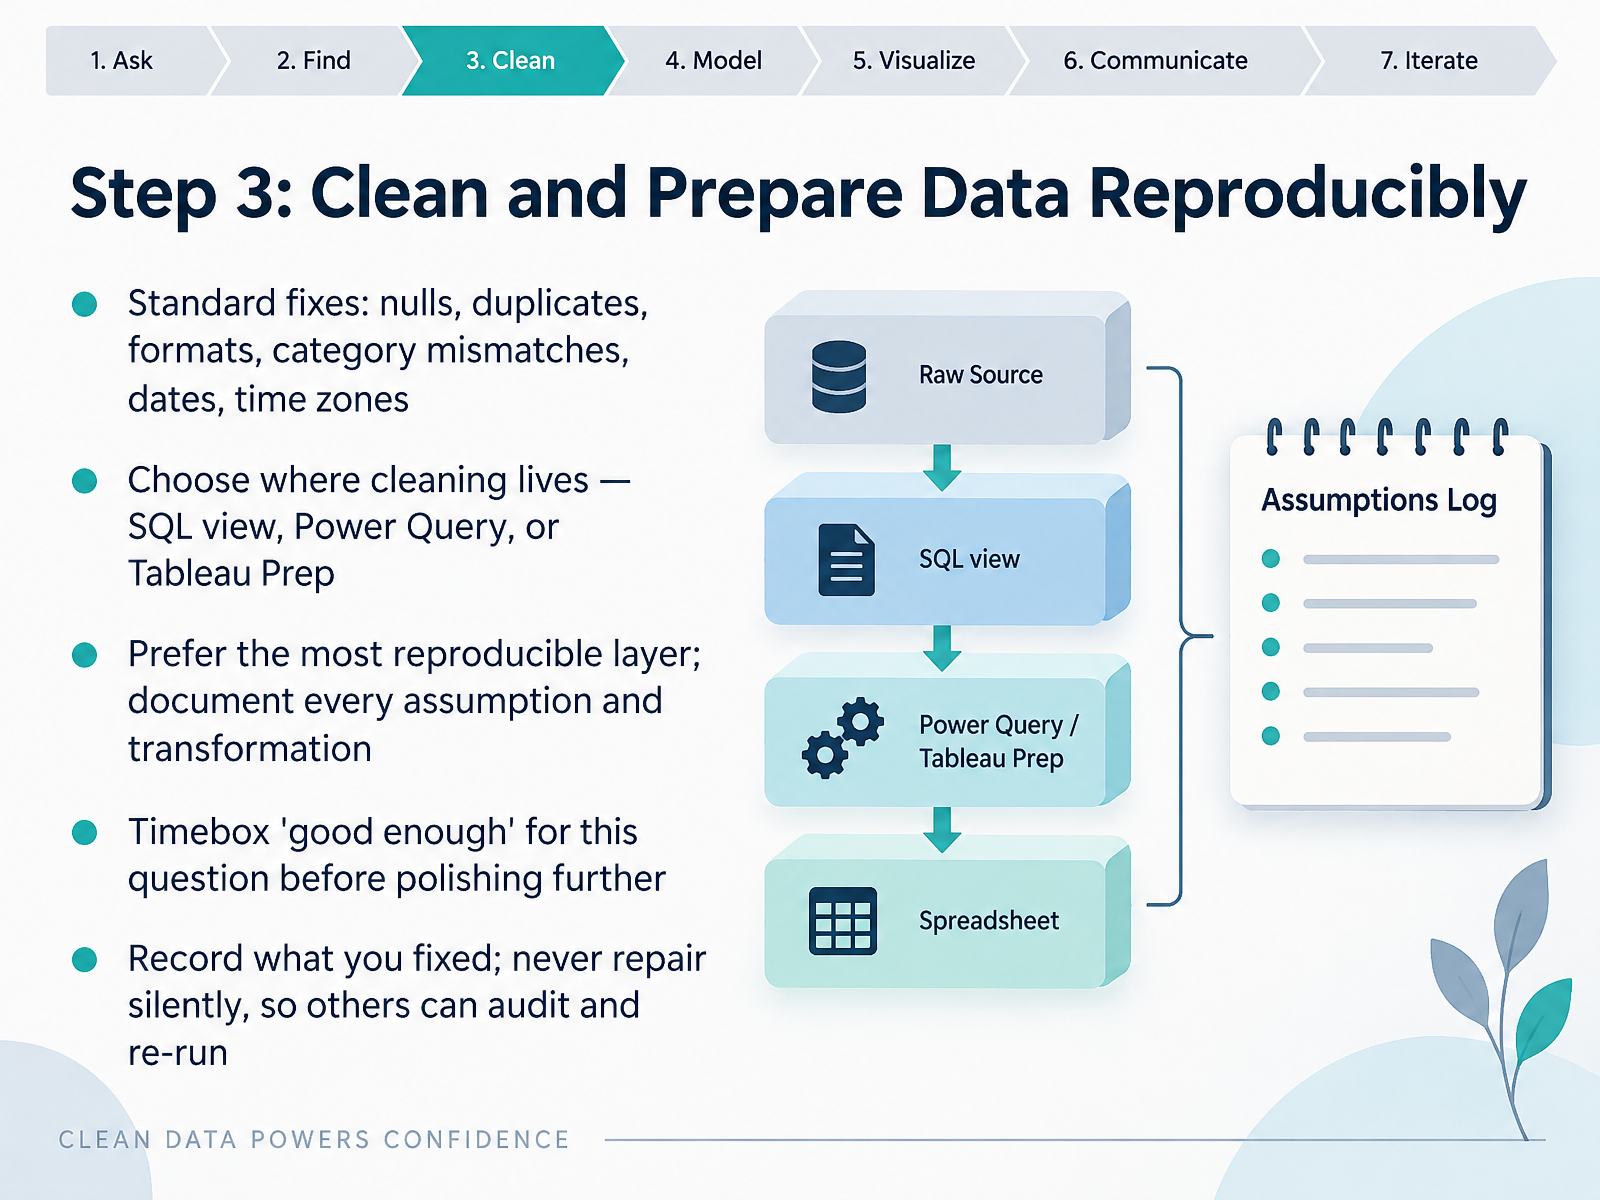
- 08Step 3: Clean and Prepare Data ReproduciblyNow let's clean and prepare the data, and do it in a way you can reproduce. First, run the standard fixes and check for nulls, which are missing values, duplicates, inconsistent formats, mismatched categories, and date or time zone issues. These checks happen before any analysis, because problems here flow straight into your results. Next, decide where the cleaning lives. You can build it into a SQL view, a Power Query step, or Tableau Prep. Whenever you can, choose the most reproducible layer, so the same steps run again without manual fixes. Then document every assumption and every transformation. Timebox yourself on good enough for this question before you polish further. And always record what you changed. Never repair data silently, because a quiet fix is invisible to the next analyst, and you two will get different numbers from the same table. With clean, documented data, you are ready for Step 4: Model and Build the Dashboard.
 2 min
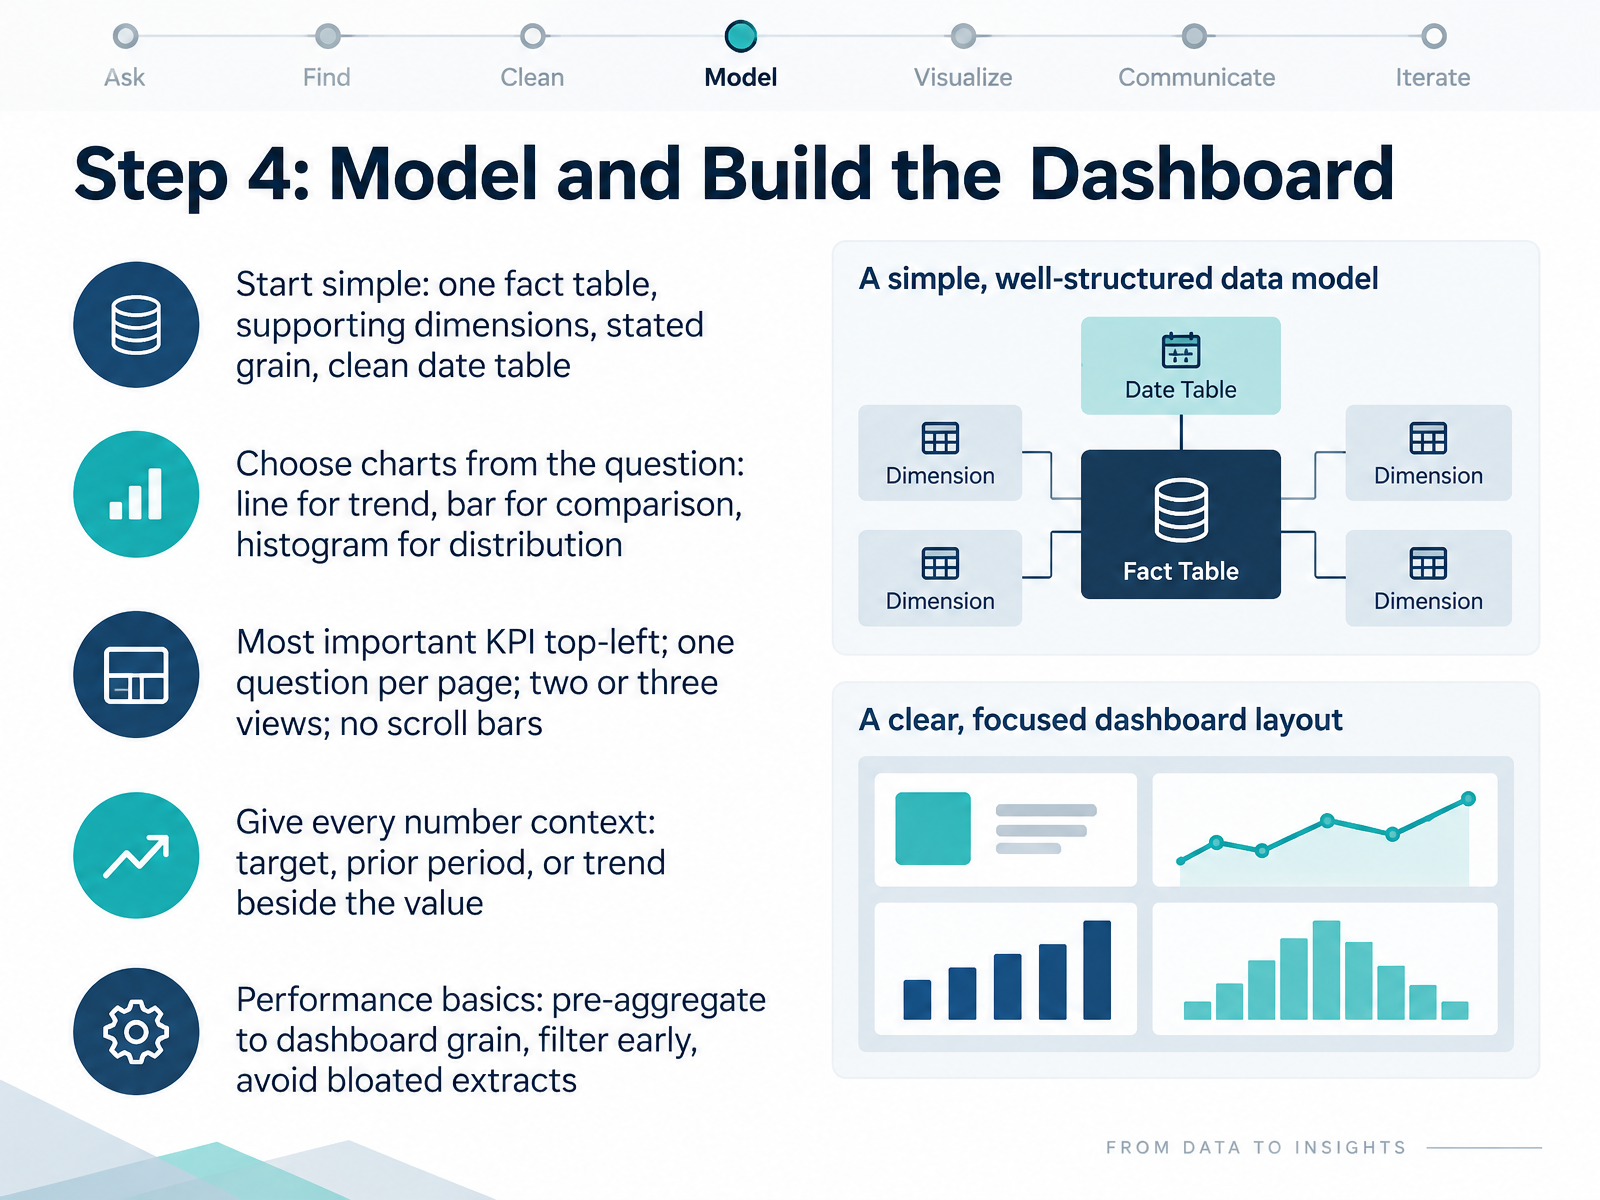
- 09Step 4: Model and Build the DashboardNow let's move from the data model into the dashboard itself, with step four, model and build the dashboard.
Start simple. Build one fact table that holds your measurable events, like sales, plus the supporting dimension tables, like product and region. State the grain clearly, meaning what one row represents, for example one row per order line. And always include a clean, complete date table.
Next, choose charts from the question, not from what looks nice. A line chart shows trend over time. A bar chart compares categories. A histogram shows how values are distributed.
On layout, put your most important KPI in the top left, where eyes land first. Keep one question per page, use two or three views, and avoid scroll bars so everything fits on one screen.
Give every number context. Show a target, a prior period, or a trend line beside the value, so forty-five becomes forty-five against a target of fifty, up twelve percent from last month.
For performance, pre-aggregate to the dashboard grain, filter early in the query, and avoid bloated extracts that slow everything down. Get it working, then refine.
That finished dashboard is only useful if people act on it. So next, we look at step five, communicate findings and drive decisions.
 2 min
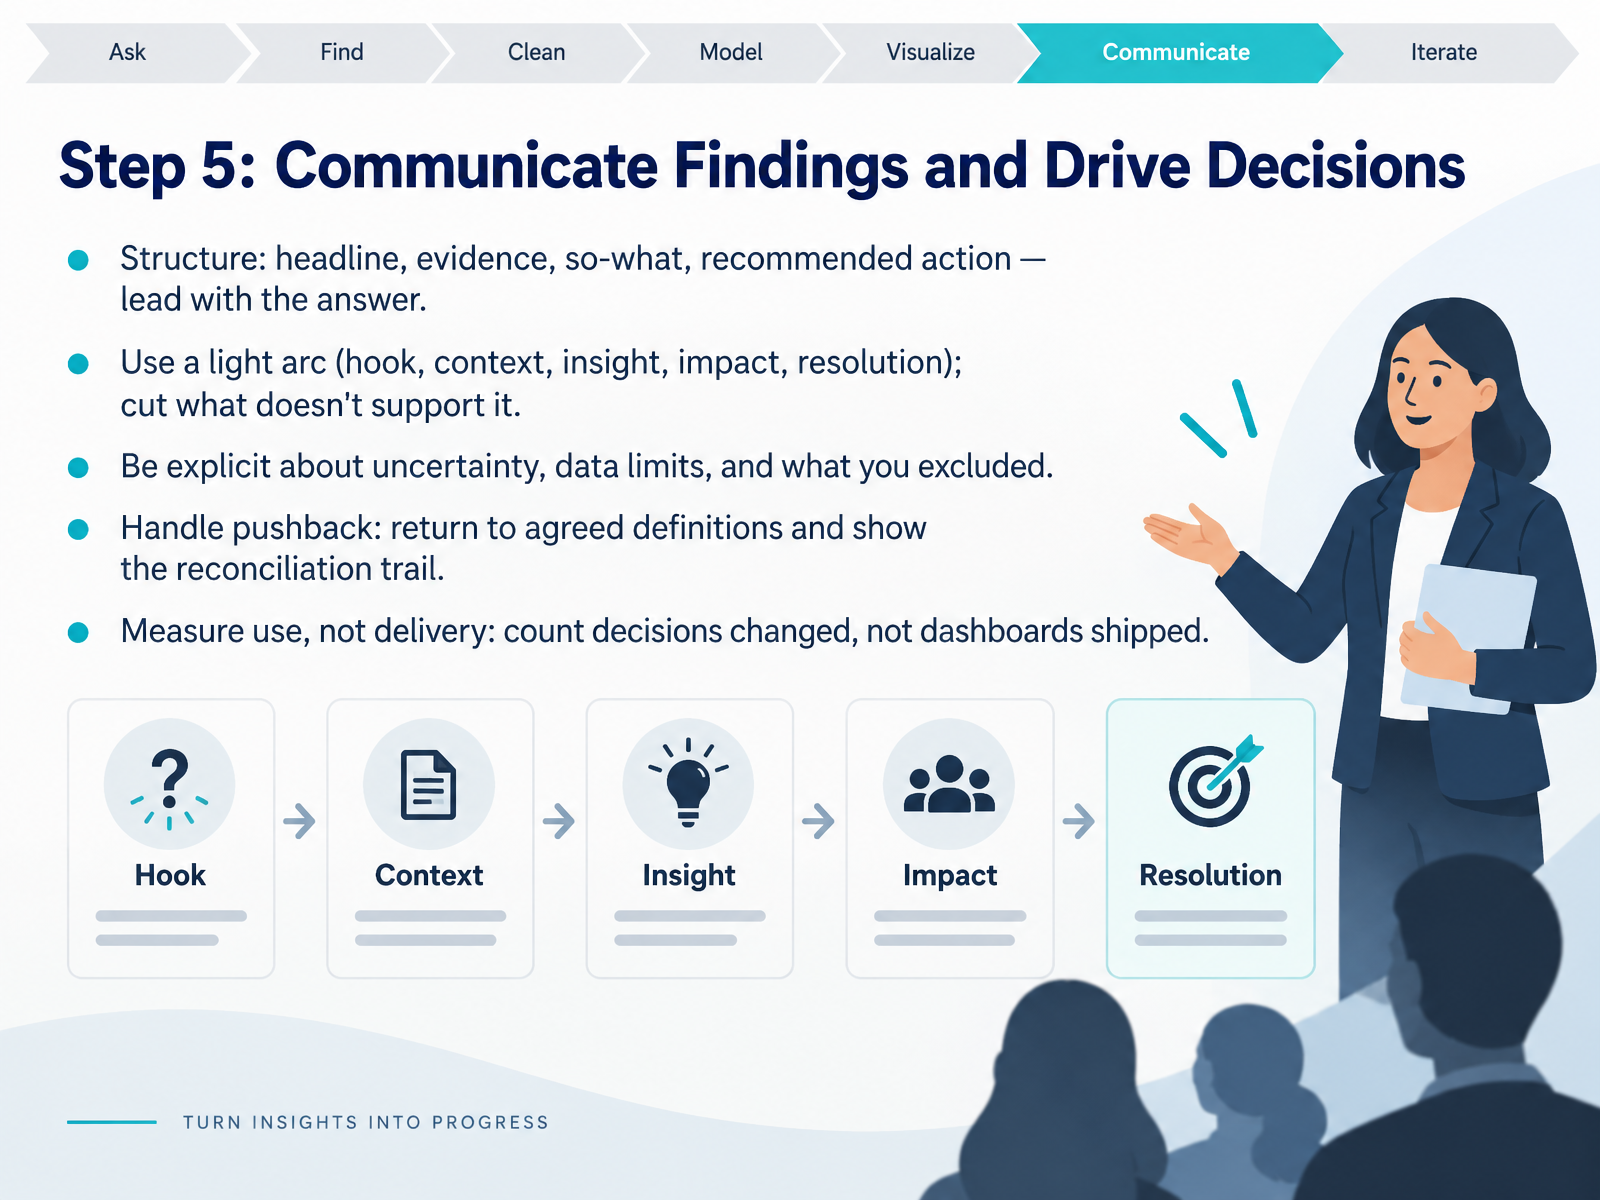
- 10Step 5: Communicate Findings and Drive DecisionsNow for the step that makes all your analysis matter: communicating findings and driving decisions. Here is the key habit. Lead with the answer. Structure your message as headline, evidence, so what, and recommended action. Your audience should hear your conclusion first, not last. Around that, use a light story arc: a hook, some context, the insight, the impact, and a resolution. Then cut anything that does not support it. Also, be explicit about uncertainty and data limits, and say what you excluded. When someone pushes back, return to the definitions you agreed on earlier and walk through your reconciliation trail. That shows your work instead of defending it. Finally, measure use, not delivery. Count decisions changed, not dashboards shipped. Spend five seconds on the so what before you present, and say it in one sentence. Next, we look at portfolio projects that mirror real BI work.
 2 min
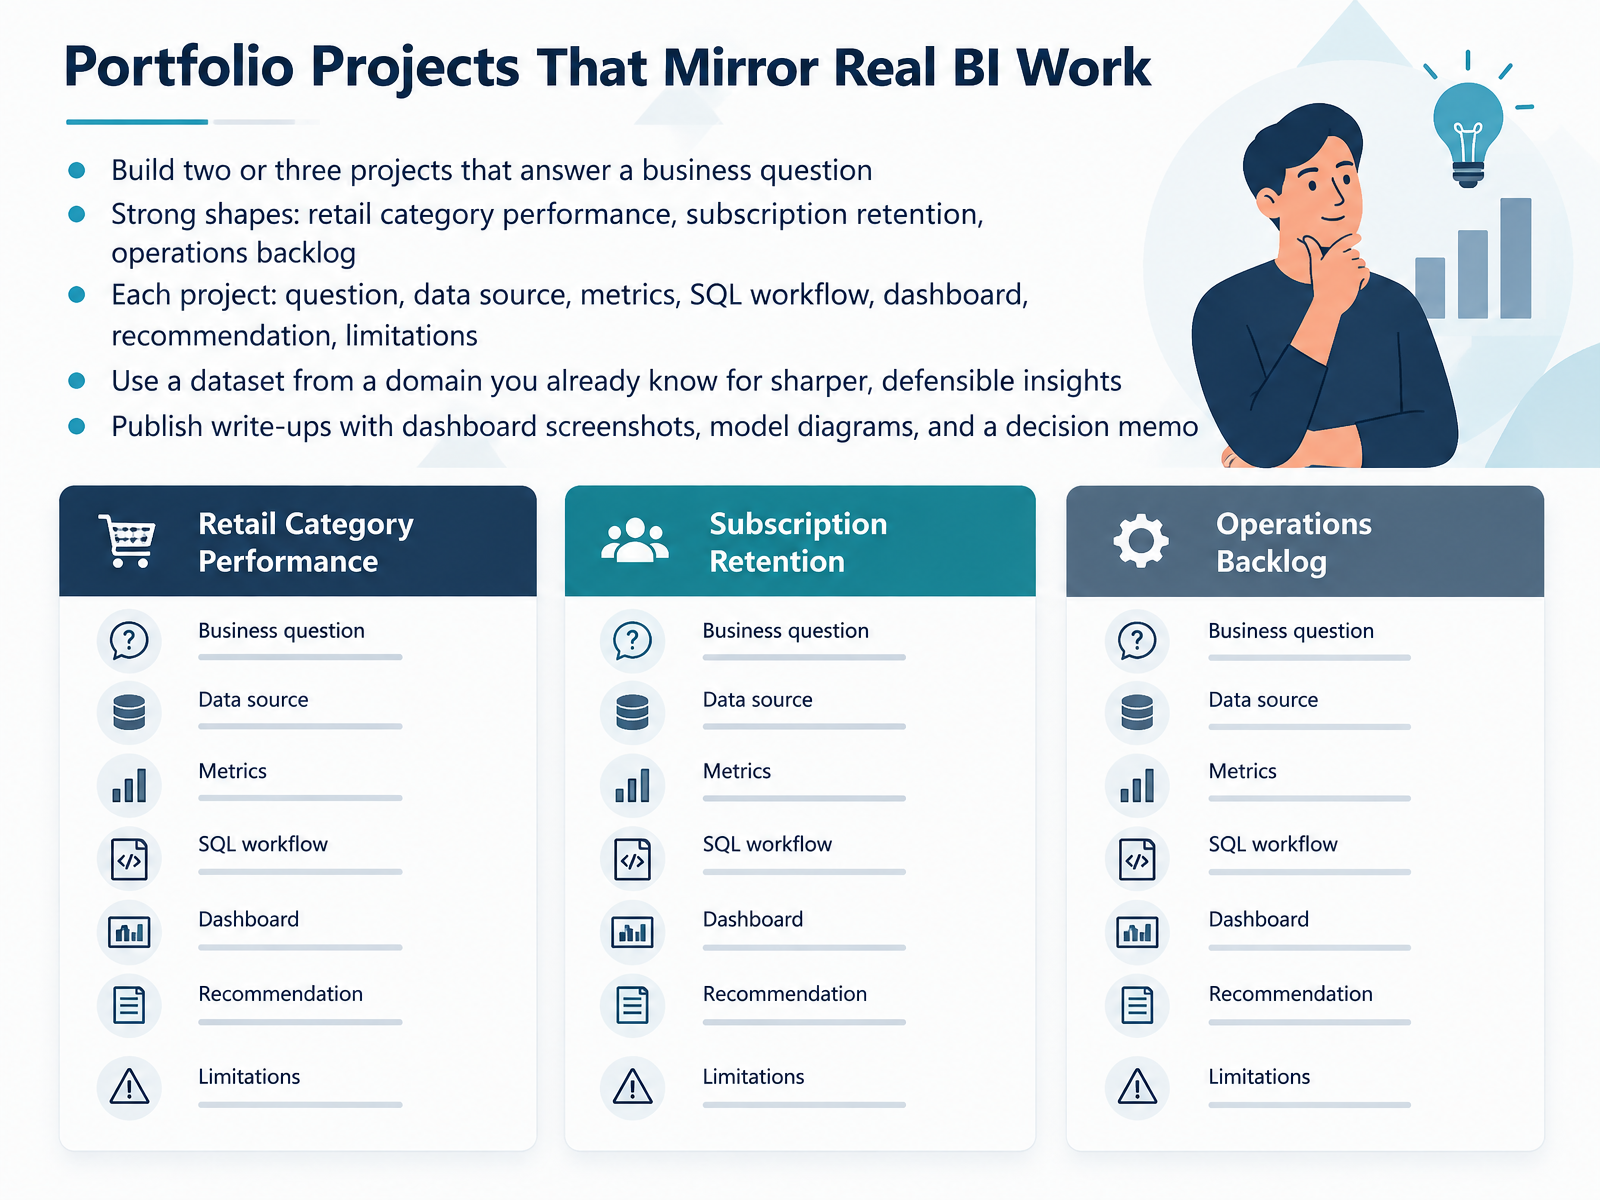
- 11Portfolio Projects That Mirror Real BI WorkNow let's turn those skills into proof. Build two or three portfolio projects, and make each one answer a real business question, not just show a dataset. Strong shapes include retail category performance, subscription retention, and operations backlog. For every project, document the question, the data source, your metric definitions, the SQL workflow, the dashboard, your recommendation, and the limitations. That limitations section is not a weakness. It shows you understand real analysis. Pick a dataset from a domain you already know, like retail, finance, or support operations, because your familiarity helps you write sharper insights and defend them in an interview. Then publish your write-ups with dashboard screenshots, model diagrams, and a short decision memo explaining what you would do next. Think of your portfolio as a small set of case studies. Each one should show that you can guide a decision, not just make charts. Next, we will look at how to carry that evidence into your resume and interviews.
 2 min
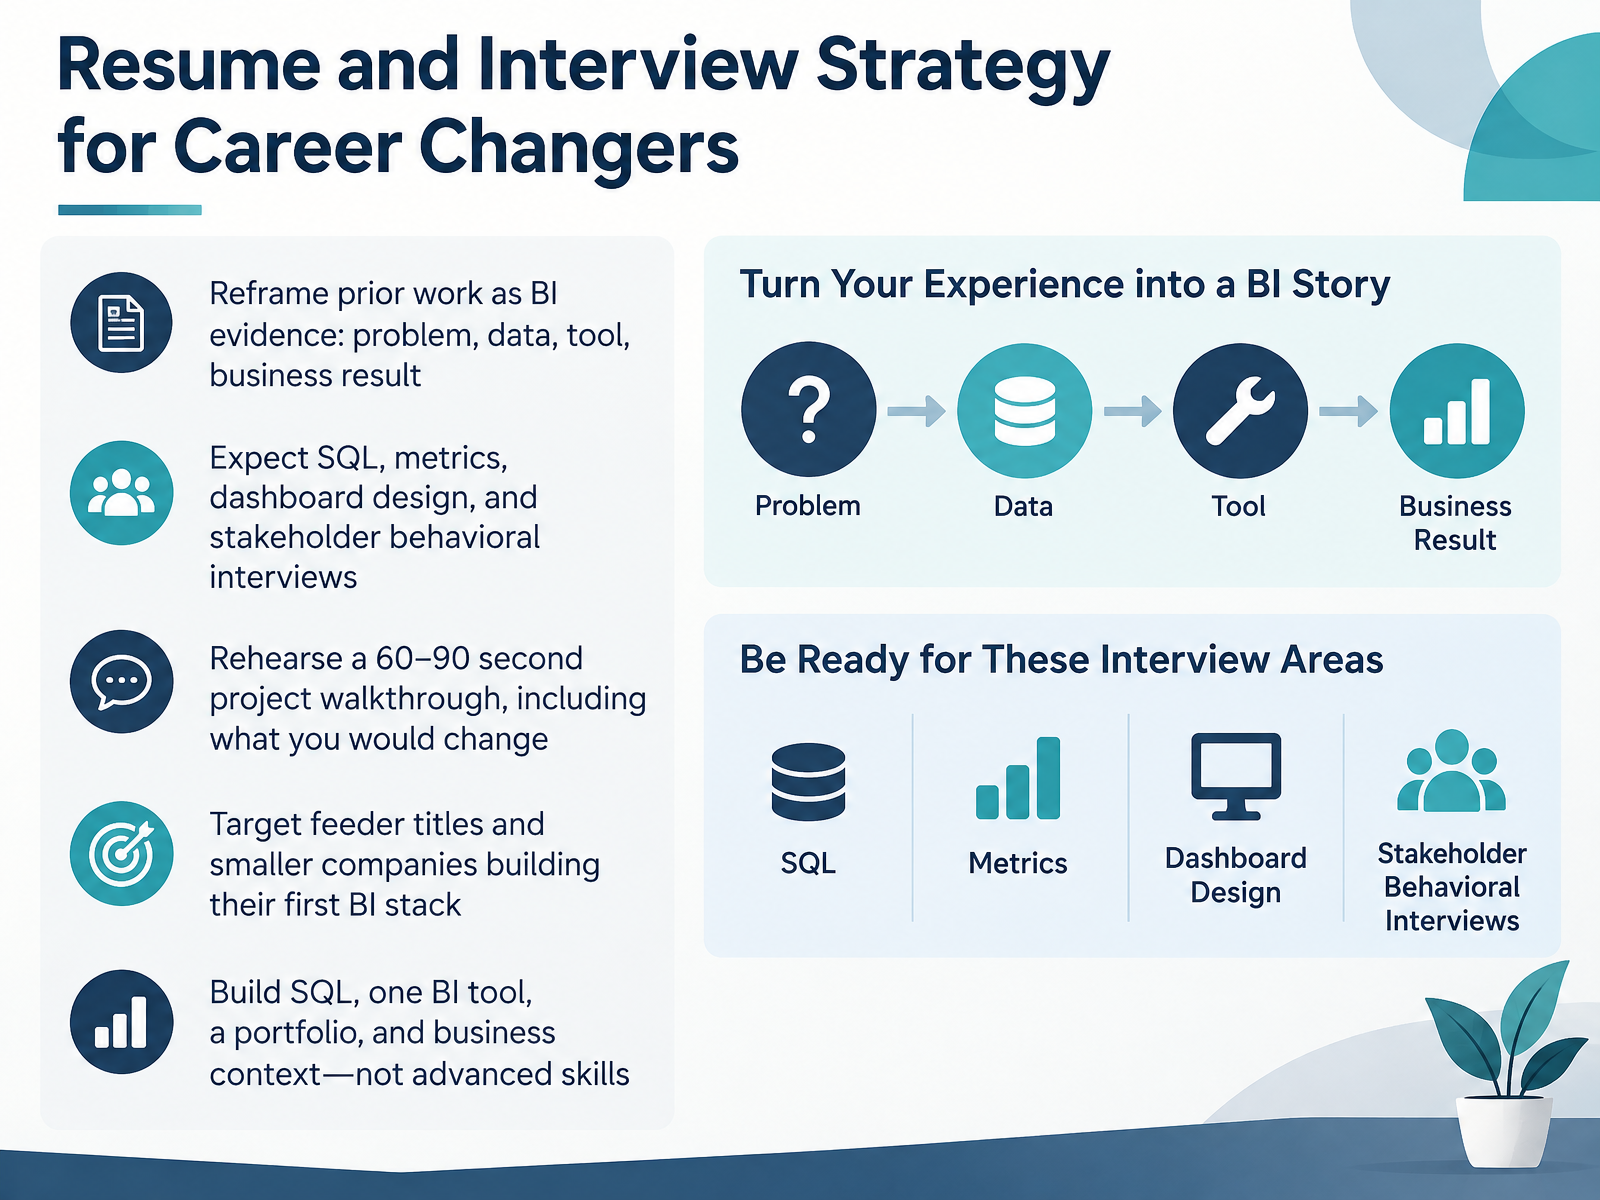
- 12Resume and Interview Strategy for Career ChangersNow let's talk about how you present yourself, on paper and in the room. First, your resume. Reframe your prior work as BI evidence using four parts: the problem, the data, the tool, and the business result. If you tracked support tickets in a spreadsheet, that's a reporting project, so say so in those terms. In interviews, expect questions on SQL, metrics, dashboard design, and how you handle stakeholders. Behavioral questions are where your past career becomes an advantage. Then rehearse a sixty to ninety second project walkthrough, and include what you would change next time. Next, target feeder titles, like reporting analyst or operations analyst, and smaller companies building their first BI stack. Remember, the fastest path is SQL, one BI tool, a portfolio, and business context, not advanced skills. That focus leads us into Common Pitfalls and Habits of Trusted Analysts.
 2 min
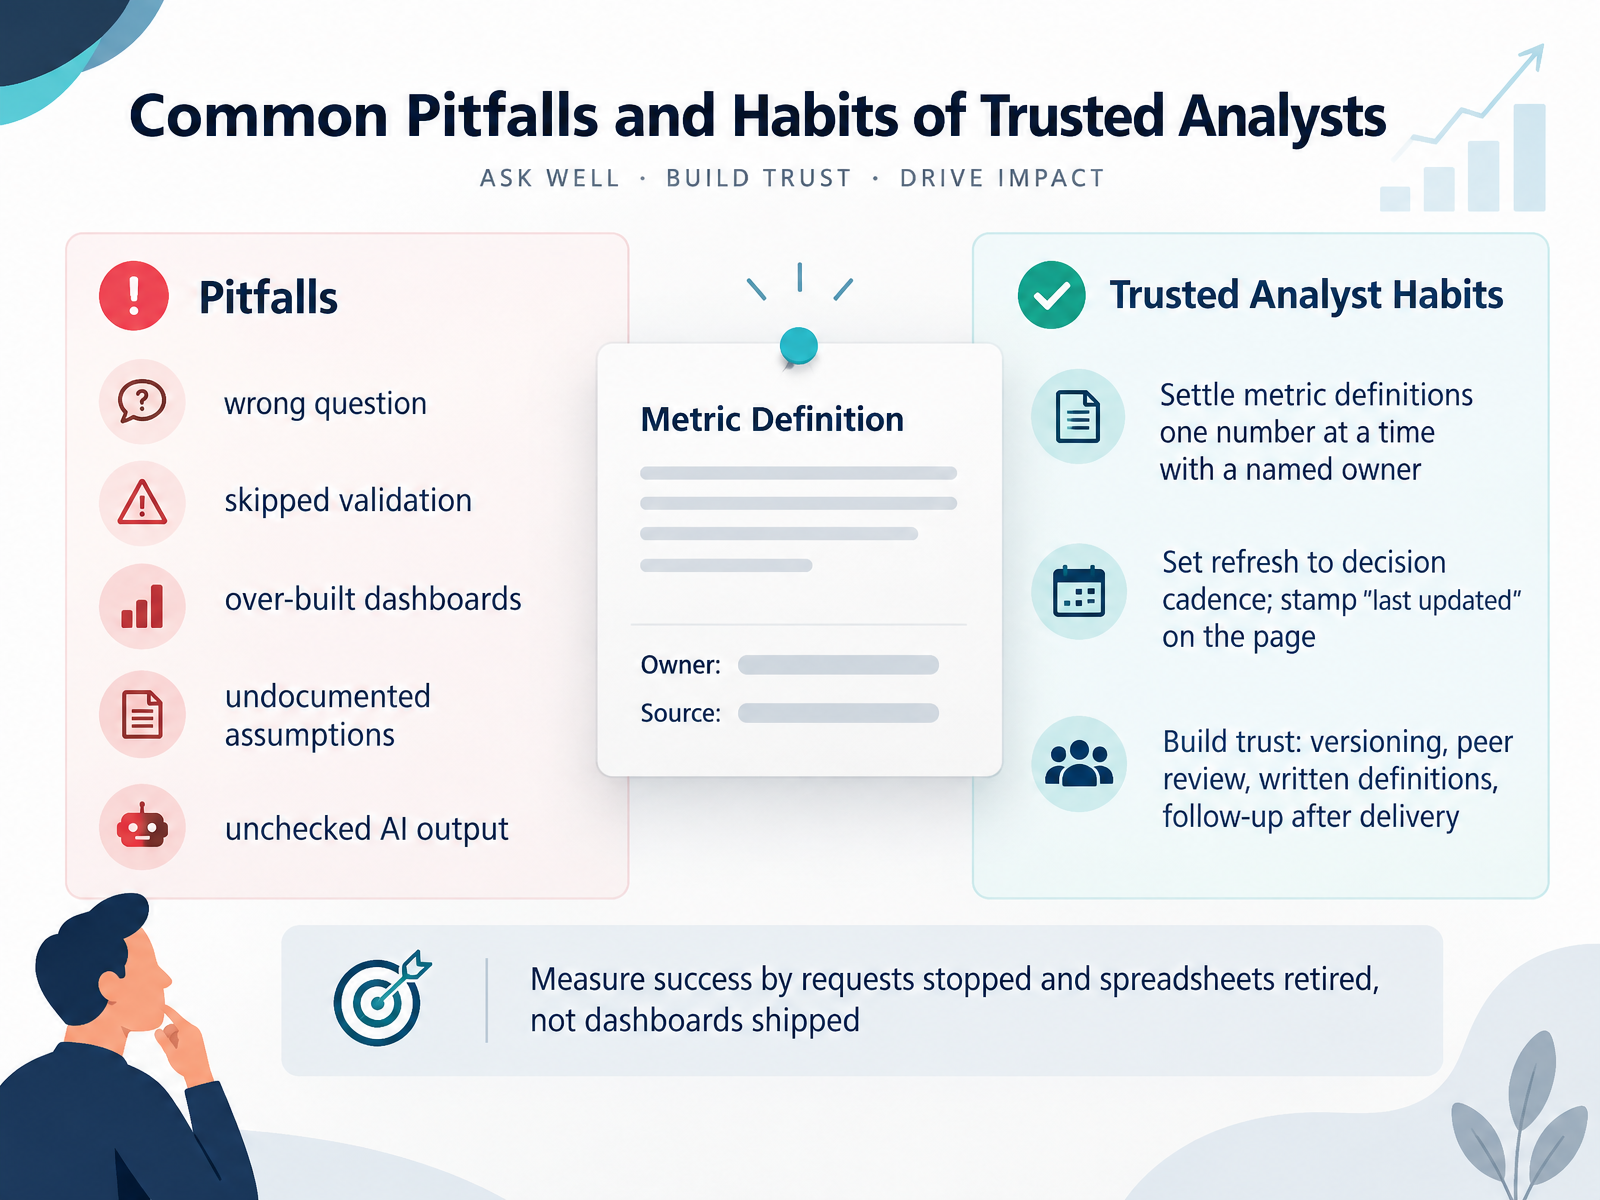
- 13Common Pitfalls and Habits of Trusted AnalystsLet's talk about the pitfalls to avoid and the habits that make analysts trusted. The common mistakes are easy to name. You answer the wrong question. You skip validation. You over build a dashboard. You leave assumptions undocumented. Or you paste unchecked AI output straight into a report. Here is the fix. Settle metric definitions one number at a time, with a named owner. Set refresh to the decision cadence, and stamp last updated on the page. Build trust through versioning, peer review, written definitions, and following up after delivery. And measure success by requests that stopped and spreadsheets that retired, not dashboards shipped. That mindset is what people remember about you. Next, let's turn it into action with your 90-Day Plan and Next Steps.
 1 min
- 14Your 90-Day Plan and Next StepsLet's close with a ninety-day plan you can actually follow.
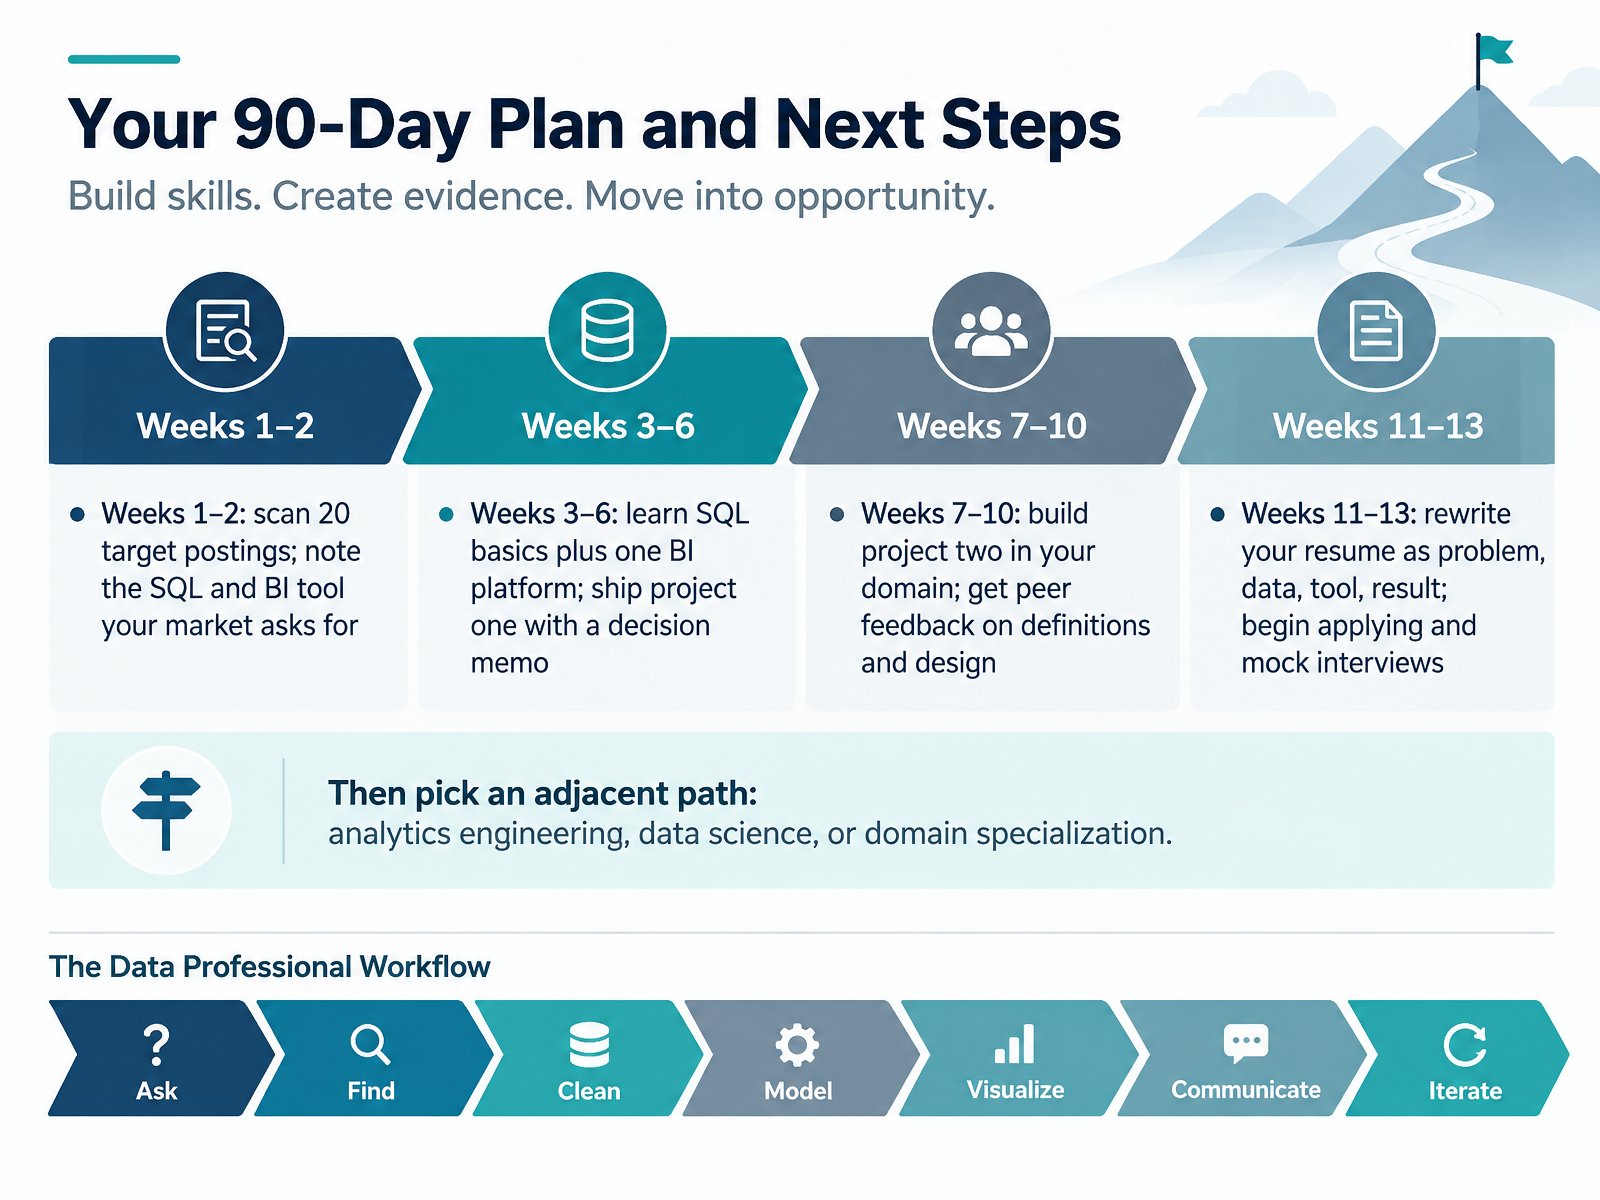
Weeks one and two: scan twenty target job postings. Note which SQL skills and which BI platform your market keeps asking for. That reading tells you what to learn, instead of guessing.
Weeks three to six: learn SQL basics plus one BI platform. Then ship project one, with a short decision memo explaining what you found and what you would recommend.
Weeks seven to ten: build project two inside your own domain, the industry you already know. Get peer feedback on your metric definitions and your dashboard design.
Weeks eleven to thirteen: rewrite your resume so each bullet shows the problem, the data, the tool, and the result. Then start applying and doing mock interviews.
After that, pick an adjacent path: analytics engineering, data science, or deeper domain specialization.
So, scan the market, ship two projects, tell the story well, and then choose your direction. You already bring transferable experience. Start this week, keep the pace steady, and thank you for learning with me. Good luck.
 snowflake.comdatagalaxy.comsdsmt.edu+22 min
Take the deck with you
Download this course as a file — free, no sign-up needed.
- PDF handoutEvery slide page, ready to print or share.15 pages · 3.2 MBDownload
- Narrated PowerPointThe deck that presents itself — every slide carries the digital human's narration video.15 pages · 13.3 MBDownload
- PowerPoint slidesThe full deck as a .pptx — open it in PowerPoint, Keynote, or Google Slides.15 pages · 3.1 MBDownload
Free to use in your own training — please keep the PersonWise credit page at the end.
Have your own deck? Turn it into a course
Sources consulted
Web sources consulted while building this course.
- "Business Intelligence Analyst Job Description Template - 2026 Guide" — resources.rework.com
- Business Intelligence Analyst Job description [Updated 2026] — uk.indeed.com
- Business Intelligence Analyst at Boeing — jobs.boeing.com
- Business Intelligence Analyst Job Description Template 2026 — upwork.com
- Business Intelligence Analyst at Intel — intel.wd1.myworkdayjobs.com
- Analytics and BI Roles: Who Does What | Snowflake — snowflake.com
- Data Roles | Personas Driving Data & AI Governance — datagalaxy.com
- Data Analytics Jobs: Skills, Roles, and Career Opportunities — sdsmt.edu
- Business Intelligence Analyst vs. Data Analyst: What's the Difference? — upwork.com
- Analytics engineer vs data analyst vs ... — getdbt.com
- Most-mentioned data analyst skills in job listings, October 2026 · ROLIVA — rolivajobs.com
- Power BI vs Tableau in 2,416 Analyst Job Postings (2026) | RealAnalystJobs — realanalystjobs.com
- Business Intelligence Analyst jobs in 2026 — required skills, demand trends, and top hiring cities — Skillenai — skillenai.com
- Top 10 BI Tools by Adoption: January 2026 | Riso Group — risogroup.co
- Tableau demand at tech companies: which roles ask for it, 90 days to Oct 9, 2026 · Jobpedia.AI — jobpedia.ai
- Gathering Data Warehouse Requirements — erickohlenberg.com
- vizro-e2e-flow/skills/dashboard-design/references/information_architecture.md at main · mckinsey/vizro — github.com
- Guiding Questions - INFORMS — informs.org
- BI Requirements Template for Dashboards and Reporting | Datilog | Datilog — datilog.com
- bengodgart/analytics-scoping-tool — github.com