Begin
14 pages · ~28 min
Customer Service Roadmap
This training helps customer service teams and leaders build a practical roadmap to improve service quality and customer experience.
A digital instructor presents all 14 pages. Hold “Ask” at any point and ask out loud — the answer comes from this course. No sign-up needed.
What you’ll learn
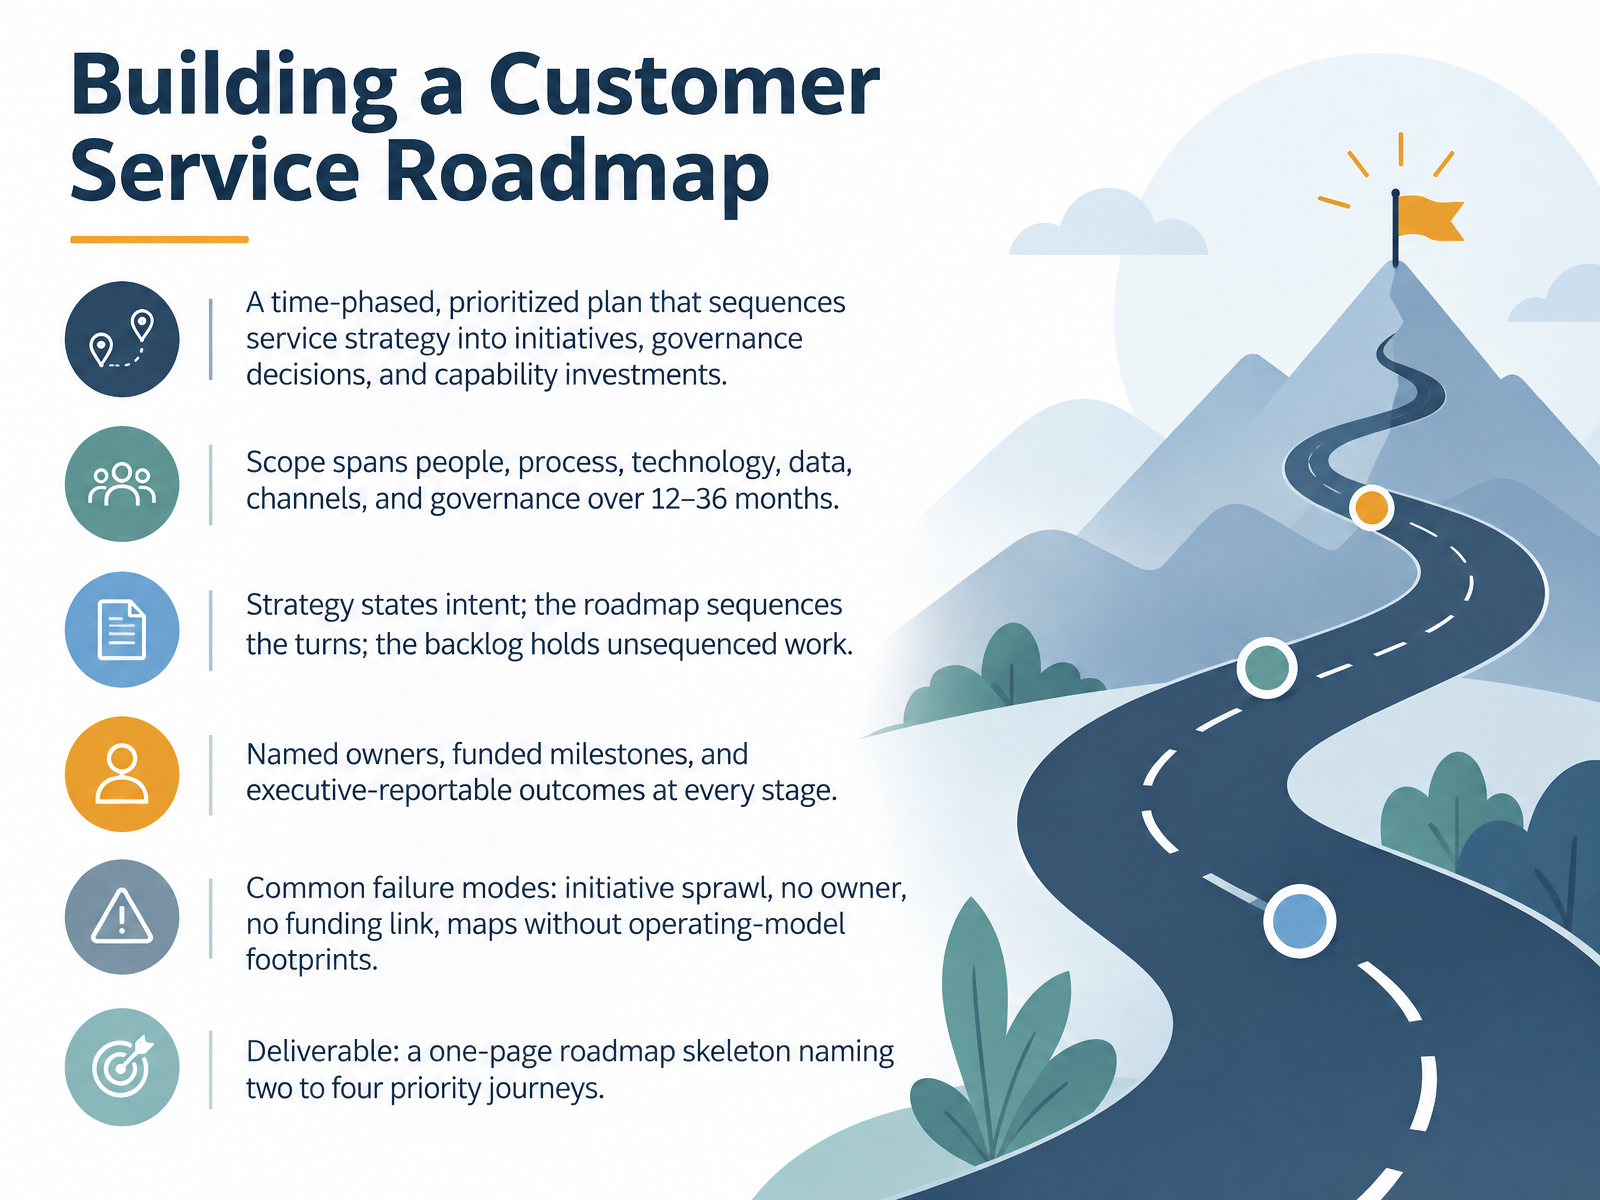
- 01Building a Customer Service RoadmapWelcome. Over the next fourteen slides, we will build a customer service roadmap together. This is a decision document, not a strategy restatement. It is a time-phased, prioritized plan that sequences our service strategy into initiatives, governance decisions, and capability investments across people, process, technology, data, channels, and governance, typically over twelve to thirty-six months. Keep one distinction clear: strategy states intent, the roadmap sequences the turns, and the backlog holds unsequenced work. For each stage, we name owners, fund milestones, and define outcomes executives can report against. Watch for the common failure modes: initiative sprawl, no owner, no funding link, and maps without operating-model footprints. Our deliverable today is a one-page roadmap skeleton naming two to four priority journeys. Next, why 2026 demands a different kind of roadmap.theydo.comqiscus.comicx.co+22 min
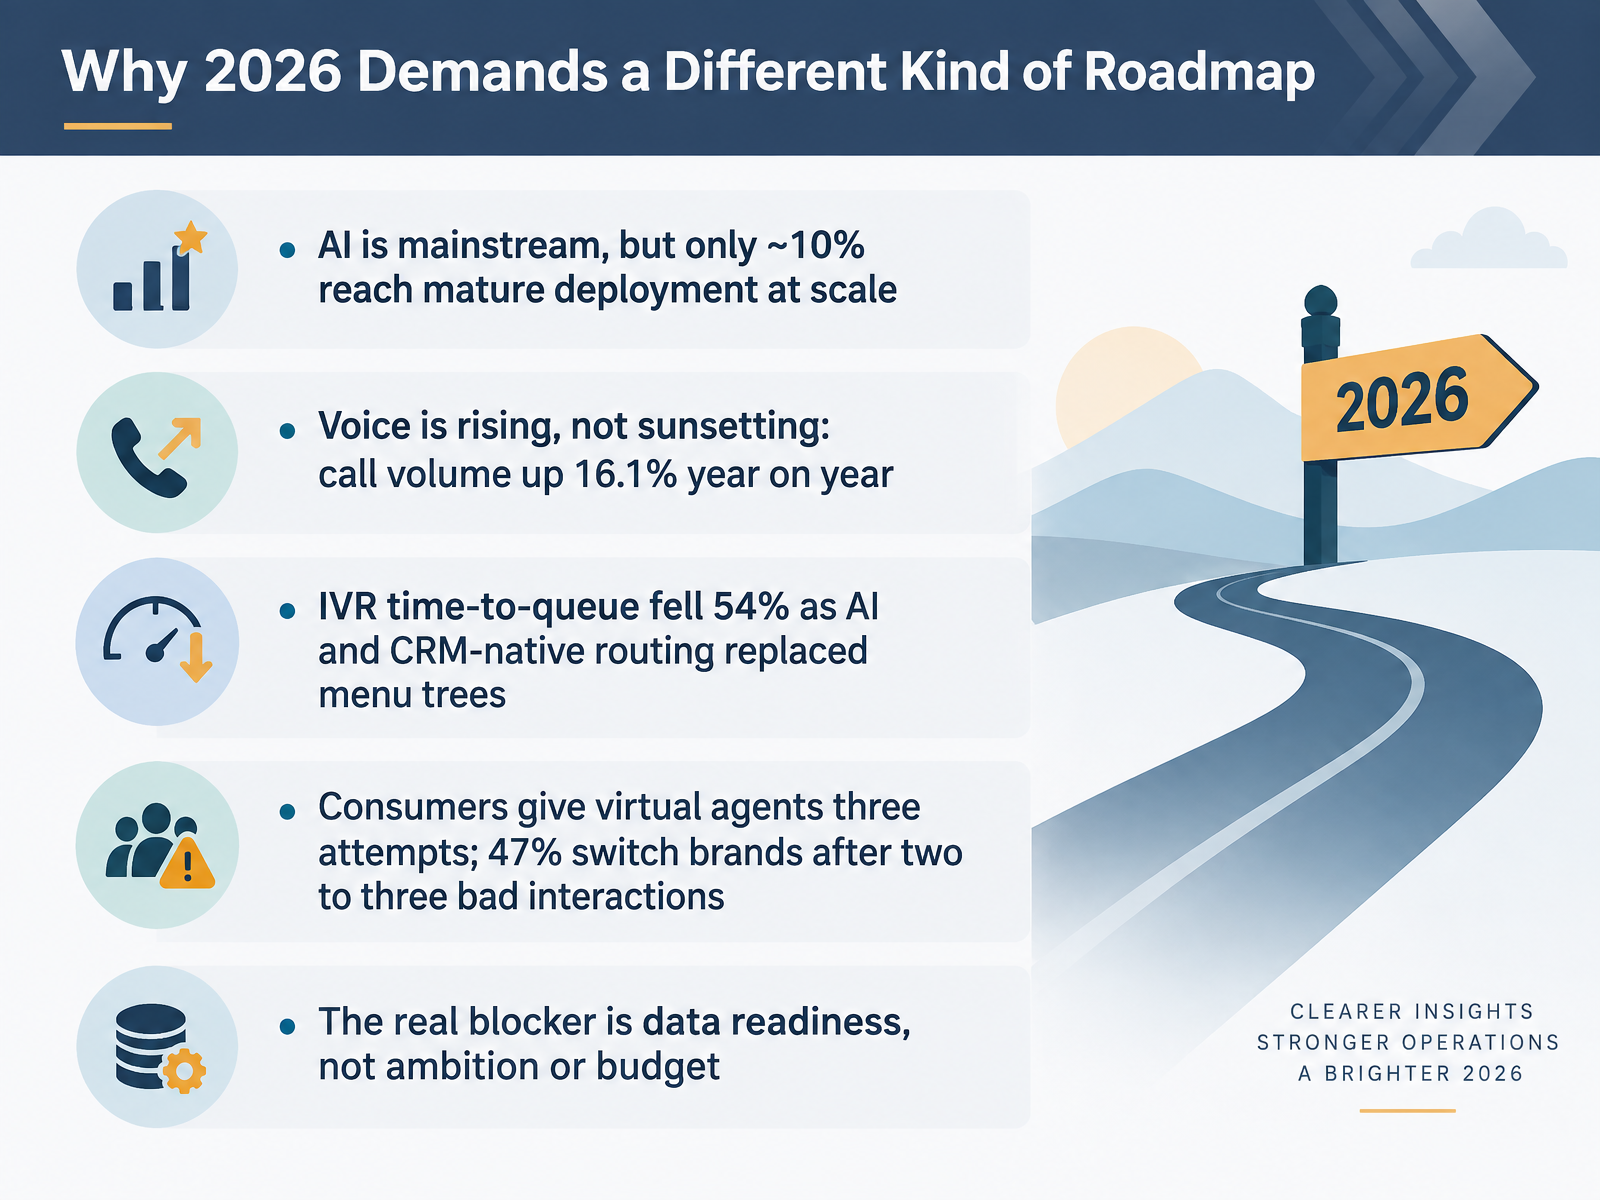
- 02Why 2026 Demands a Different Kind of RoadmapLet us start with why the roadmap for 2026 has to look different from the one we built two years ago. AI is mainstream now, yet only about ten percent of teams report mature deployment at scale. That gap is where most of our work sits. Voice is not sunsetting; call volume rose sixteen point one percent year on year, and active headcount grew with it. What did fall was time spent before the queue, down fifty four percent, as CRM-native routing and conversational AI replaced menu trees. Consumers are willing to give virtual agents up to three attempts, but forty seven percent switch brands after two to three bad interactions. So the constraint is not ambition and it is not budget. It is data readiness across channels and systems. That is what separates a roadmap that scales from a pilot that stalls. Now let us diagnose where we actually stand. The next section is Diagnosing the Current State: Baseline Before Ambition.
 deloittedigital.comverint.compuzzel.com+21 min
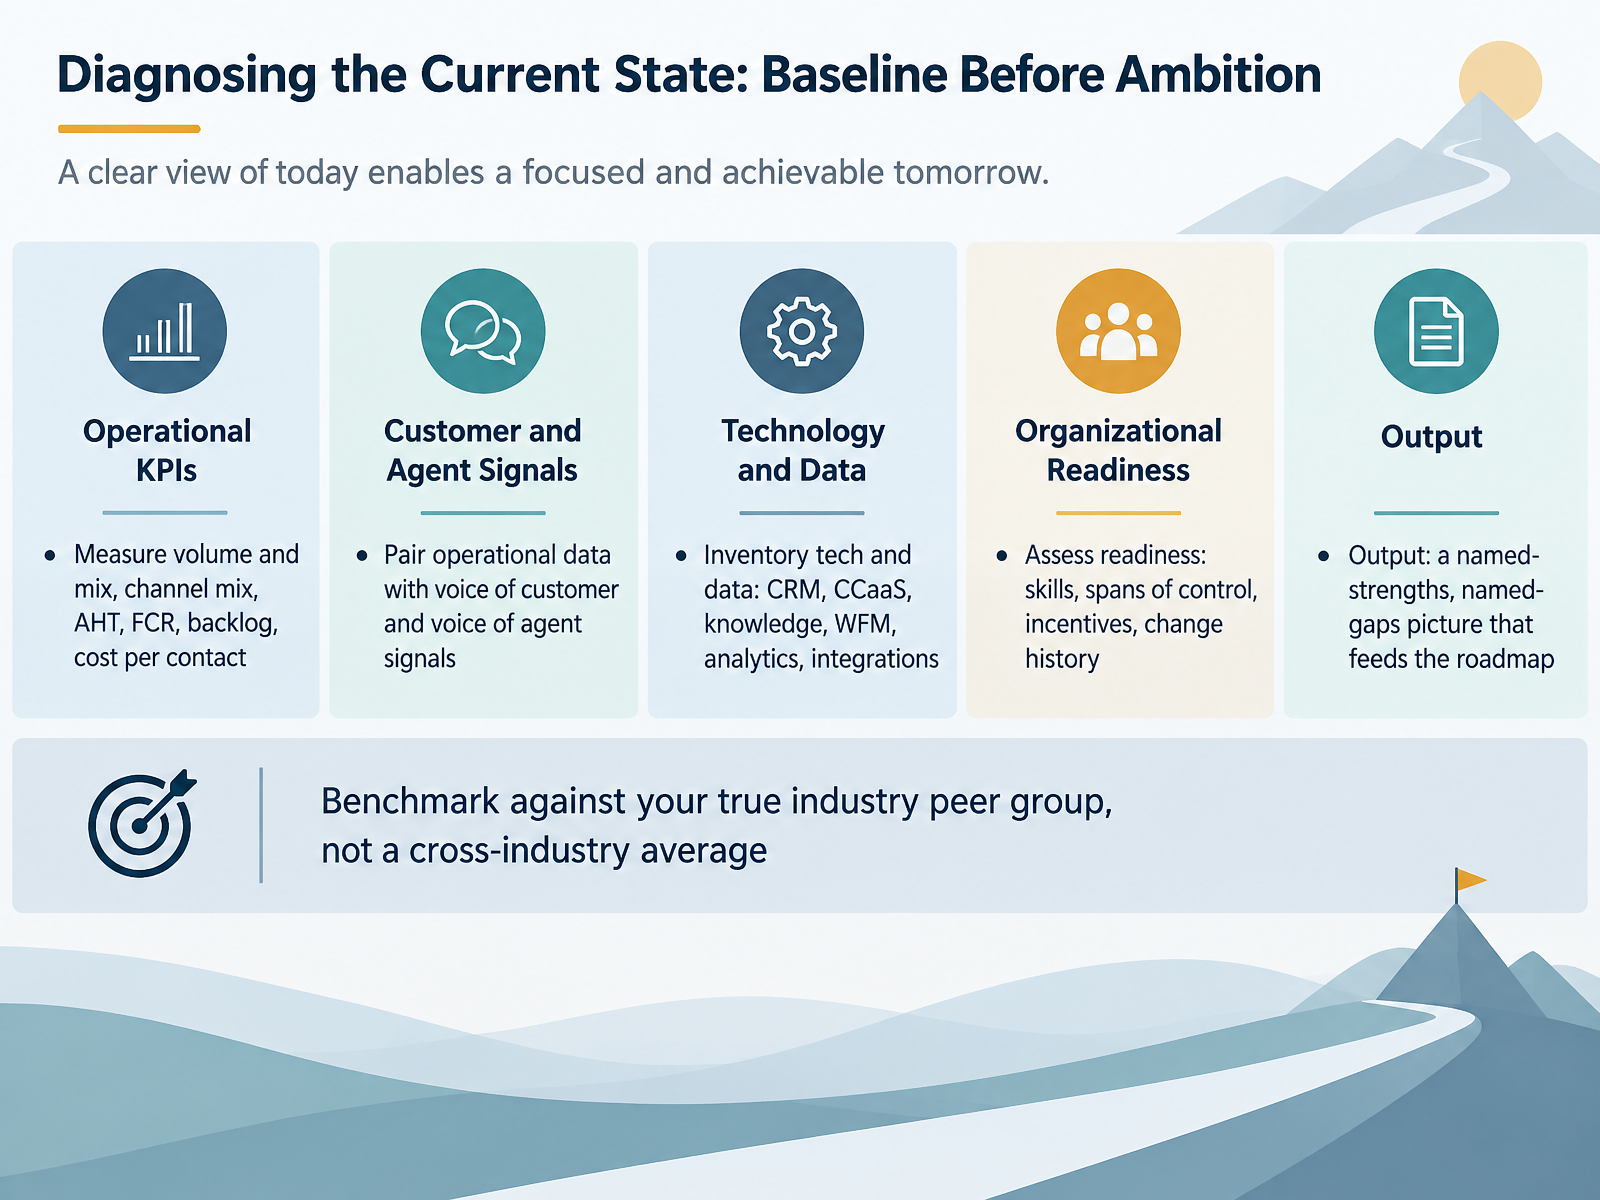
 - 03Diagnosing the Current State: Baseline Before AmbitionNow, before we commit to any ambition, we need a real baseline. So let's start with the numbers we already trust. Measure volume and mix, channel mix, average handle time, first contact resolution, backlog, and cost per contact. Then pair that operational data with voice of customer and voice of agent signals, because the numbers tell us what is happening, and those voices tell us why.
Next, inventory your technology and data landscape: your CRM, your contact centre platform, your knowledge base, workforce management, analytics, and the integrations holding it all together. From there, assess readiness across skills, spans of control, incentives, and your history of change. That last one matters. If previous change programmes stalled, that is a dependency, not a footnote.
The output should be blunt. A named-strengths, named-gaps picture that feeds directly into the roadmap. And when you benchmark, compare against your true industry peer group, not a cross-industry average. A seven-minute handle time is healthy in complex healthcare support, and weak in simple retail order status.
So, get the baseline honest first. That way, every sequencing decision later is grounded in evidence, not opinion. That sets us up for the next step, benchmarking service performance against real 2026 standards.
 maxcontact.comgo.maxcontact.comnatterbox.com+22 min
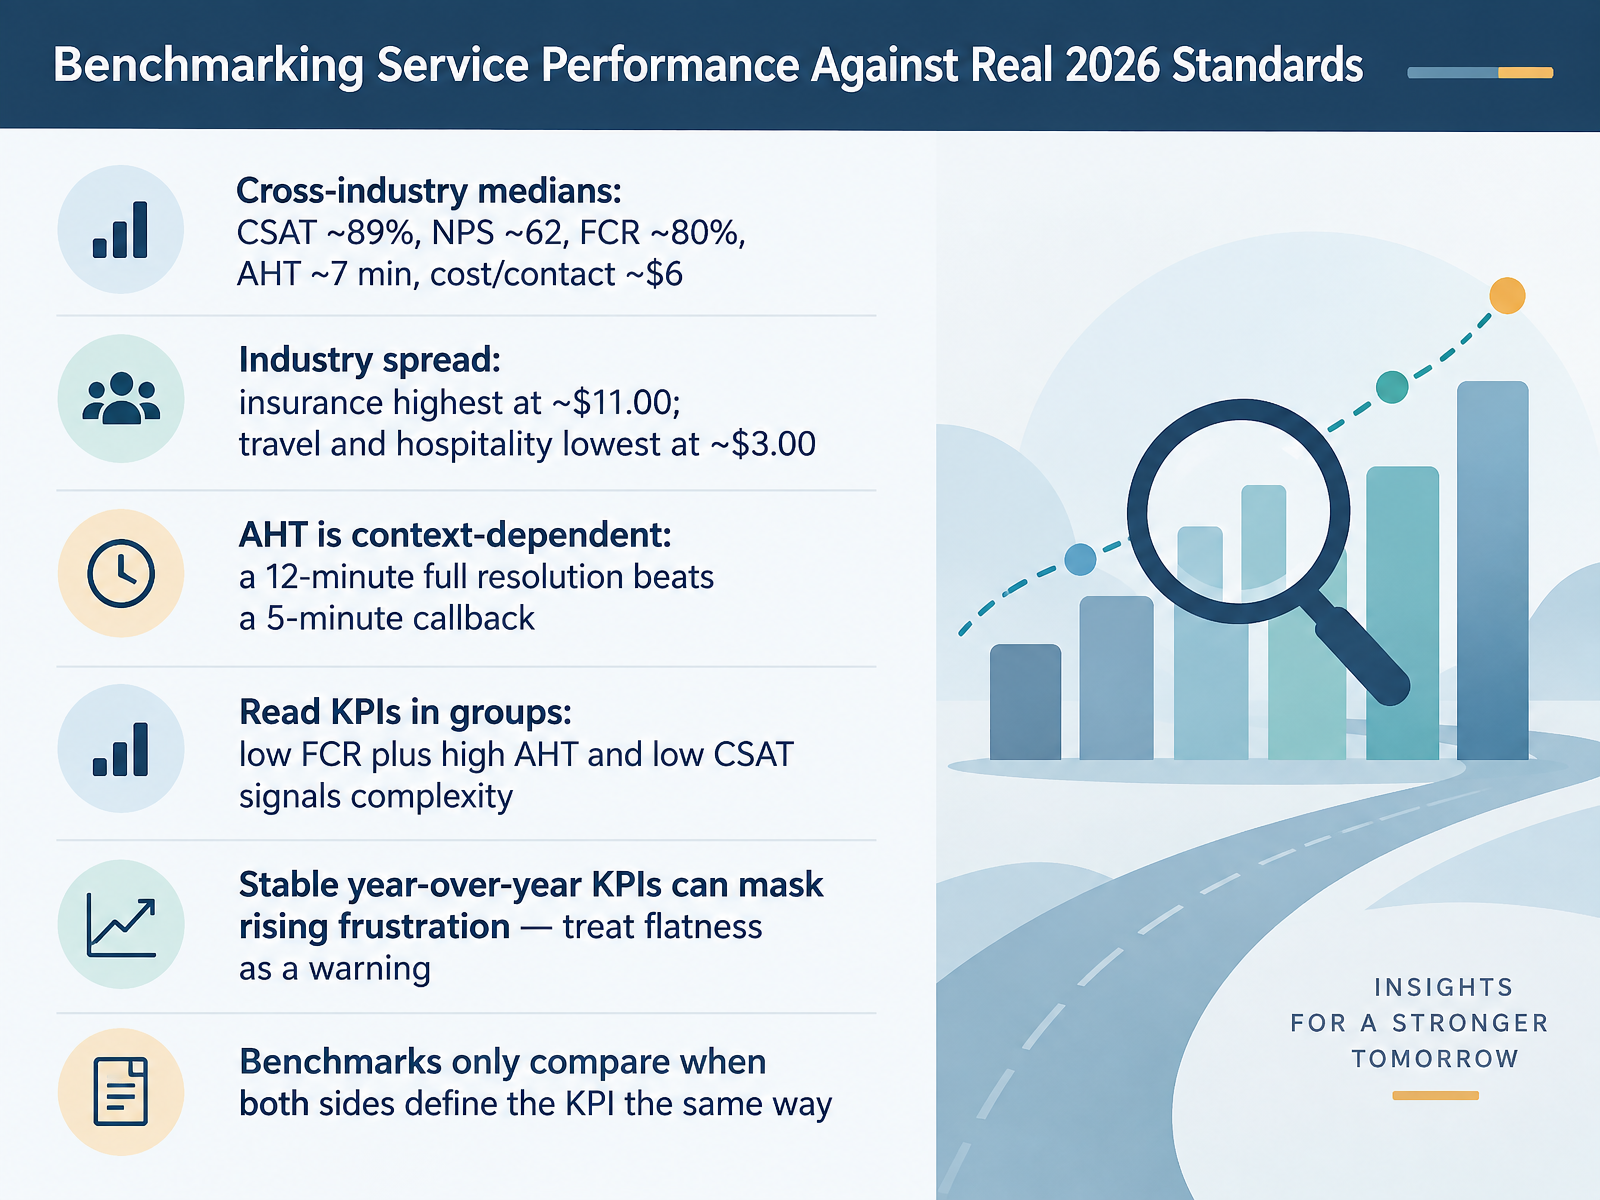
 - 04Benchmarking Service Performance Against Real 2026 StandardsLet's ground our roadmap in real numbers. The cross-industry medians for 2026 sit around eighty-nine percent CSAT, an NPS of sixty-two, first contact resolution near eighty percent, average handle time of about seven minutes, and a cost per contact of roughly six dollars. But the spread matters more than the median. Insurance runs about eleven dollars per contact, while travel and hospitality sit near three. That gap reflects complexity, licensing, and escalation paths, not effort. So read handle time in context. A twelve-minute call that fully resolves the issue beats a five-minute call that triggers a callback. Read your KPIs in groups. Low first contact resolution paired with high handle time and low satisfaction points to complexity or missing tools, not agent speed. And be careful with flat trends. Stable year-over-year numbers can mask rising frustration as customer expectations shift. Finally, benchmarks only compare when both sides define the KPI the same way. Agree the definition before you agree the target. Next, we move into mapping journeys that reveal where service actually breaks.
 maxcontact.comgo.maxcontact.comnatterbox.com+22 min
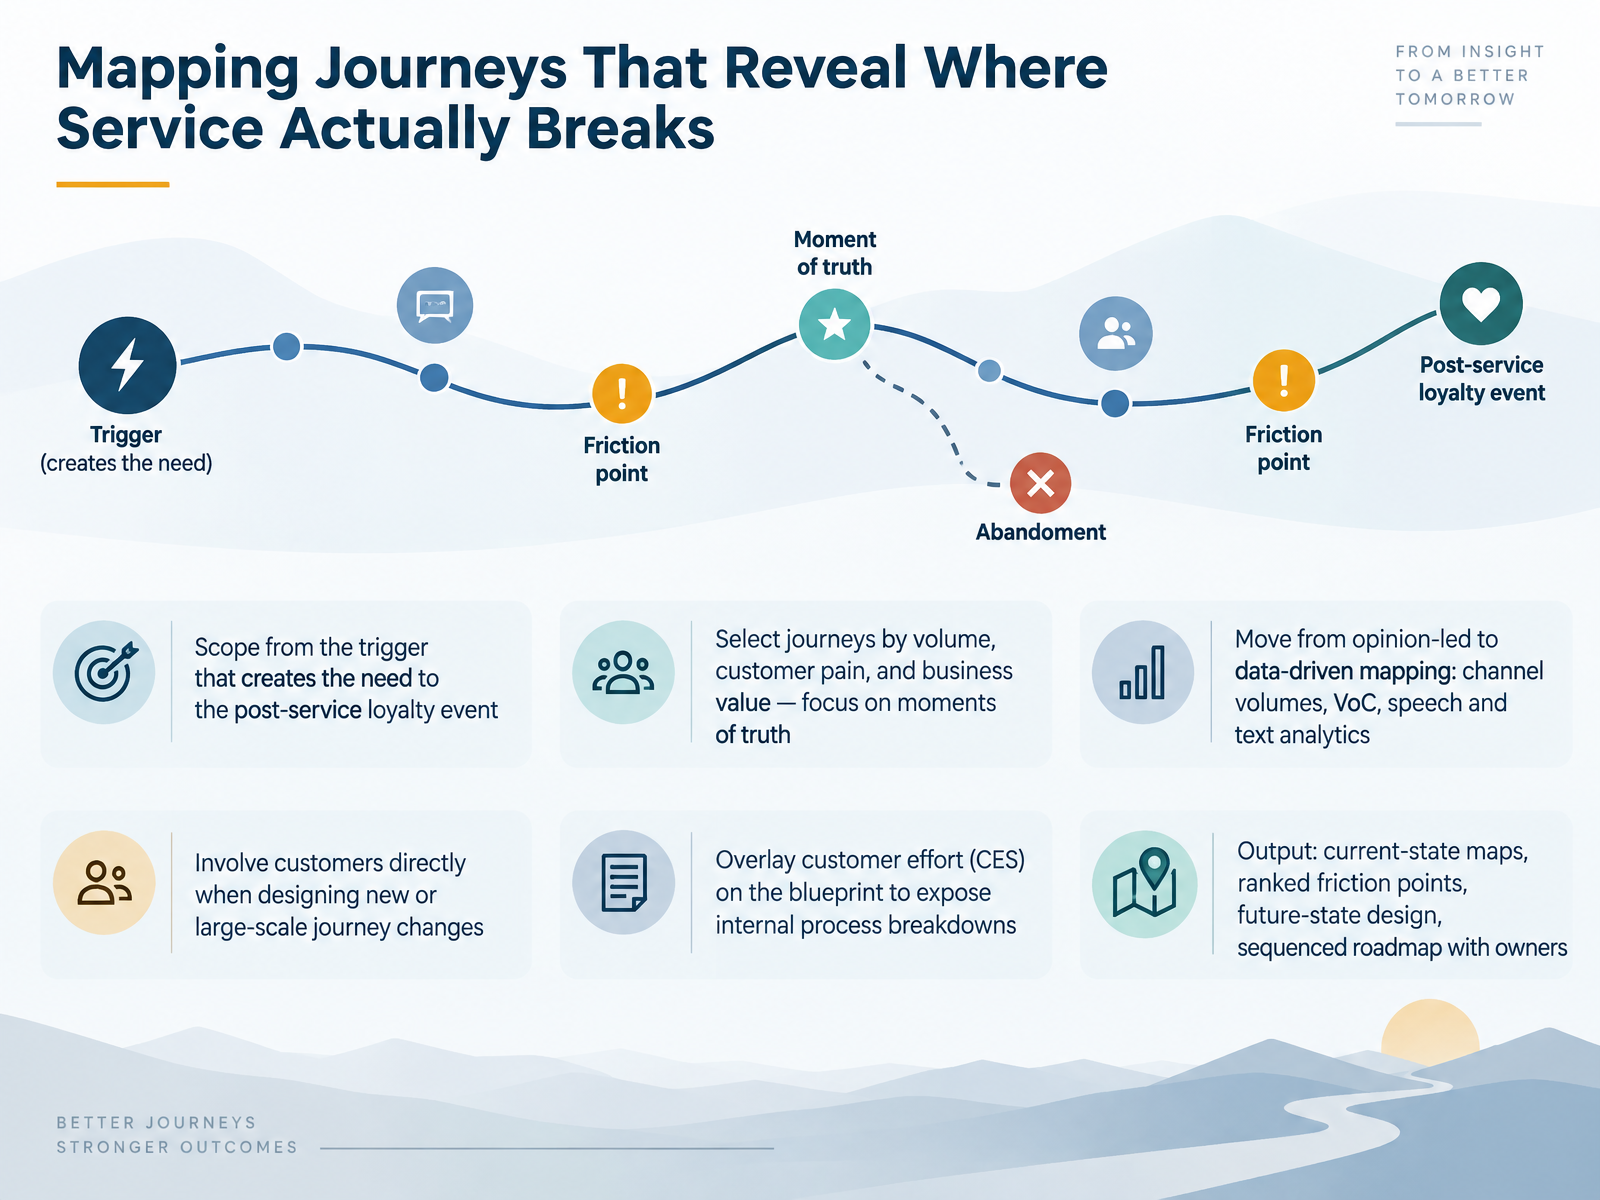
 - 05Mapping Journeys That Reveal Where Service Actually BreaksLet's talk about mapping journeys that show us where service actually breaks. First, scope matters. Map from the trigger that creates the need, through to the post-service loyalty event, not just the support interaction itself. Then choose which journeys to map by volume, customer pain, and business value. Focus on moments of truth. Move from opinion-led mapping to data-driven work: channel volumes, voice of the customer, and speech and text analytics. Involve customers directly when you design new or large-scale changes. Overlay customer effort on the blueprint, because that exposes the internal process breakdowns behind the friction. Your output should be current-state maps, ranked friction points, a future-state design, and a sequenced roadmap with owners. From Journey Finding to Roadmap Initiative.
 emt.gartnerweb.comsi-labs.comexa.ai+21 min
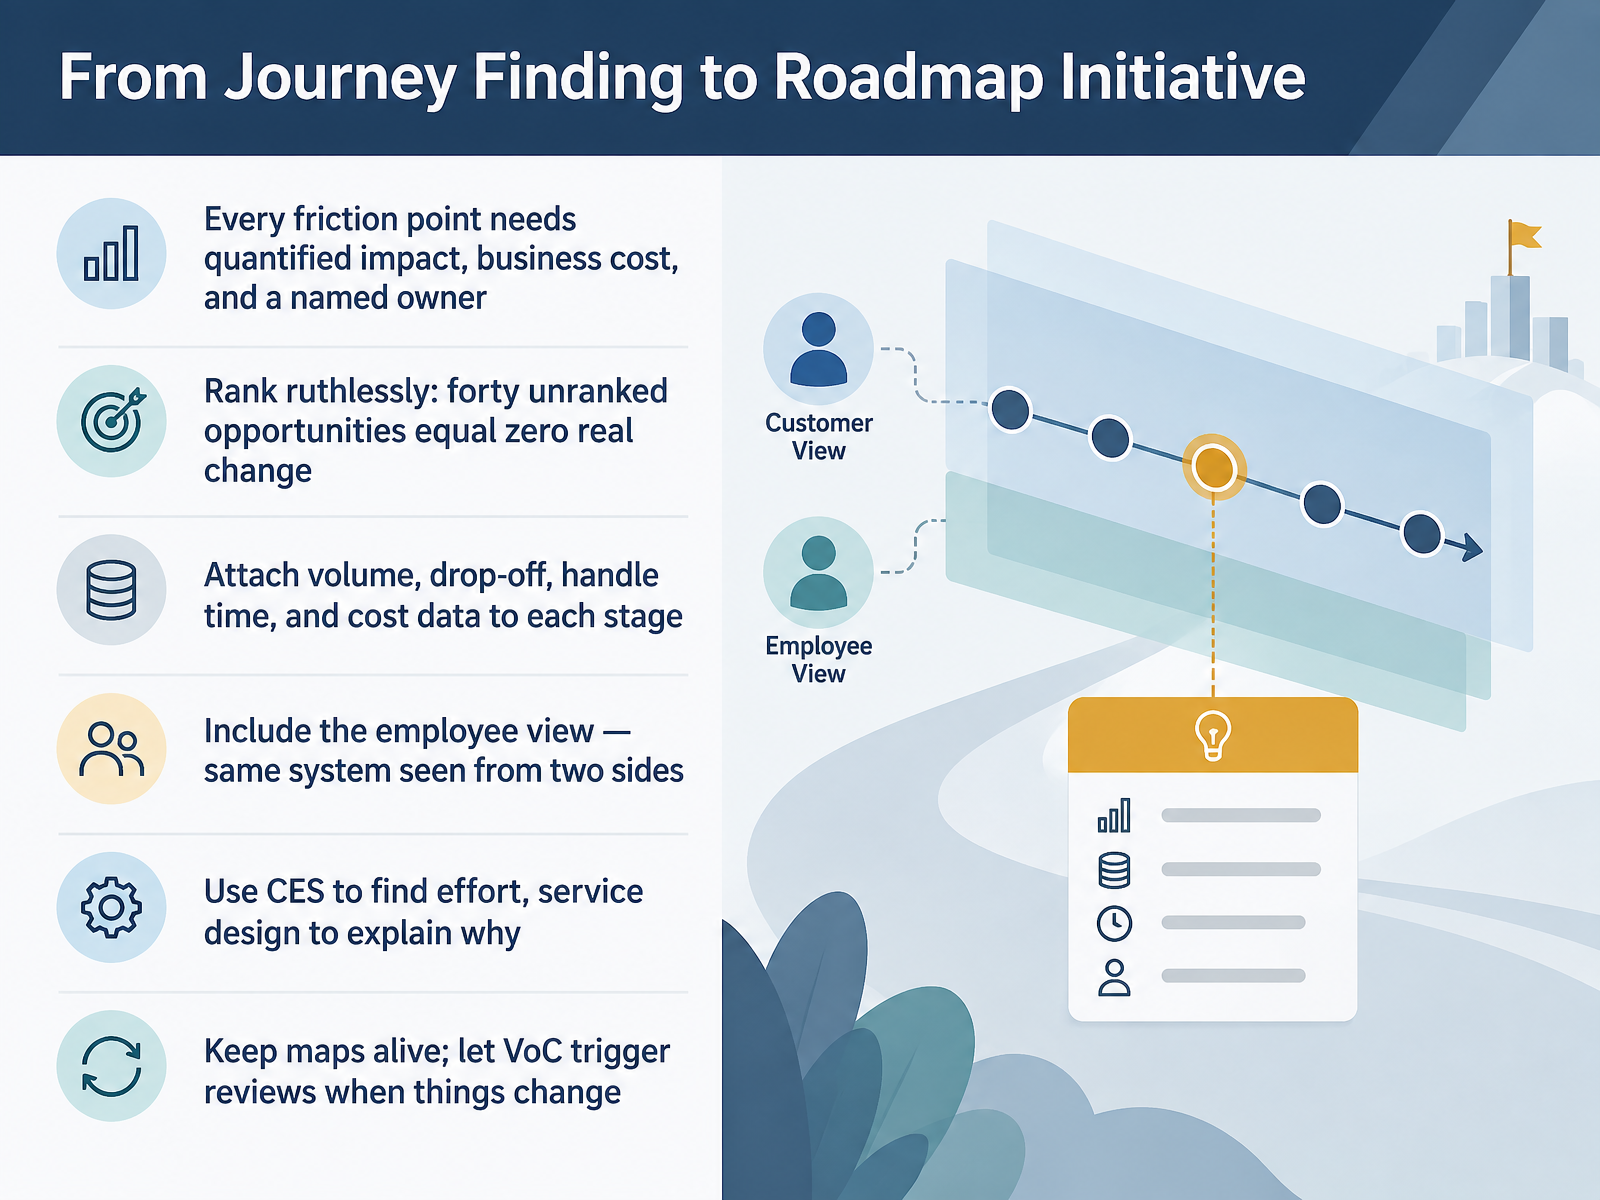
 - 06From Journey Finding to Roadmap InitiativeSo let's talk about turning findings into initiatives. Every friction point we surface needs three things before it earns a place on the roadmap: quantified impact, a business cost, and a named owner. A friction point without an owner is just a complaint. Then rank ruthlessly. Forty unranked opportunities produce exactly the same change as zero. Attach volume, drop-off, handle time, and cost data to each stage, because that is what turns a narrative into a business case. Include the employee view as well. In most journeys, the employee experience and the customer experience are the same system seen from two sides. Use the customer effort score to find where effort concentrates, and use service design to explain why. Finally, keep your maps alive. When the product, process, or channel mix changes, let voice of the customer data trigger the review. That moves us naturally into defining outcomes and choosing metrics that matter.
 emt.gartnerweb.comsi-labs.comexa.ai+22 min
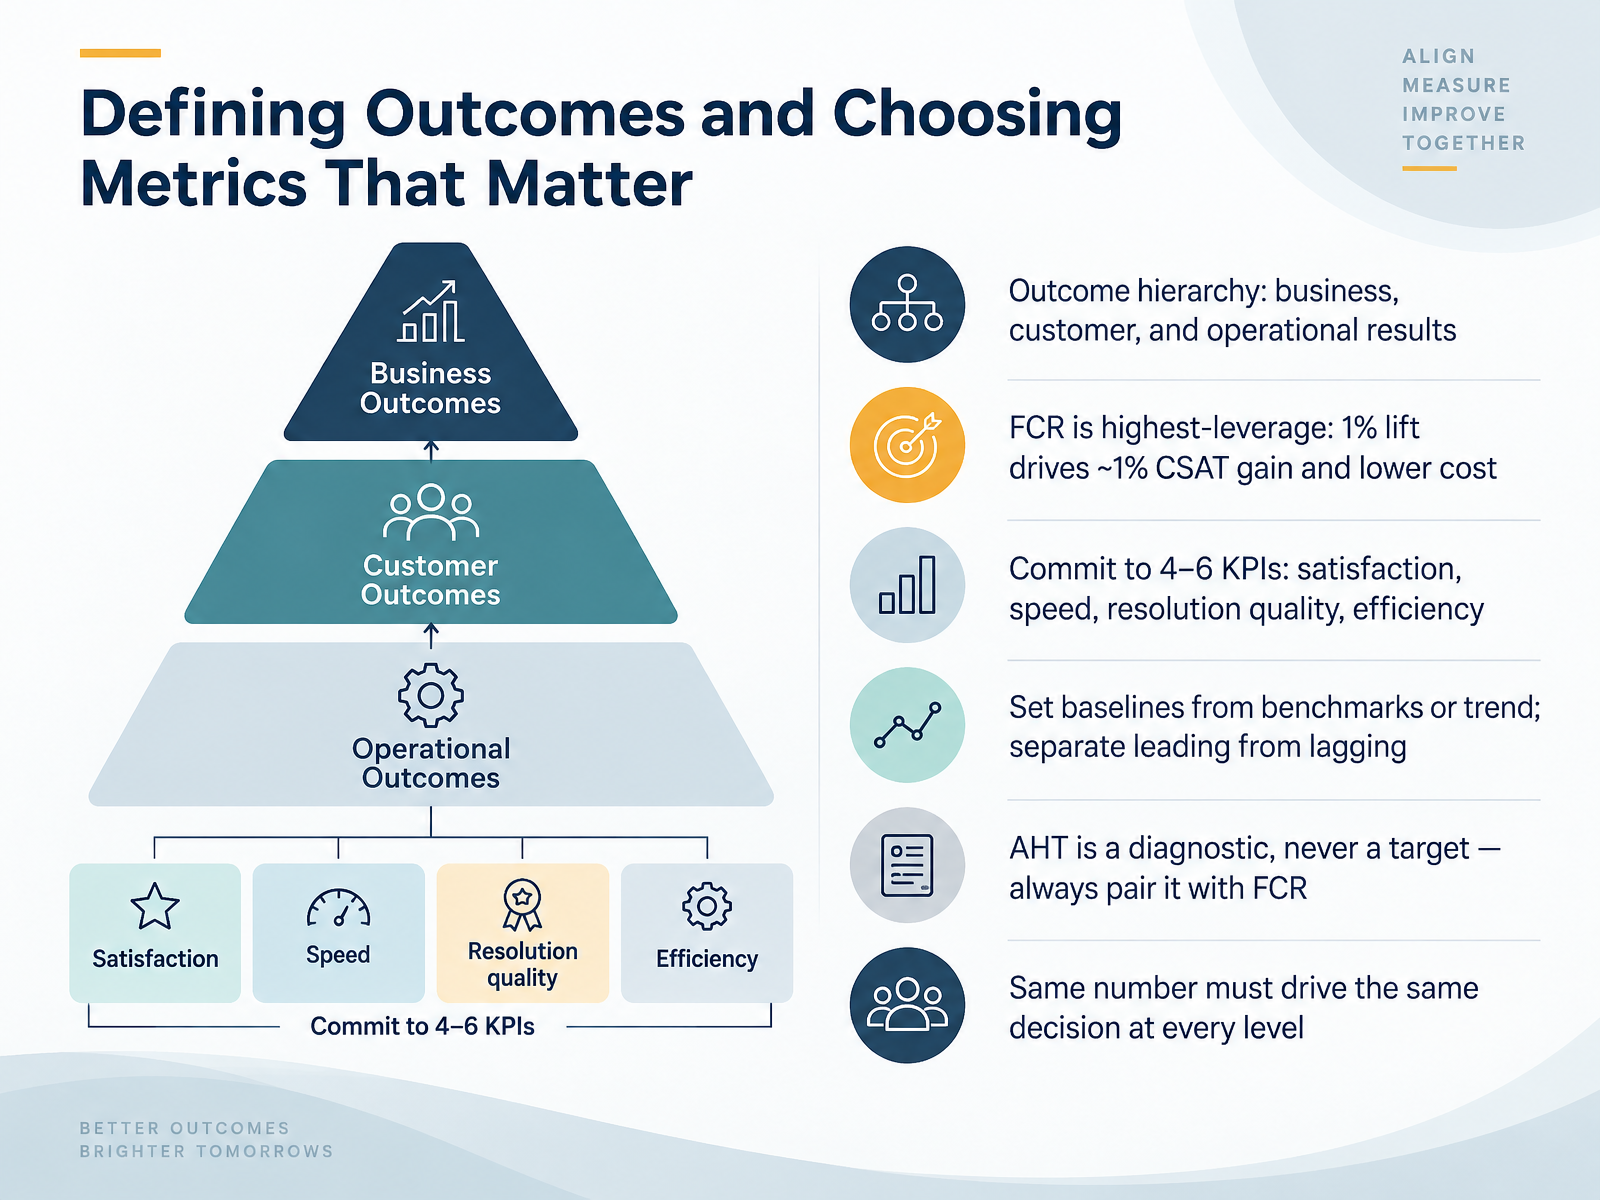
 - 07Defining Outcomes and Choosing Metrics That MatterNow let's get concrete about outcomes and the metrics we commit to. Start by building an outcome hierarchy: business results, customer results, and operational results. Each level should answer a different question, and they should connect. If first contact resolution moves, satisfaction and cost should move with it. That is why FCR is our highest-leverage metric. A one percent lift drives roughly a one percent gain in CSAT, and it lowers cost by reducing repeat contacts. From there, commit to four to six KPIs, not twenty. Cover satisfaction, speed, resolution quality, and efficiency. Set baselines from industry benchmarks or your own trend, and separate leading indicators from lagging ones. Handle time stays a diagnostic, never a target, because a fast call that ends in a callback is not efficiency. And the same number must drive the same decision at every level, from the frontline to the executive review. Next, we will look at prioritizing initiatives by impact, effort, and dependencies.
 amplifai.com2 min
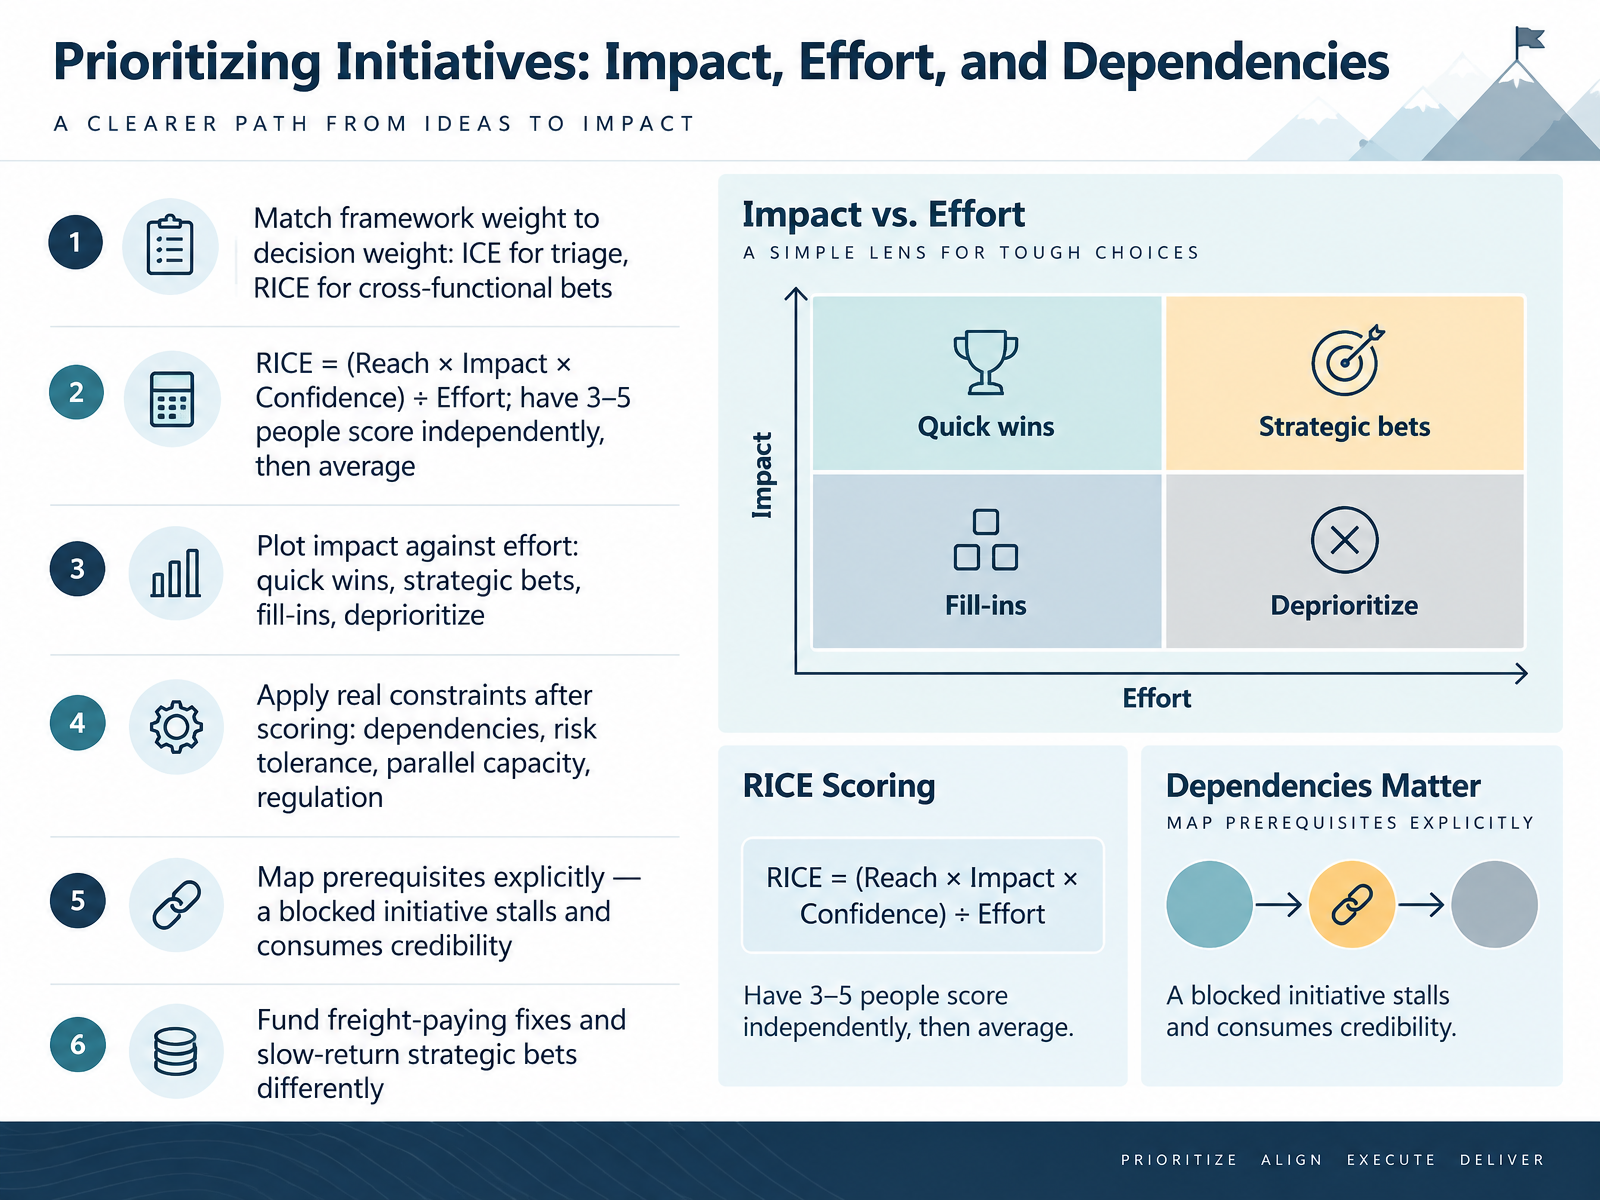
 - 08Prioritizing Initiatives: Impact, Effort, and DependenciesNow that we have a candidate list, the work shifts to prioritization. The rule we use is simple: match the weight of the framework to the weight of the decision. Use ICE for quick triage, and reserve RICE for cross-functional bets. RICE equals Reach times Impact times Confidence, divided by Effort. Have three to five people score independently, then average the scores. That reduces individual bias. Plot impact against effort and sort the results into quick wins, strategic bets, fill-ins, and the ones we deprioritize. Then apply real constraints after scoring: dependencies, risk tolerance, parallel capacity, and regulation. Map prerequisites explicitly, because a blocked initiative stalls and burns credibility. Finally, fund freight-paying fixes and slow-return strategic bets differently. Next, we look at the enablers underneath this roadmap: technology and data, and how we sequence the stack.
 1 min
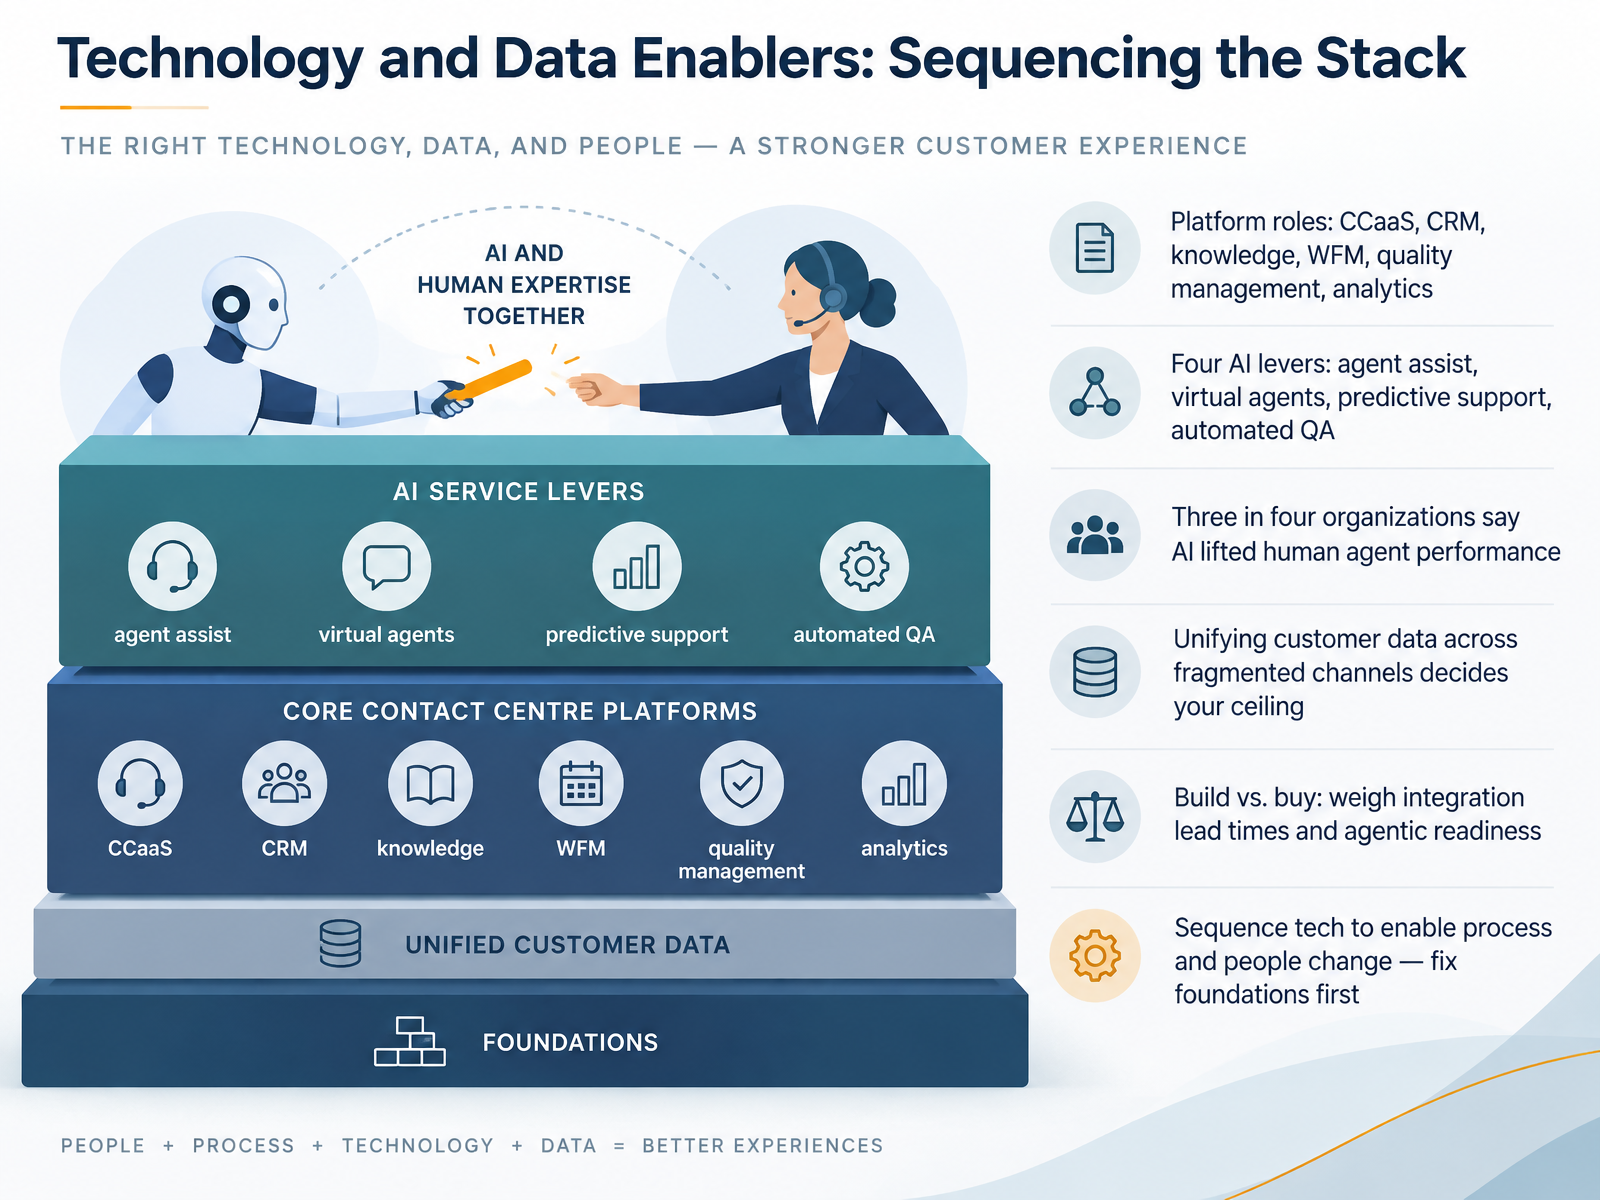
1 min - 09Technology and Data Enablers: Sequencing the StackNow let's sequence the technology and data that make the roadmap real. Think of the stack in three layers. The platform layer covers C C a a S, C R M, knowledge, workforce management, quality management, and analytics. These are the systems your agents and supervisors touch every day, so integration lead times and data readiness here determine what you can actually deploy later. Above that sit four A I levers: agent assist, virtual agents, predictive support, and automated quality assurance. Sequence them deliberately. Agent assist and automated Q A usually mature fastest, because they improve the human path before you ask A I to own the interaction. Virtual agents and predictive support come next, once knowledge and data are trustworthy. The evidence is clear here: three in four organizations say A I has lifted human agent performance. And unifying customer data across fragmented channels decides your ceiling. If data is scattered, every A I use case inherits that fragmentation. On build versus buy, weigh integration lead times and agentic readiness. Buying often shortens time to value. Building gives control, but only if you can staff and maintain it. The principle: sequence technology to enable process and people change. Fix foundations first. Next, we turn to the people side, in People, Skills, and the Hybrid Operating Model.
 deloittedigital.comverint.compuzzel.com+22 min
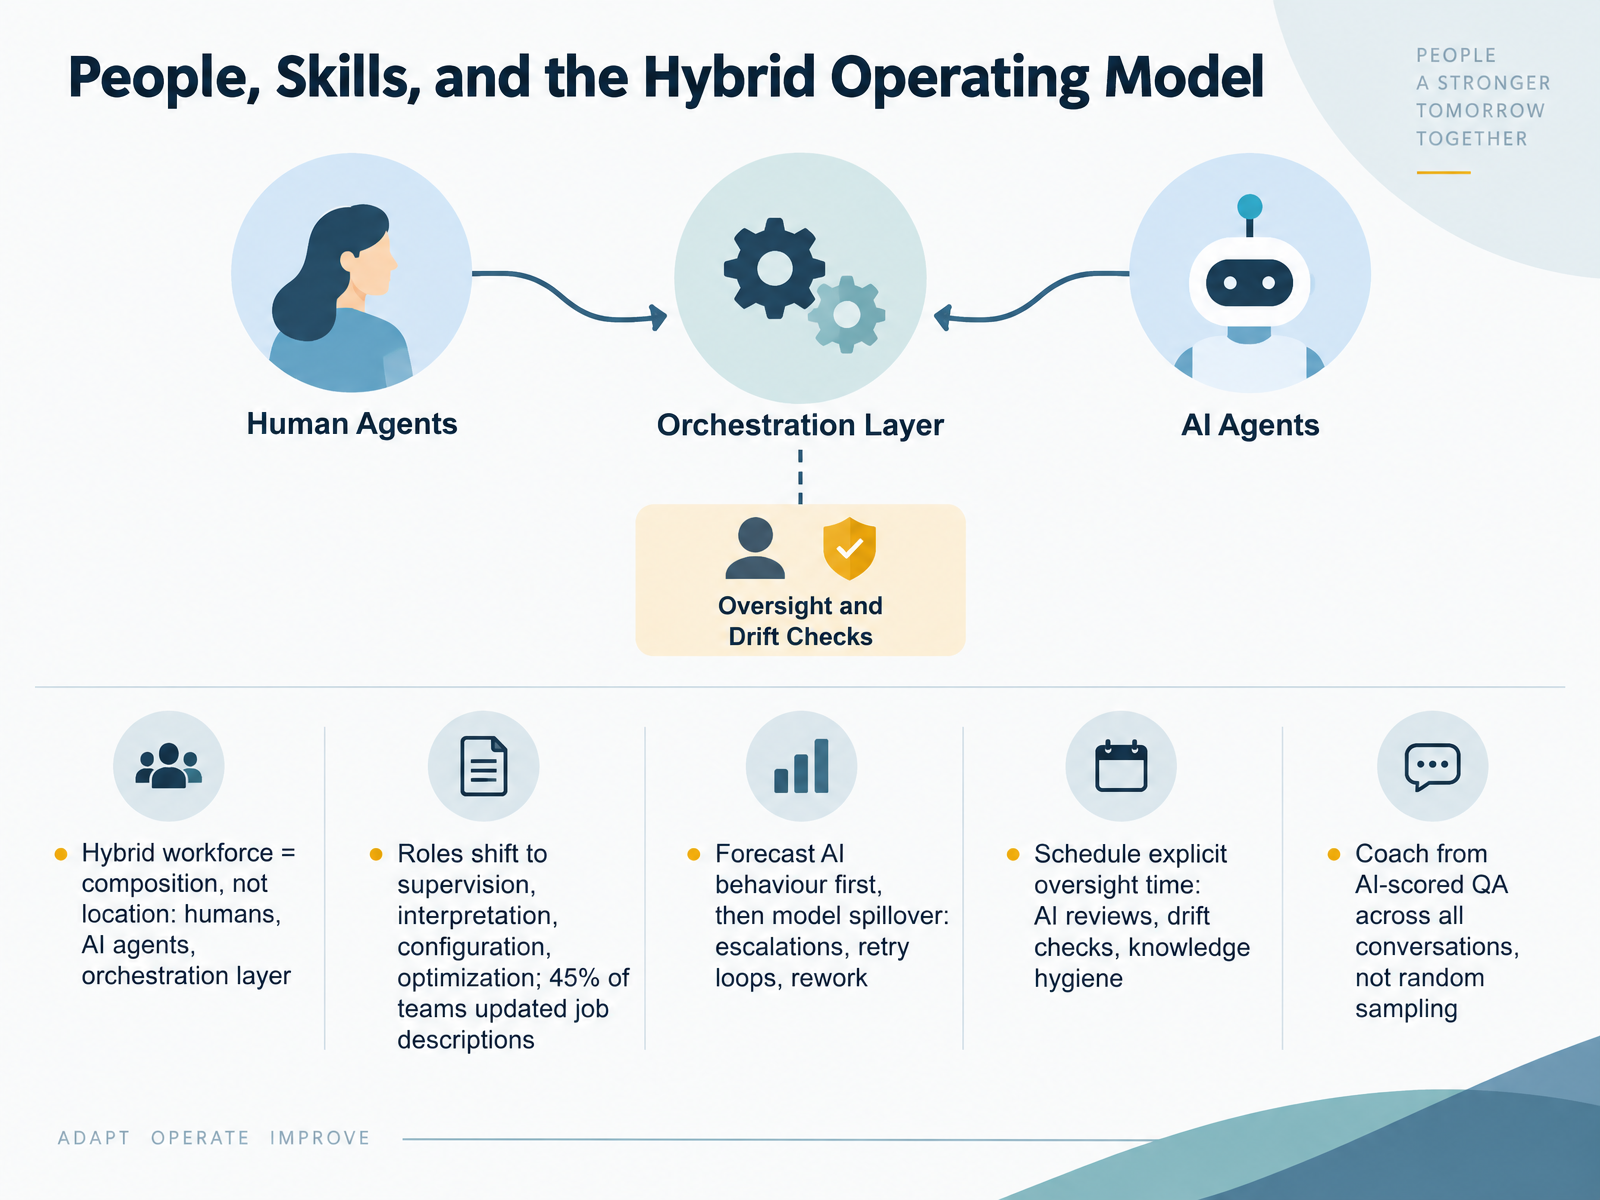
 - 10People, Skills, and the Hybrid Operating ModelLet's talk about the people side of the roadmap, because the hybrid operating model changes who does what. Hybrid here means composition, not location: humans, AI agents, and the orchestration layer that routes work between them. That reshapes roles toward supervision, interpretation, configuration, and optimization. Forty-five percent of teams have already updated job descriptions to reflect this. So when we forecast, we forecast AI behaviour first, then model the spillover: escalations, retry loops, and rework. Build explicit oversight time into schedules for AI reviews, drift checks, and knowledge hygiene. And coach from AI-scored quality assurance across all conversations, not random sampling, so one-to-one time goes to the outliers. That is the operating model. Next, we turn to Governance, Funding, and the Business Case.
 2 min
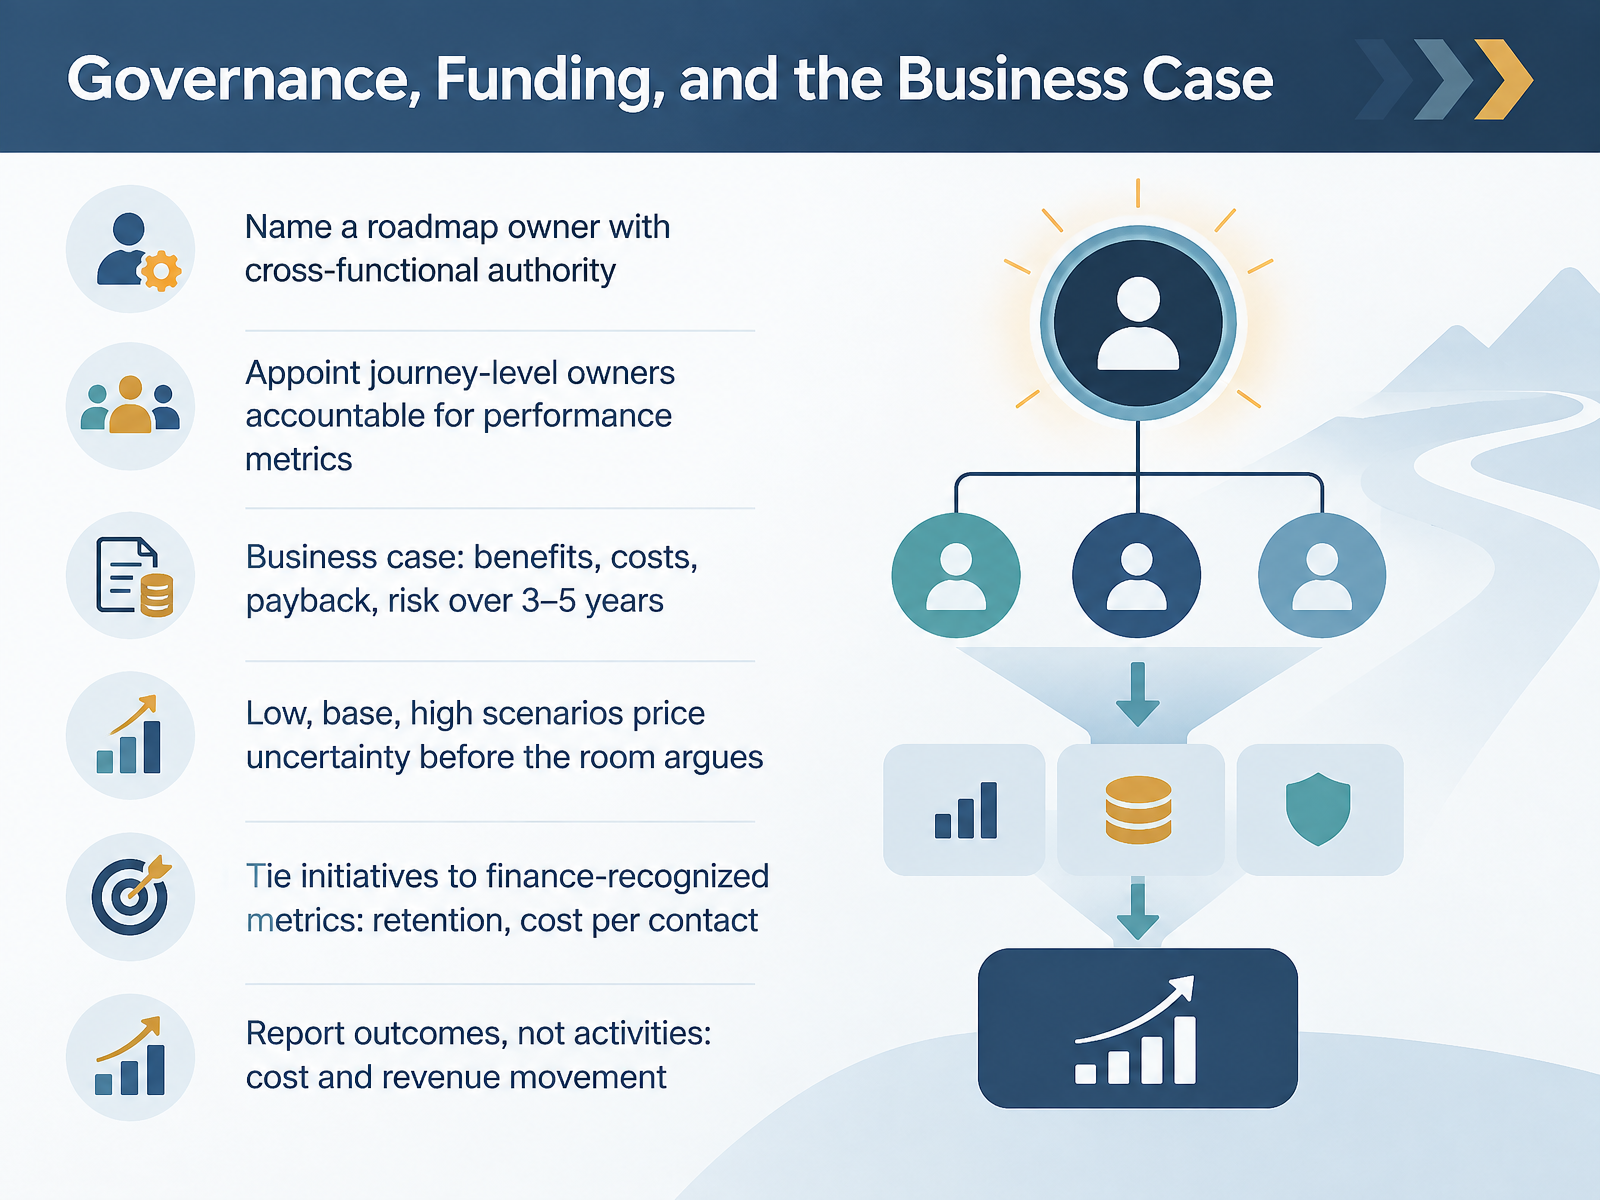
2 min - 11Governance, Funding, and the Business CaseLet's talk about governance, funding, and the business case. This is where good roadmaps either get resourced or quietly stall. First, name a single roadmap owner with cross-functional authority. Then appoint journey-level owners who are accountable for performance metrics, not just design. Without that, diagnosis turns into documentation. On the business case, cover benefits, costs, payback, and risk across three to five years. Price uncertainty before the room argues: low, base, and high scenarios. Tie each initiative to finance-recognized metrics like retention and cost per contact. And report outcomes, not activities. Show cost and revenue movement, not workshop counts. That is what keeps funding attached and accountability visible. Next, we move into rollout, adoption, and change management.
 theydo.comqiscus.comicx.co+22 min
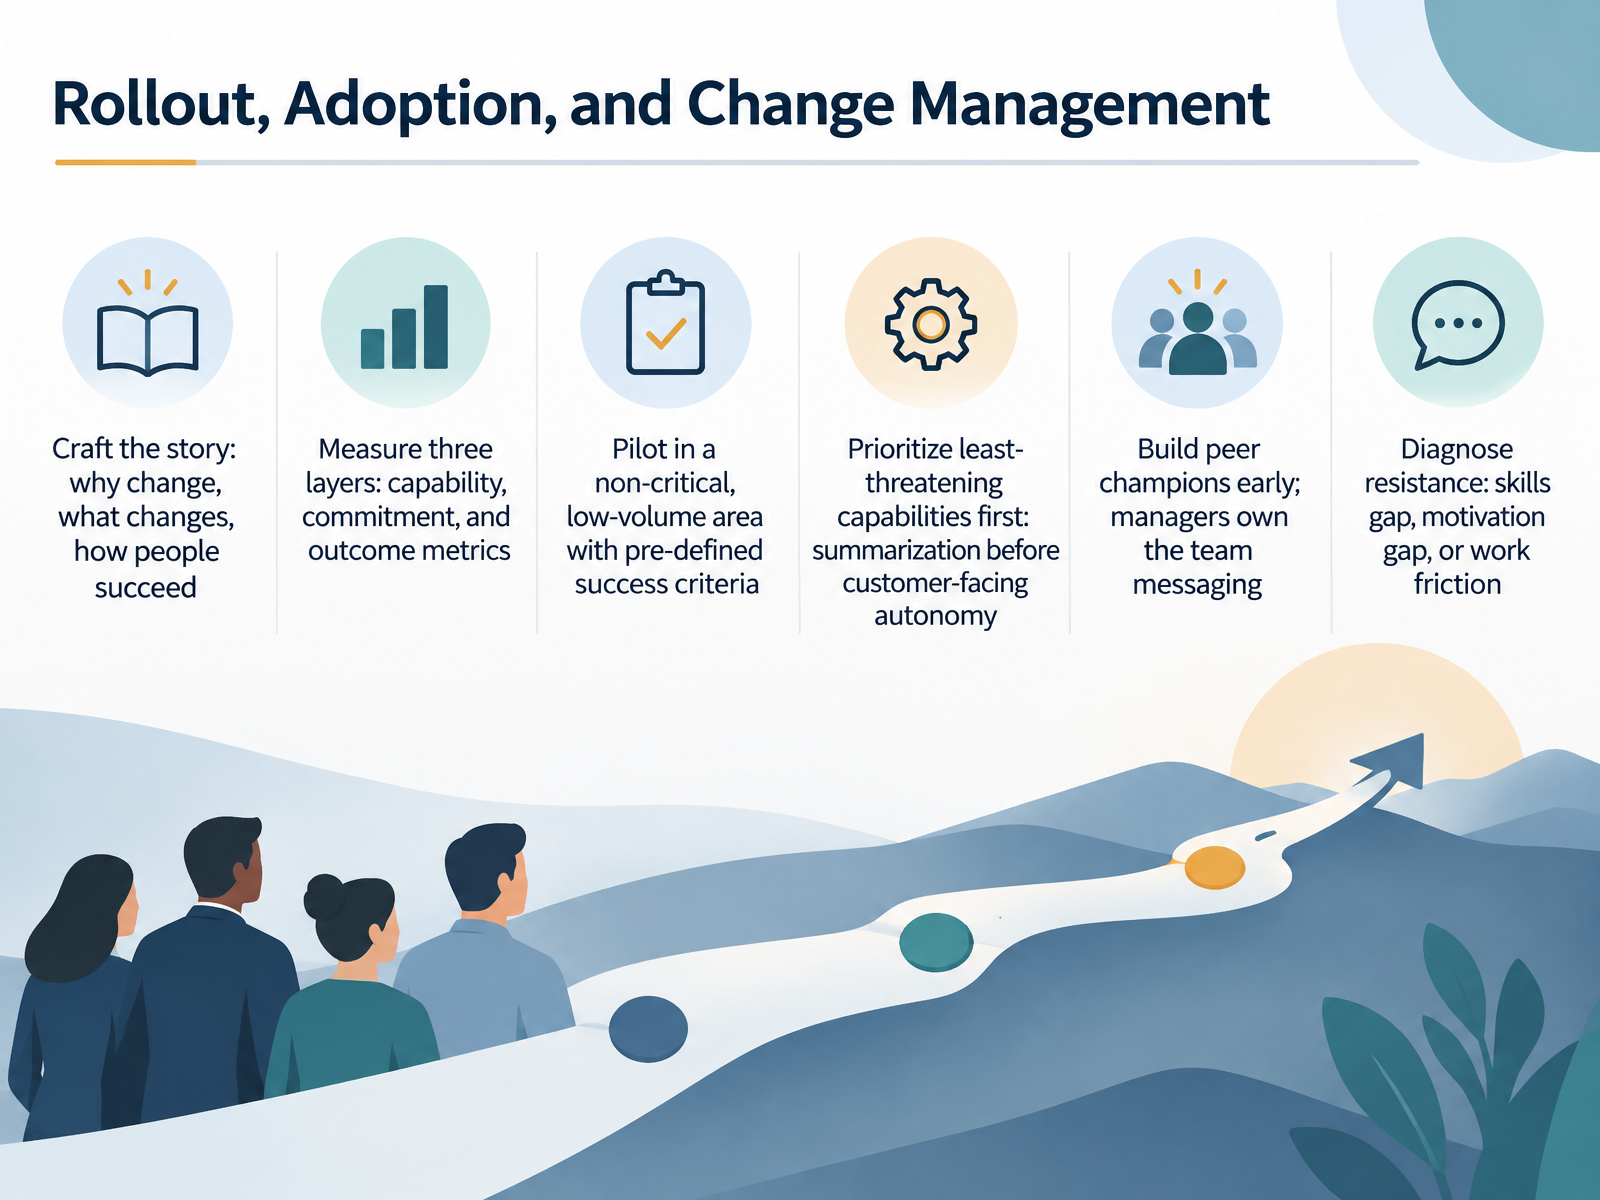
 - 12Rollout, Adoption, and Change ManagementLet's talk about rollout, adoption, and change management. This is where most roadmaps stall, so we treat it as a workstream, not an announcement. Start by crafting the story: why we are changing, what changes for each role, and how people will be set up to succeed. Then measure three layers: capability, commitment, and outcome metrics. Capability tells us whether agents can use the tool. Commitment tells us whether they will. Outcomes tell us whether the business case holds. Pilot in a non-critical, low-volume area with success criteria defined before you start, and prioritize the least-threatening capabilities first. Summarization before customer-facing autonomy is the classic example. Build peer champions early, and let managers own the team messaging. When resistance shows up, diagnose it honestly: a skills gap needs targeted training, a motivation gap needs input and airtime, and work friction needs processes and roles fixed. Get that diagnosis right, and adoption follows. Next, we look at review cadence, keeping the roadmap alive.
 2 min
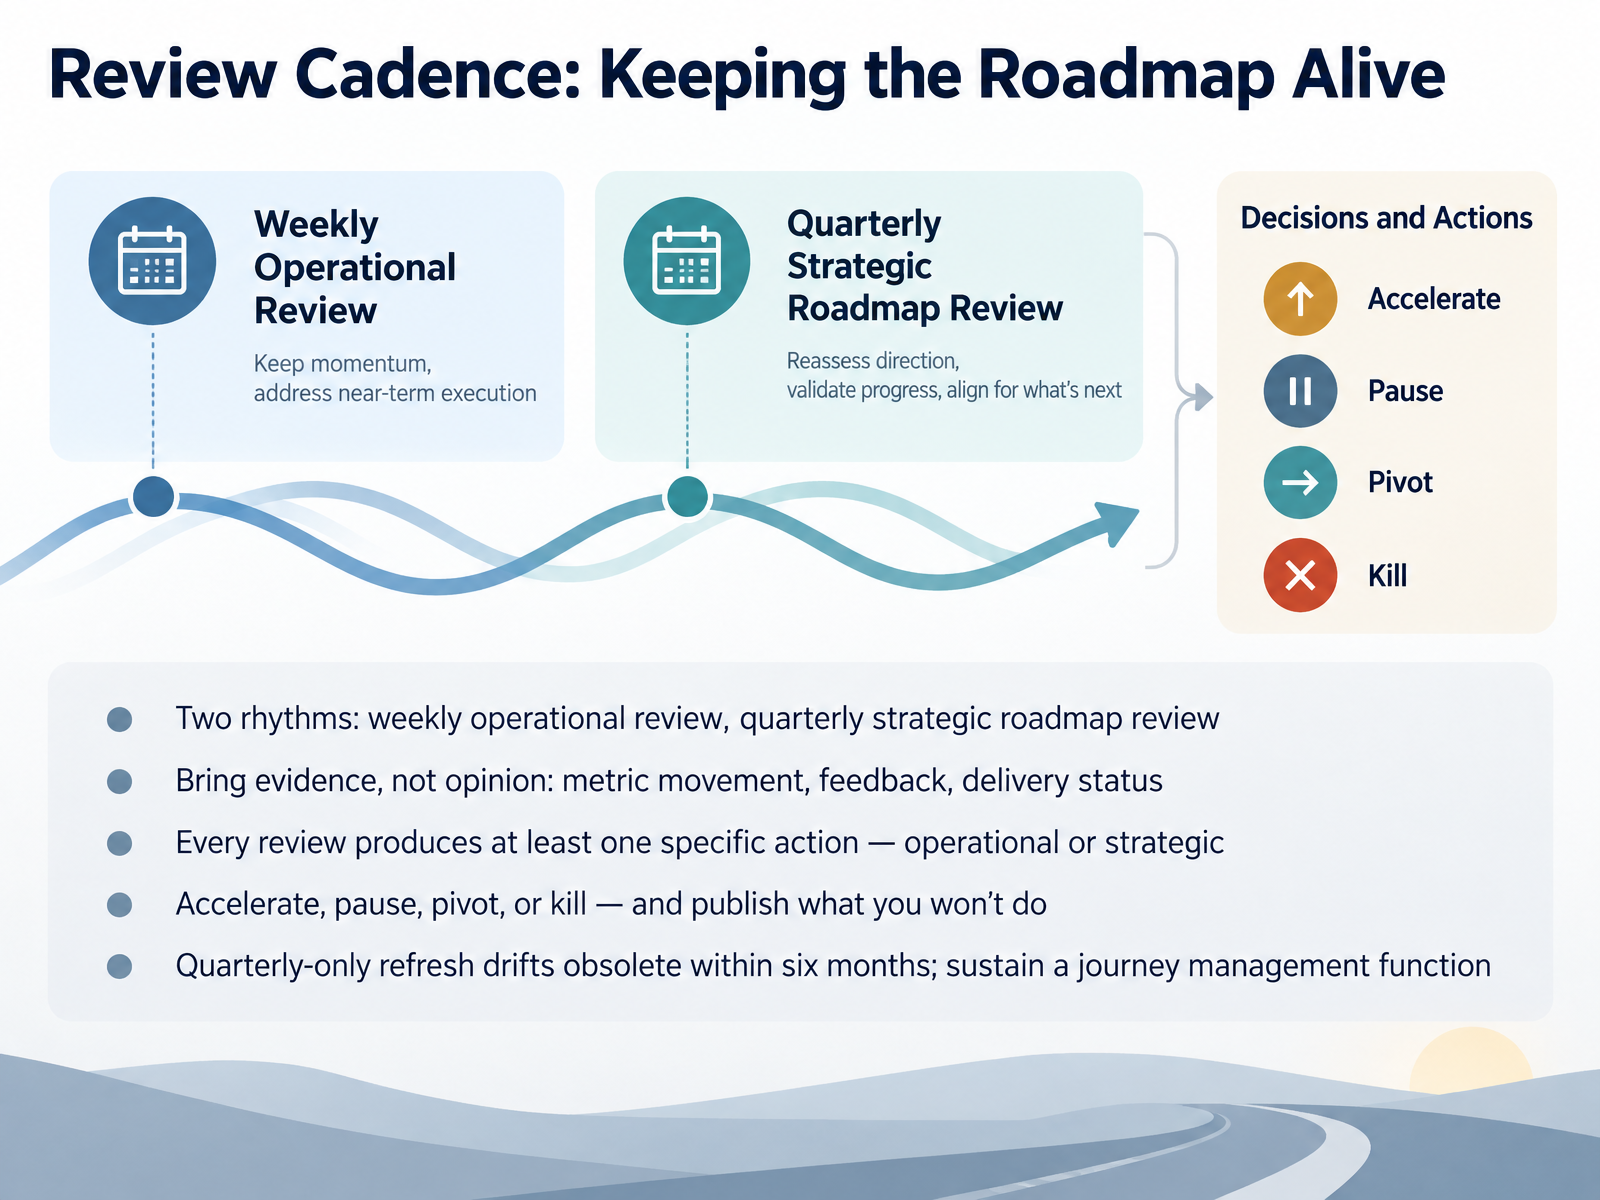
2 min - 13Review Cadence: Keeping the Roadmap AliveLet's talk about review cadence, because a roadmap that isn't reviewed isn't a roadmap. We run two rhythms. Weekly, we review operations: handle time, escalation volume, staffing against forecast, the delivery status of what's in flight. Quarterly, we review the roadmap itself. Both reviews run on evidence, not opinion. Bring metric movement, customer feedback, and delivery status. And every review ends with at least one specific action, operational or strategic. Then we make the hard call. We accelerate, pause, pivot, or kill work. Killing is the discipline most teams avoid, so publish what you won't do and hold that line. One more thing worth saying plainly: a quarterly-only refresh drifts obsolete within six months. Sustain a journey management function that owns the cadence between reviews. That's how the roadmap stays alive. Next, we bring it together in the capstone: assembling your twelve to thirty-six month service roadmap.
 theydo.comqiscus.comicx.co+22 min
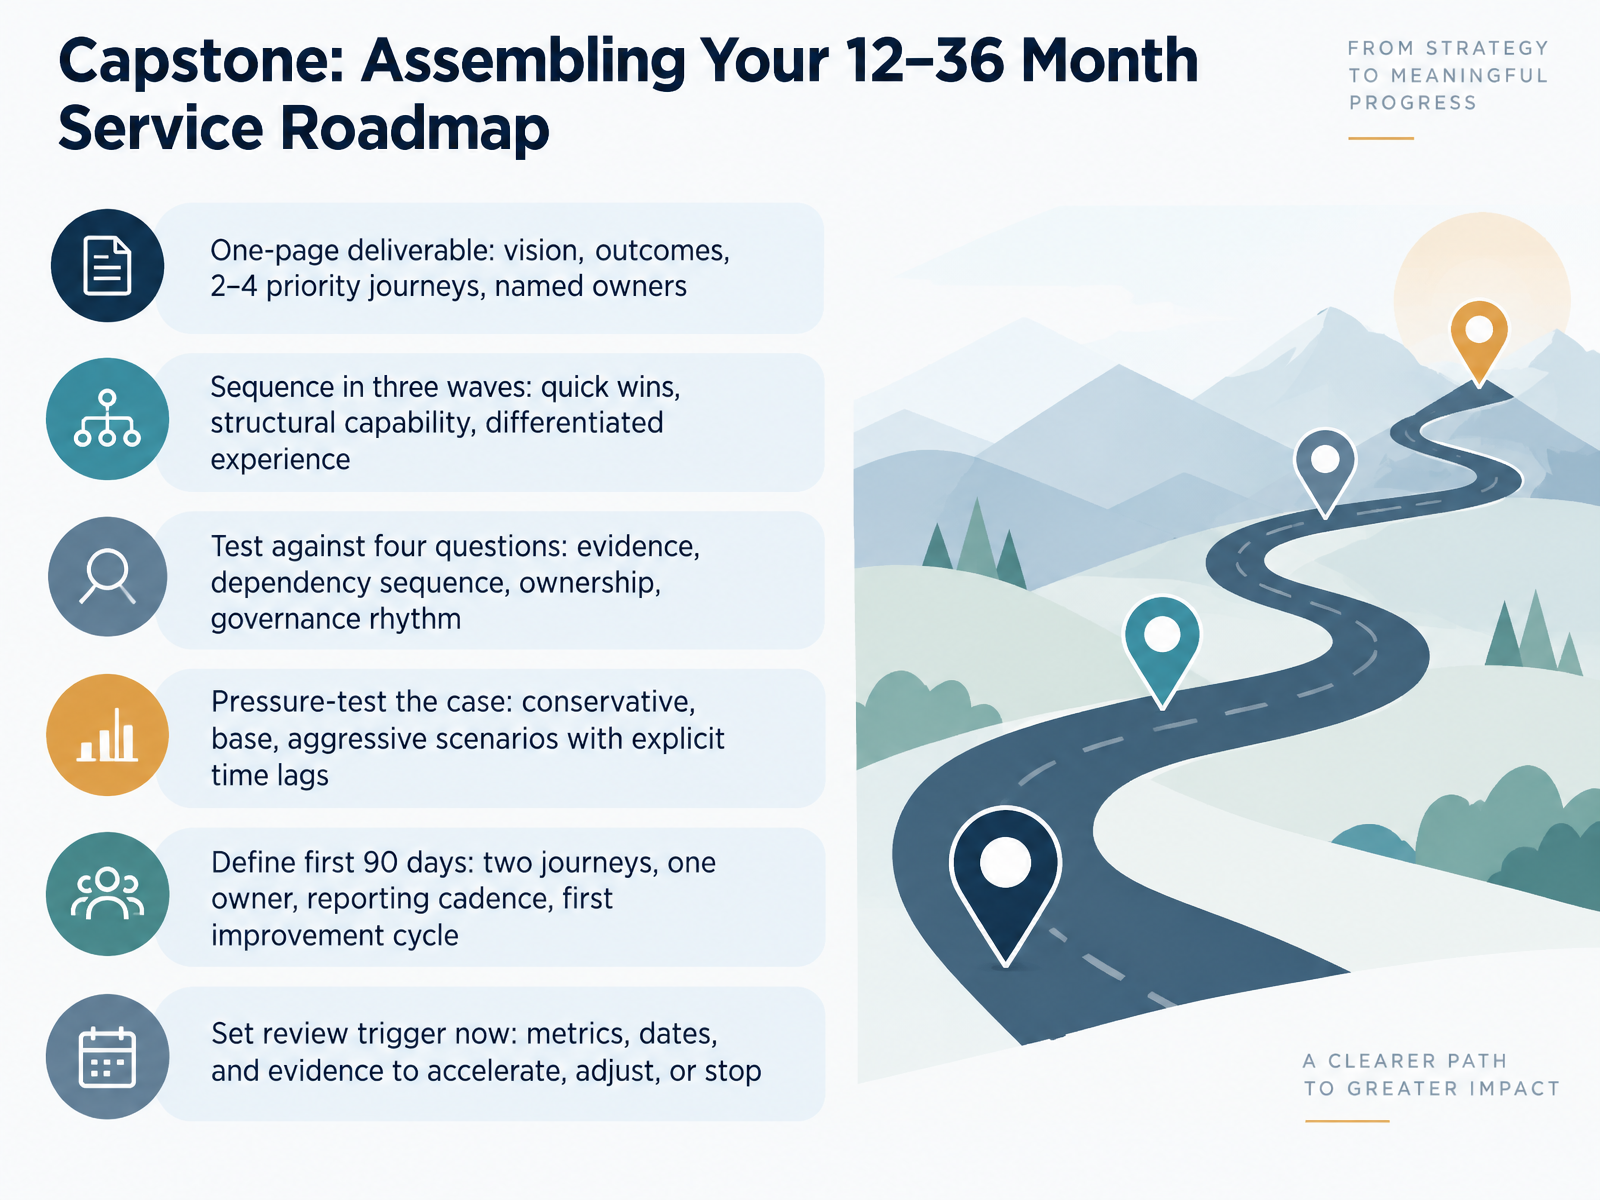
 - 14Capstone: Assembling Your 12–36 Month Service RoadmapLet's close by assembling everything into one page. Your twelve to thirty-six month roadmap should fit on a single sheet: the vision, the outcomes, two to four priority journeys, and a named owner for each. Name the person, not the department, because ownership only works when a name sits beside the journey. Then sequence the work in three waves. Quick wins first, to build momentum. Structural capability second: data, tooling, and process. Differentiated experience last, once the foundations hold. Test the plan against four questions. Is there evidence behind each claim? Does the dependency sequence actually work? Does every initiative have an owner? And does the governance rhythm match the pace of delivery? Pressure-test the case with conservative, base, and aggressive scenarios, and state the time lags explicitly, because savings rarely arrive in the same quarter as spending. For the first ninety days, keep it narrow: two journeys, one owner, a reporting cadence, and one improvement cycle. Finally, set the review trigger now. Decide which metrics, dates, and evidence would cause you to accelerate, adjust, or stop. That discipline is what keeps funding and credibility intact. Thank you for working through this with me. You have the diagnosis, the sequencing logic, and the governance model. Start with two journeys, name one owner each, and let the first cycle prove the model. You're ready to build it.
 theydo.comqiscus.comicx.co+22 min
Take the deck with you
Download this course as a file — free, no sign-up needed.
- PDF handoutEvery slide page, ready to print or share.15 pages · 3.1 MBDownload
- Narrated PowerPointThe deck that presents itself — every slide carries the digital human's narration video.15 pages · 14.2 MBDownload
- PowerPoint slidesThe full deck as a .pptx — open it in PowerPoint, Keynote, or Google Slides.15 pages · 3.1 MBDownload
Free to use in your own training — please keep the PersonWise credit page at the end.
Have your own deck? Turn it into a course
Sources consulted
Web sources consulted while building this course.
- Get the 2026 Gartner® Strategic Roadmap for Customer Service Journey Management — Complimentary Access — theydo.com
- How to Build a Customer Service Strategy: A Complete Framework — qiscus.com
- Plan an end-to-end CX Transformation Program in 2026 — icx.co
- Customer Experience Strategy Roadmap for 2026 — Renascence — renascence.io
- 8 Ways to Transform Customer Service Strategy in 2026 - Klaviyo — klaviyo.com
- 2026 Global Contact Center Survey — deloittedigital.com
- The State of Contact Center AI 2026 | Verint — verint.com
- Contact — puzzel.com
- The 2026 Customer Service Transformation Report — assets.ctfassets.net
- Frost Radar : Intelligent Virtual Agents for Customer Experience, — resources.nice.com
- 2025/26 UK Contact Centre KPI Benchmark Report | MaxContact — maxcontact.com
- BENCHMARKING — go.maxcontact.com
- Contact Center Benchmarks 2026 | Annual Natterbox Study — natterbox.com
- Call Centre Metrics: How to Measure Contact Centre Performance — maxcontact.com
- Call Center KPI Benchmarks By Industry (2026) | AmplifAI — amplifai.com
- Lead Customer Service Journey Mapping Efforts That Drive Action — emt.gartnerweb.com
- Customer Effort Score (CES): Calculation, Research, and Practical Guide | SI Labs — si-labs.com
- Service design for a holistic customer experience: a process framework — exa.ai
- How does journey mapping improve service design? — pedowitzgroup.com
- How to Create a Customer Journey Map: Improve CX - Workflow™ — servicenow.com