Customer Education Metrics Mastery
Begin
14 pages · ~28 min
Customer Education Metrics Mastery
Learn to measure and interpret key customer education metrics to demonstrate training impact and optimize learning programs. Ideal for education managers and L&D professionals.
What you’ll learn
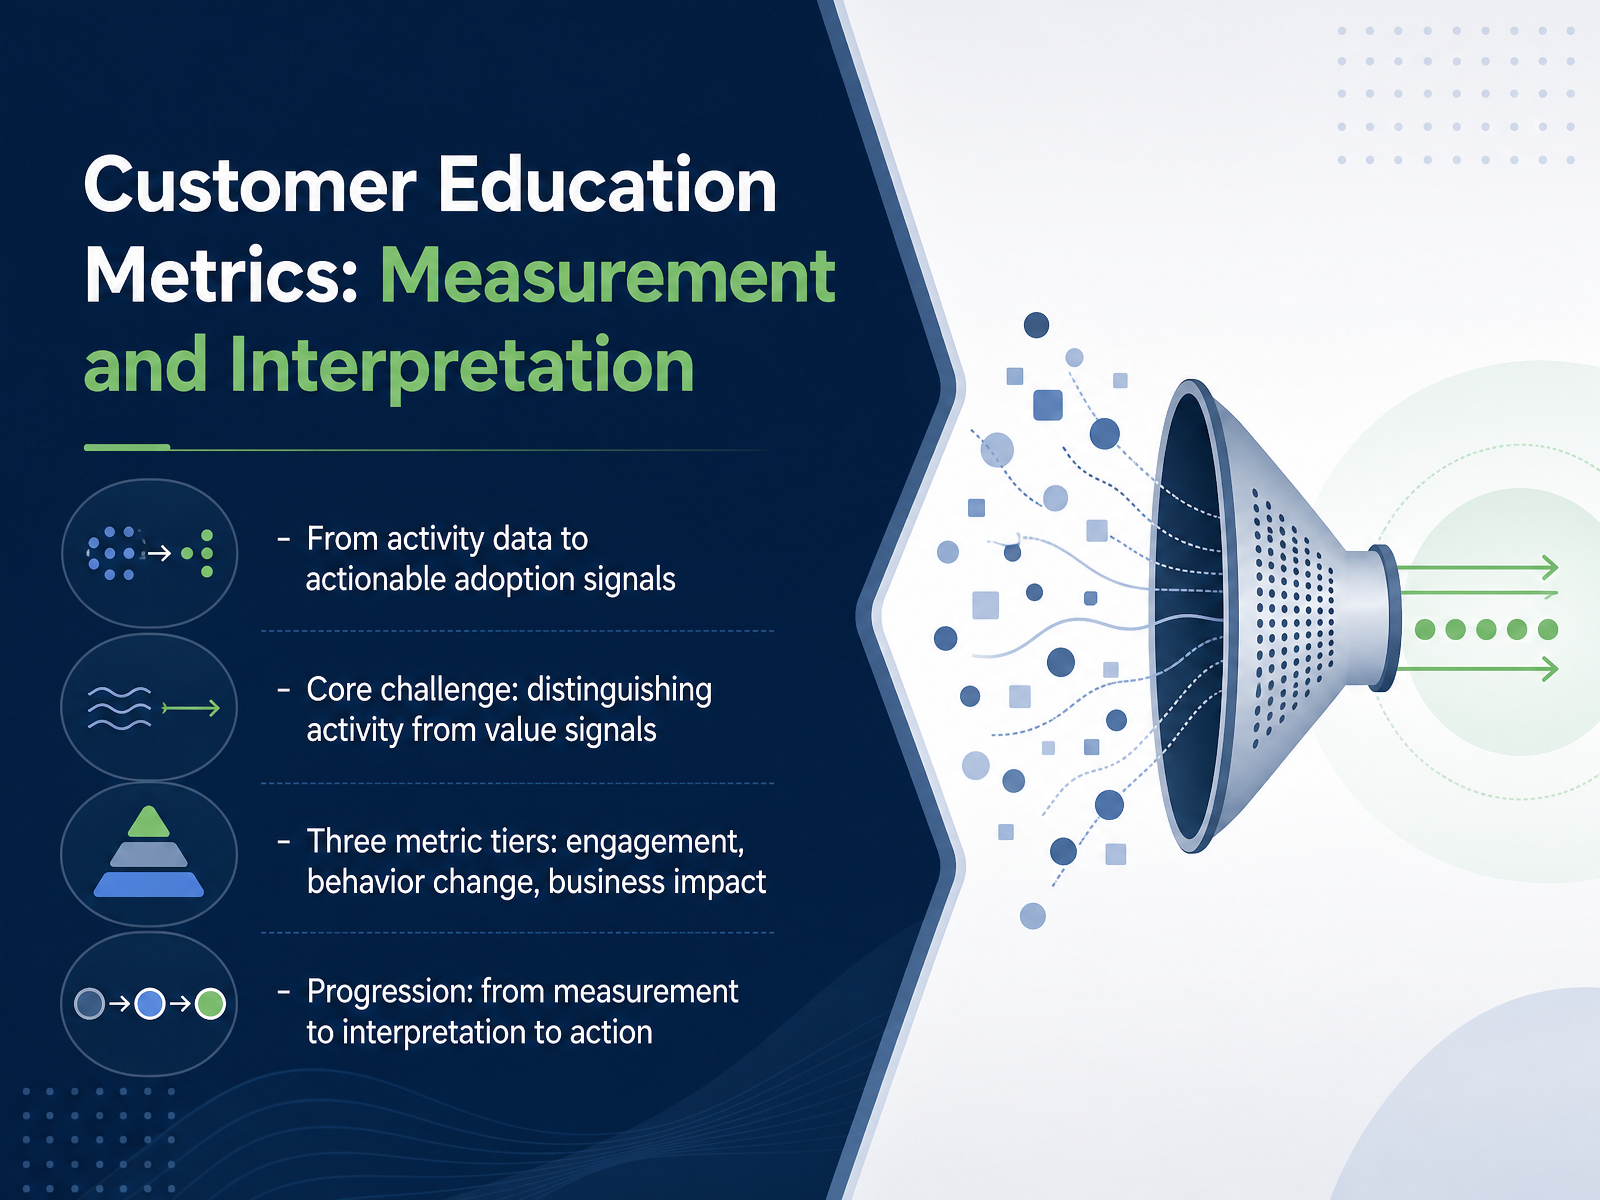
- 01Customer Education Metrics: Measurement and InterpretationWelcome. If you lead customer education or customer success, you already know the challenge: we generate plenty of activity data, but turning that into actionable adoption signals is where the real work begins. The core challenge is distinguishing activity from value. Completion rates tell you someone finished a course; they don't tell you if that person adopted the product, opened fewer tickets, or stayed longer. To get those answers, you need a framework. We'll use three tiers. Engagement metrics show if learners show up. Behavior change metrics show if they do things differently. Business impact metrics show if the numbers leadership cares about actually move. Think of adoption rate, ticket deflection, and retention. The progression is measurement, then interpretation, then action. You'll learn to move beyond activity and connect learning to outcomes. That's the path we'll walk in this session. Next, we'll confront a common trap: why completion rates mislead leaders.trainn.coseertechsolutions.comcheck-n-click.com+21 min
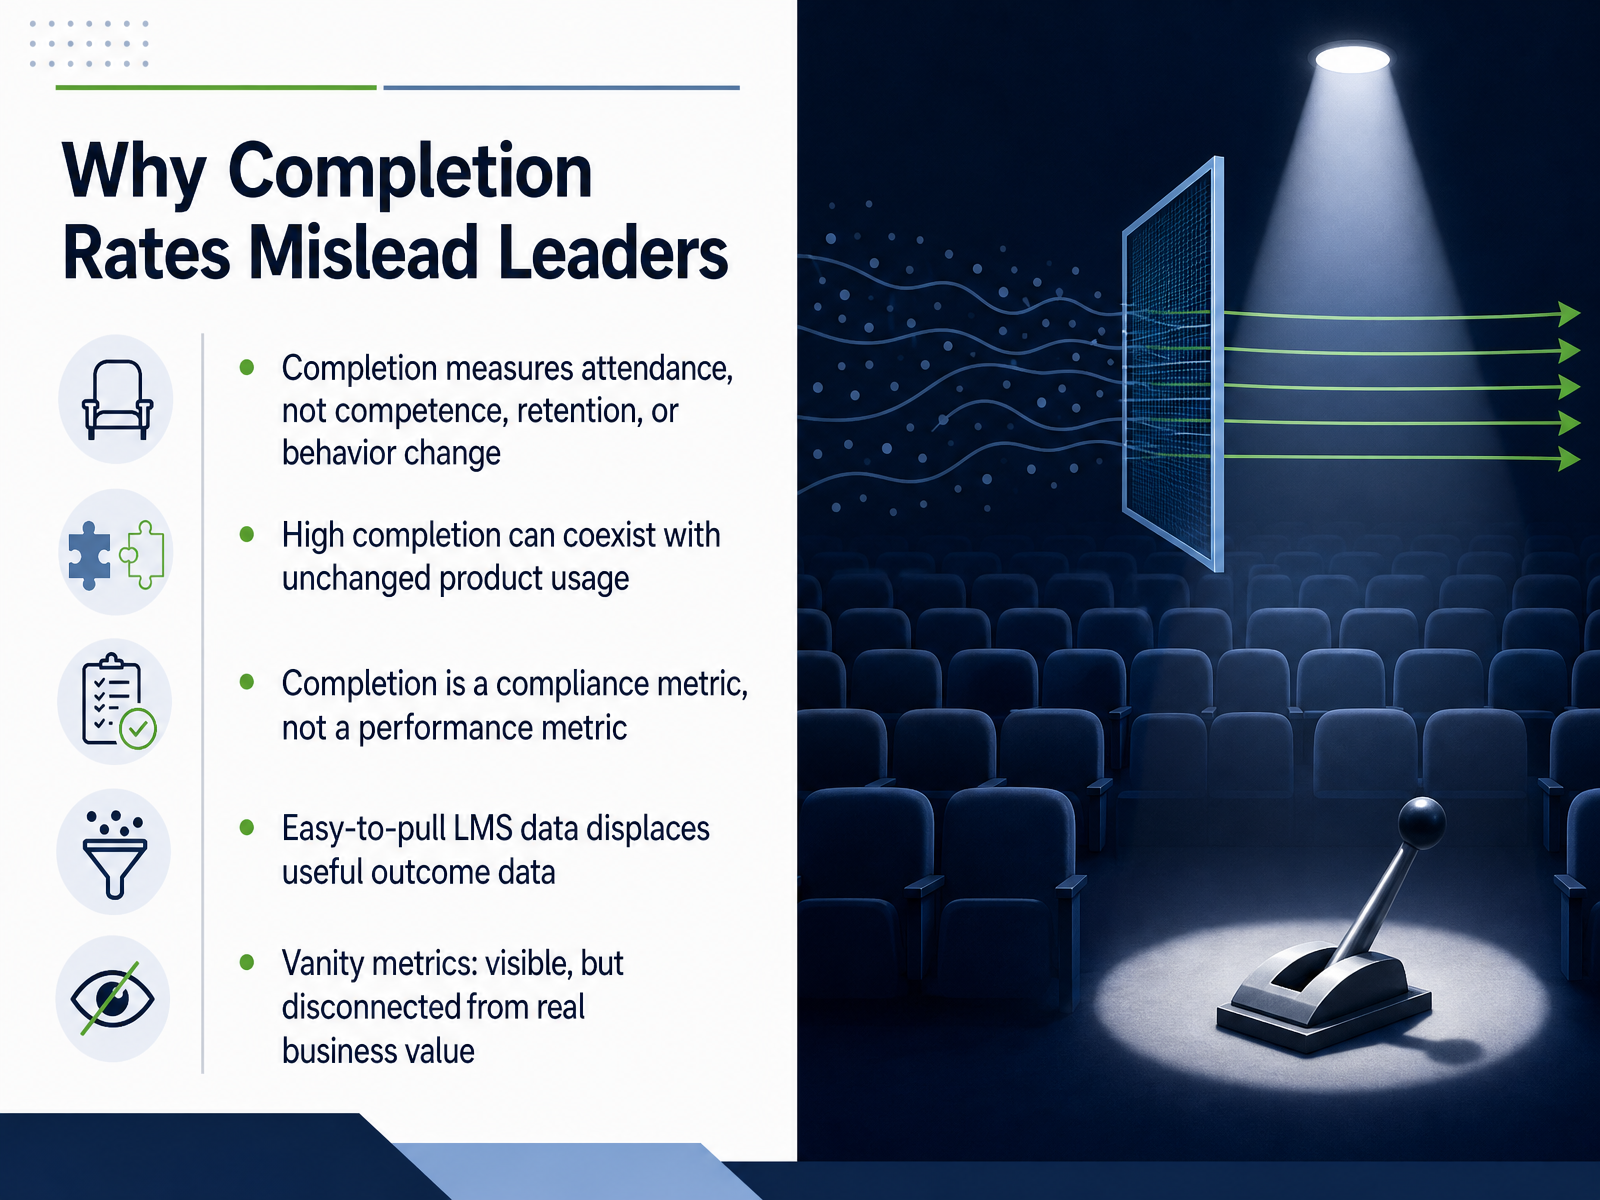
- 02Why Completion Rates Mislead LeadersBefore we dive into the tiers, let's address the number that dominates most dashboards: the completion rate. It's a compliance metric, not a performance metric. It measures attendance, not competence, retention, or behavior change. We have all seen perfect completion coexisting with unchanged product usage. The data is easy to pull, and that ease is the trap. Easy-to-generate LMS data displaces the outcome data you actually need. This is why we call completion a vanity metric. It's visible, but disconnected from real business value. Treat it as an administrative record, not a learning outcome. The real signal lives elsewhere. High completion simply proves the training was delivered. It says nothing about what changed after it. That is the core problem. Now, let's look at the framework that helps us see what actually matters: the three tiers of customer education metrics.
 qquench.aisleak.aielearningindustry.com+21 min
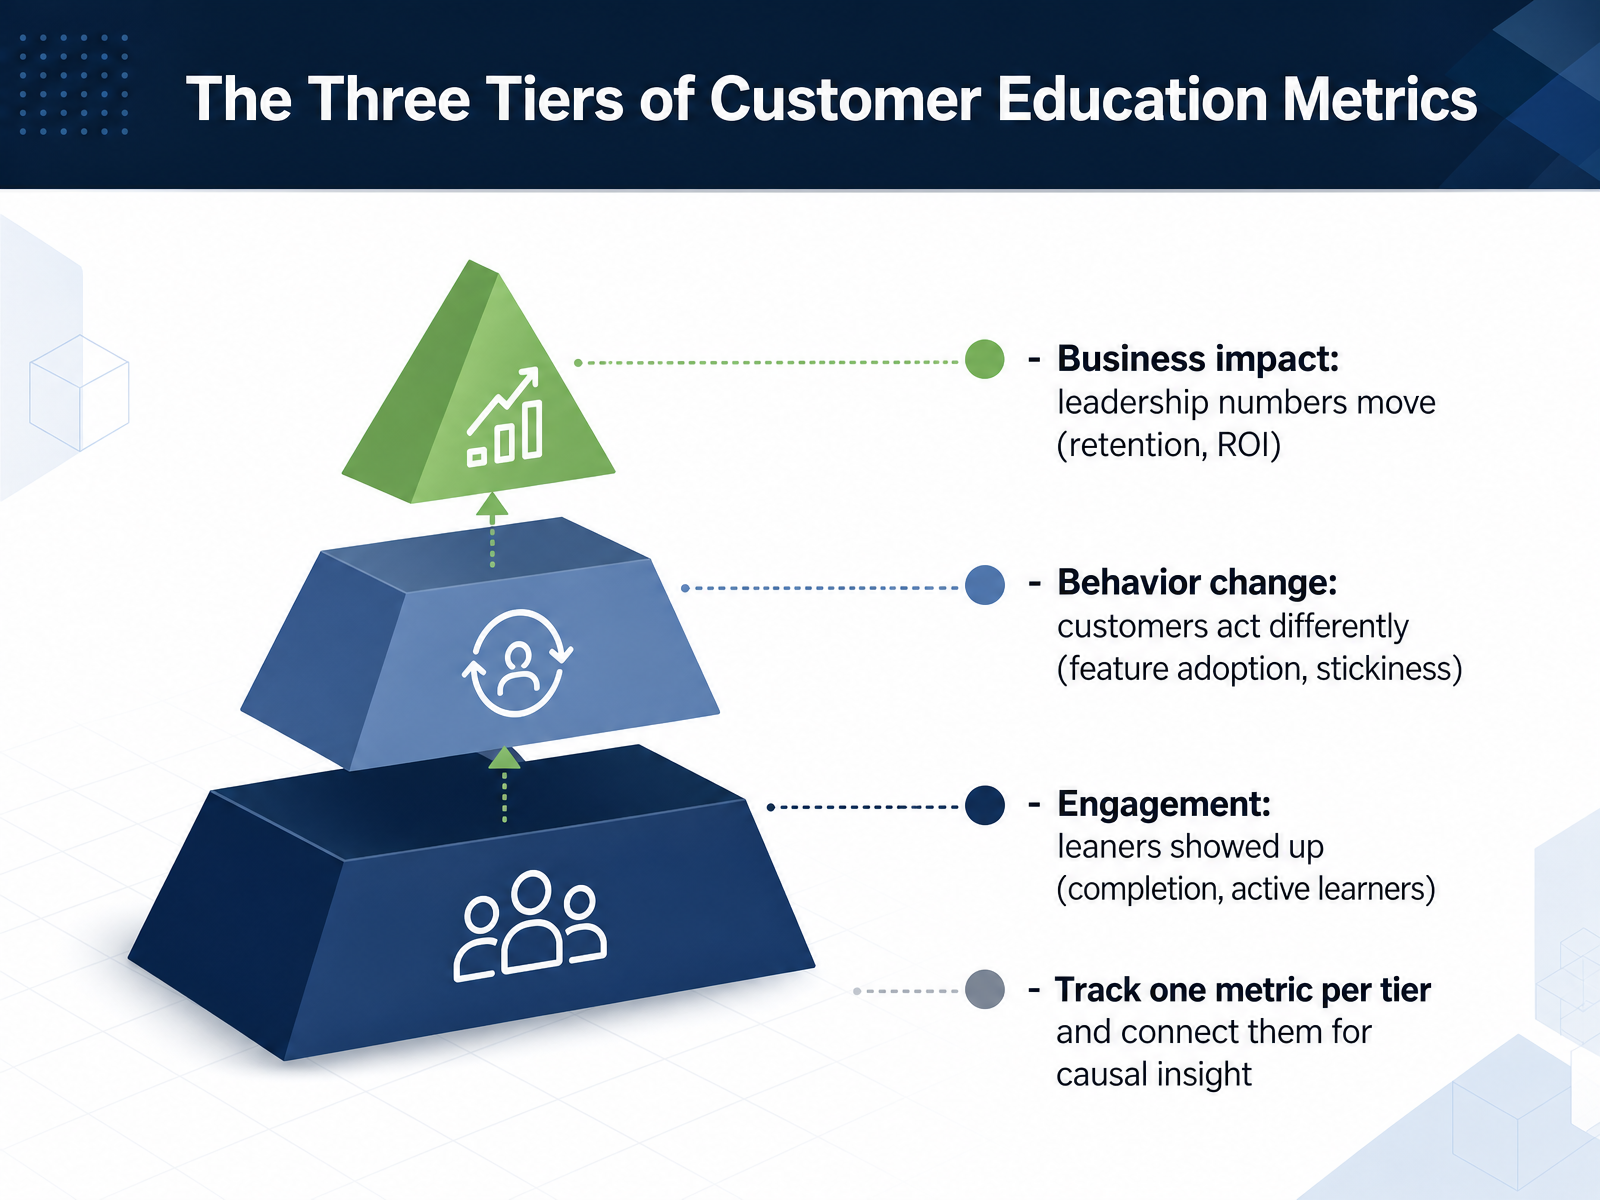
 - 03The Three Tiers of Customer Education MetricsNow let’s look at the three tiers that structure how you measure customer education. Tier one is engagement. This is where most teams live—completion rates and active learner counts. It tells you people showed up. Tier two is behavior change. Are customers actually doing something differently? Track feature adoption and stickiness—did they use what you taught? Tier three is business impact. This is the layer leadership funds: retention, ROI, the numbers that move budgets. Here’s the trap: engagement alone is a leading signal, not an outcome. High completion with flat retention is a story you can’t defend. So track one metric per tier—completion, adoption, retention—and connect them. That connection is where causal insight lives. The accounts that finished onboarding renewed at a higher rate—that’s the sentence that survives a budget review. Start with the business outcome you’re accountable for, then work backward to the behavior and the engagement behind it. Next, we’ll map these metrics to the customer lifecycle.
 trainn.cothoughtindustries.comintellum.com+21 min
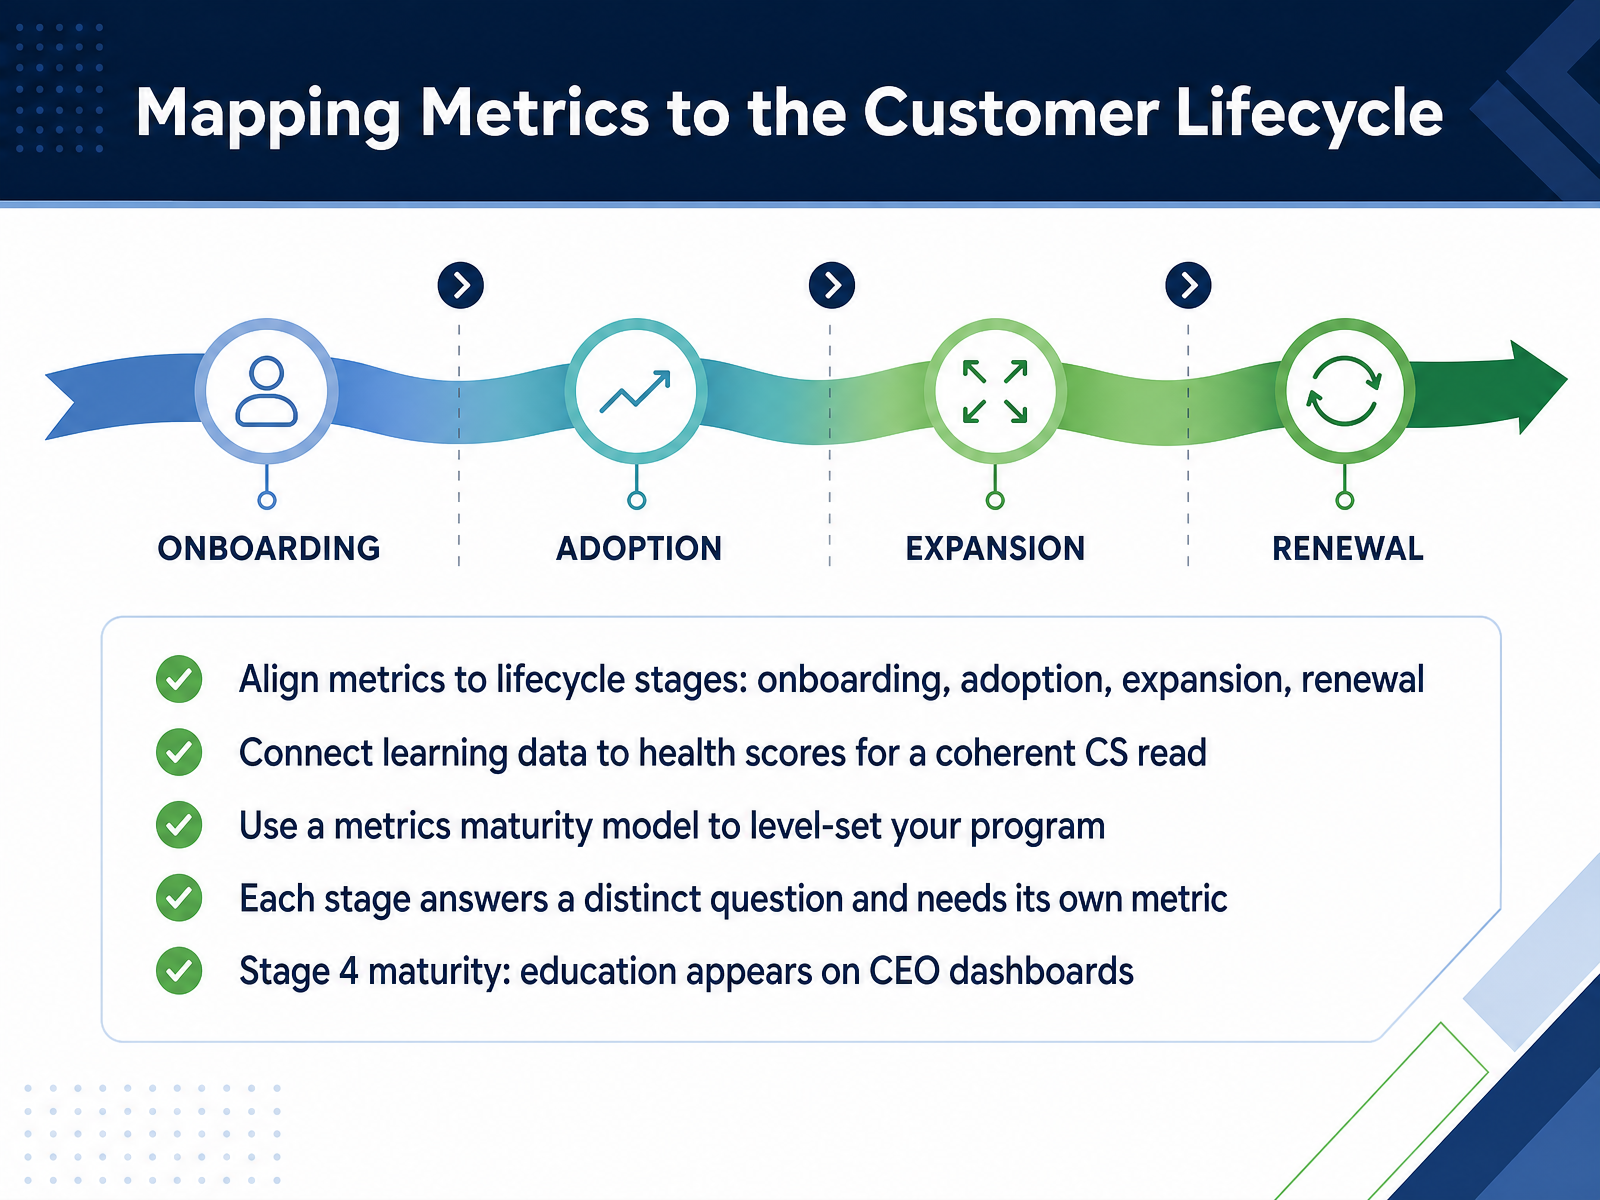
 - 04Mapping Metrics to the Customer LifecycleNow let's map each metric to the right customer lifecycle stage. Onboarding, adoption, expansion, and renewal each answer a distinct business question, and each one needs its own metric. Track your onboarding time-to-value. Track feature adoption for expansion. Track retention and net revenue retention for the renewal conversation. The critical move is connecting learning data to your customer health scores, so your customer success team sees one coherent signal instead of education and health reporting in silos. Most teams sit somewhere on a maturity curve. Early stages focus on content velocity and engagement. But at stage four, you have engineered outcomes. Education appears on the CEO dashboard, and budget ties directly to revenue targets. That is the level where education stops being a cost center and becomes revenue infrastructure. So level-set your program honestly, and build the connection between learning and health first. Next, we dig into the activation and adoption signals that predict retention.
 trainn.cothoughtindustries.comintellum.com+21 min
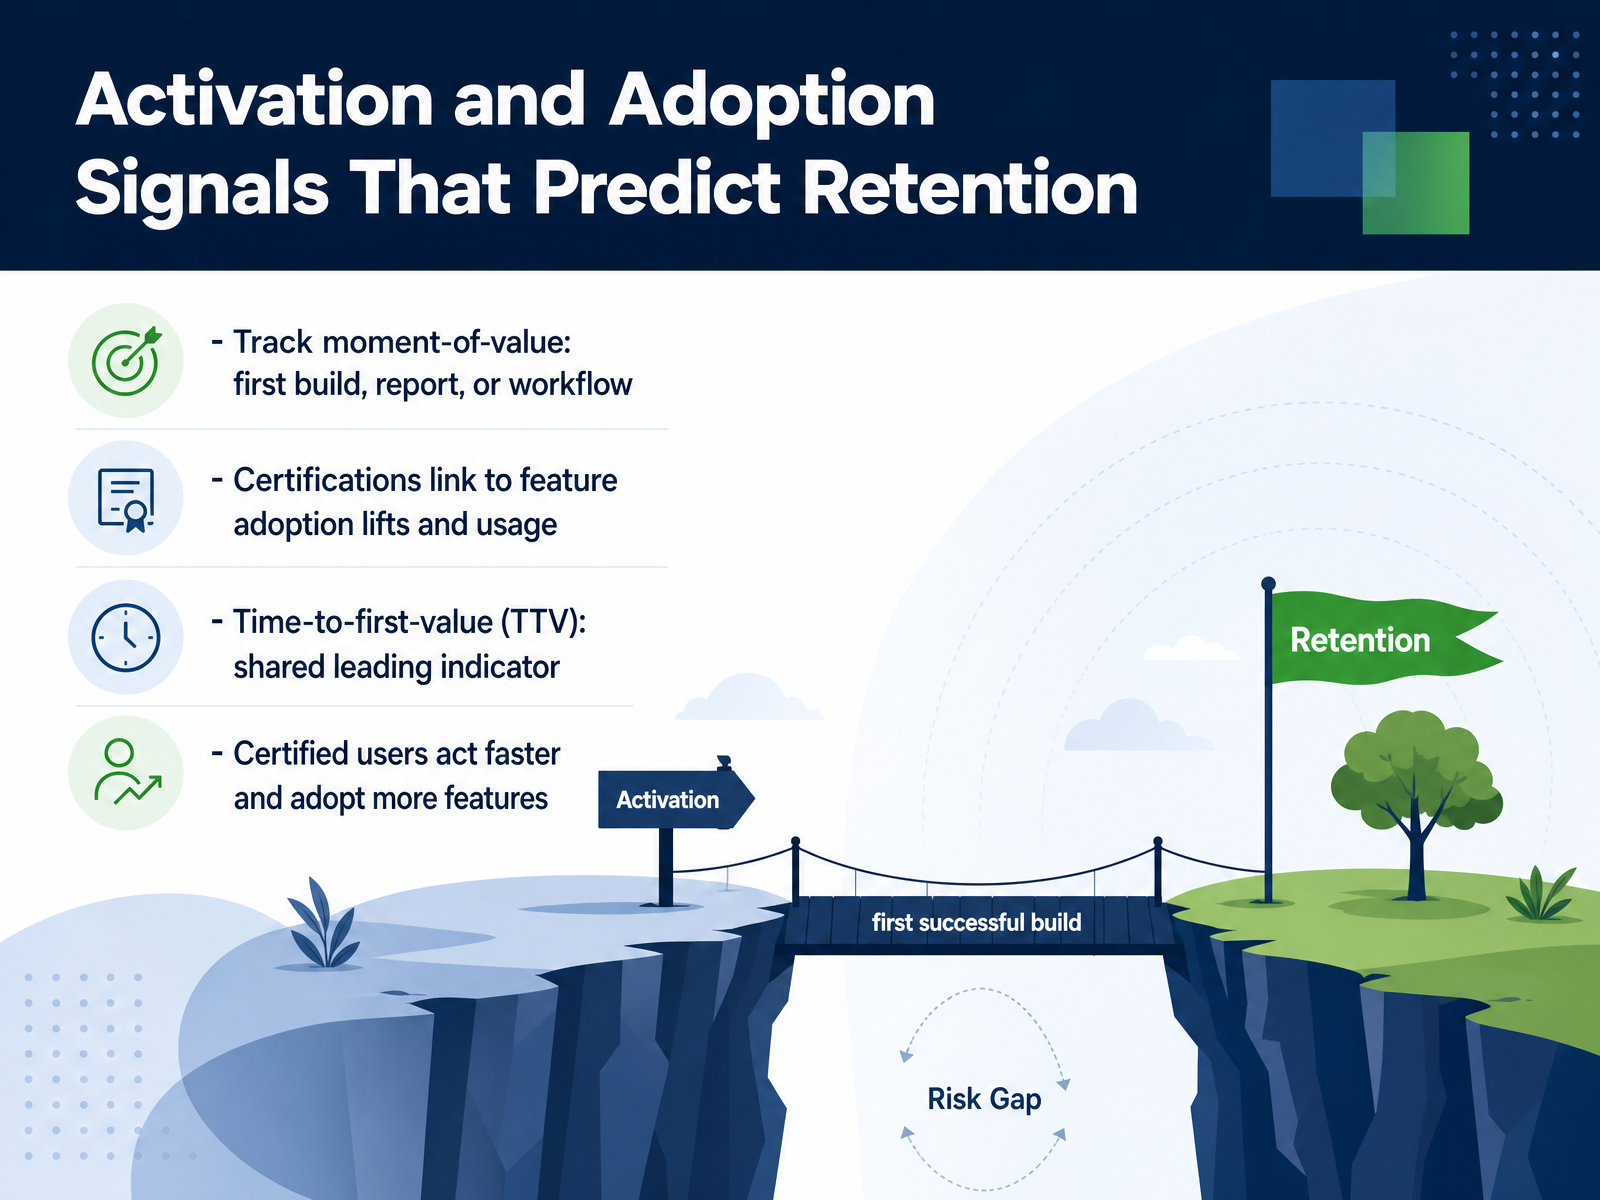
 - 05Activation and Adoption Signals That Predict RetentionNow let's focus on the signals that actually predict retention. Track the moment of value: the first build, the first report, the first completed workflow. That moment tells you more than any completion badge ever will. Certifications deserve special attention here. They consistently link to feature adoption lifts and measurable usage increases. Consider the KINESSO case. Certified users generated their first asset forty-two percent faster than the control group. They also adopted more features at significantly higher rates. Time to first value is your shared leading indicator. It predicts activation, adoption, and ultimately retention. Certified users act faster. They explore more. They stick around. So track time to first value by product area. Segment it by training path. Then compare certified versus non-certified cohorts. That comparison is your proof of impact. Use it to justify more education investment. This brings us to the next question: how do we link course completions directly to product adoption?
 intellum.combrainstorminc.comcandu.ai+21 min
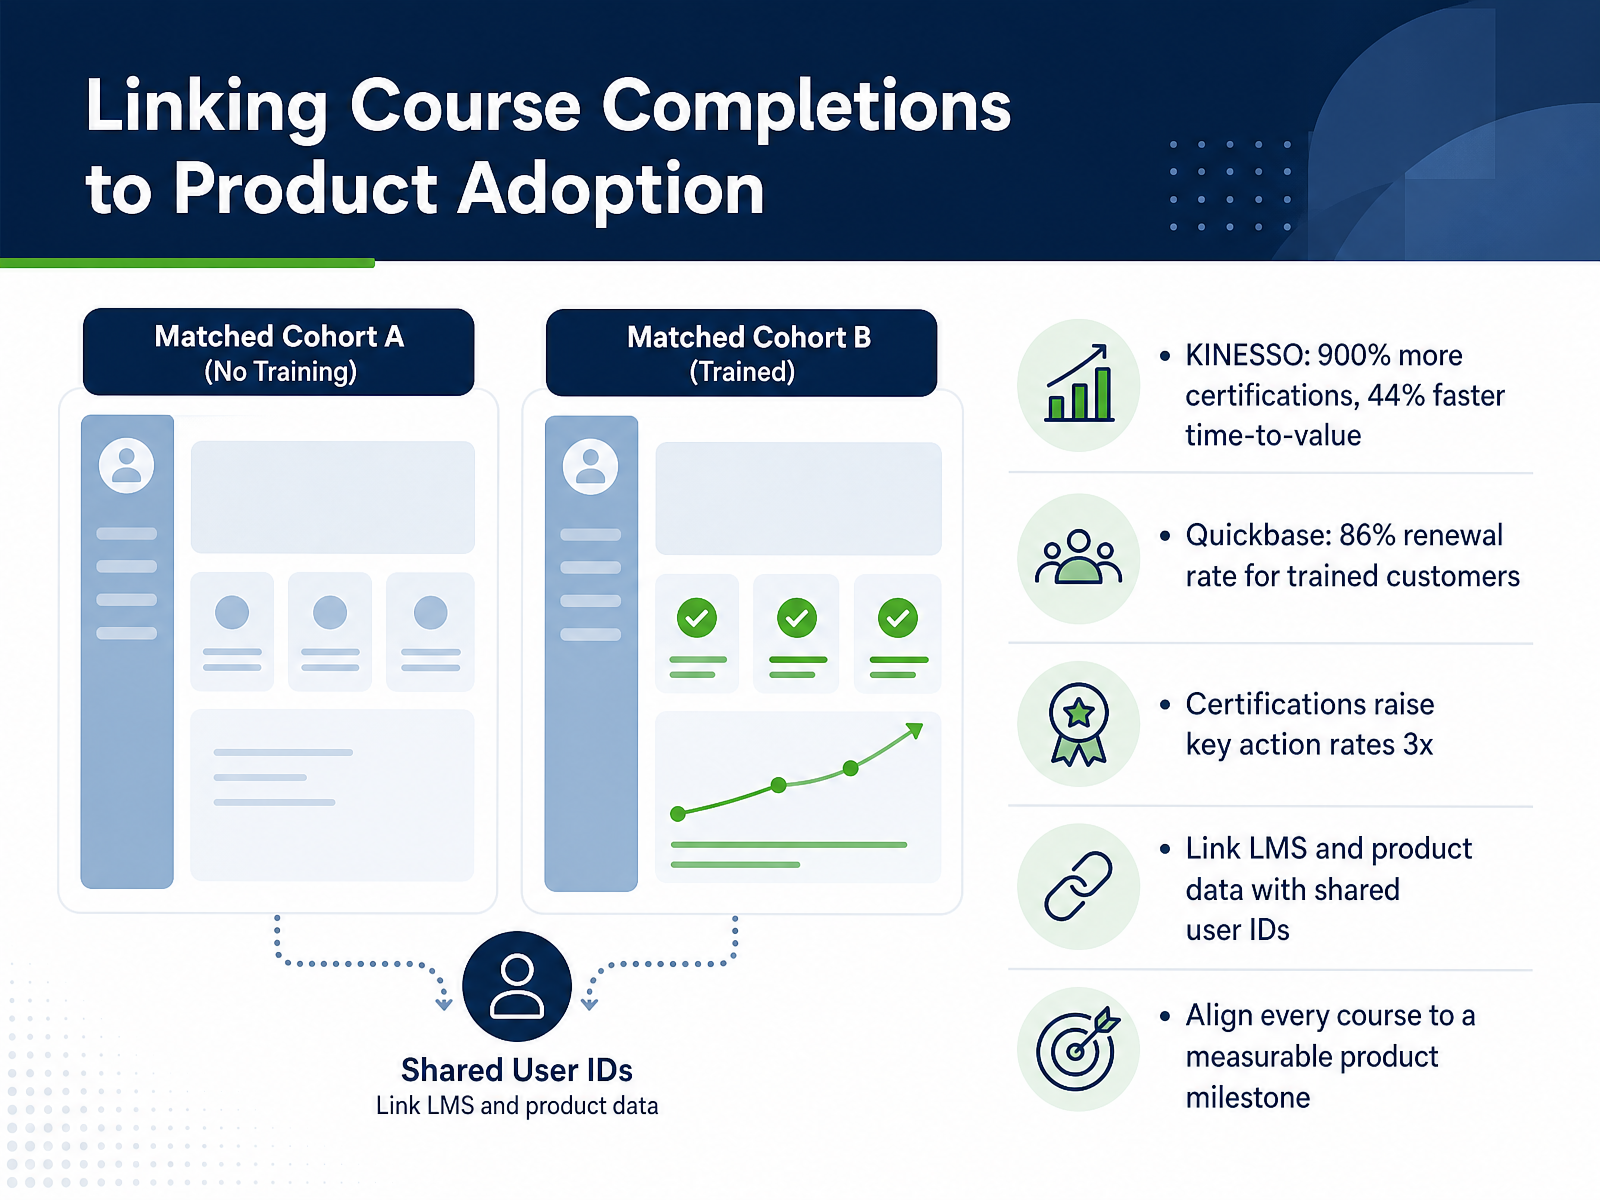
 - 06Linking Course Completions to Product AdoptionNow let’s move from completion rates to the metric that actually matters: product adoption. The evidence here is compelling. KINESSO saw a nine hundred percent increase in certifications and a forty-four percent reduction in time-to-value. Quickbase reported an eighty-six percent renewal rate among trained customers. And when you dig into the numbers, certifications alone lifted key action rates by as much as three times. So what’s the takeaway? Track this by linking your LMS and product data using shared user IDs. That single connection lets you see which courses drive real behavior change. Then, align every course to a measurable product milestone. Not just a learning objective, but a specific action in your product, like creating a first workbook or completing a first build. When you do this, you move from reporting activity to proving impact. This is how customer education becomes a growth lever. Up next, we’ll look at how to correlate learning data with customer health.
 intellum.combrainstorminc.comcandu.ai+21 min
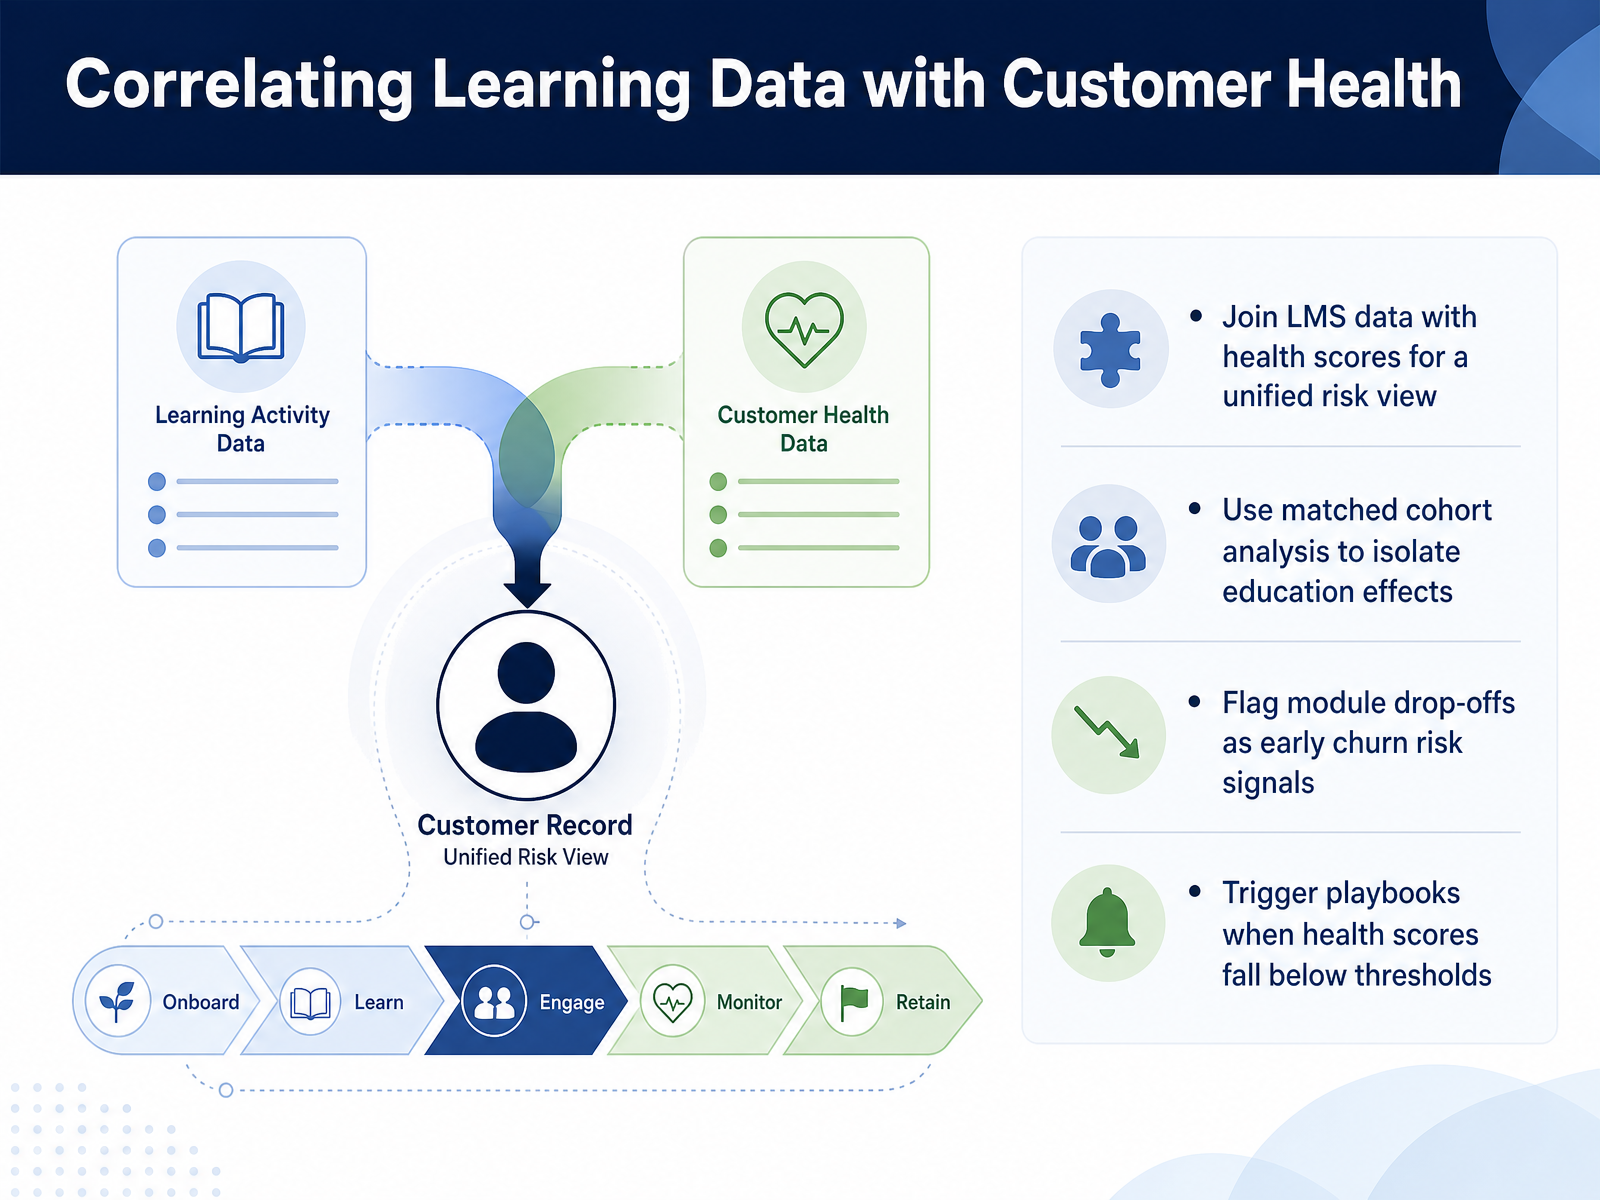
 - 07Correlating Learning Data with Customer HealthNow let's talk about correlating learning data with customer health. The key is to join your LMS data with your health scores to get one unified view of risk. Track this by pulling module completion, last login, and assessment data into the same system that holds your health scores. Then use matched cohort analysis to isolate the effect of education. Compare cohorts with similar enrollment profiles and look at completion rates, adoption rates, and renewal outcomes. This way, you're not guessing—you're measuring. Flag module drop-offs as early churn risk signals. If a customer stalls in a specific module, that's a leading indicator. Monitor drop-off rates per module and alert your success team when a segment falls below the cohort average. Finally, trigger playbooks when health scores fall below your thresholds. When a score drops by two or more points in a week, or a customer goes inactive for ten days, fire an automated outreach and a check-in call. The goal is intervention before churn becomes a conversation. In short, unify the data, analyze in cohorts, watch for drop-offs, and act on thresholds. That's how learning data becomes a churn prevention engine. Which brings us to building a defensible cohort analysis.
 starch.aiustechautomations.com2 min
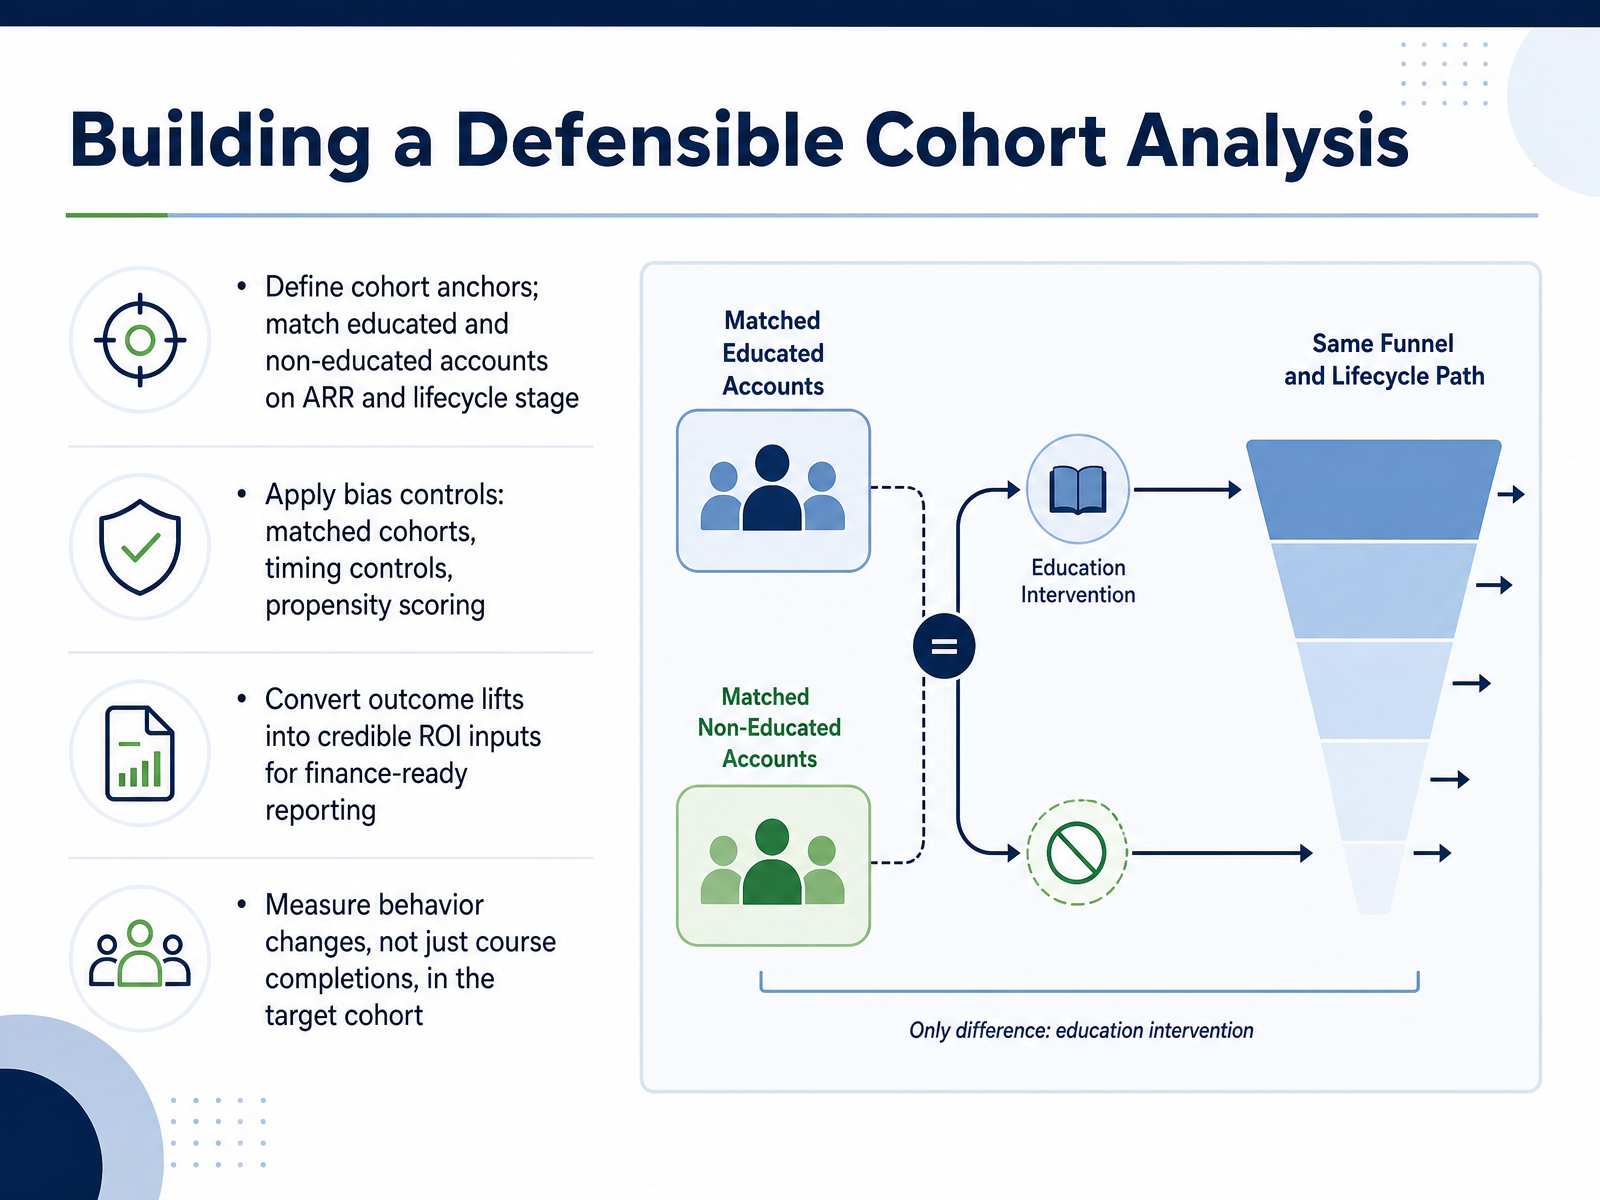
 - 08Building a Defensible Cohort AnalysisNow let's make your cohort analysis defensible. Start by defining your cohort anchors. Match educated and non-educated accounts on annual recurring revenue and lifecycle stage. This keeps the comparison apples to apples. Apply bias controls: matched cohorts, timing controls, and propensity scoring. These remove the noise that undermines credibility. Then convert the outcome lifts into finance-ready ROI inputs. Leadership wants numbers they can defend, not just directional wins. And track behavior changes in the target cohort, not just course completions. Completion is engagement. Adoption is impact. For example, compare feature activation rates between your matched groups over ninety days. That gap is your story. Build it this way, and your analysis will hold up in any budget review. Next, we will look at selecting the metrics that matter.
 kompassify.com1 min
 - 09Selecting the Metrics That MatterNow let's talk about selection. The single biggest mistake is tracking everything and reporting nothing. Your board cares about three to five outcomes. Pick the three to five metrics that prove you moved those outcomes. Completion rate is a leading indicator. Retention is the lagging confirmation. Track both, and link them in the same cohort. Say, "Accounts that finished onboarding renewed at ninety-four percent." That statement earns budget. A stack of twenty dashboards does not. Every metric you choose needs an owner and a decision attached. If the number moves, who acts, and what do they do? If you cannot answer that, the metric is decoration. Here is your takeaway. Three to five metrics, tied to board priorities, with a clear causal link between learning and revenue. Track this by connecting completion and adoption data to renewal outcomes. That connection is your business case. Next, we turn analysis into action.
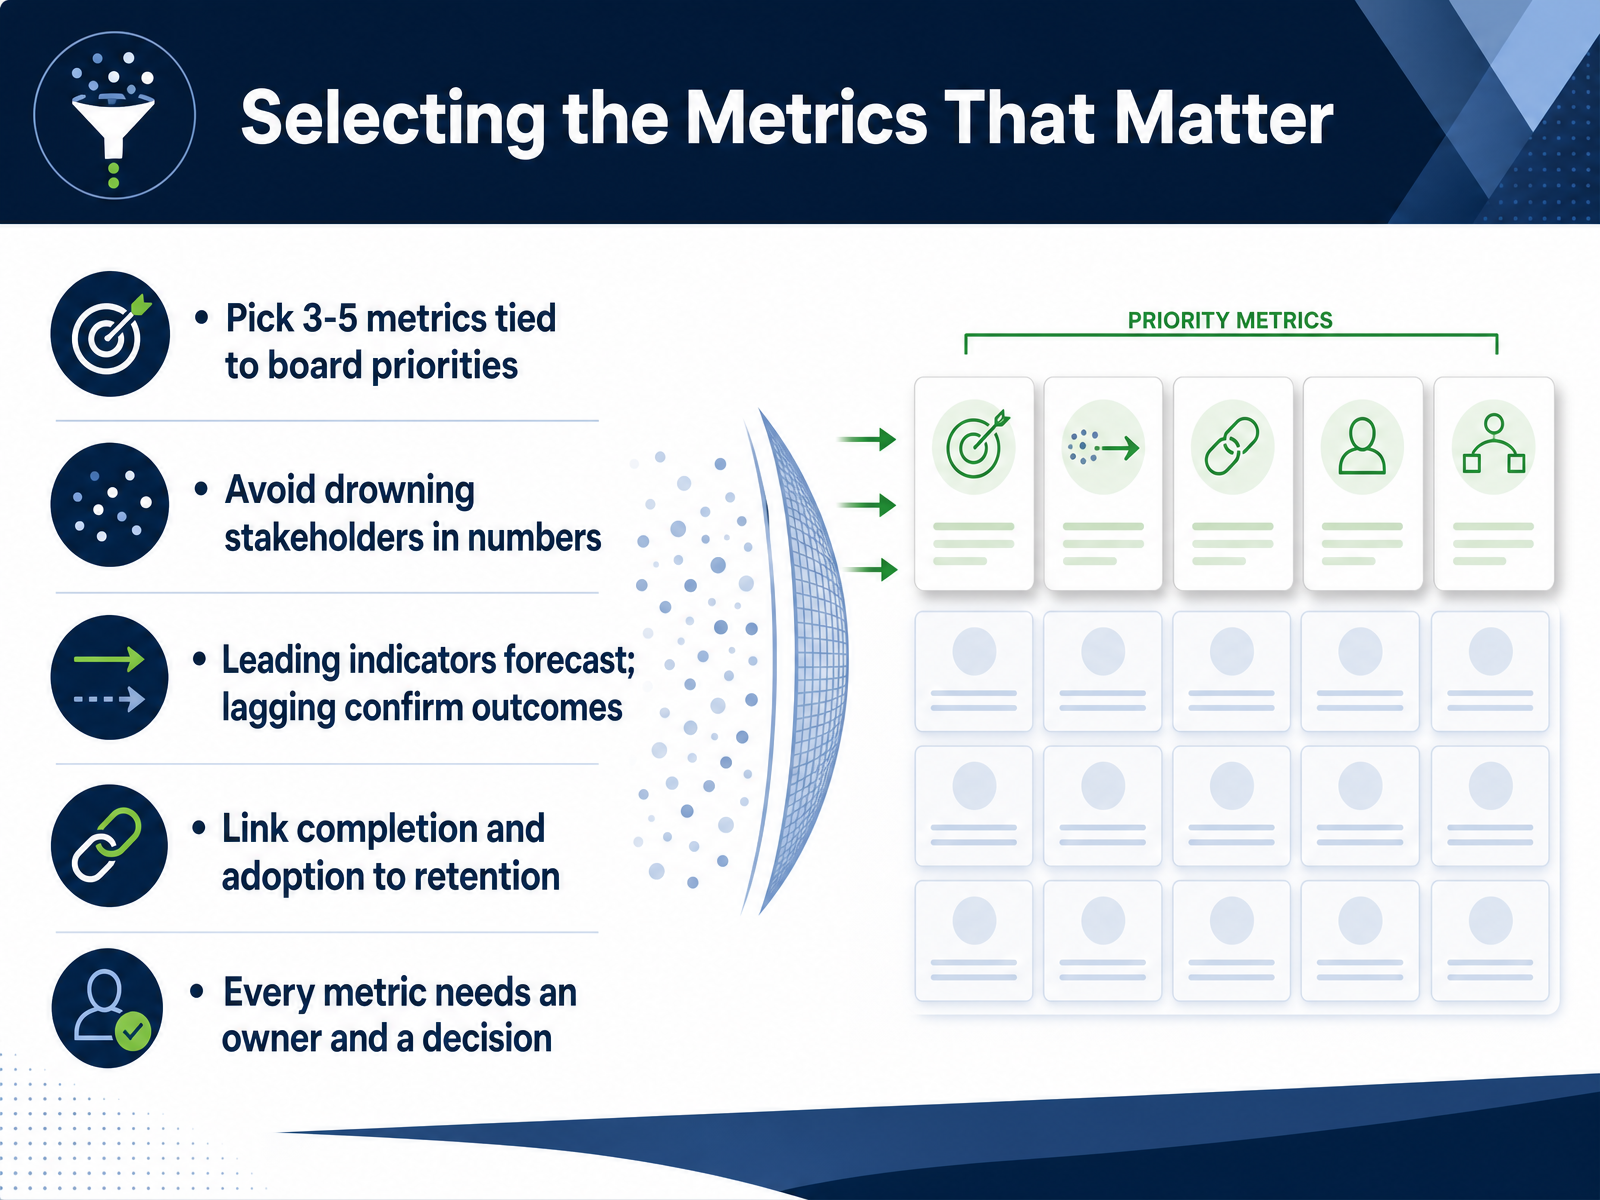 trainn.cothoughtindustries.comintellum.com+21 min
 - 10Interpreting Data: From Analysis to ActionNow let’s turn analysis into action. Start by diagnosing the signals. Do your metrics agree, contradict, or regress? For example, if completion rates are high but adoption is flat, that’s a contradiction worth investigating. Regressing signals, like a sudden drop in engagement, should trigger your playbooks immediately. Build playbooks for falling engagement, stalled adoption, and rising support volume. When any of these fire, you know exactly what to do. Finally, translate everything into business language. Speak revenue, risk, and cost. Show how education drives expansion revenue, reduces churn risk, and lowers support expenses. That’s how you earn a seat at the leadership table. Remember: data only matters if it changes a decision. Tie every metric to a playbook or a stakeholder conversation. Next, we’ll look at designing dashboards and scheduling the reporting cadence.
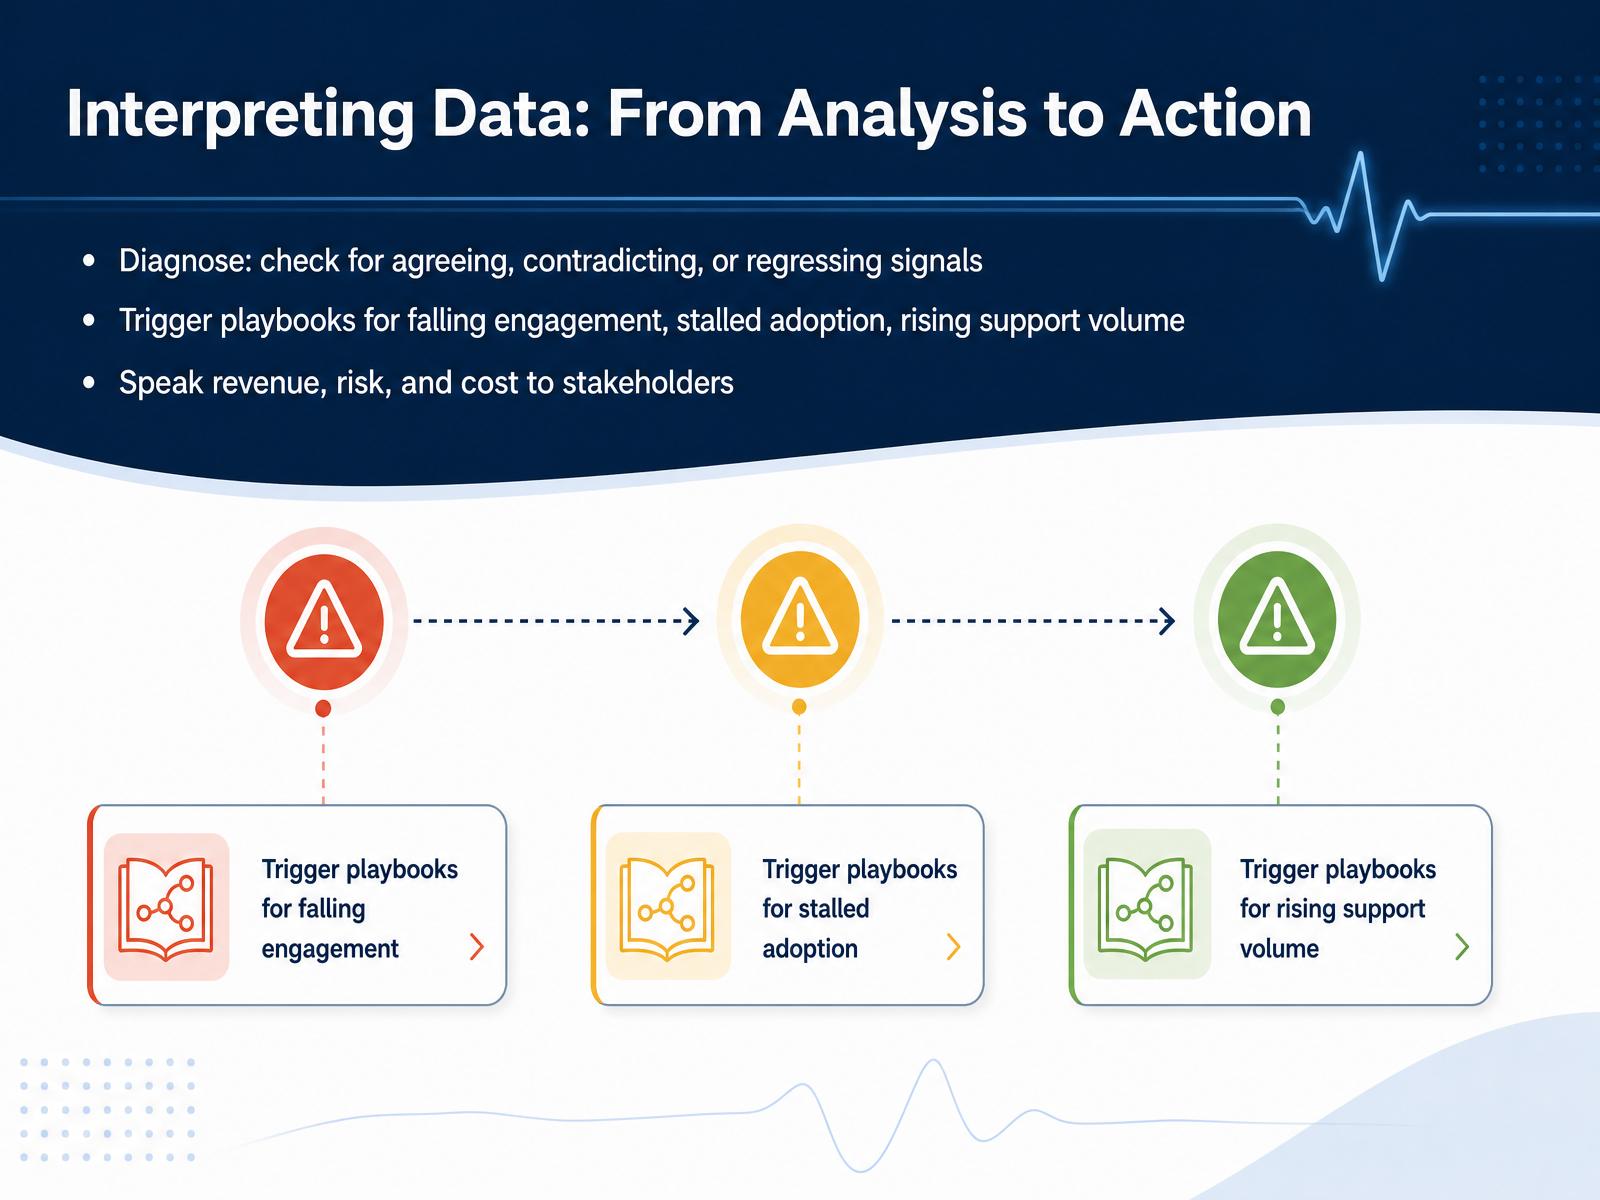 kompassify.com1 min
 - 11Designing Dashboards and Reporting CadenceNow let's talk about designing dashboards and reporting cadence. The key is to match the view to the role and the cadence to the decision. For executives, focus on NRR, churn, renewal pipeline, and revenue at risk. Review these monthly or quarterly, and always show the trend, not just a snapshot. For CSMs, build a working queue that shows health, adoption, renewal status, and the next action. This needs to be daily, because the question is which account needs attention now. For analysts, provide cohorts, metric lineage, and score validation. Review this bi-weekly to test which signals actually predict outcomes. And remember this rule: every metric needs an owner, a threshold, and a documented next action. If a metric doesn't change a decision, it's decoration. Next, let's look at role-specific interpretations and shared language.
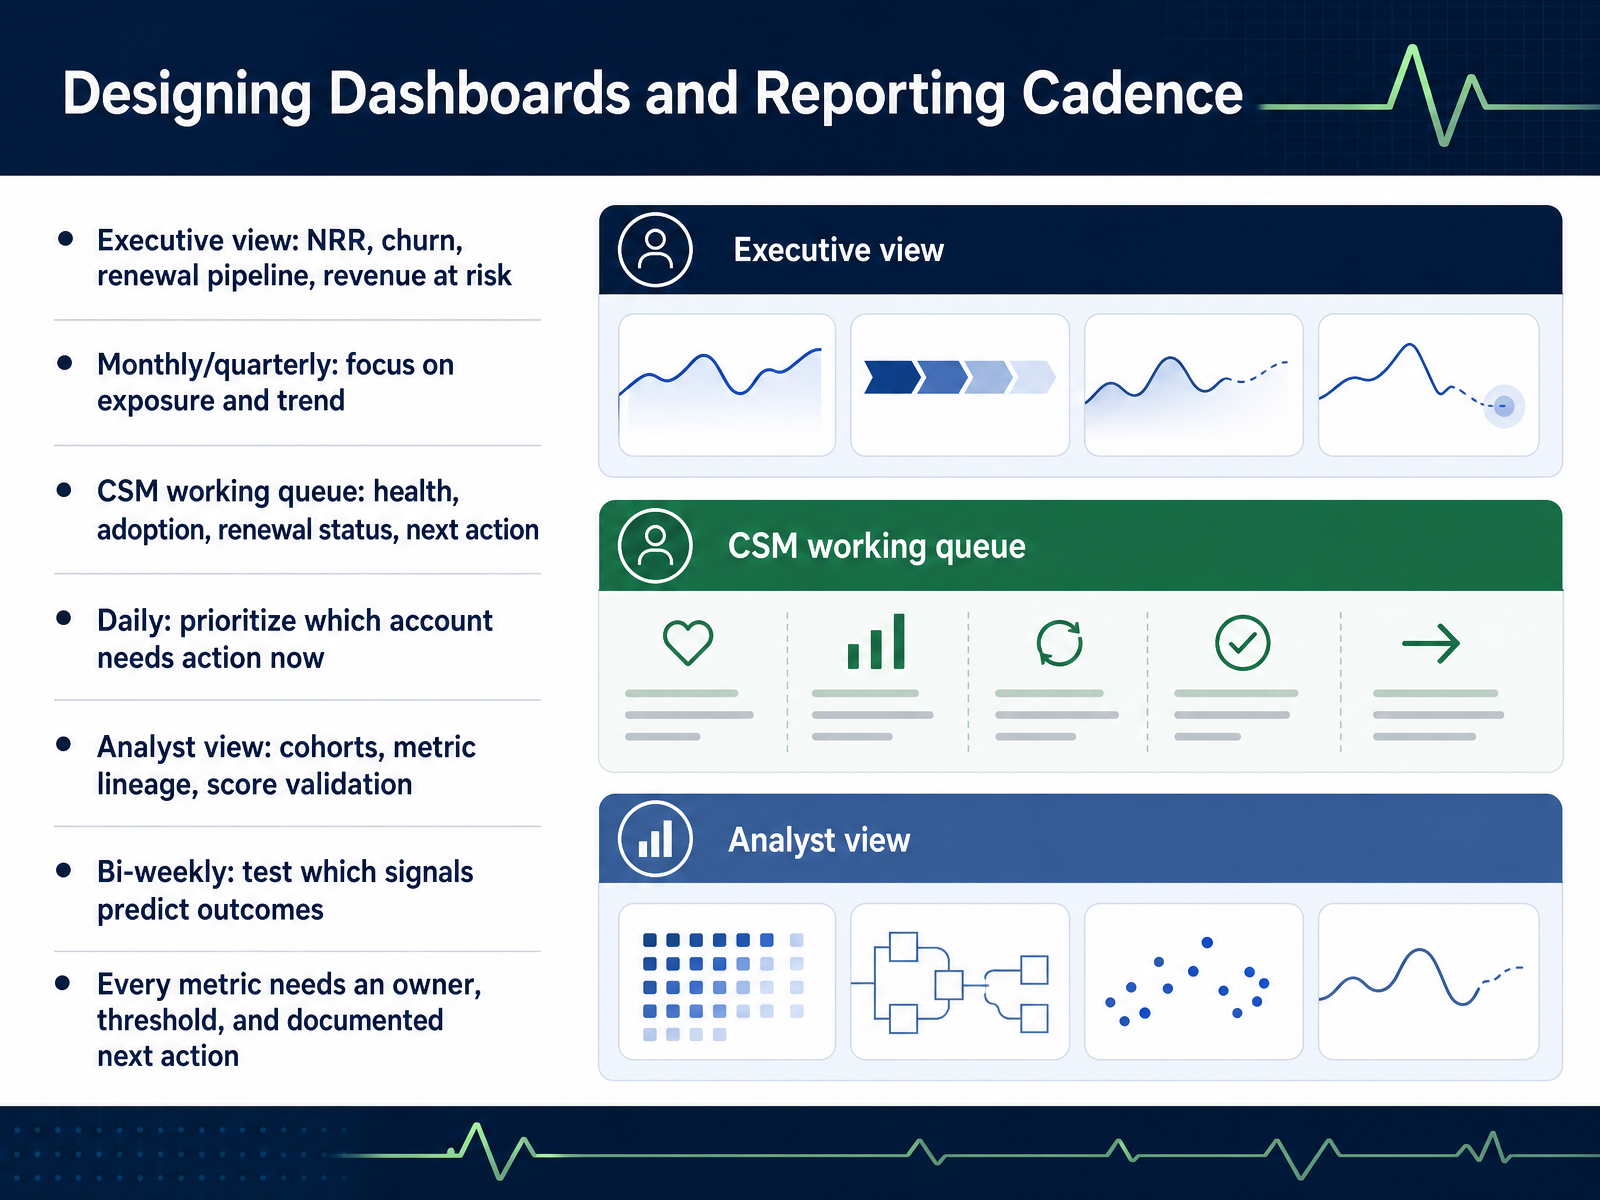 1 min
1 min - 12Role-Specific Interpretations and Shared LanguageNow let's talk about how both teams read the same numbers differently. Education leaders look at content quality, drop-off points, and learning path effectiveness. Their focus is fixing the course, not the account. Success leaders look at account segmentation, risk detection, and intervention prioritization. Their focus is protecting the book of business. That difference is fine, as long as both sides anchor on the same reality. The shared anchor is behavior and outcome metrics, not activity data. A learner clicking through a lesson is activity. A learner applying that feature inside your product is behavior. Only the second one predicts retention. So build your common vocabulary on outcomes like adoption rate, time to value, and risk score movement. When education says course completion and success says feature adoption, they should be talking about the same customer event. Establish that shared language once, and your weekly reviews shift from debating definitions to deciding which account gets a playbook first. That alignment is the whole point.
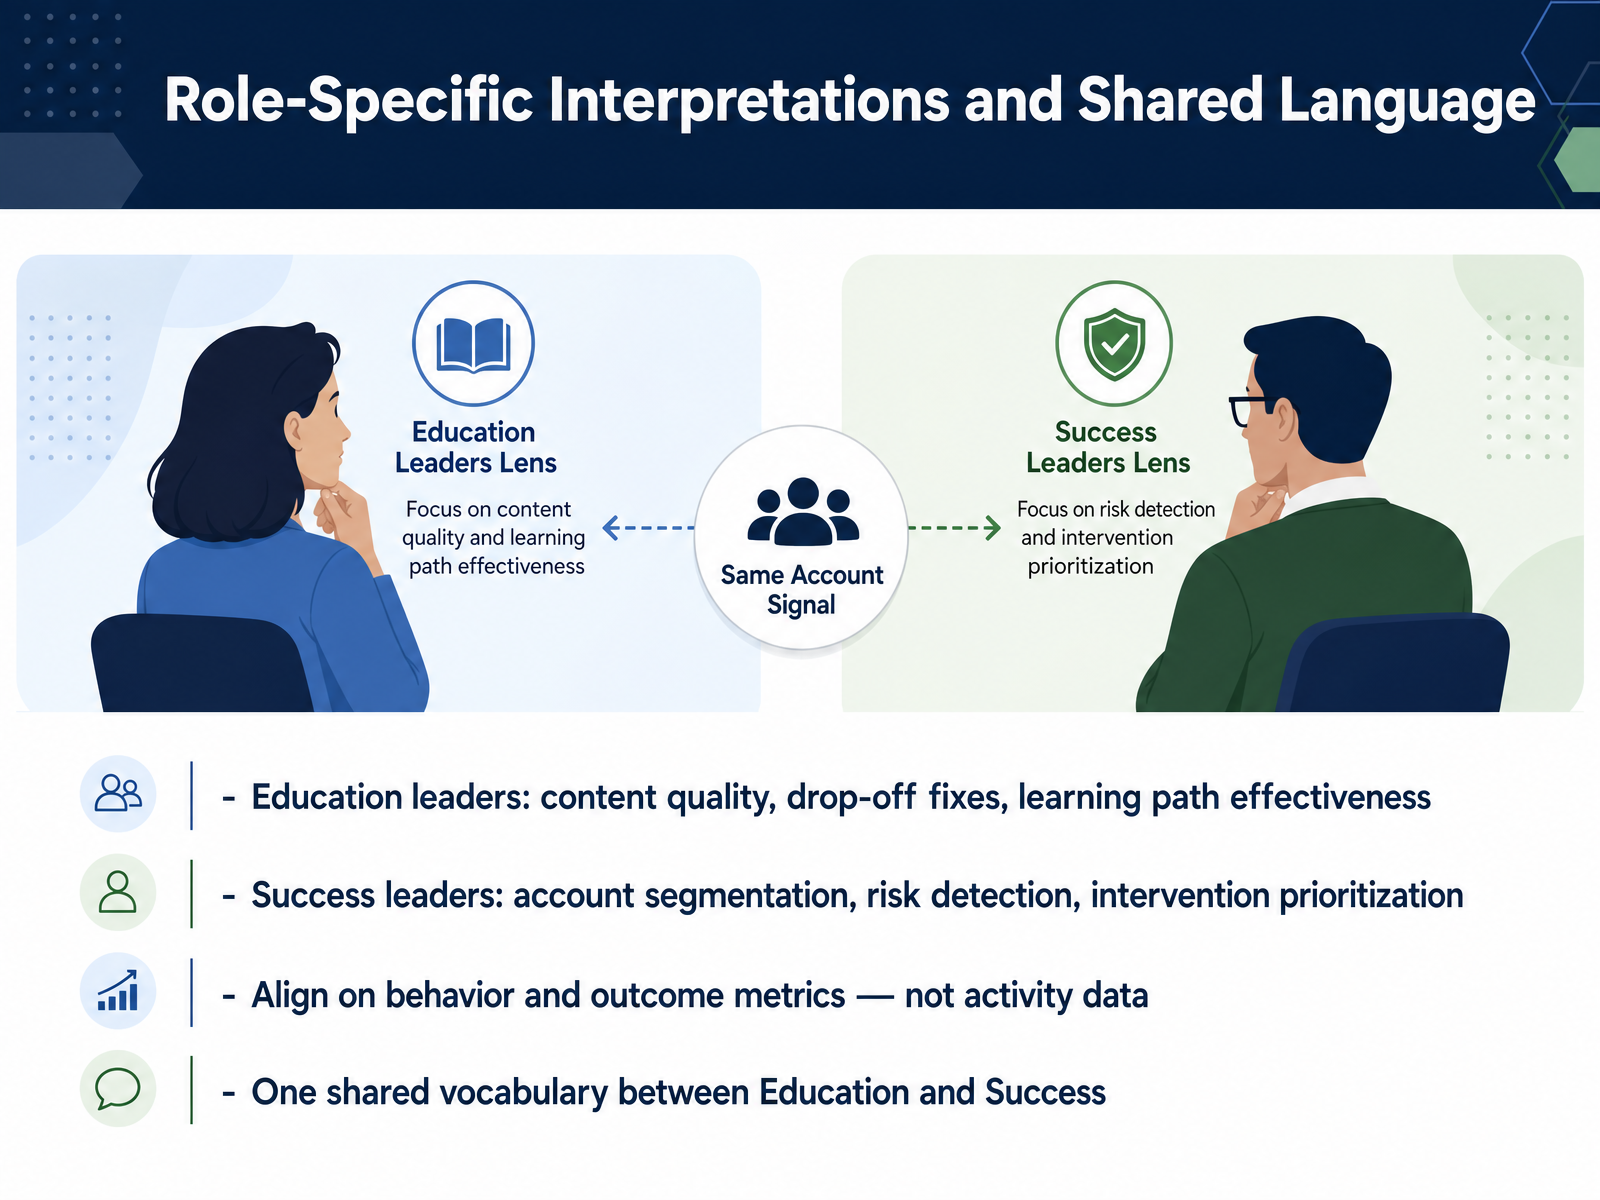 1 min
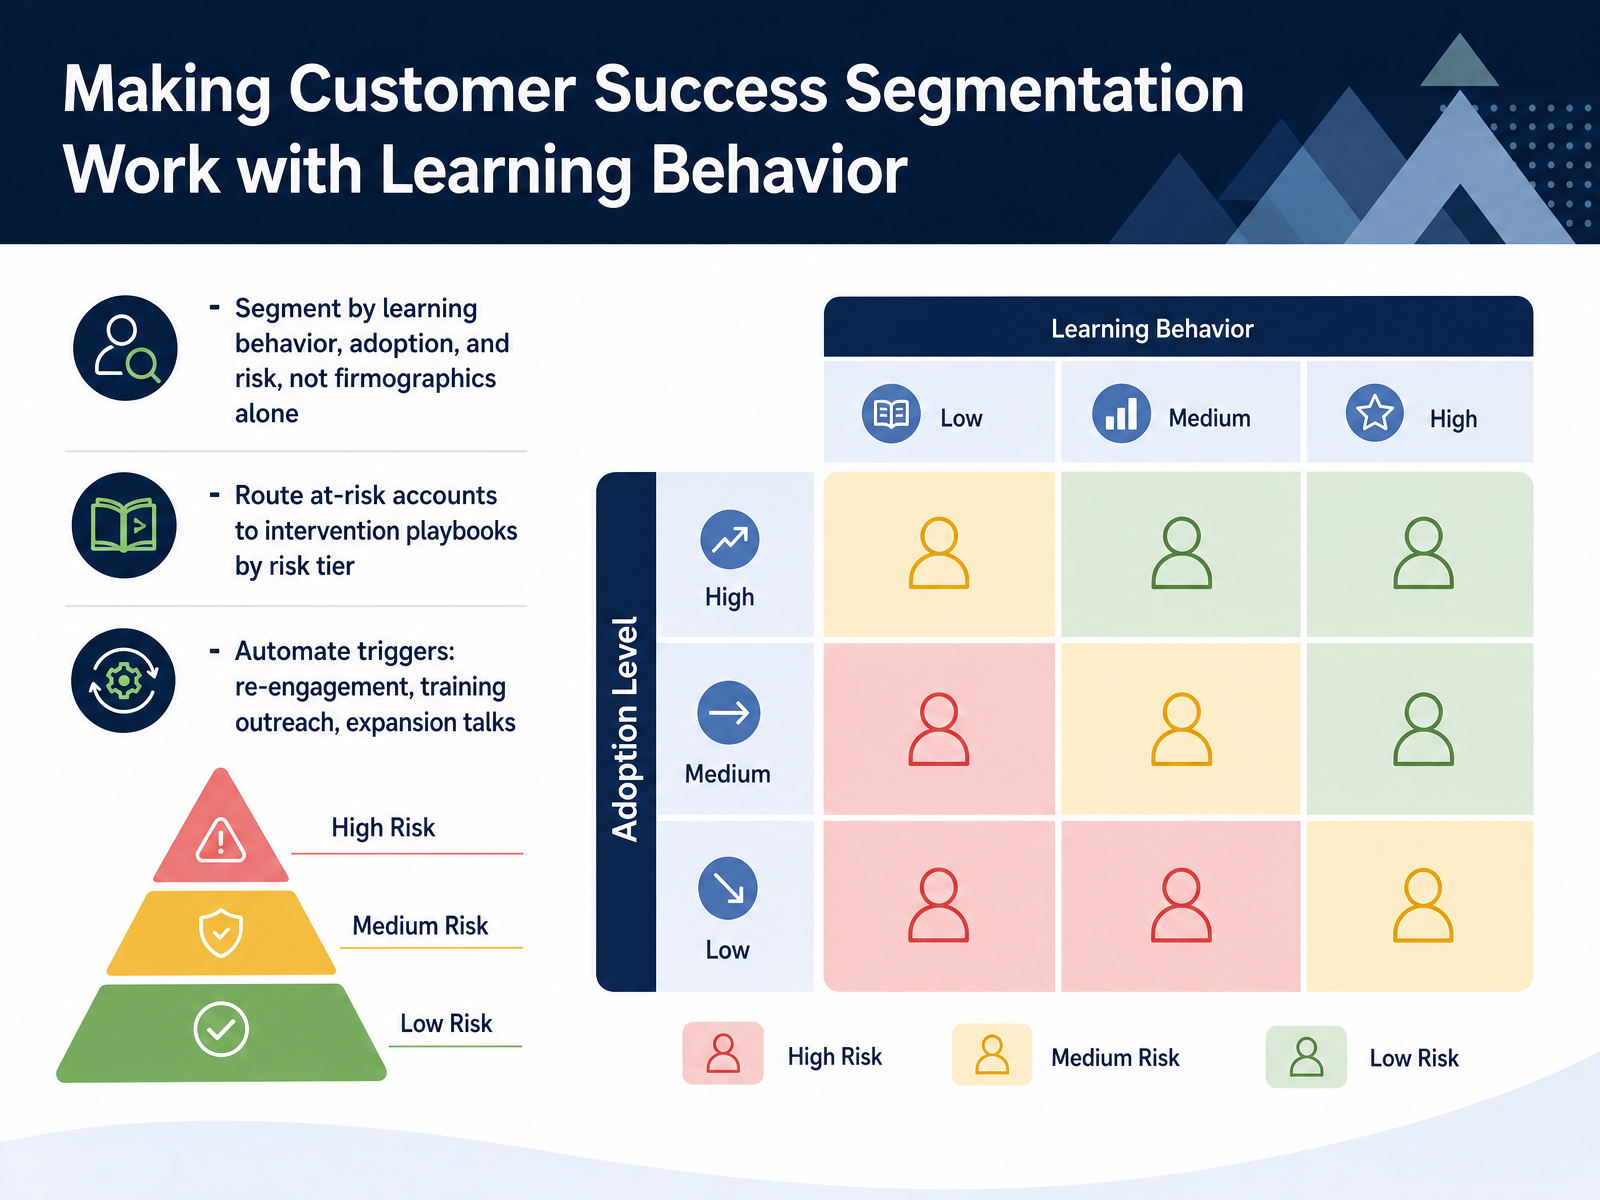
1 min - 13Making Customer Success Segmentation Work with Learning BehaviorNow let's turn segmentation into action. Firmographics alone won't tell you who's at risk or who's ready to expand. Instead, segment by learning behavior, adoption, and risk. Track completion rates, assessment scores, and feature usage. These signals separate your power users from your struggling accounts. Once you have those tiers, route at-risk accounts to intervention playbooks by risk level. A high-risk tier triggers a CSM-led outreach within forty-eight hours. A moderate tier gets automated re-engagement campaigns. This way, your team prioritizes effort where it matters most. Automate the triggers so the system acts without waiting for a manual review. Set alerts for declining login frequency, stalled onboarding, or a drop in feature adoption. Each trigger should fire a specific playbook: re-engagement for quiet accounts, training outreach for those stuck on core features, and expansion talks for your power users. Remember, a segment only works if it changes behavior. If your tier field doesn't route a different action, it's decoration, not segmentation. The goal is to move from reactive firefighting to proactive, behavior-driven success. Now, let's look at what you should prioritize immediately to put this into practice.
 1 min
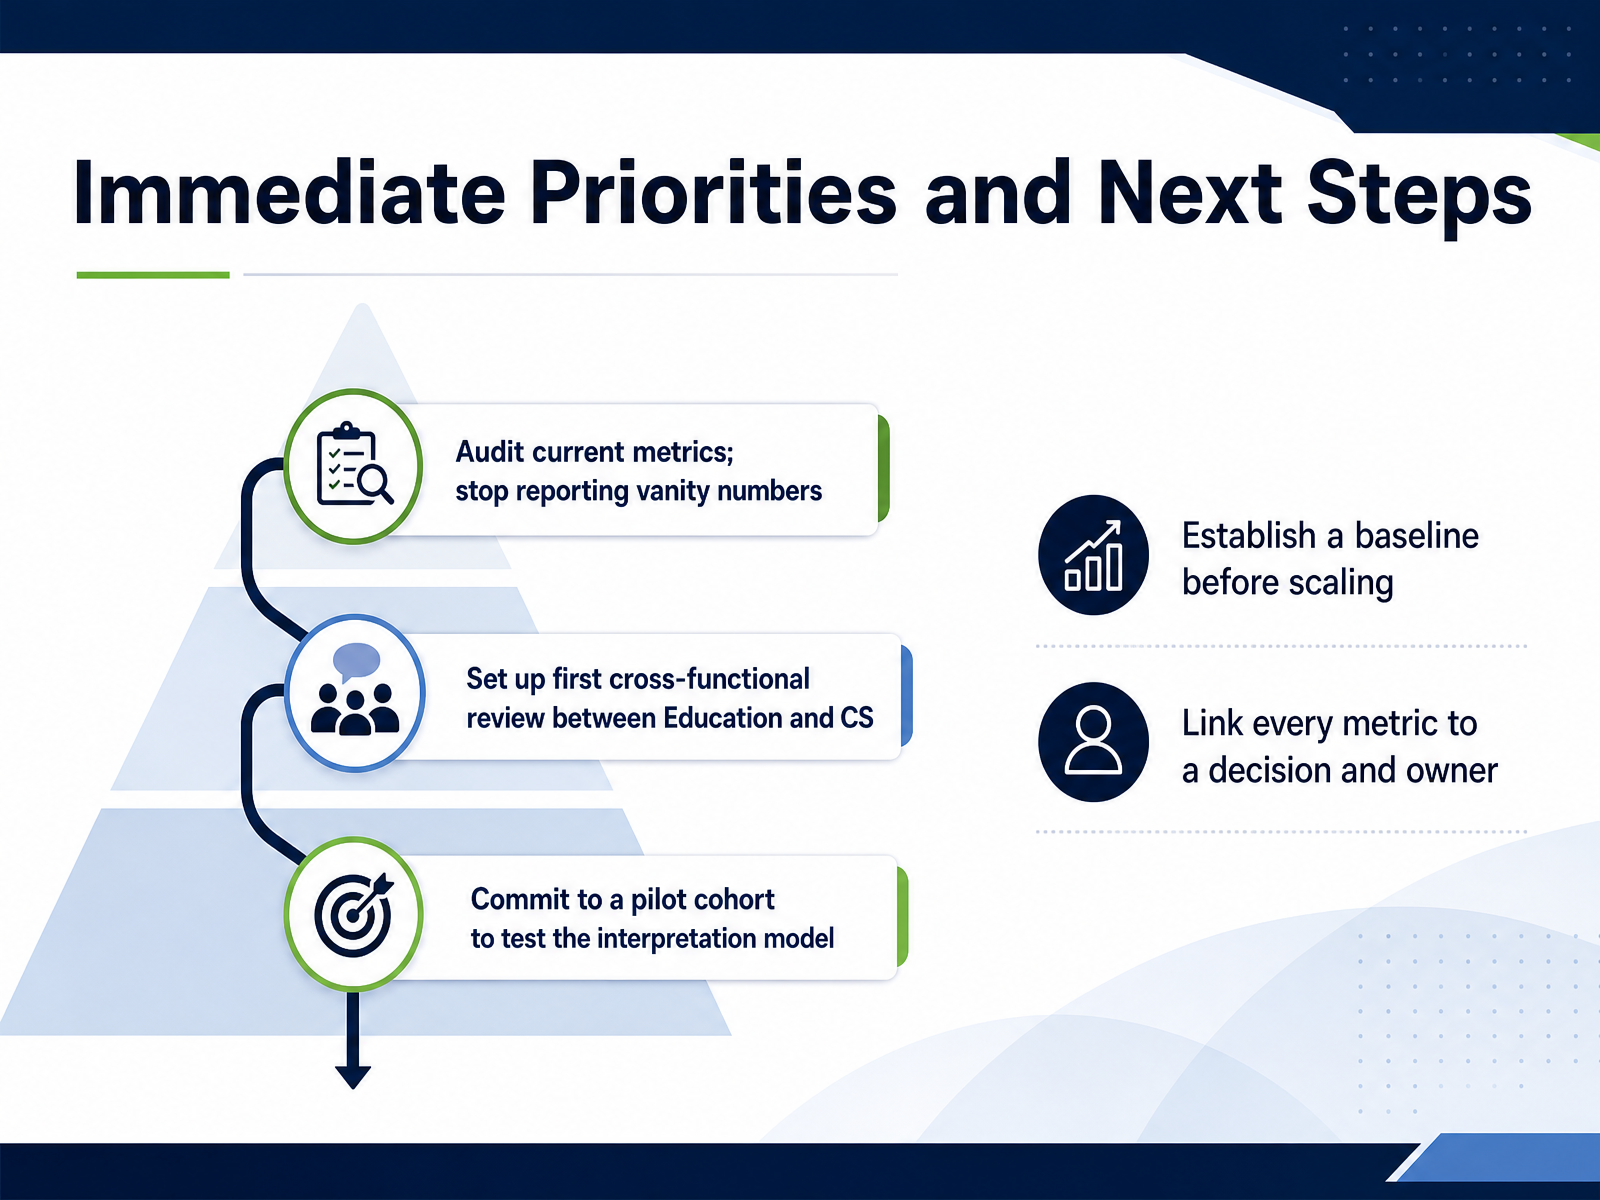
1 min - 14Immediate Priorities and Next StepsLet's turn this into action. First, audit what you report today. If a metric doesn't tie to a decision, it's vanity. Stop reporting it. Second, schedule that first cross-functional review between Education and Customer Success. This is where adoption signals become account insights. Third, commit to a pilot cohort. Test your interpretation model on a defined group before you scale anything. Fourth, establish a baseline. You cannot measure lift without one. And fifth, give every metric an owner and a decision. Completion rate without a decision is just a number. Adoption rate tied to a renewal risk is a lever. Start this week. Pick one metric, assign an owner, and set the review date. Small, disciplined steps build an education program that defends its budget. Thank you for your focus today. Now go make the impact visible.
 kompassify.com1 min
Take the deck with you
Download this course as a file — free, no sign-up needed.
- PDF handoutEvery slide page, ready to print or share.15 pages · 3.0 MBDownload
- Narrated PowerPointThe deck that presents itself — every slide carries the digital human's narration video.15 pages · 13.2 MBDownload
- PowerPoint slidesThe full deck as a .pptx — open it in PowerPoint, Keynote, or Google Slides.15 pages · 2.8 MBDownload
Free to use in your own training — please keep the PersonWise credit page at the end.
Have your own deck? Turn it into a course
Sources consulted
Web sources consulted while building this course.
- Customer Education Metrics: 14 to Track (2026) | Trainn — trainn.co
- The Customer Education ROI Framework Your CFO Will Actually Believe — seertechsolutions.com
- Customer Education Metrics Guide: Proving ROI (2026) — check-n-click.com
- Resolving the Measurement Dilemma in Customer Education — thoughtindustries.com
- How to improve customer education in 2026 | LearnWorlds — learnworlds.com
- Why Completion Rate Is The Most Misleading Metric In Enterprise L&D - Qquench Ai — qquench.ai
- https://sleak.ai/en/blog/completion-is-not-competence — sleak.ai
- Why LMS Completion Rates Don't Prove Learning Works - eLearning Industry — elearningindustry.com
- Why LMS Completion Rates Don't Measure What You Think They Measure (And What Does) | Talantir Blog — talantir.ai
- Why Course Completion Is a Broken Metric for Training Companies — blend-ed.com
- How to Set the Right Metrics for Your Customer Education Program | Intellum — intellum.com
- Customer Education Metrics to Measure | Intellum — intellum.com
- Customer Education: How to Build a Program That Drives Adoption (2026) — kompassify.com
- How KINESSO Supercharged Product Adoption and Certification with Intellum — intellum.com
- Case Study | Quickbase — brainstorminc.com
- Asana’s Quest for Causation: Proving Customer Education ROI — candu.ai
- Usage Explodes 11x for Cin7 Customer Education, Increasing Retention 7% | Gainsight Software — gainsight.com
- Case Study: Asana Scales Customer Education and Boosts NPS with Skilljar | CaseStudies.com — casestudies.com
- Customer Health Scoring for Education Founders | Starch — starch.ai
- US Tech Automations vs Kajabi: 8-Step Cert Tracking 2026 — ustechautomations.com