Security Metrics Interpretation
Begin
14 pages · ~28 min
Security Metrics Interpretation
This training equips security professionals with skills to define, measure, and interpret security awareness metrics for effective program evaluation.
What you’ll learn
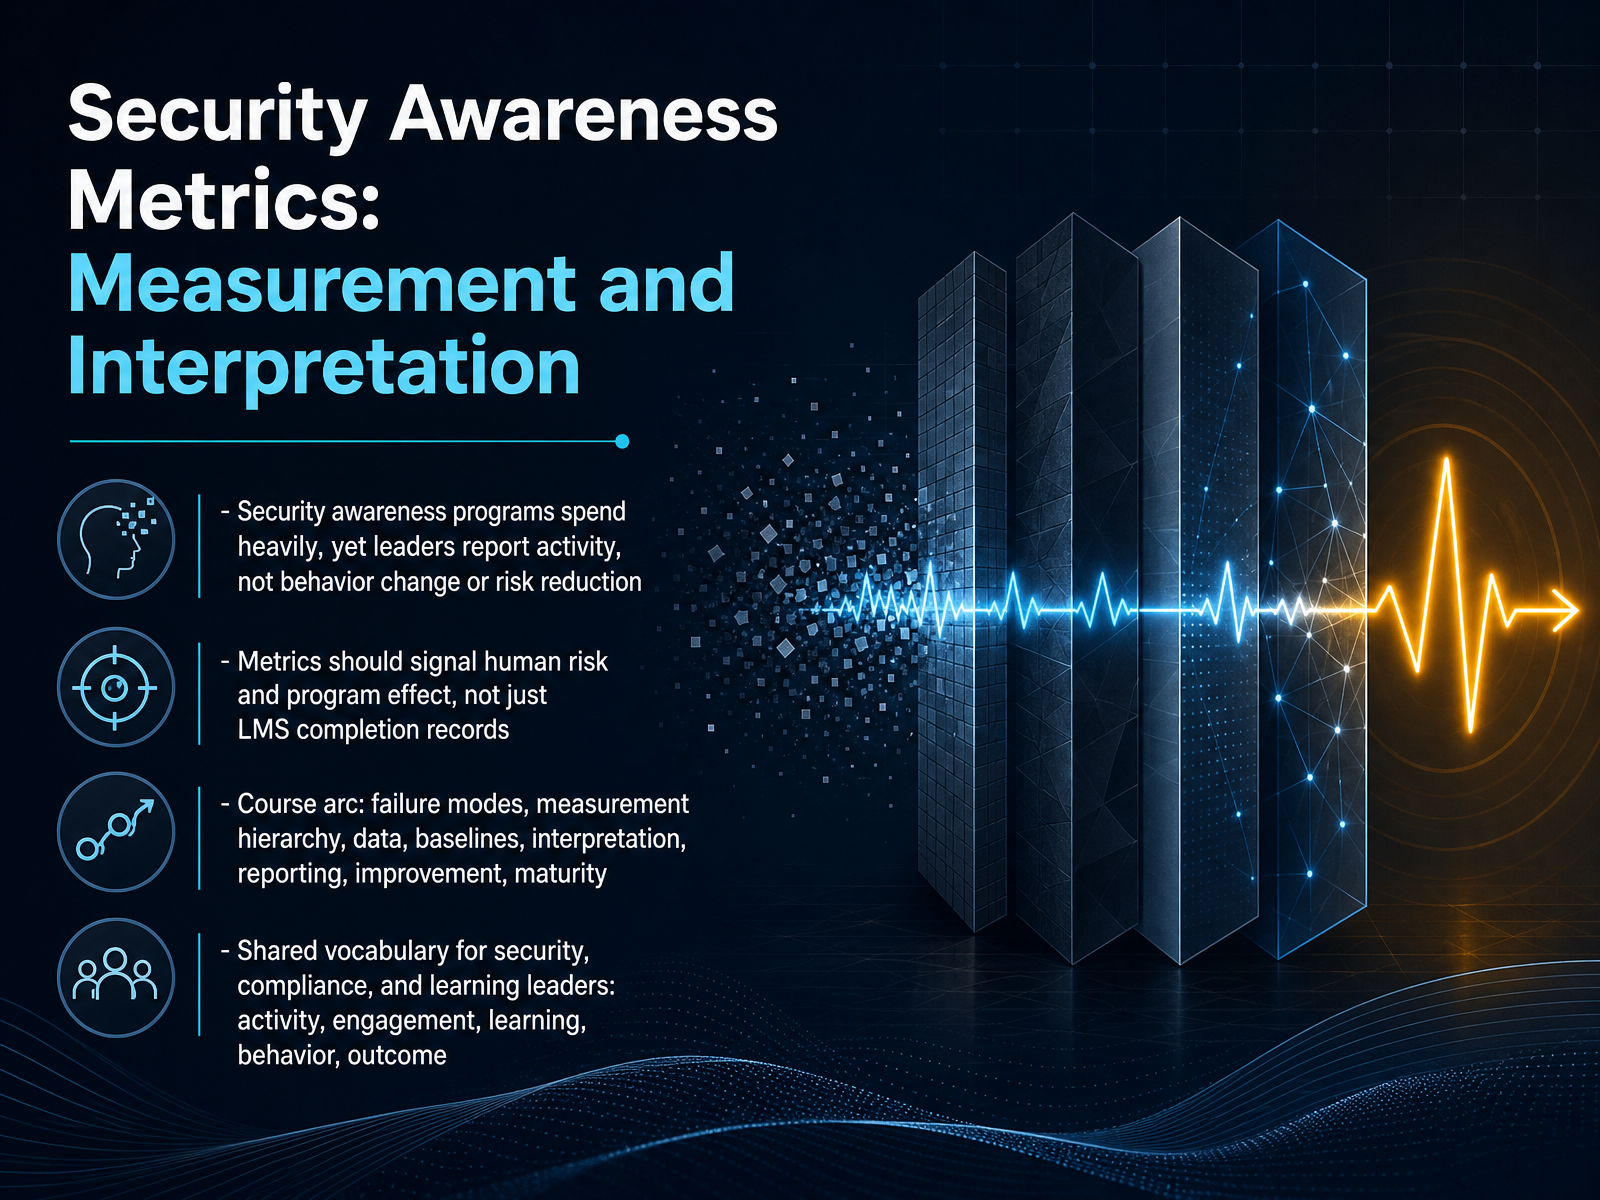
- 01Security Awareness Metrics: Measurement and InterpretationWelcome. If you lead security, compliance, or learning, you know the feeling. You invest heavily in awareness programs, and yet the metrics you report often describe activity, not impact. Completion rates and click rates tell you that training happened, but they don't tell you whether human risk actually went down. That's what we're here to fix. In this session, we'll explore the common failure modes in awareness measurement, and then build a practical framework for tracking what matters: a hierarchy that moves from activity to engagement to learning, and finally to behavior and outcomes. We'll ground everything in a shared vocabulary so that security, compliance, and learning leaders can have one conversation about risk. The goal is to leave you with measurement strategies that demonstrate real value, and that hold up in front of the board. Let's get started by looking at why so many current approaches miss the mark.jissec.orgdoi.orgscribd.com+21 min
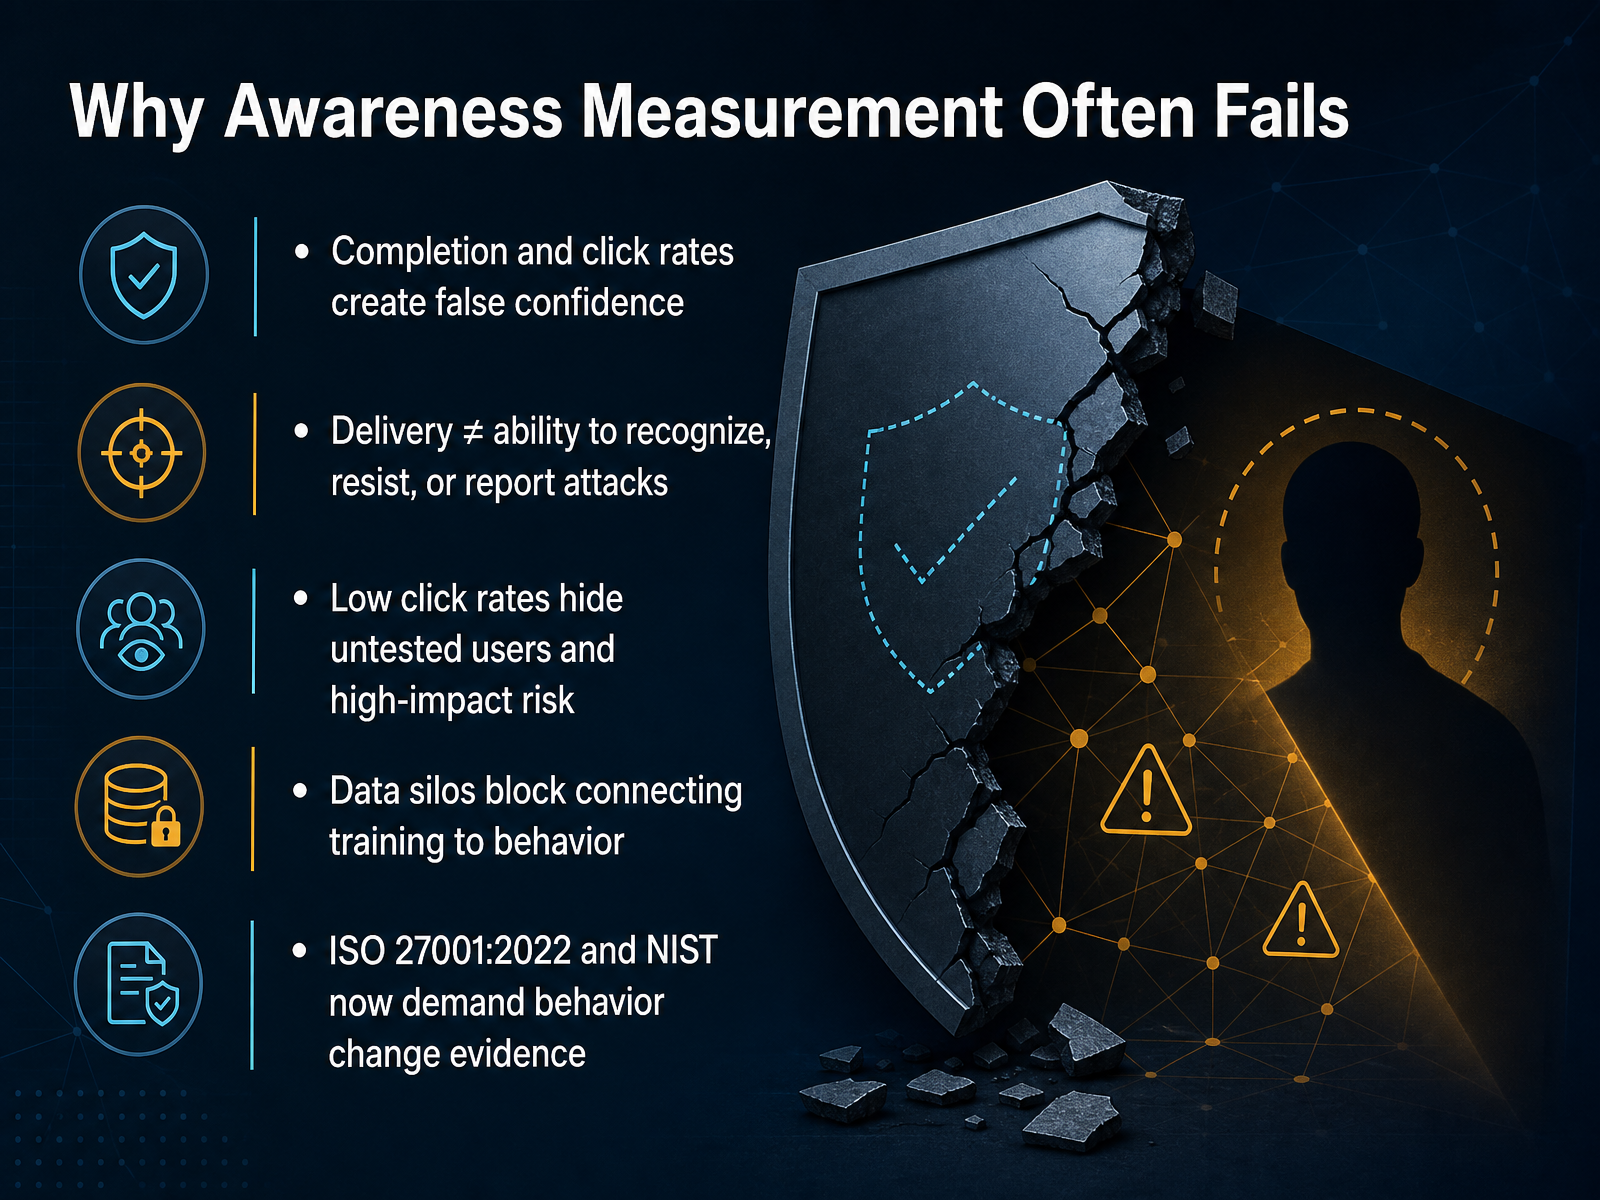
- 02Why Awareness Measurement Often FailsHere’s the uncomfortable truth about awareness metrics. Most programs look healthy on the dashboard, but that’s often an illusion. We track completion rates and click rates because they’re easy to capture and easy to report. But here’s the catch: these are activity metrics, not outcome metrics. They tell you that training was delivered, not that employees can recognize, resist, or report a real attack. In fact, one major study found that a low click rate can hide the fact that a third of employees will click at least once over fifteen months. And when you only measure overall averages, you miss the high-risk pockets—like a finance team with an eighteen percent click rate hiding behind a corporate average of four. The deeper issue is that data gets siloed. The LMS talks to compliance, the phishing platform talks to security, but nothing connects training to actual behavior in the wild. Meanwhile, ISO 27001:2022 and NIST now require evidence of behavior change, not just attendance records. So what does this mean for you? It means the old metrics are no longer defensible. But before we explore what to measure instead, let’s make the shift clear: we need to move from activity metrics to behavior and outcome metrics. That’s exactly where we’re headed next.
 adaptivesecurity.comhoxhunt.comnhimg.org+22 min
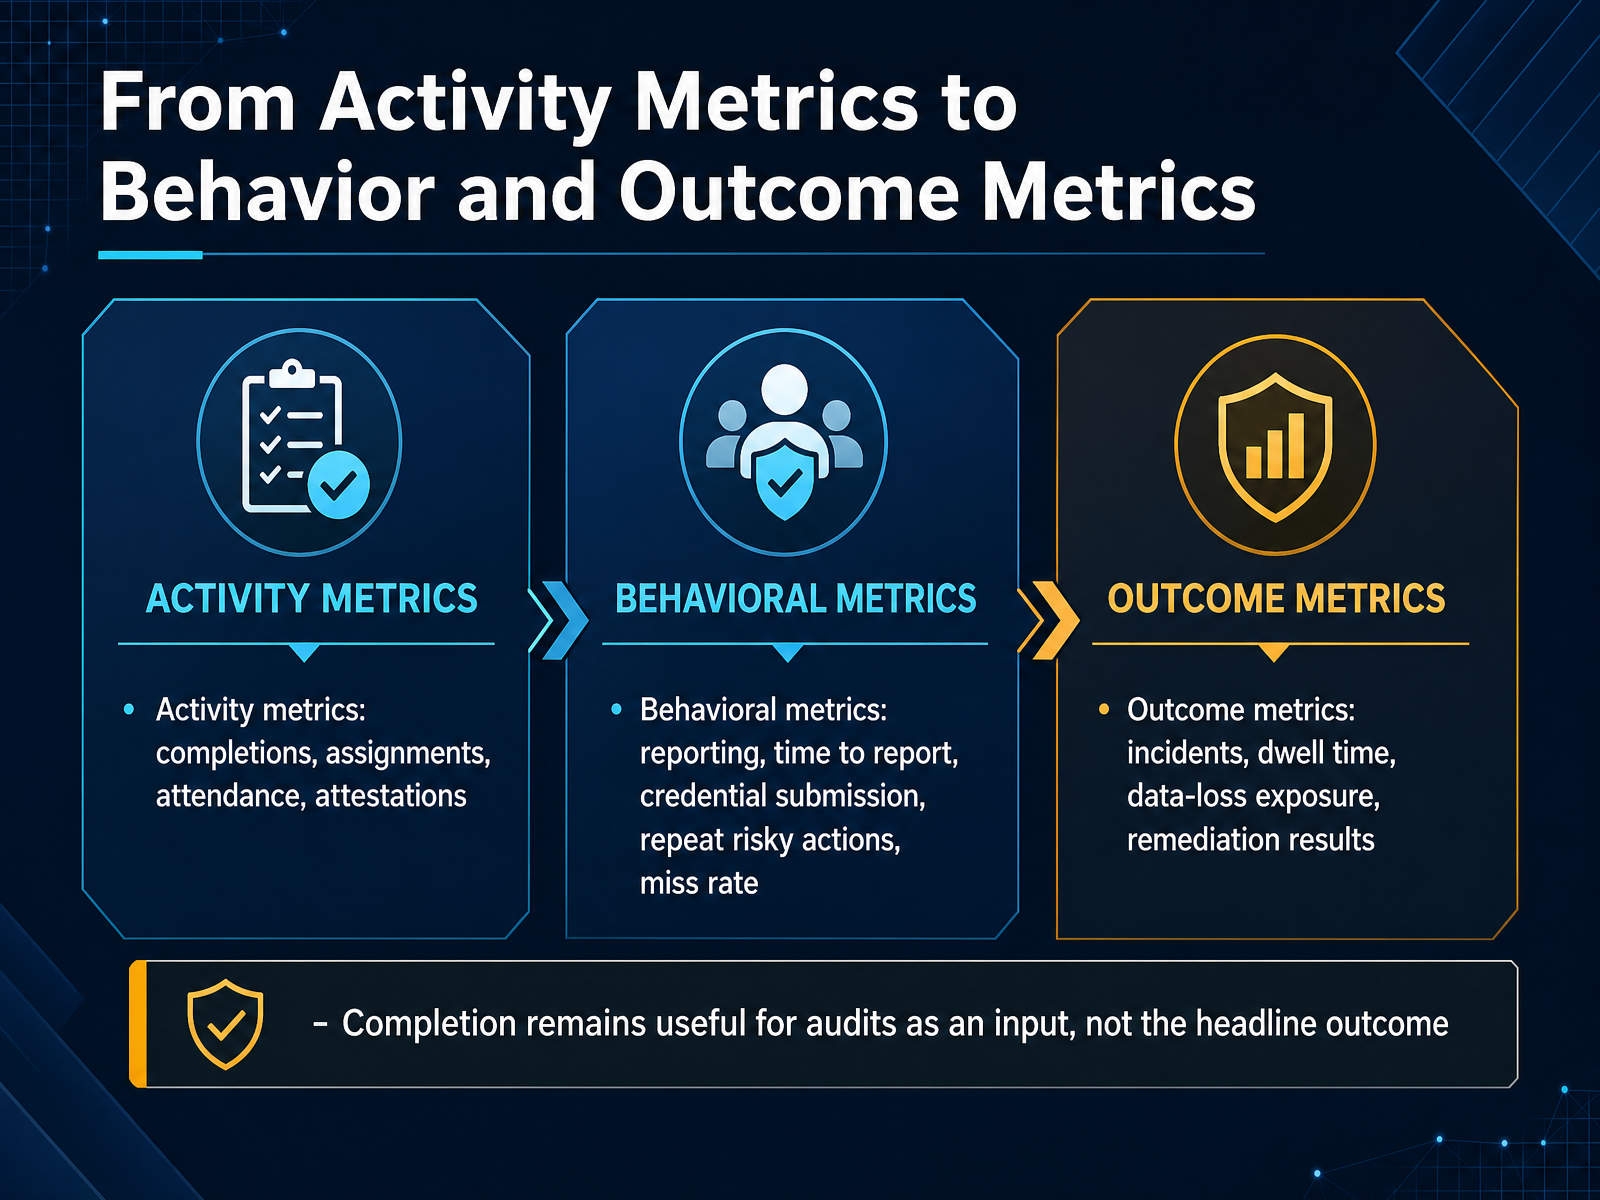
 - 03From Activity Metrics to Behavior and Outcome MetricsNow here's the shift that matters: moving from activity metrics to behavior and outcome metrics. Activity metrics are completions, assignments, attendance, and attestations. They tell you something happened, not whether anything changed. Behavioral metrics look at what people actually do: do they report suspicious messages? How fast do they report them? Are they submitting credentials on a phishing landing page? Do they repeat risky actions? Are they simply missing the simulation altogether? Outcome metrics go one level further: real incidents, dwell time, data loss exposure, and remediation results. That's the evidence your leadership wants to see. Now, keep the completion rate. It is still useful for audits, but position it as an input, not the headline outcome. A workforce at ninety-nine percent completion can still click the wrong link under pressure. The headline belongs to behavior, because behavior change is what reduces risk. Next we'll break down a measurement hierarchy you can use to structure your reporting.
 sans.orghoxhunt.comadaptivesecurity.com+21 min
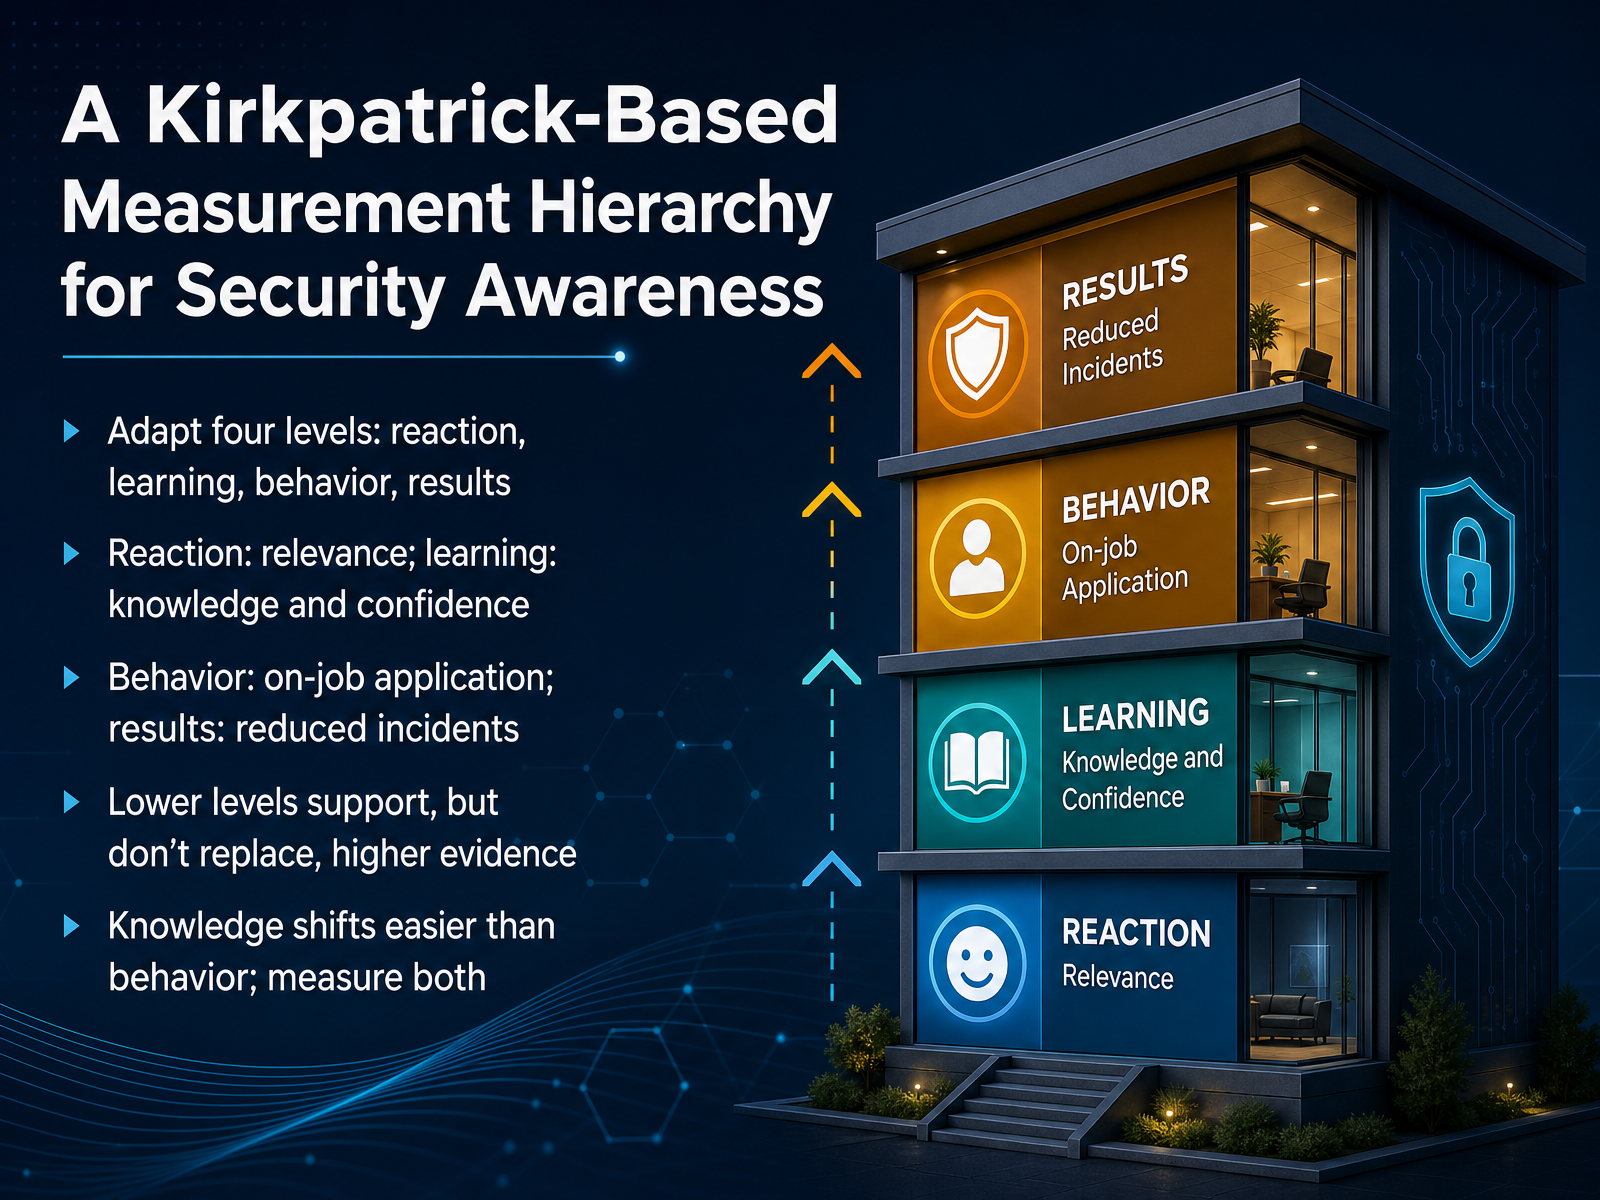
 - 04A Kirkpatrick-Based Measurement Hierarchy for Security AwarenessLet’s look at how we can structure our security awareness metrics using a recognized framework: the Kirkpatrick model. Adapted for security, it gives us four levels of evidence. Level one is reaction: did learners find the content relevant and engaging? Level two is learning: did they gain the knowledge and confidence to act? Level three is behavior: are they applying secure practices on the job? And level four is results: did we see a measurable reduction in incidents? Now, here is the key insight. Lower levels support the story, but they don’t replace higher evidence. It is good that employees enjoy the training, and even better that they can pass a quiz. But knowledge shifts far more easily than behavior. That is why you need to measure both. If you only track completion and satisfaction, you are measuring activity, not impact. Build your metrics to climb this hierarchy, and you will have the evidence to show your program is truly reducing human risk. This foundation sets up a critical distinction as we move forward: understanding the difference between leading and lagging indicators for human risk.
 jissec.orgdoi.orgscribd.com+21 min
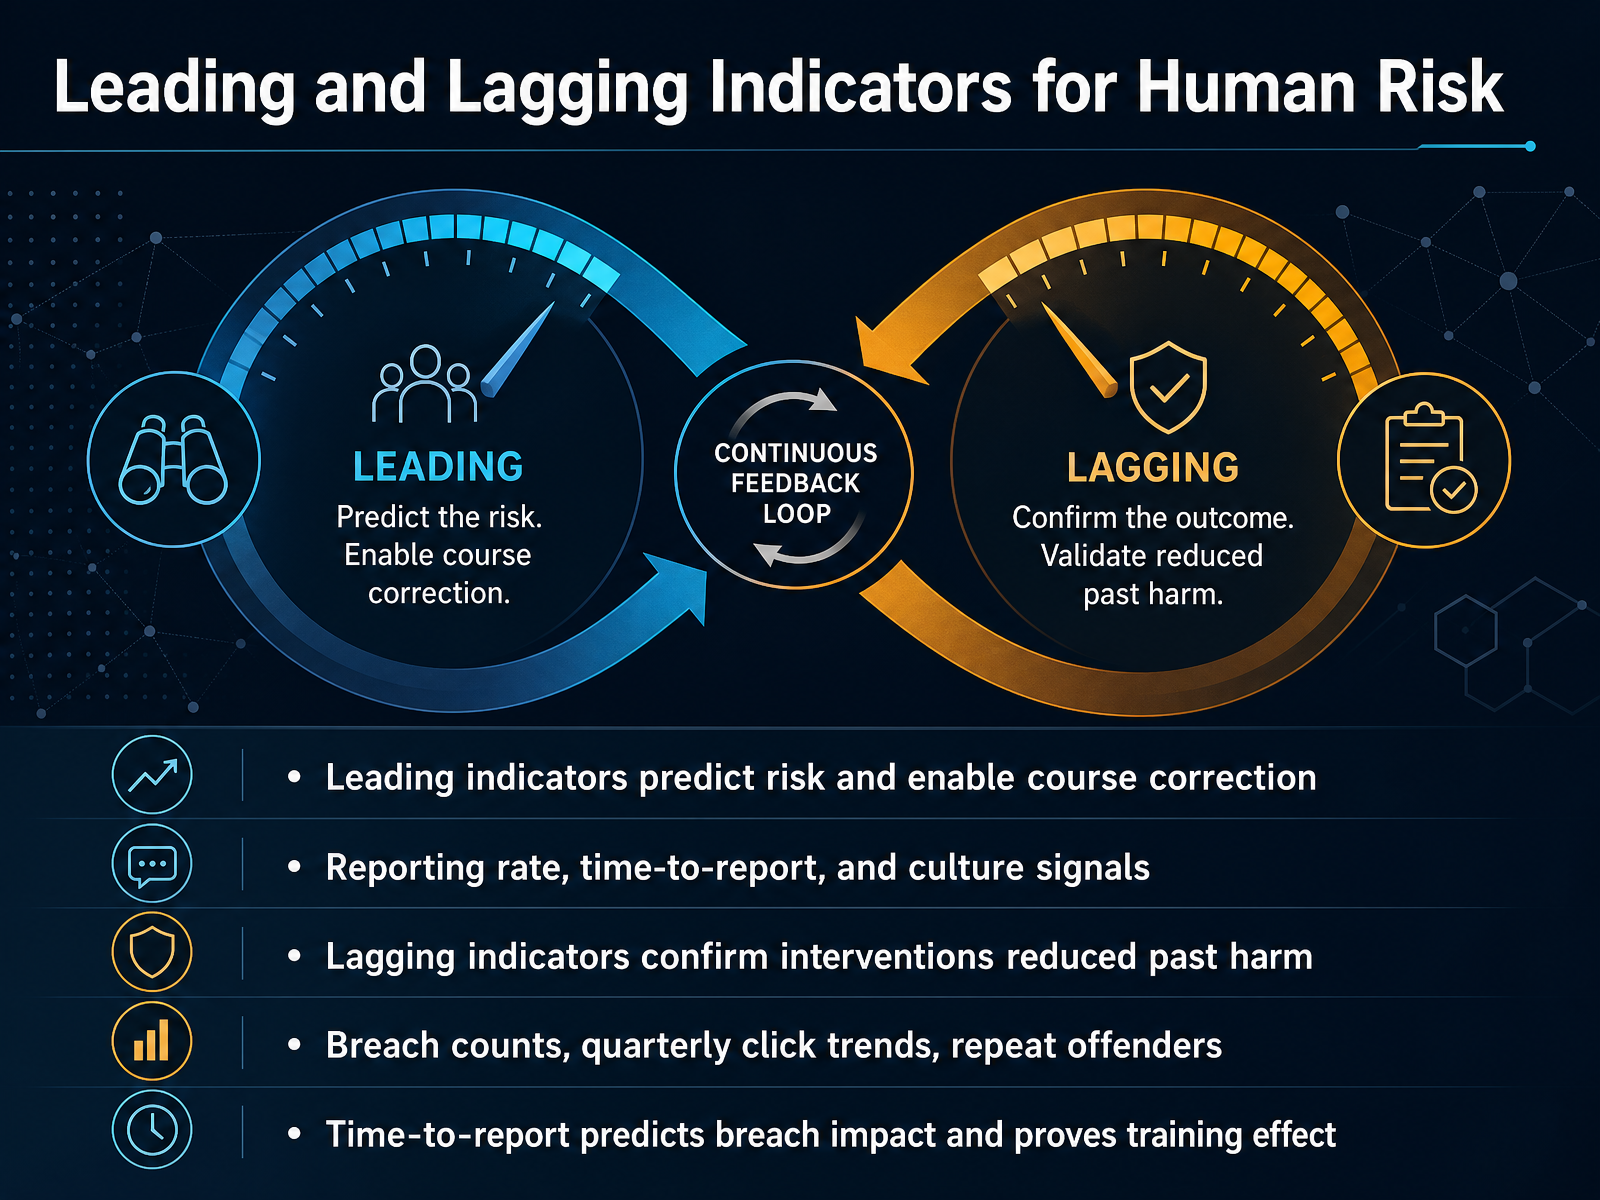
 - 05Leading and Lagging Indicators for Human RiskLet’s talk about how to read human risk across two time horizons. Leading indicators predict future outcomes and let you correct course before damage materializes. These are your early-warning signals: reporting rate, time-to-report, and culture signals like survey scores. When reporting rates climb, you’re seeing vigilance build in real time, not months later. Lagging indicators, by contrast, confirm whether past interventions actually reduced harm. Breach counts, quarterly click trends, and repeat-offender percentages tell that story. They validate your investments over a full measurement cycle. Now, time-to-report deserves special attention because it sits at the intersection of both categories. As a leading indicator, faster reporting shrinks dwell time, which directly lowers the probability of a breach reaching that costly two-hundred-day threshold. As a lagging indicator, declining report times after a Q1 training campaign prove the intervention worked. That dual role makes it the single most information-dense metric in your stack. The practical takeaway: leading indicators alone cannot prove outcomes, and lagging indicators alone arrive too late to prevent the next incident. You need both to steer effectively. Now let’s look at how to select the metrics that will actually drive your decisions.
 adaptivesecurity.comsans.orgnhimg.org+22 min
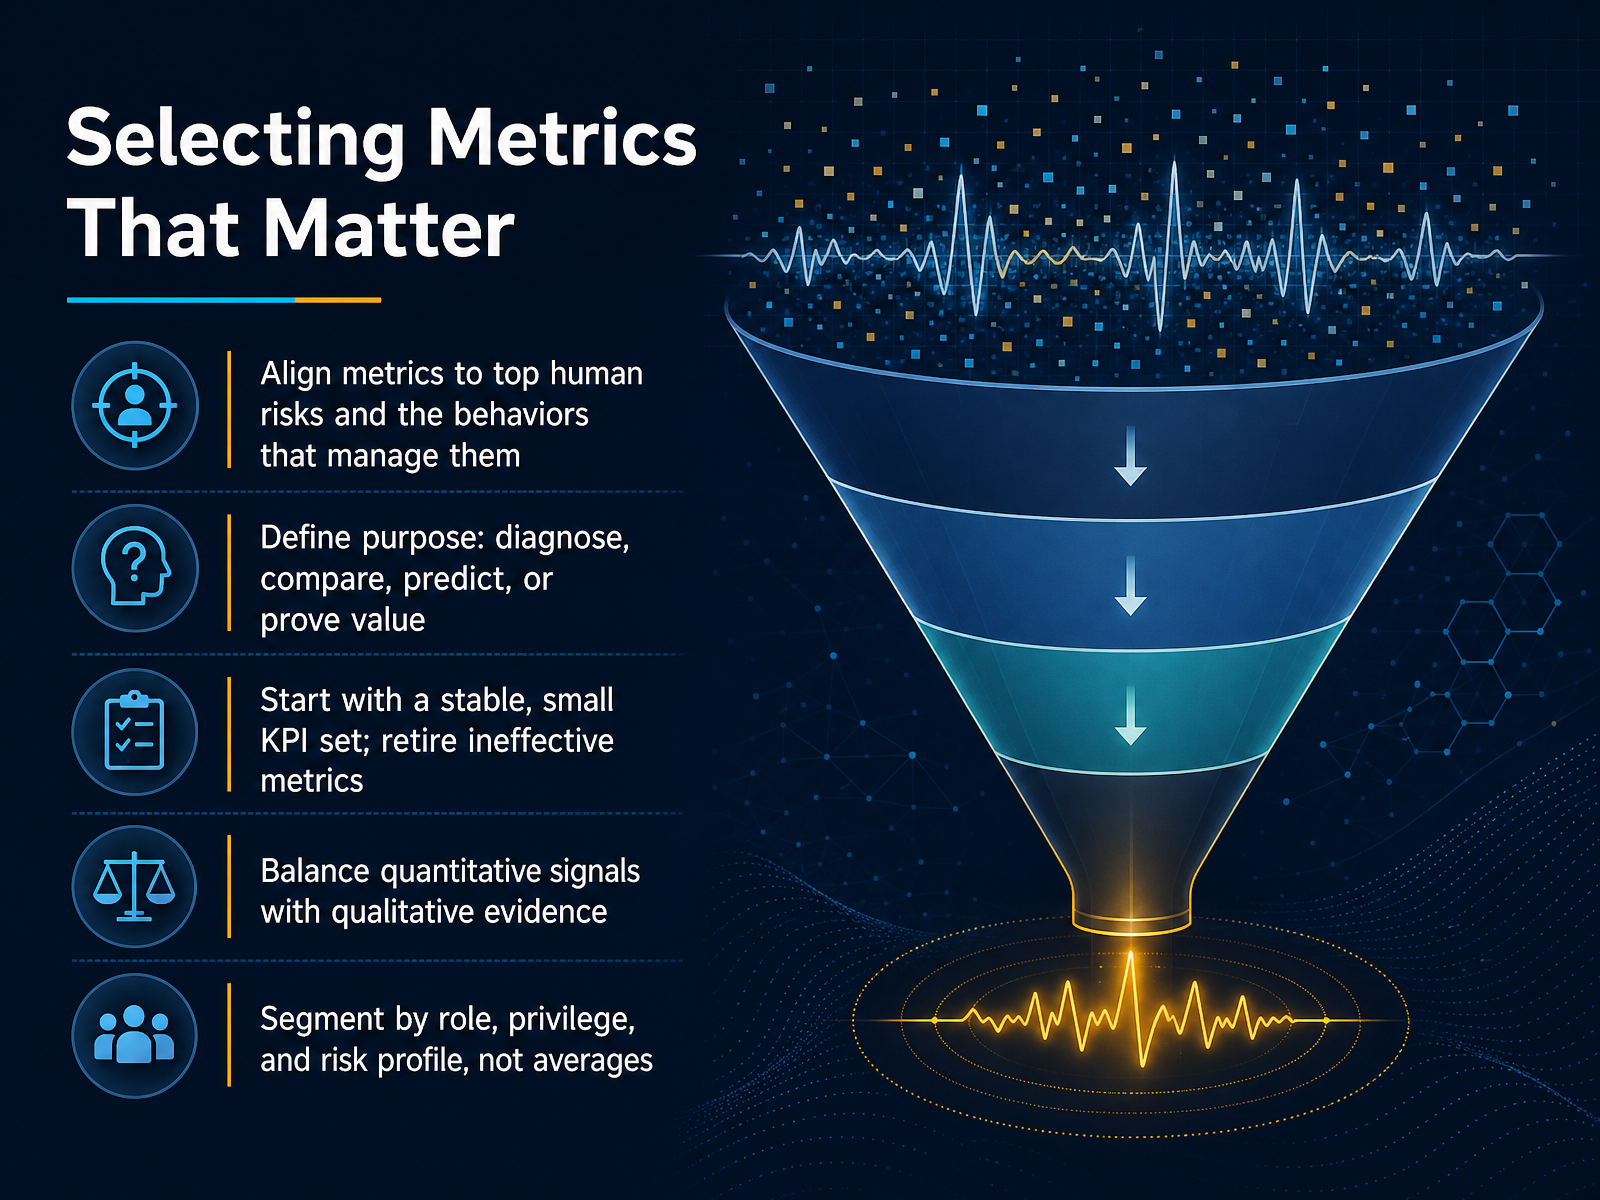
 - 06Selecting Metrics That MatterThis brings us to the critical choice: selecting metrics that matter. Start not with what's easy to measure, but with your top human risks and the specific behaviors that manage them. Decide what each metric is for. Are you diagnosing a problem, comparing groups, predicting future risk, or proving value? This clarity prevents collecting data that never drives a decision. Begin with a small, stable set of key performance indicators. Resist the urge to track everything. Add new metrics only after retiring ineffective ones, otherwise you'll drown in dashboards. Also, balance the quantitative signals, like reporting rates, with qualitative evidence from culture surveys. Numbers tell you what's happening; the human feedback tells you why. Finally, segment your data. Avoid the seductive trap of the organizational average. A single click rate hides the reality that your finance team may have a much higher risk profile than your marketing team. Analyze findings by role, privilege level, and risk profile to pinpoint where threats are real. With your selection criteria set, the next challenge is sourcing and integrating this data. Let's turn to that challenge.
 sans.orghoxhunt.comadaptivesecurity.com+22 min
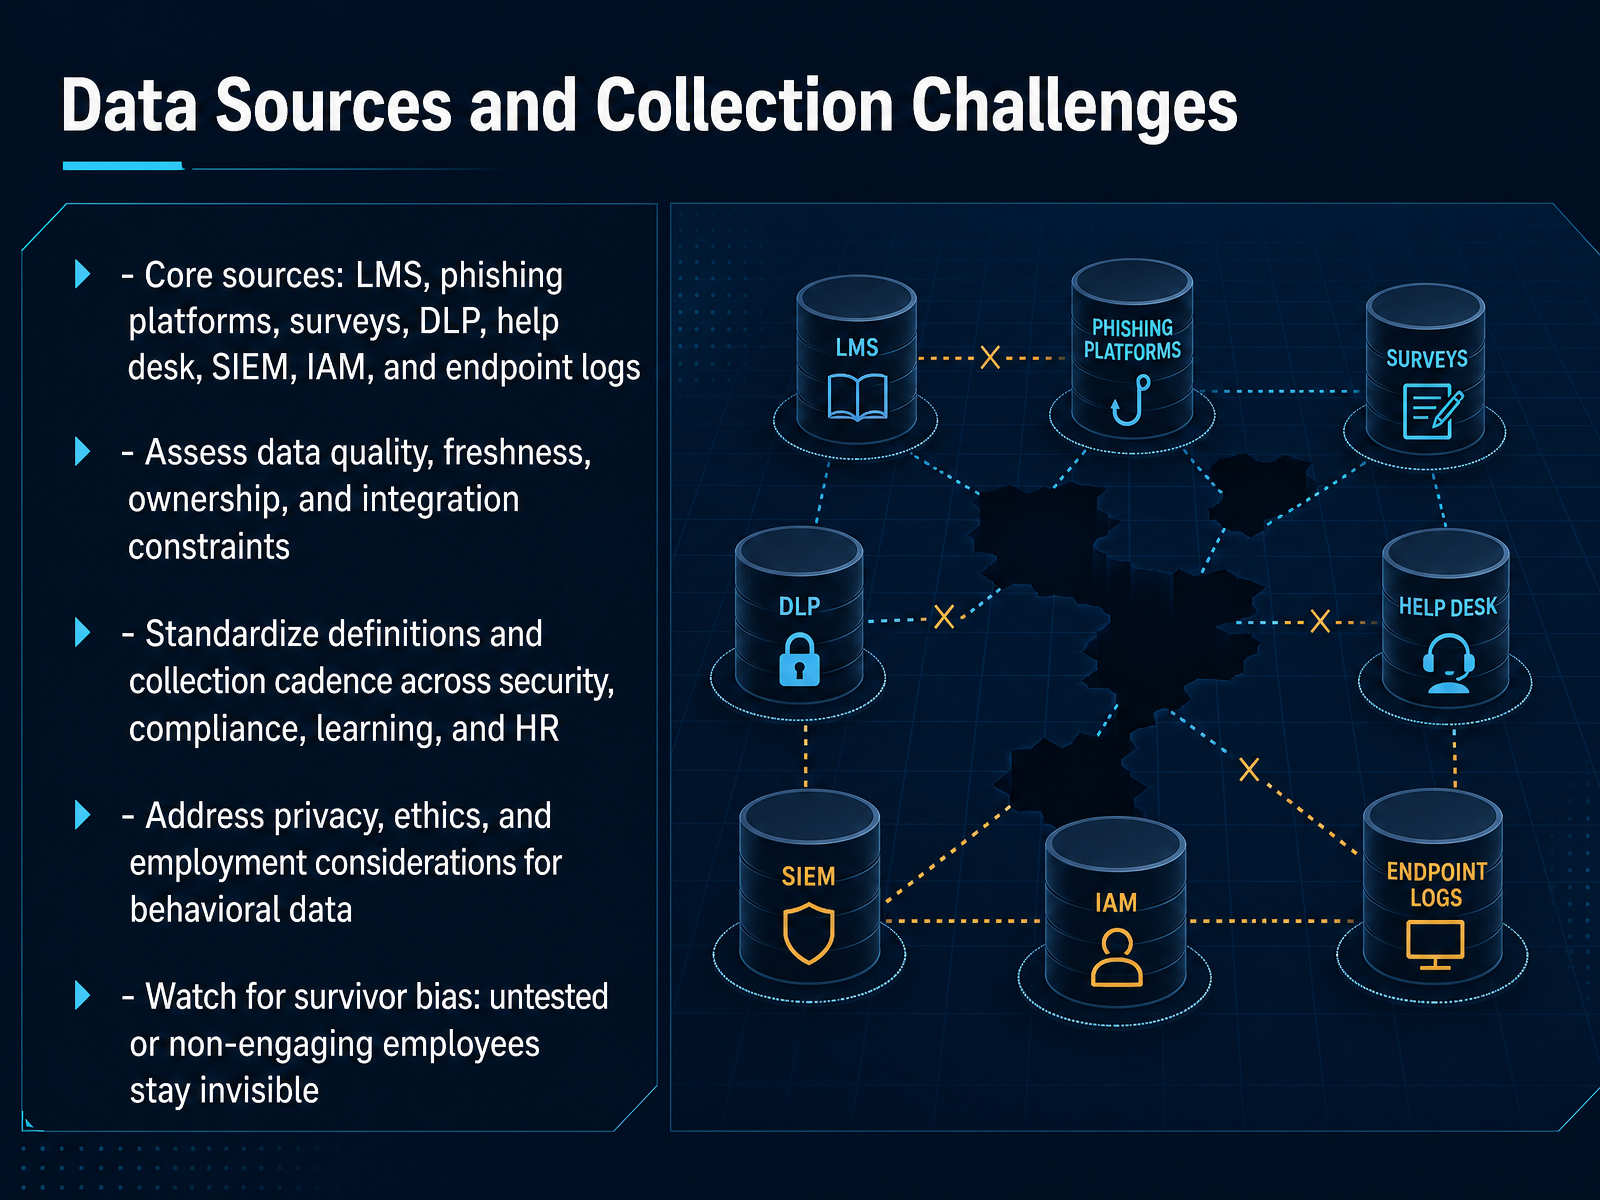
 - 07Data Sources and Collection ChallengesNow let's talk about where your data actually comes from, and why collection is often harder than it looks. Your core sources are the LMS, phishing platforms, surveys, DLP tools, the help desk, SIEM, IAM, and endpoint logs. Each one gives you a different slice of human behavior. But each one also comes with its own quality, freshness, and integration constraints. Before you build a single dashboard, standardize definitions and collection cadence across security, compliance, learning, and HR. If your HR system calls a term one thing and your security platform calls it another, your metrics will be unreliable from day one. You also need to address privacy, ethics, and employment considerations for behavioral data. Ensure any individual-level tracking has a clear lawful basis and a defined defensive purpose. And finally, watch for survivor bias. If only engaged employees take part in simulations or complete training, the employees who pose the highest risk stay invisible. Your metrics can look great while the real risk sits quietly in the gaps. So, audit your data quality, align your definitions across teams, and know exactly who is not showing up in your numbers. With that foundation, we can move on to building baselines and setting realistic targets.
 sans.orgtechtarget.comgithub.com+12 min
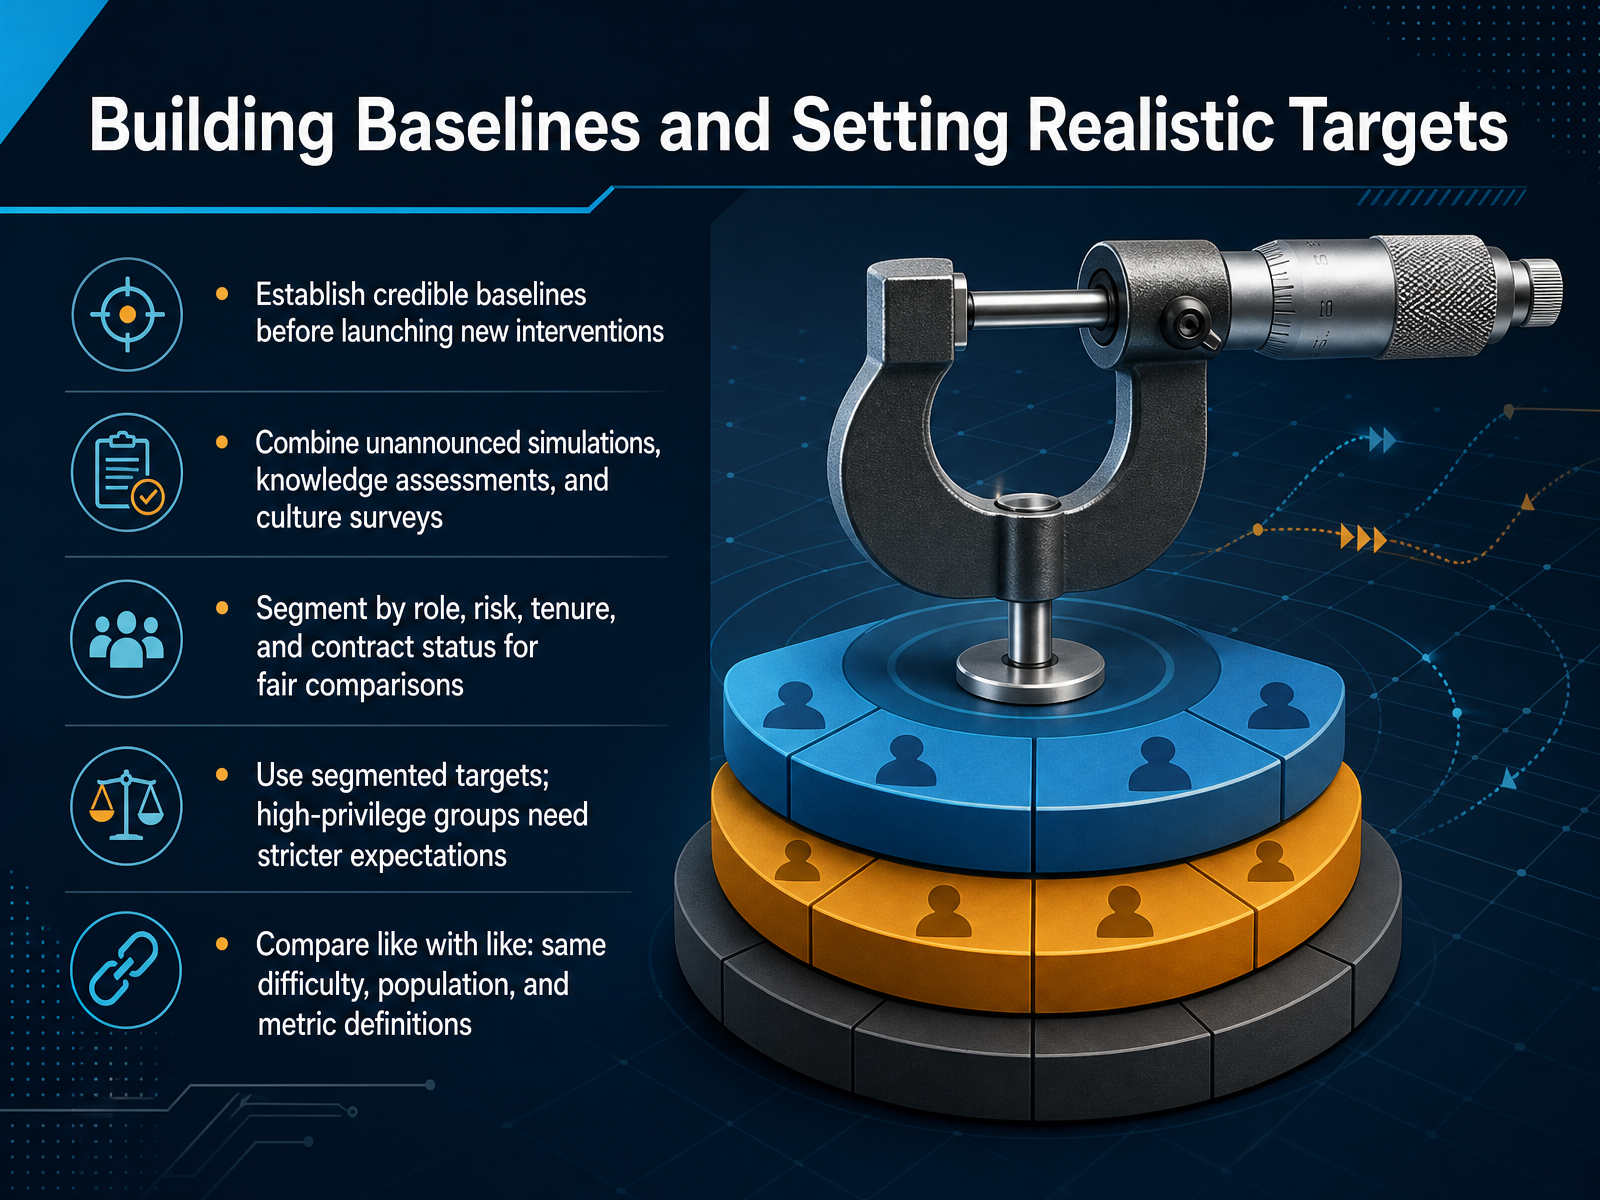
 - 08Building Baselines and Setting Realistic TargetsThis brings us to a critical step: building baselines and setting realistic targets. Before launching any new intervention, establish a credible baseline. Combine unannounced phishing simulations with short knowledge assessments and, where possible, culture surveys. This gives you both behavioral and knowledge data, because people who can describe phishing perfectly may still click. Now, segment your data by role, risk level, tenure, and contract status. A finance leader and a new intern face different threats, so compare like with like. Use the same simulation difficulty, the same population, and the same metric definitions each time. Set segmented targets accordingly. For high-privilege groups, expect stricter results, perhaps a failure rate below two percent, while for the general population, aim for steady improvement, say a thirty percent quarter-over-quarter reduction in risky clicks. Remember, the baseline is not a grade; it is a starting point. Direction matters more than the absolute number, especially in the first few cycles. So, define your denominators, lock your methodology, and keep it consistent. With solid baselines in place, you are ready to interpret trends and avoid false conclusions.
 sans.orglakeridge.iotechtarget.com+21 min
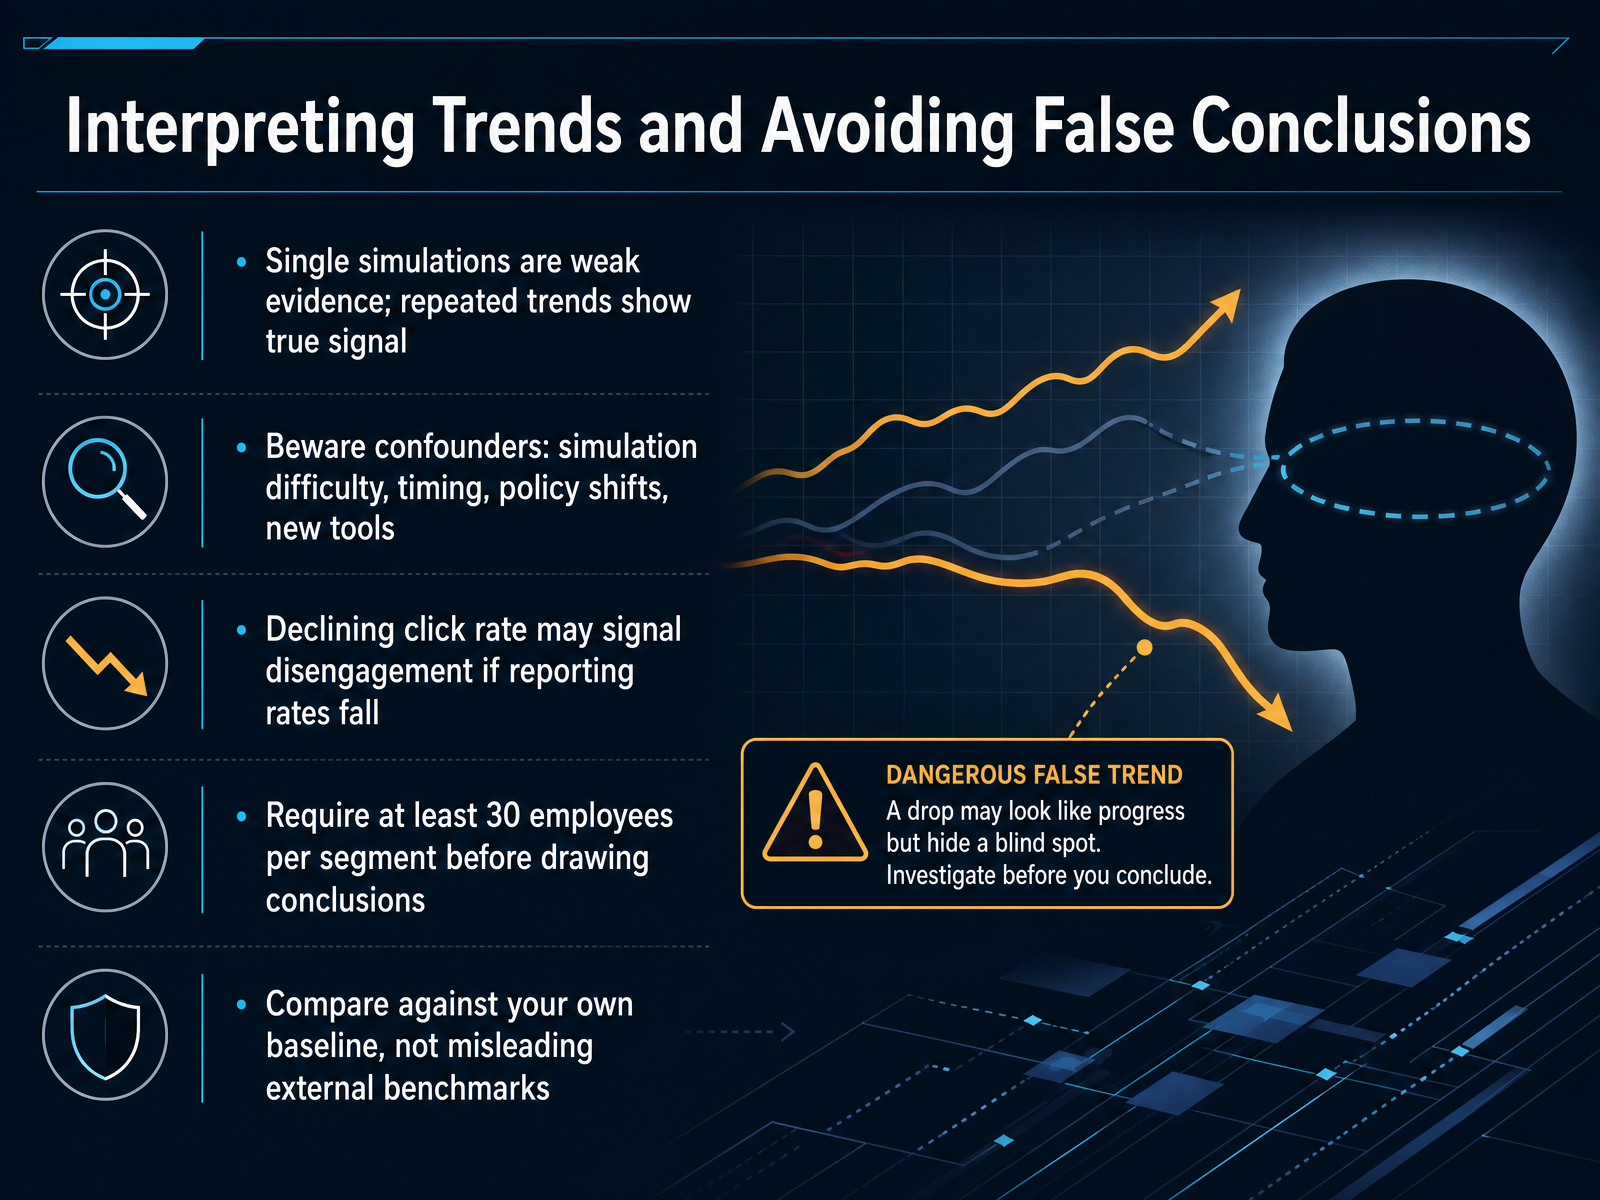
 - 09Interpreting Trends and Avoiding False ConclusionsNow let's talk about reading the trends behind the numbers. A single simulation is weak evidence. One bad day, one unusually tricky email, can swing a small team's numbers by several points. You need repeated cycles to separate real signal from noise. Also, beware of confounders. If you changed simulation difficulty, shifted send timing, or rolled out a new security tool, those factors move your metrics independently of employee behavior. A declining click rate can even signal disengagement if reporting rates are also falling. People may just be ignoring the simulation entirely. And before you draw conclusions about any department, hold the line at around thirty employees per segment. Anything smaller produces phantom trends. Finally, ignore external industry benchmarks. They're misleading because your simulation difficulty, culture, and tools differ. The only meaningful comparison is against your own historical baseline, measured consistently over time. Look for the pattern across several quarters, and you will see the true direction of your program. That sets us up nicely to talk about how to report these insights to executives and stakeholders.
 adaptivesecurity.comhoxhunt.comhoxhunt.com+22 min
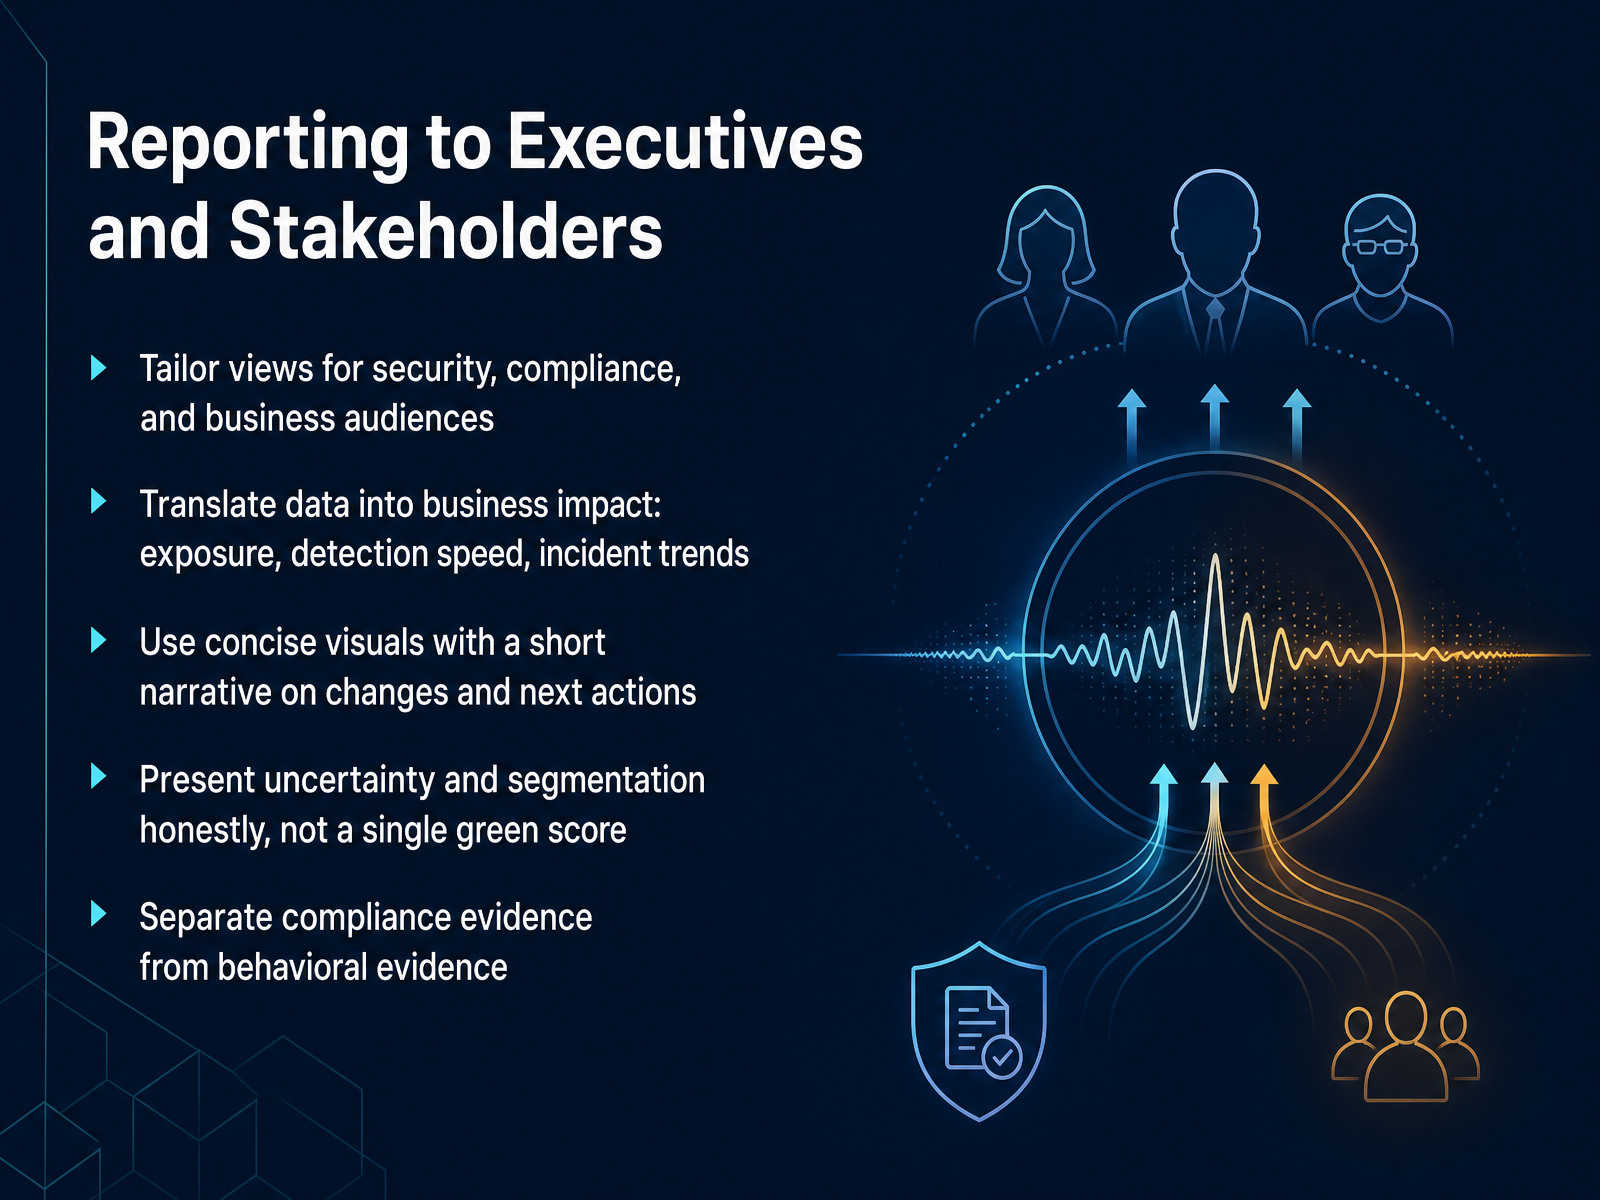
 - 10Reporting to Executives and StakeholdersWhen you present to executives, resist the urge to show everything. Start by tailoring your view to your audience. Security teams want granular detail, compliance wants evidence, but the business wants impact. For leadership, translate data into consequences they feel—dollar exposure, detection speed, and incident trends. Use a concise visual, and pair it with a short narrative that explains what changed and what you will do next. Be honest about uncertainty and segmentation. A single green score is comfortable, but it hides pockets of risk that need attention. If one department is trailing, show that. And the last point is critical: keep compliance evidence separate from behavioral evidence. Certifying that training was completed is not the same as proving behavior changed. Executives need both, but they answer different questions. One proves coverage, the other proves risk reduction. With this foundation in place, we can now look at how to use your metrics to improve the program itself. And that is what we will cover next.
 adaptivesecurity.comsans.orgnhimg.org+22 min
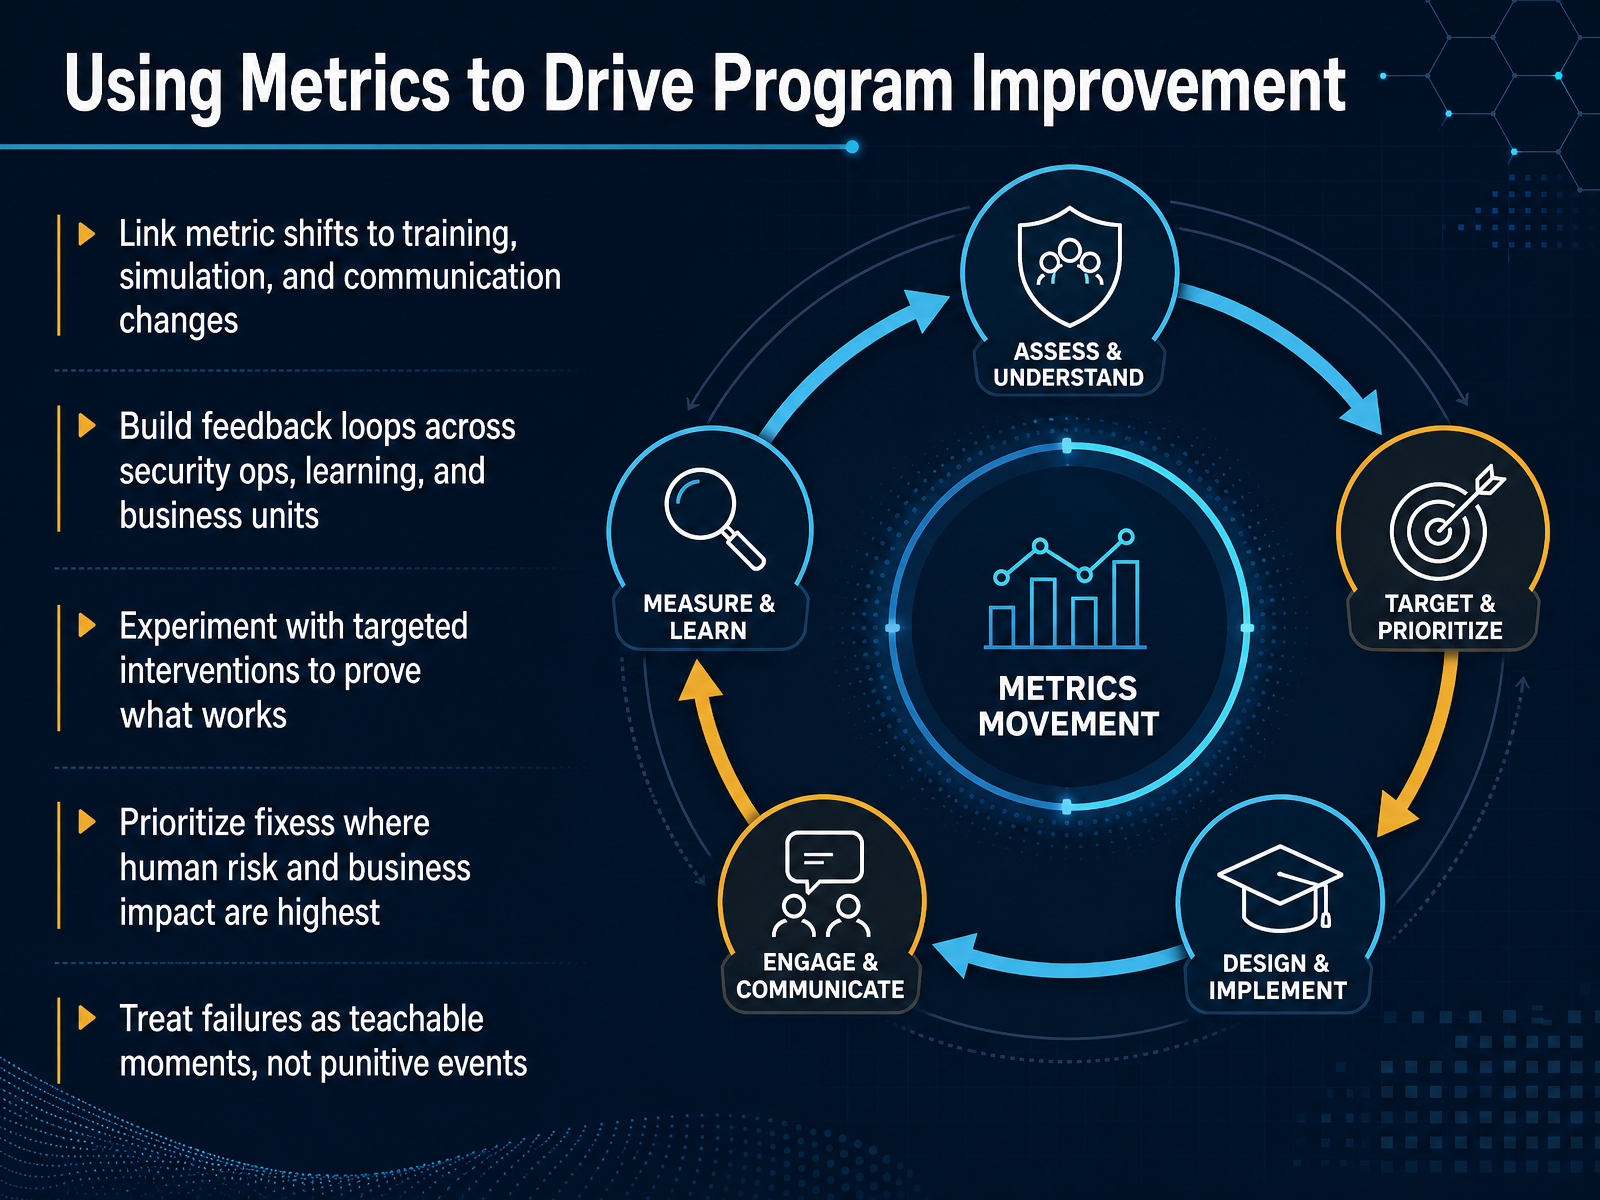
 - 11Using Metrics to Drive Program ImprovementSo once we have the data, how do we actually use it to make the program better? The first principle is to link metric shifts back to specific changes you've made. If you launched a new simulation campaign in Q2, the reporting rate should move in Q3. If it doesn't, you know that intervention didn't stick. Build feedback loops across security operations, learning, and the business units. When the SOC sees a real-world phishing trend, that intel should feed directly into your training content. And when a business unit's metrics improve, find out why, then apply those lessons elsewhere. Experiment with targeted interventions to prove what works. Run test groups against control groups, measure the delta, and scale up what delivers results. Then, prioritize fixes where human risk and business impact are highest. Don't spread your energy evenly. Focus on the teams handling finance, the privileged access users, and the repeat clickers who drive the majority of incidents. Finally, treat failures as teachable moments. The organizations showing real progress are not the ones with zero clicks; they are the ones where employees who fail get immediate coaching, learn from it, and become their most vigilant reporters next time. When employees report threats, celebrate them. That shifts the behavior and shifts your culture. Now, let's talk about how to put those phishing, reporting, and repeat-risk metrics into practice.
 sans.orghoxhunt.comadaptivesecurity.com+22 min
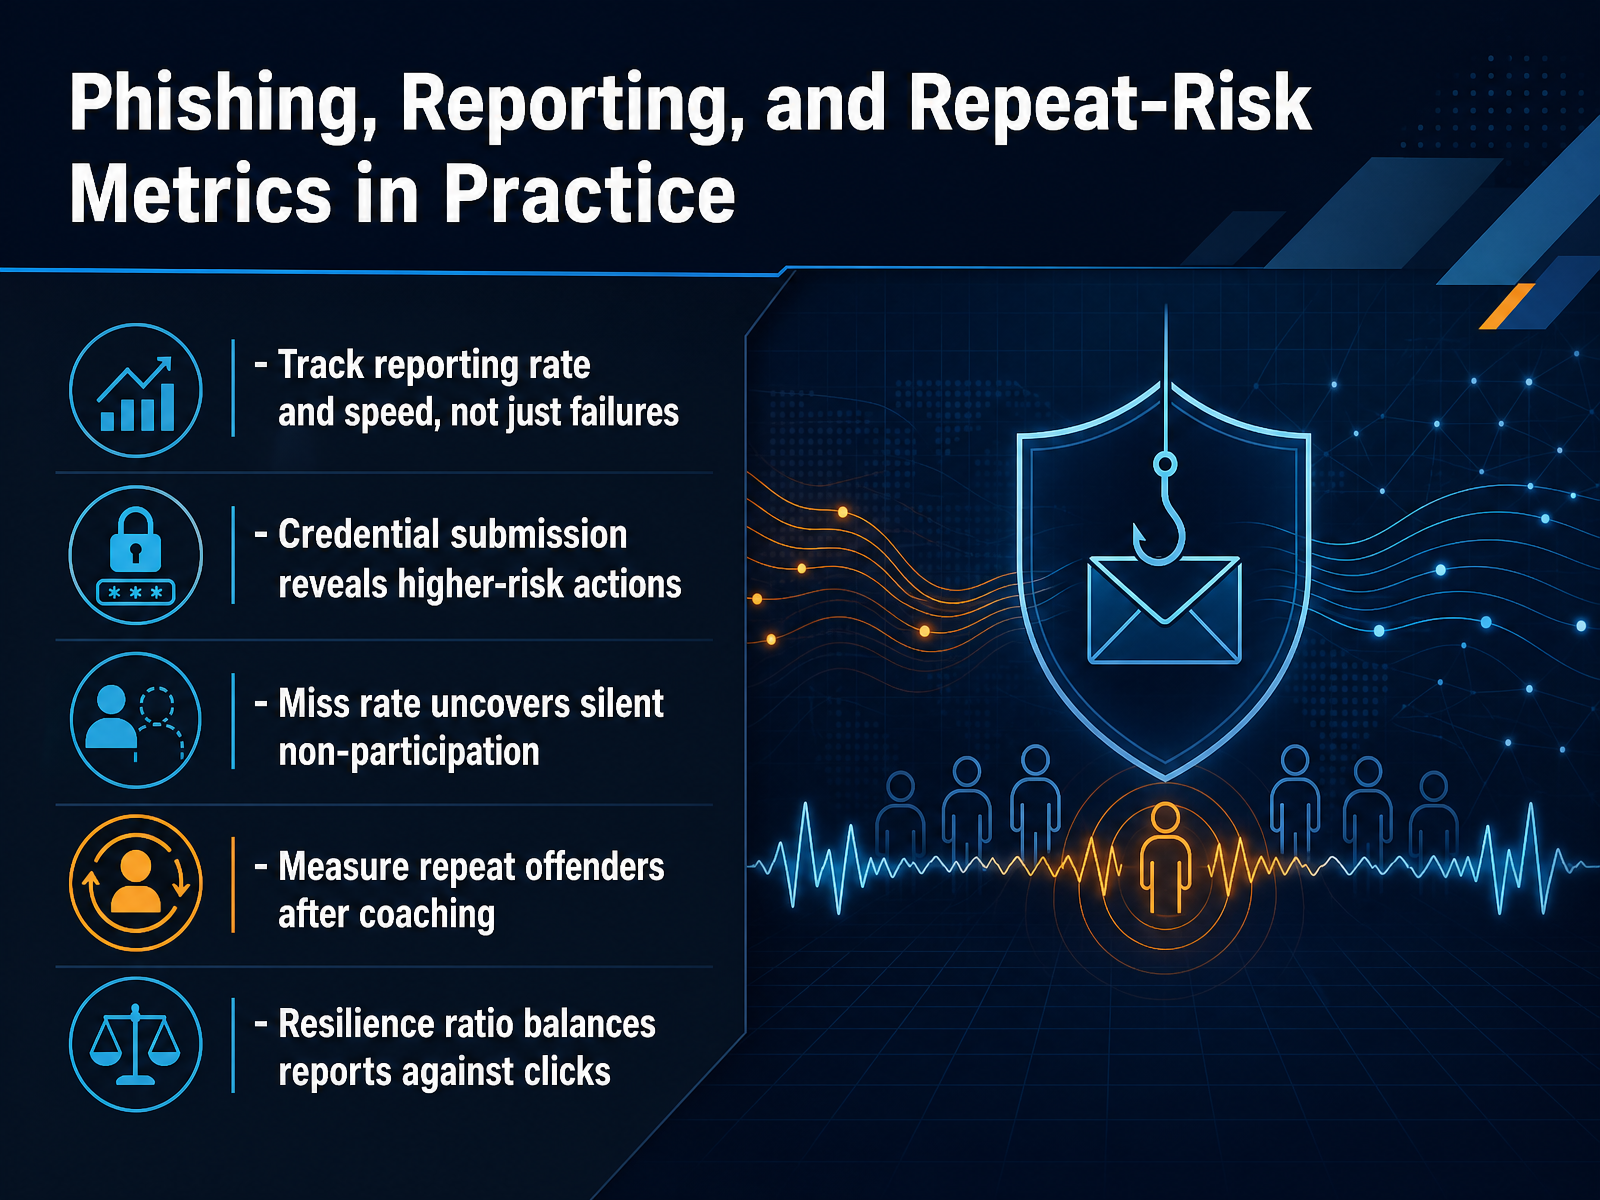
 - 12Phishing, Reporting, and Repeat-Risk Metrics in PracticeNow let's put these metrics into practice. When you look at phishing data, track the reporting rate and the speed of reporting, not just the failures. A click is a miss, but a report is active defense. Credential submission matters more than a simple click, because it signals a higher-risk action that could lead to account compromise. Then, look at your miss rate, those who neither click nor report. A high miss rate reveals silent non-participation, which means you are flying blind with that segment of the workforce. And here is the key: measure repeat offenders after coaching. If someone fails again after targeted intervention, that points to a design problem in your approach, not just a user problem. Finally, track a resilience ratio that balances reports against clicks. A ratio above three to one shows a workforce that is detecting and escalating threats, not just passively avoiding them. That is the profile of genuine human risk reduction. Next, we will look at the privacy and ethics considerations that should govern how you collect and act on this data.
 adaptivesecurity.comhoxhunt.comhoxhunt.com+21 min
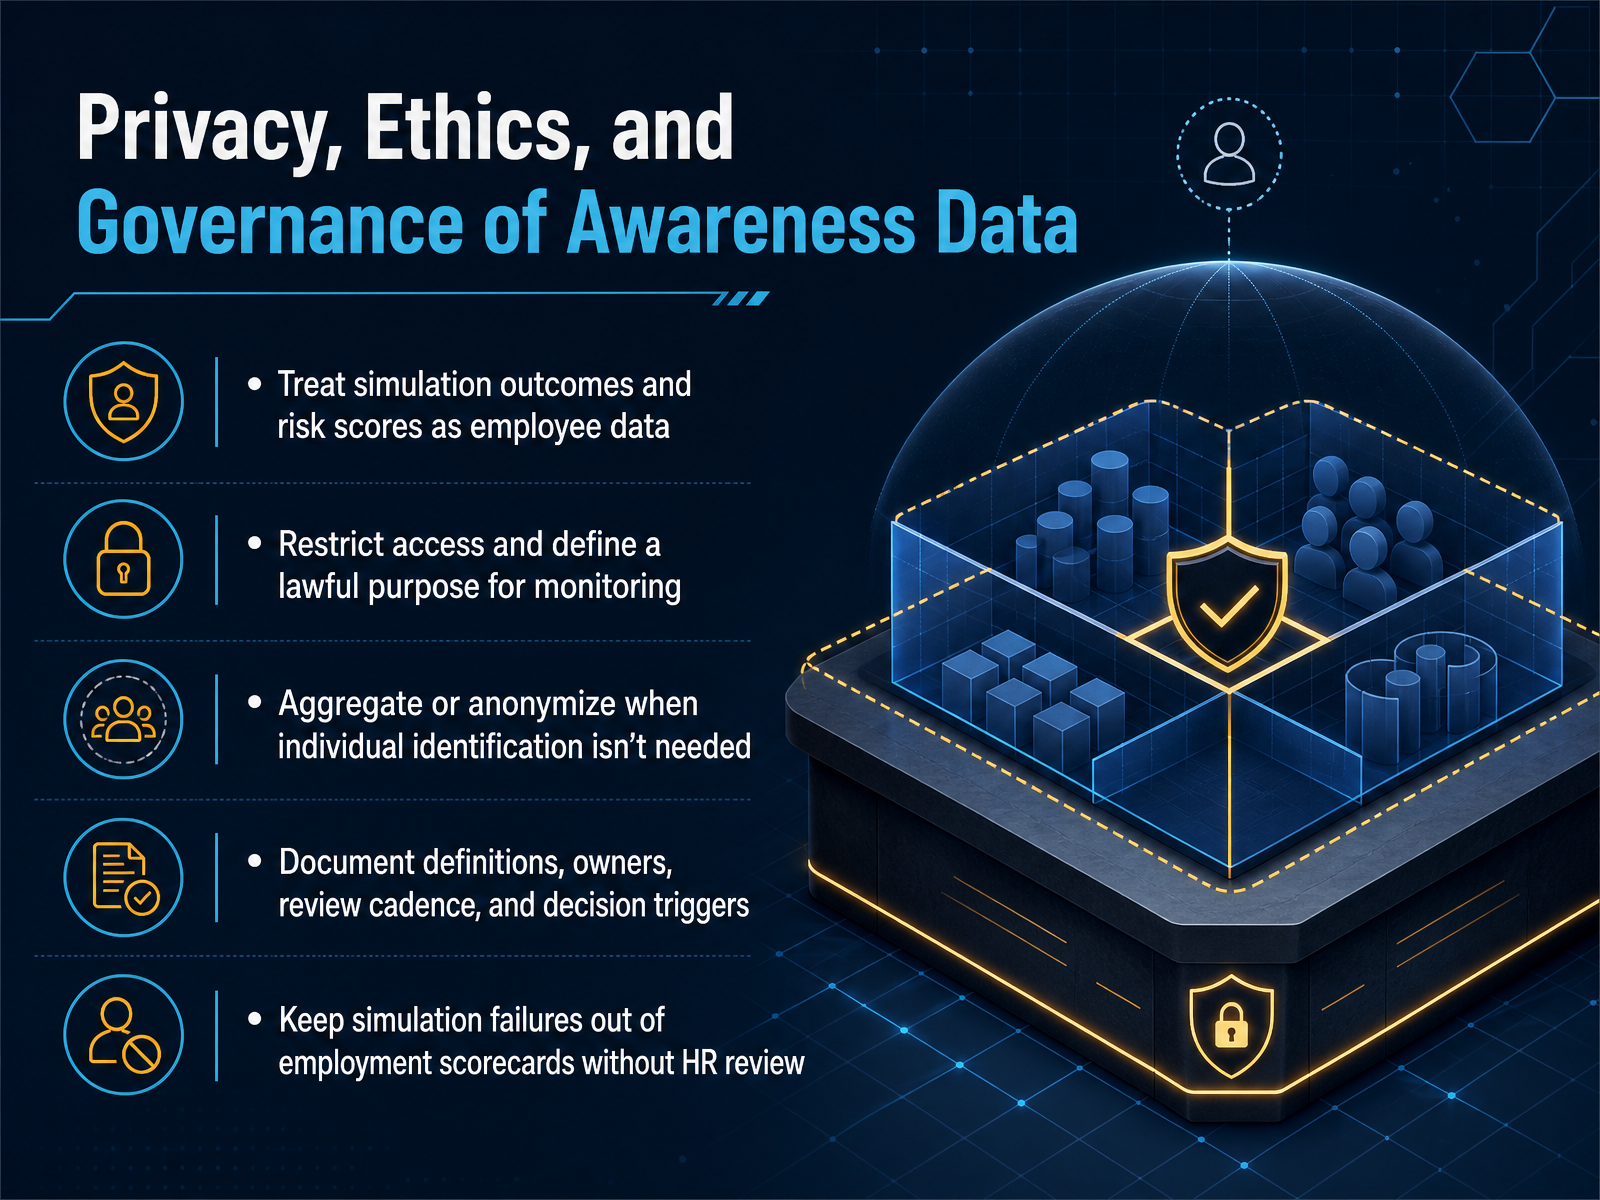
 - 13Privacy, Ethics, and Governance of Awareness DataNow let's turn to a topic that can make or break your credibility: privacy, ethics, and governance of awareness data. Treat simulation outcomes and risk scores as what they truly are: sensitive employee data. Restrict access to those with a defined, lawful purpose for monitoring. No one should be browsing individual results out of curiosity. When individual identification isn't needed for the decision at hand, aggregate the data or anonymize it. Document your definitions, owners, review cadence, and what triggers an action. And critically, keep simulation failures out of employment scorecards unless HR has explicitly reviewed and approved that process. If this data is misused, you lose the trust of the workforce and the integrity of your metrics. Governance is what allows measurement to be both effective and defensible. With this foundation in place, let's look at how maturity models and governance frameworks help you plan your next steps.
 sans.orgtechtarget.comgithub.com+11 min
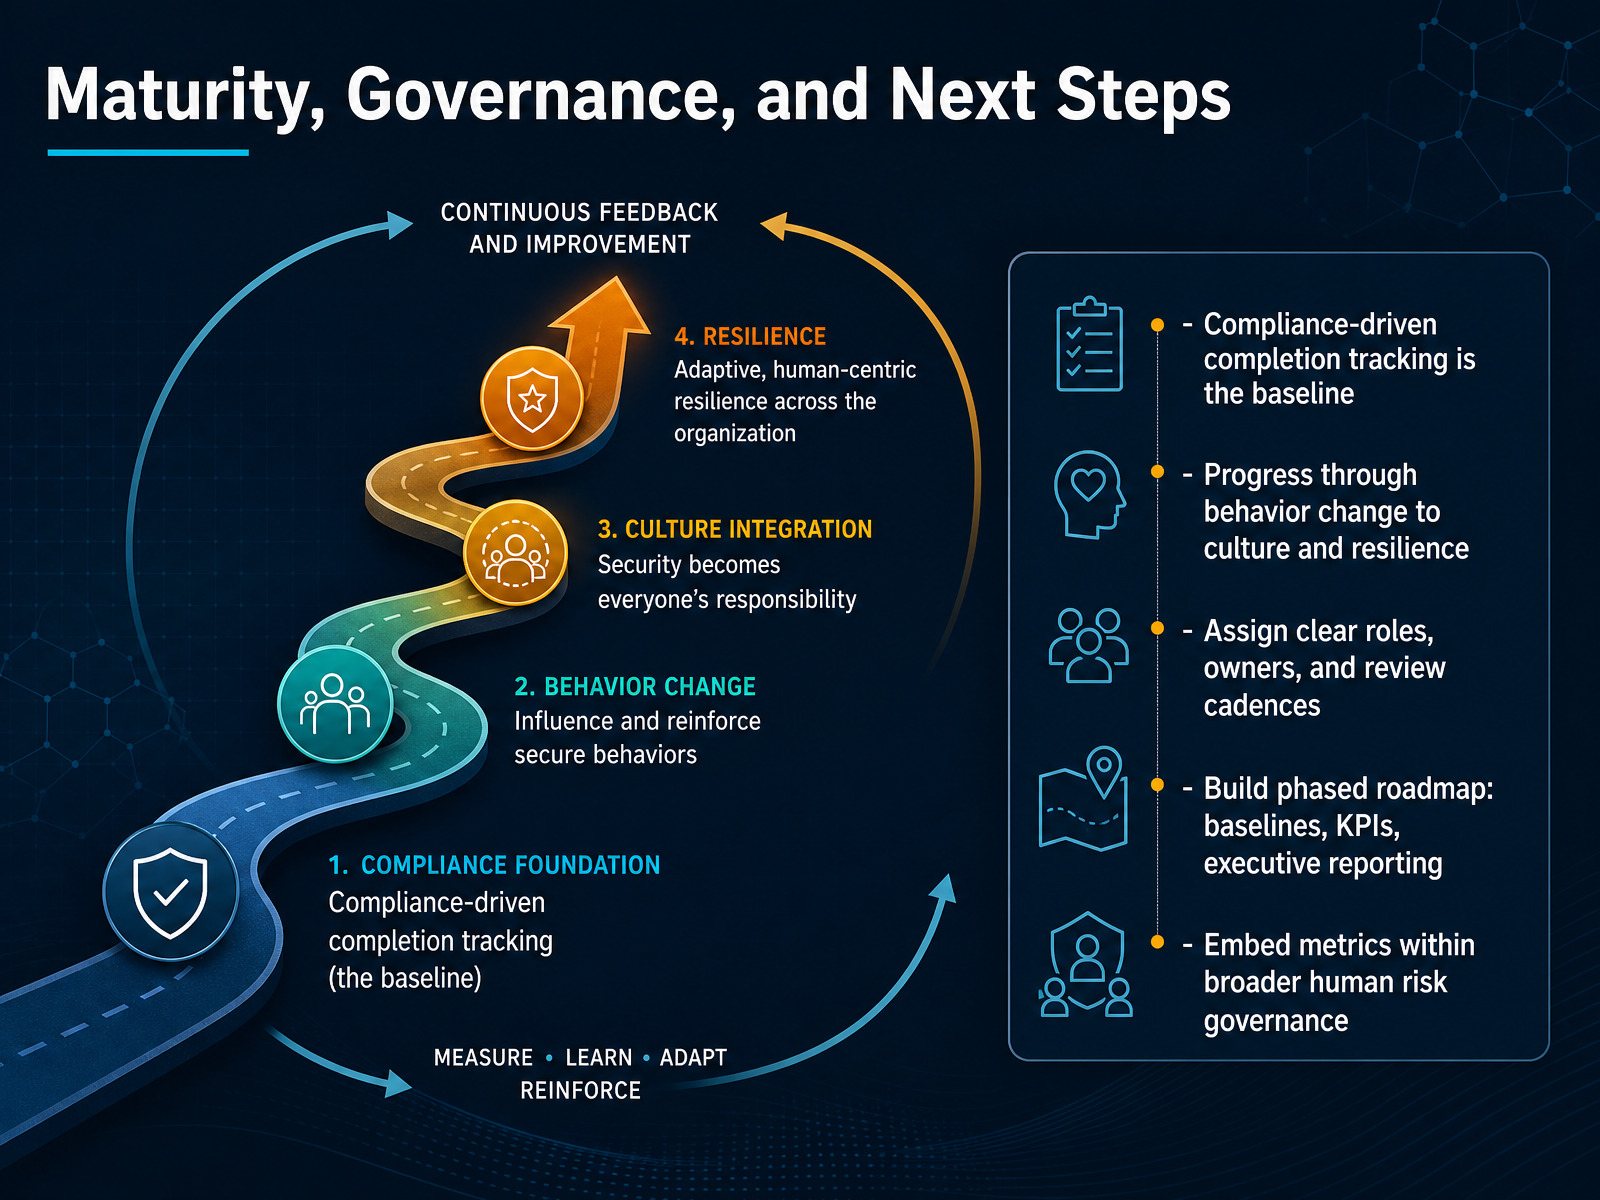
 - 14Maturity, Governance, and Next StepsSo, where does this leave us? Compliance-driven completion tracking is your baseline, but it is only the beginning. The real goal is to move through behavior change and into lasting culture and resilience. That journey requires clear roles, named owners, and a review cadence that keeps this on the leadership agenda. Build a phased roadmap. Start with your baselines, then layer in the KPIs that show progress, and finally, formalize the executive reporting. Embed these metrics inside your broader human risk governance so they inform decisions about where to invest next, not just what to report. Treat this as a continuous improvement loop, not a finish line. Remember, a mature program demonstrates tangible return on investment, and that is the standard you should be working toward. Thank you for your time and for your commitment to building a more resilient organization. You now have the framework and the measures to make it happen.
 adaptivesecurity.comsans.orgnhimg.org+22 min
Take the deck with you
Download this course as a file — free, no sign-up needed.
- PDF handoutEvery slide page, ready to print or share.15 pages · 3.9 MBDownload
- Narrated PowerPointThe deck that presents itself — every slide carries the digital human's narration video.15 pages · 27.5 MBDownload
- PowerPoint slidesThe full deck as a .pptx — open it in PowerPoint, Keynote, or Google Slides.15 pages · 3.8 MBDownload
Free to use in your own training — please keep the PersonWise credit page at the end.
Have your own deck? Turn it into a course
Sources consulted
Web sources consulted while building this course.
- V19N2_Alshammari.html — Journal of Information Systems Security — jissec.org
- Evaluating protection motivation based cybersecurity awareness training on Kirkpatrick's Model — doi.org
- Evaluating Protect Motivation Kirkpatrics Model | PDF | Computer Security | Security — scribd.com
- | How to Evaluate the Maturity of Your Security Awareness Training | KirkpatrickPrice — explore.kirkpatrickprice.com
- NIST SP 800-50, Building an Information Technology Security Awareness and Training Program — csrc.nist.rip
- Security Awareness Training: An Evaluation Framework | Adaptive Security — adaptivesecurity.com
- We’re Running Security Awareness Training. Why Isn’t Risk Going Down? - Hoxhunt — hoxhunt.com
- Cybersecurity compliance training fails when completion becomes the metric — nhimg.org
- Beyond awareness: Human risk management metrics for CISOs | TechTarget — techtarget.com
- Measuring what counts | 2LRN4 — 2lrn4.com
- SANS Security Awareness Blog Post | Security Awareness Metrics – What to Measure and How — sans.org
- Security Awareness Metrics That Matter: Predicting Breach Reduction - Hoxhunt — hoxhunt.com
- Driving Real Behavior Change — proofpoint.com
- ECC 1-10-1: Measure Effectiveness of Awareness Programs - LakeRidge — lakeridge.io
- SANS 2026 Security Awareness & Culture Report | SANS Institute — sans.org
- What should organisations measure in adaptive security awareness programmes? — nhimg.org
- Security Awareness Training Metrics & KPIs | Datapath — mydatapath.com
- Best Practices for Security Awareness Training in 2026 — adaptivesecurity.com
- plugins/privacy-audit-skills/skills/privacy-program-metrics/SKILL.md — github.com
- Security Awareness Training Platform Data Privacy: GDPR, Risk Scores, and Procurement Criteria | Adaptive Security — adaptivesecurity.com