Begin
14 pages · ~28 min
Understanding Type 2 Error Statistics
This training explains Type 2 error statistics for analysts and researchers, covering how to identify and reduce false negative risk in hypothesis testing.
A digital instructor presents all 14 pages. Hold “Ask” at any point and ask out loud — the answer comes from this course. No sign-up needed.
What you’ll learn
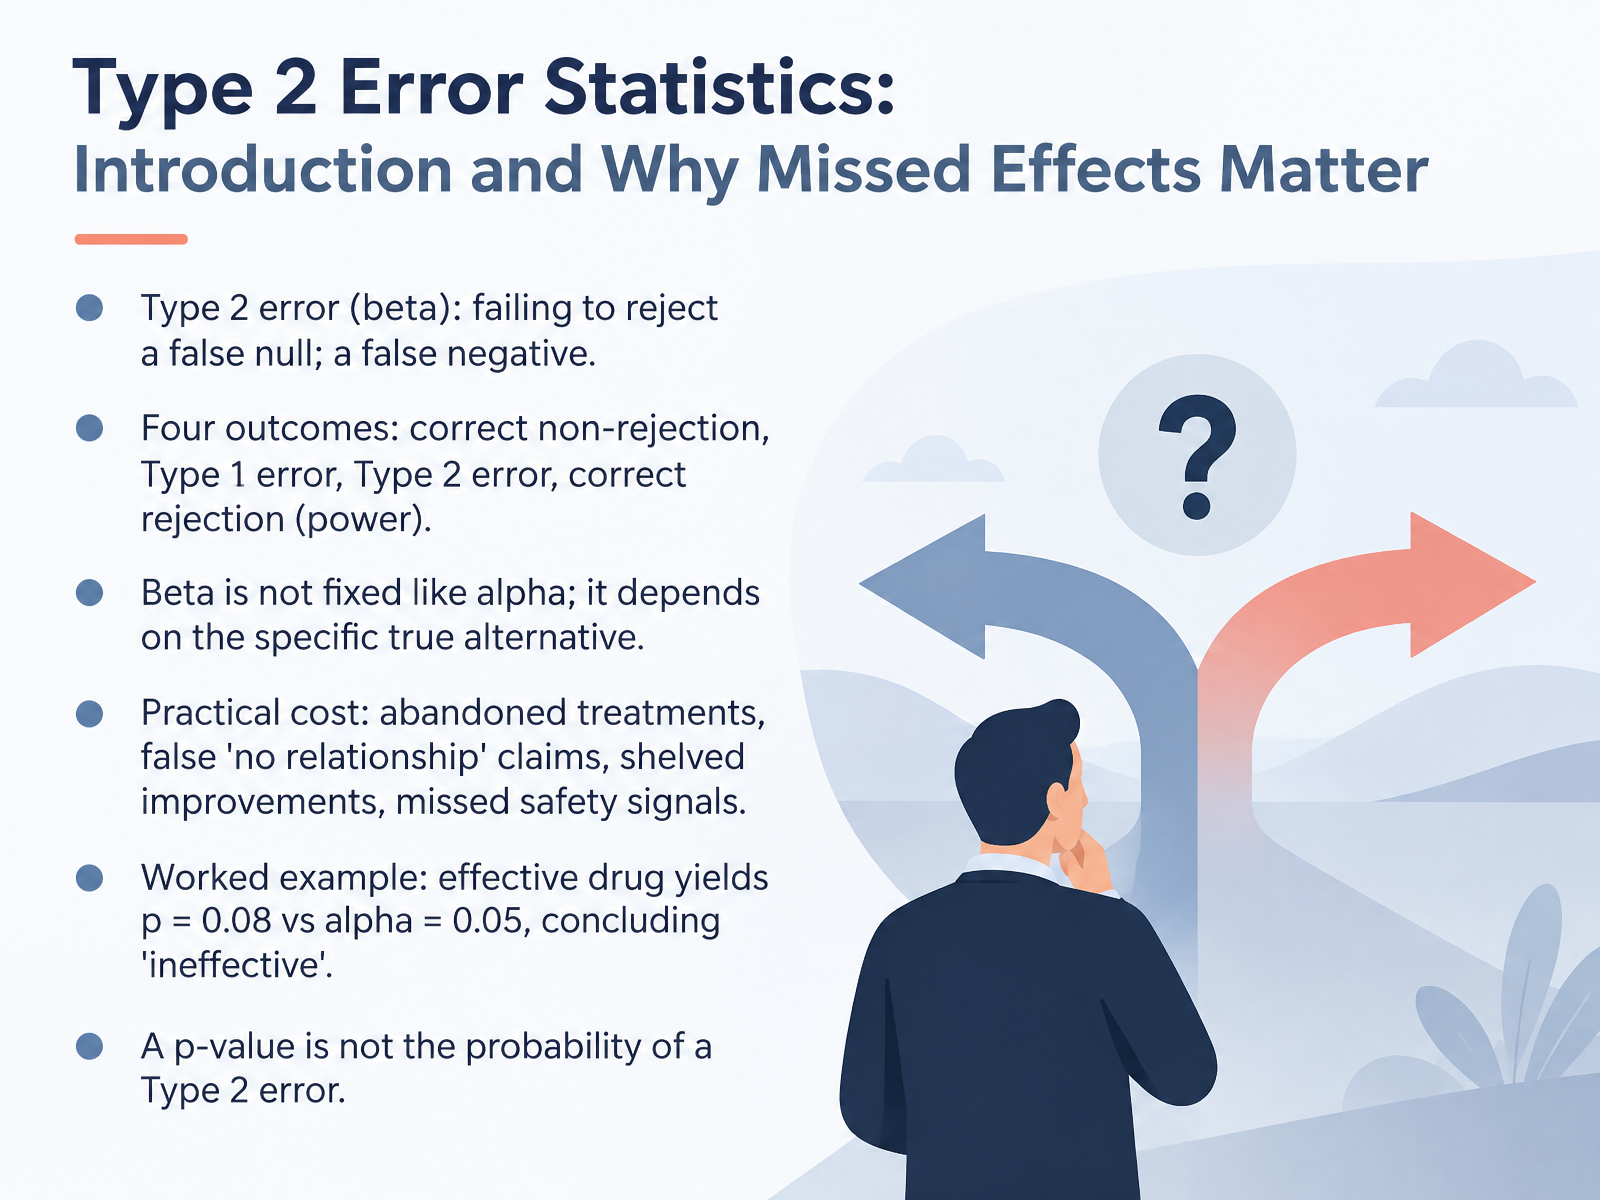
- 01Type 2 Error Statistics: Introduction and Why Missed Effects MatterWelcome. In this course, we are going to talk about Type 2 error statistics, and why missed effects matter. This is the error we make when a real effect exists, but our test fails to detect it. Statisticians call it beta, a false negative. It is one of four possible outcomes in hypothesis testing: correct non-rejection, Type 1 error, Type 2 error, and correct rejection, which is called power. Here is a key point. Unlike alpha, beta is not fixed. It depends on the specific true alternative, so it changes with effect size, sample size, and variability. The practical cost can be serious: abandoned treatments, false claims of no relationship, shelved product improvements, and missed safety signals. Imagine a truly effective drug produces a p-value of zero point zero eight, while alpha is zero point zero five. The test does not reject, and we wrongly conclude the drug is ineffective. Finally, remember that a p-value is not the probability of a Type 2 error. Next, we will build the decision framework: alpha, beta, and power.2 min
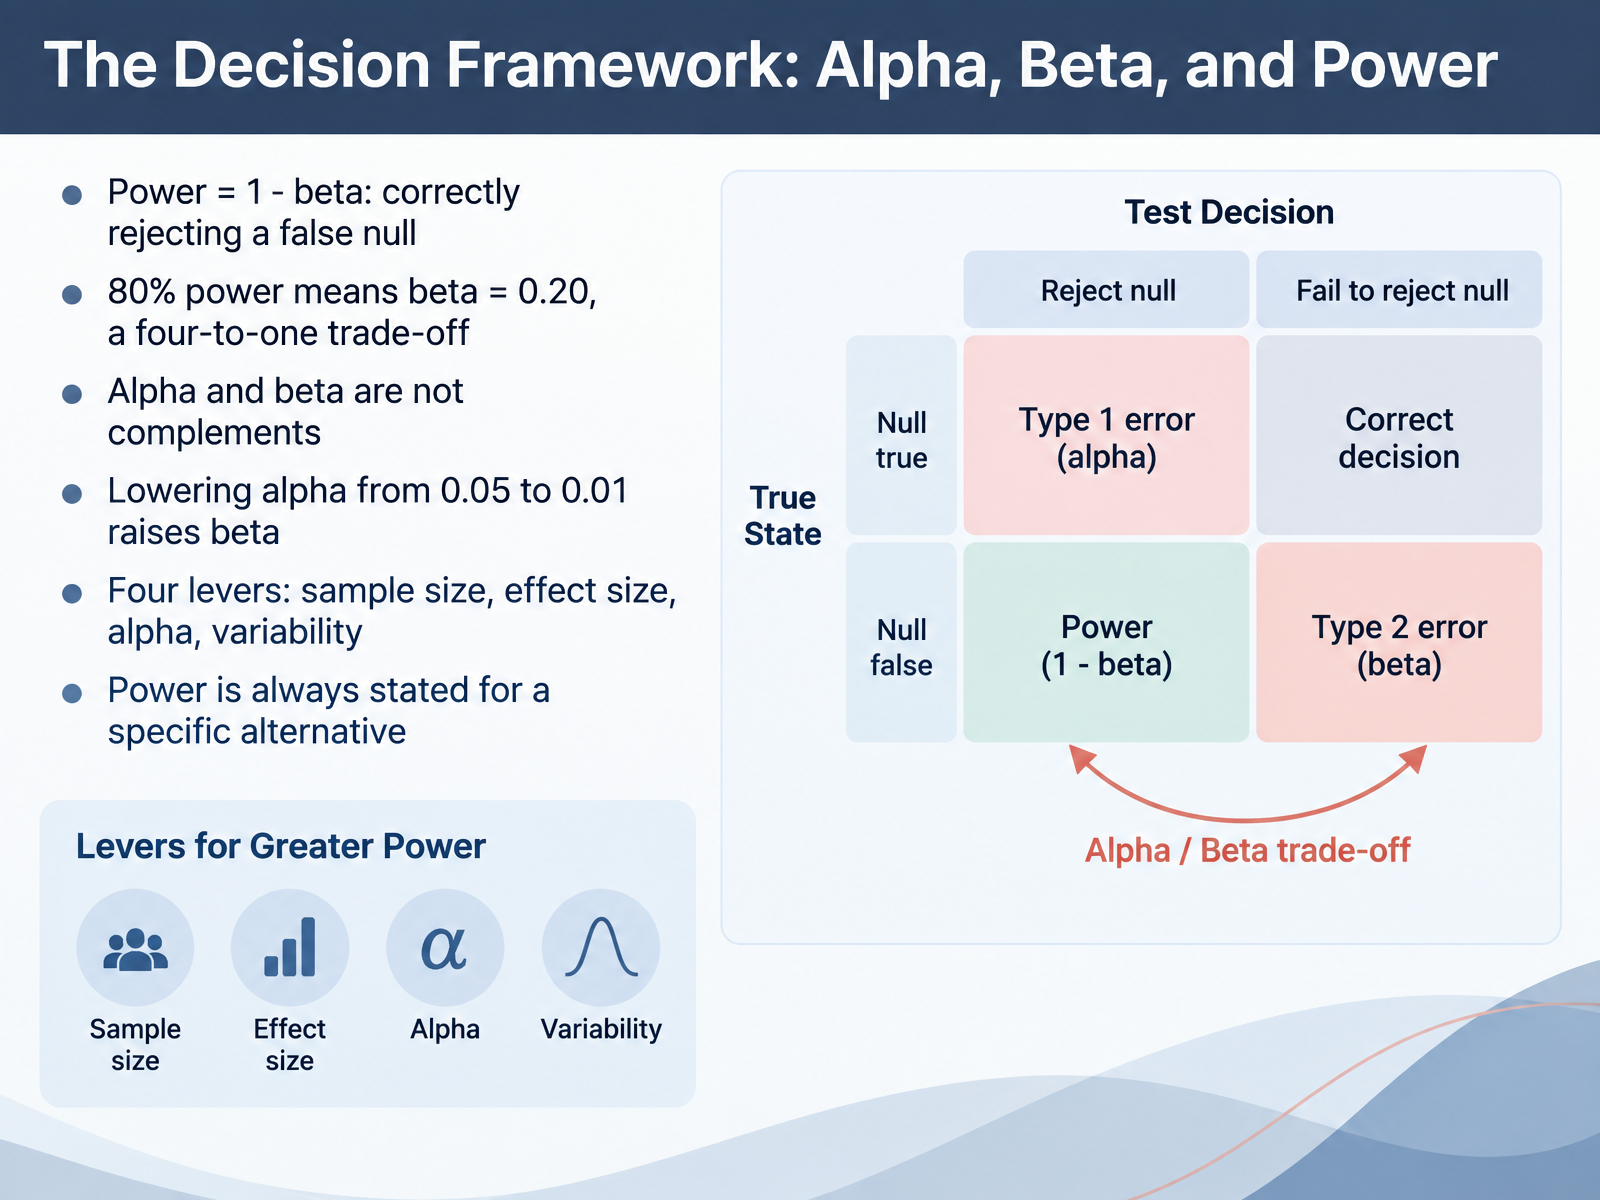
- 02The Decision Framework: Alpha, Beta, and PowerNow let's set up the decision framework that ties these ideas together: alpha, beta, and power. Think of a hypothesis test as a decision with two possible mistakes. Alpha is the chance of a false alarm, rejecting a true null hypothesis. Beta is the chance of a missed effect, failing to reject a null that is actually false. Power is simply one minus beta, the probability of correctly rejecting a false null. When someone says a study has eighty percent power, that means beta equals zero point two zero, so the odds of catching a real effect are about four to one. Here is a key point: alpha and beta are not complements. They measure different errors, so one minus alpha does not equal power. And they interact. If you lower alpha from zero point zero five to zero point zero one, you make false alarms rarer, but beta typically rises, making missed effects more likely. Four levers shape power: sample size, effect size, alpha, and variability in the data. Last, power is always stated for a specific alternative, because a test has different power for different effect sizes. Next, let's visualize this with null and alternative sampling distributions.
 2 min
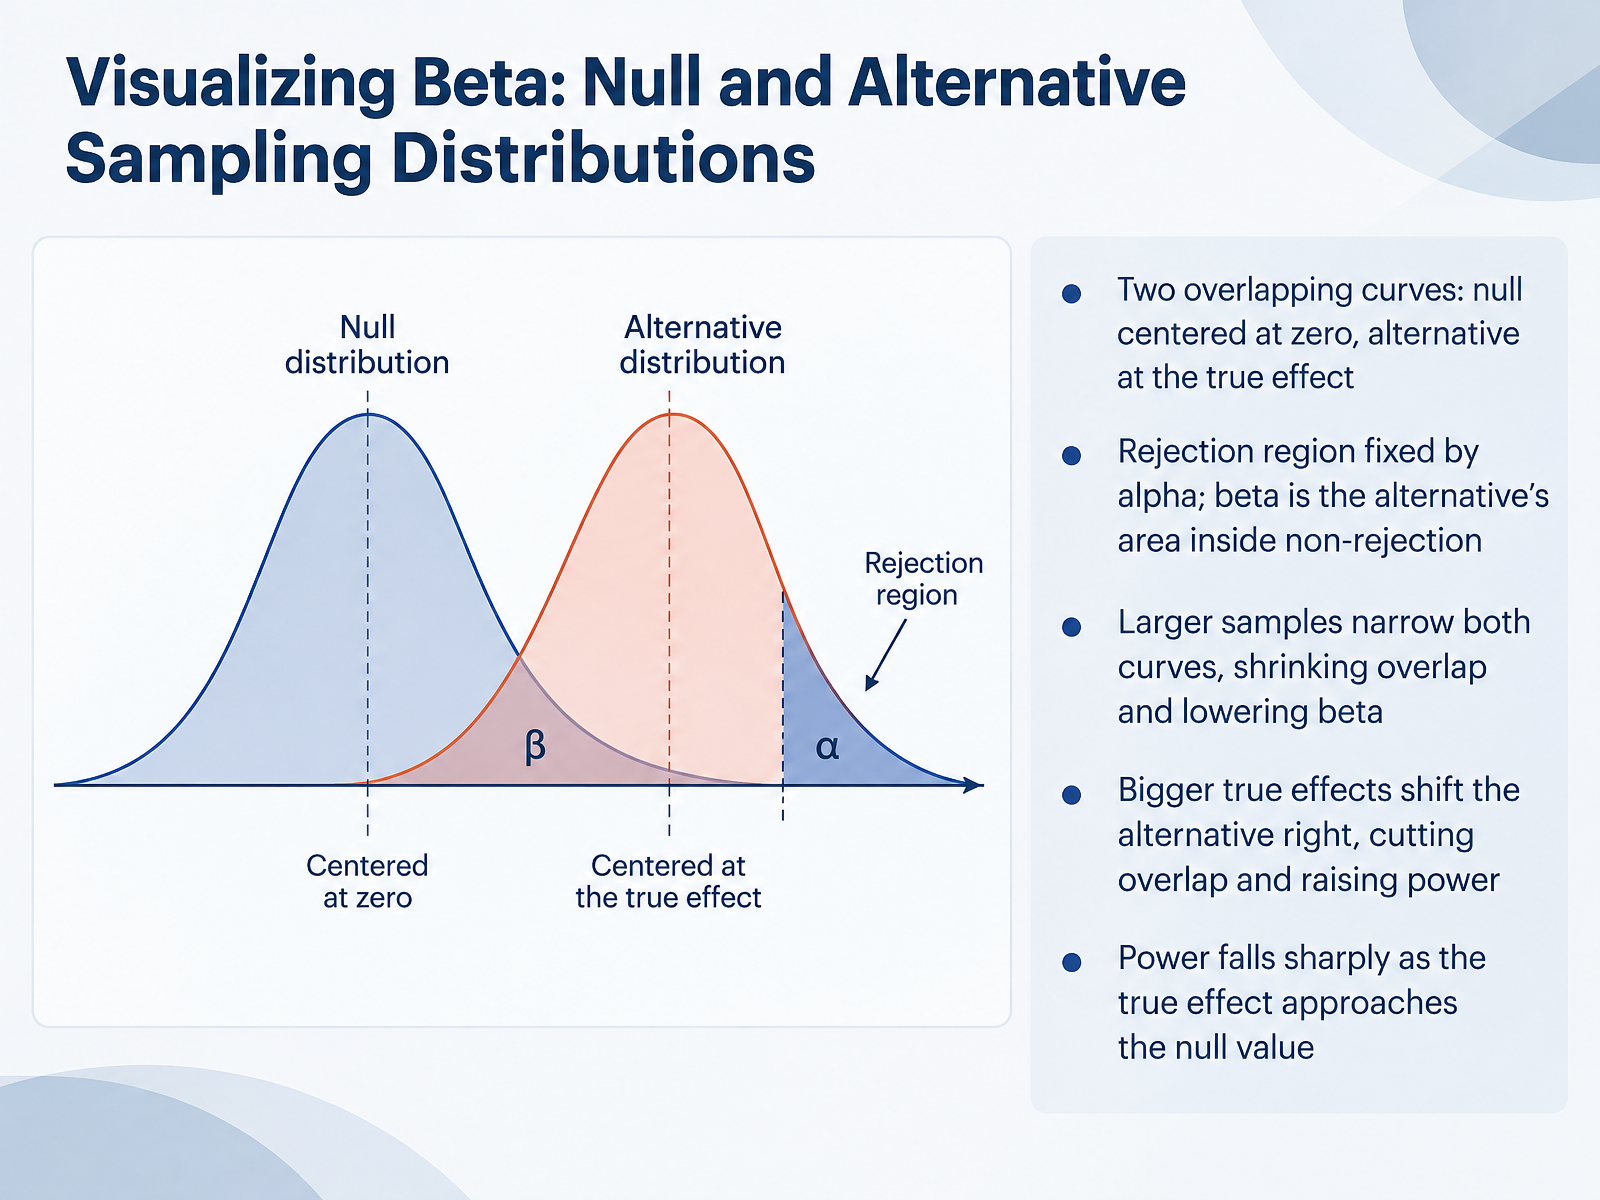
2 min - 03Visualizing Beta: Null and Alternative Sampling DistributionsLet's make beta visible. Picture two curves. The left one is the null distribution, centered at zero, meaning no effect. The right one is the alternative distribution, centered on the true effect, whatever it actually is. Alpha fixes the rejection region on the right tail of the null curve. Now here is the key point. Beta is the area of the alternative curve that falls inside the non-rejection region. In plain terms, it is the chance we miss a real effect. Imagine a small study testing whether a new feature lifts average session time by two minutes. If the curves overlap heavily, much of the alternative sits in the fail-to-reject zone, so beta is large. Larger samples narrow both curves, reduce overlap, and lower beta. Bigger true effects shift the alternative further right, cutting overlap and raising power. And power falls sharply as the true effect approaches the null value, because the curves nearly sit on top of each other. Next, we will look at the factors that move Type 2 error risk.
 2 min
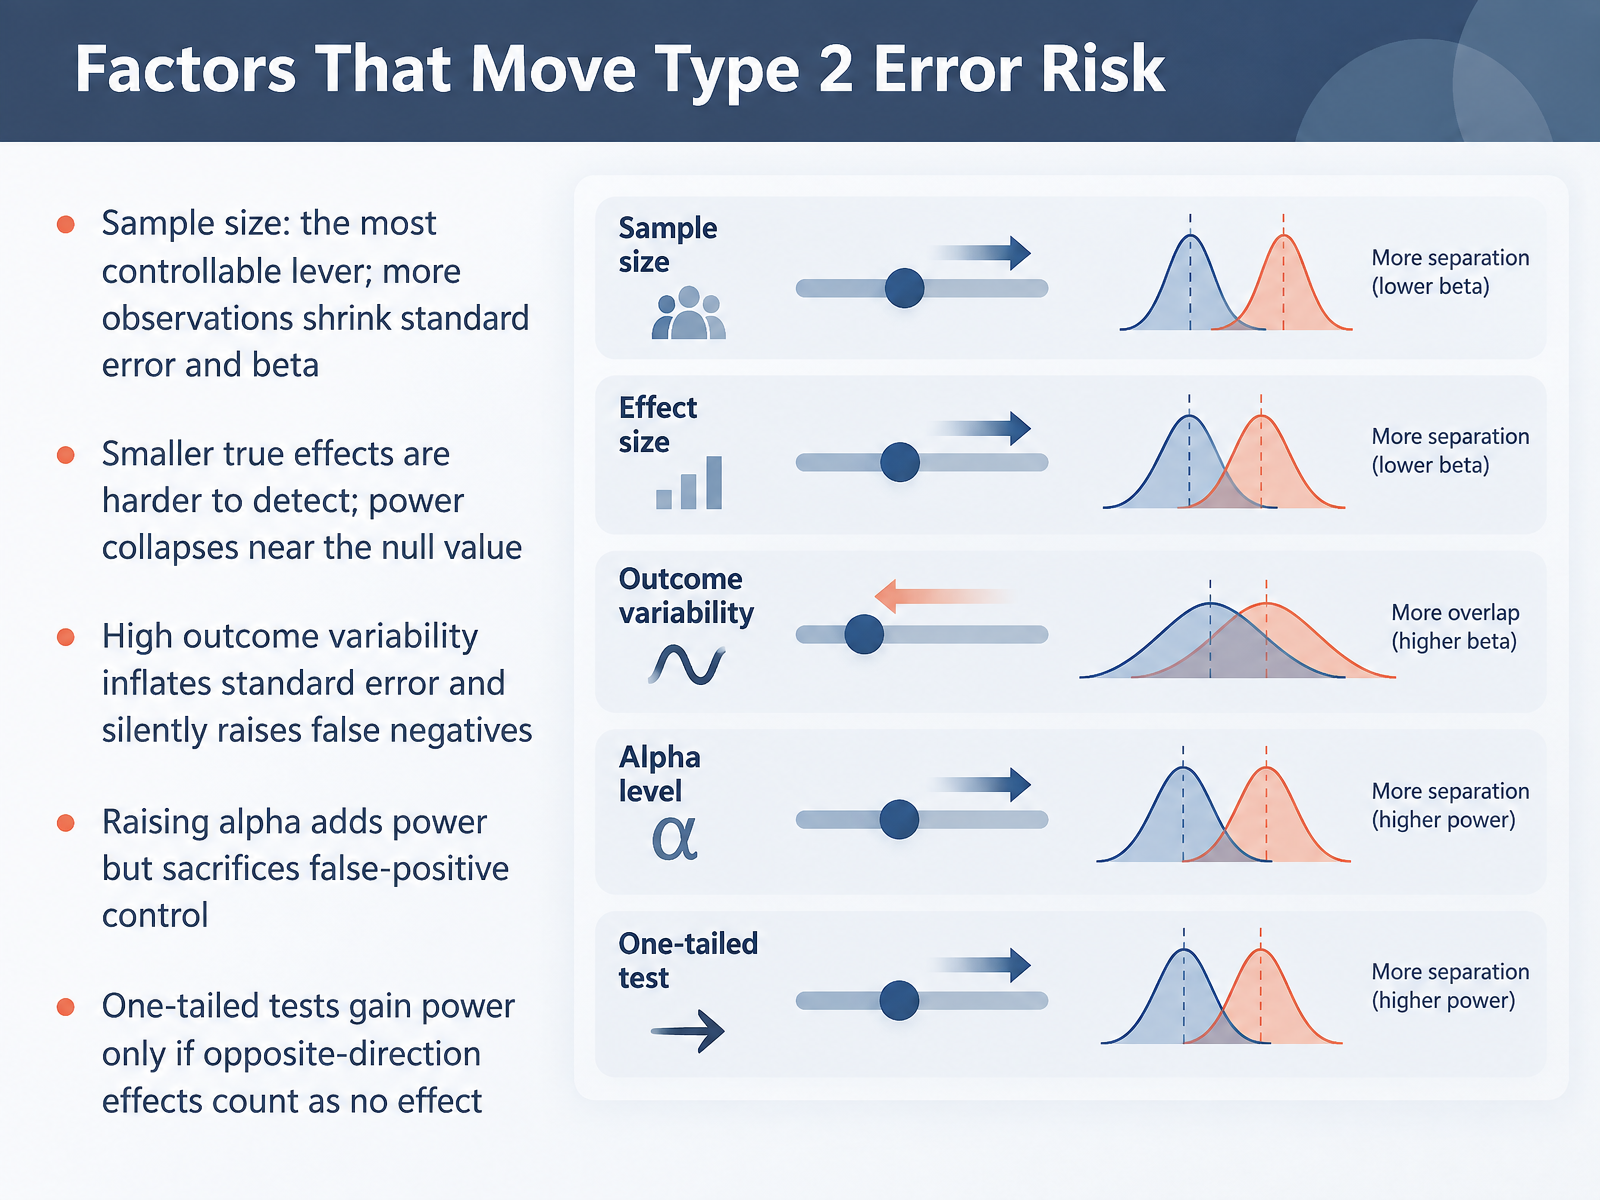
2 min - 04Factors That Move Type 2 Error RiskSeveral factors can push your Type 2 error risk up or down, and knowing them helps you decide where to act. Sample size is the most controllable lever. More observations shrink the standard error, which lowers beta and boosts power. Smaller true effects are simply harder to detect. A tiny improvement, like a two percent lift in conversion, sits close to the null value, so power collapses there. High outcome variability also inflates the standard error, and that silently raises your false negative rate. If your measurements are noisy, your test will struggle even with a decent sample. Raising alpha adds power, but it sacrifices false positive control, so you trade one risk for another. And one-tailed tests gain power only when effects in the opposite direction truly count as no effect. If they do not, you have to keep the two-tailed framing. In practice, ask which of these you can change before you run the test. Next, we will look at a priori power analysis and sample size planning.
 2 min
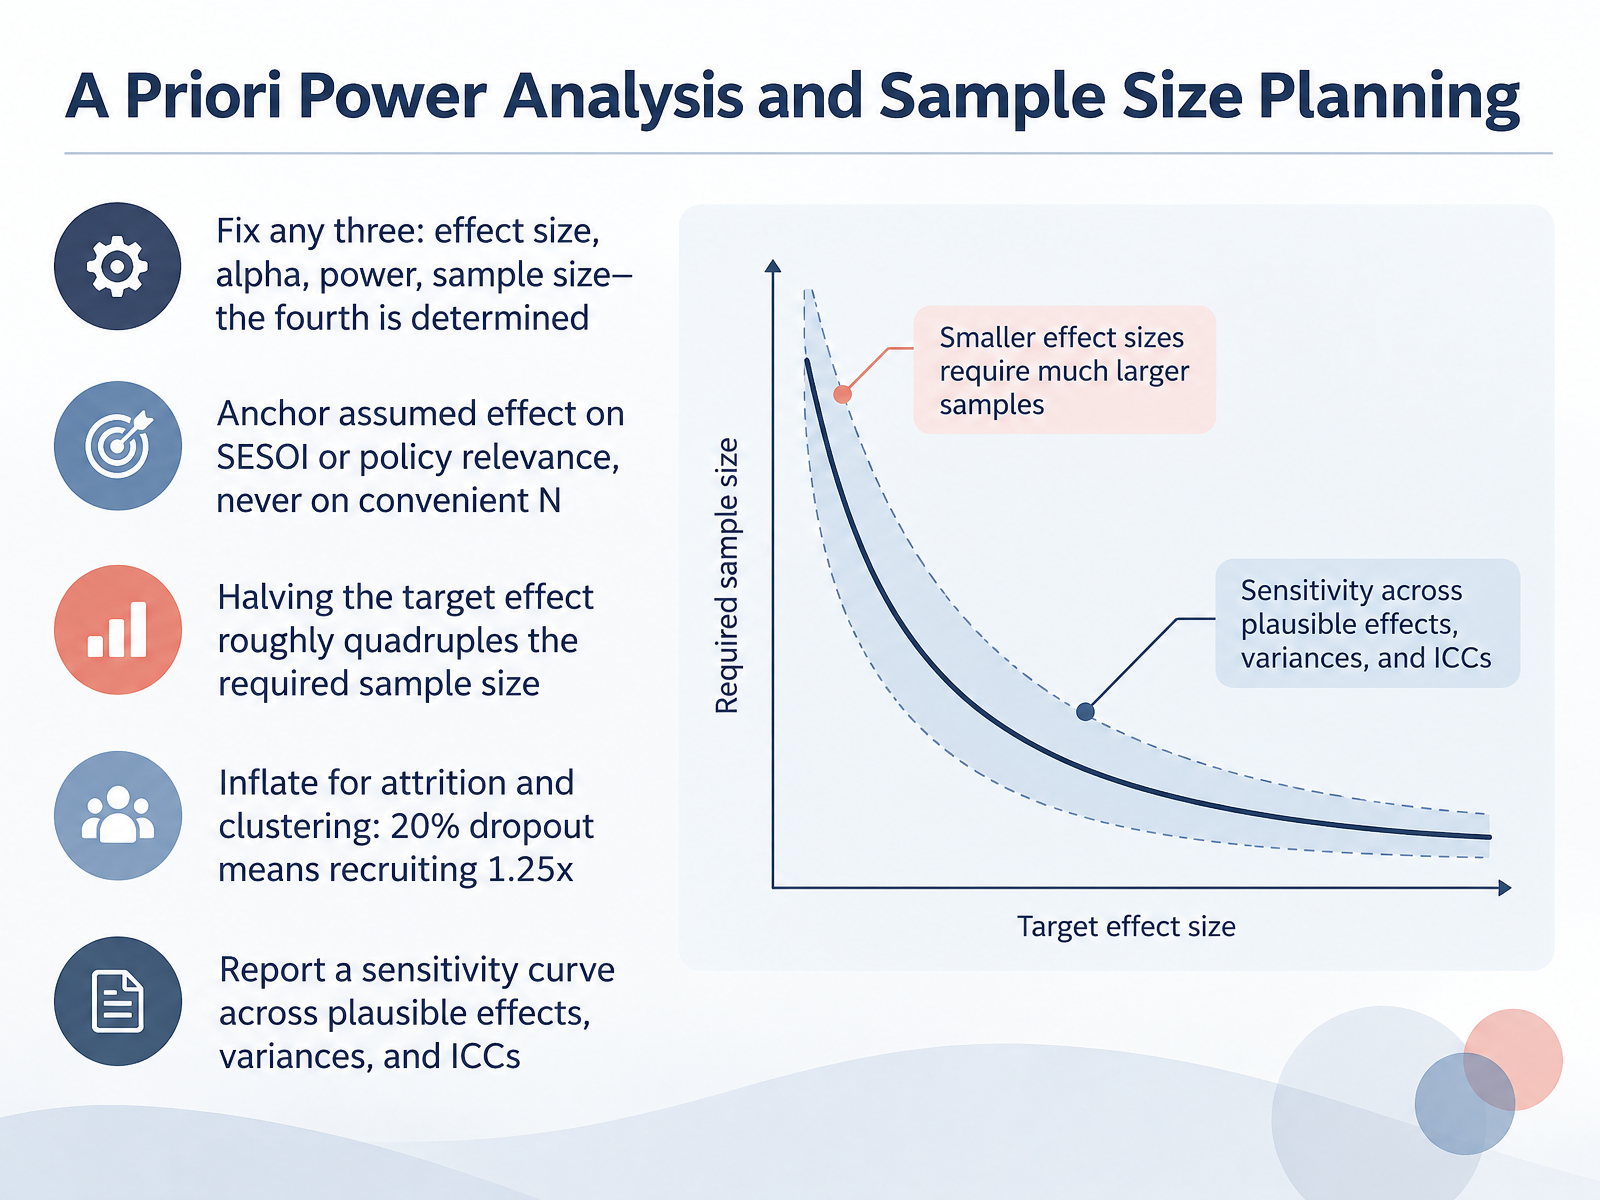
2 min - 05A Priori Power Analysis and Sample Size PlanningNow let's look at planning that cuts the risk of a Type Two error. In an a priori power analysis, you fix any three of four things: effect size, alpha, power, and sample size. The fourth is then determined. For example, if you decide alpha, power, and a meaningful effect size, the math tells you how many observations you need.
The effect size you assume should come from practical relevance, like the smallest effect size of interest, or a policy benchmark. Do not choose it just because your available sample makes it convenient. That quietly changes the question you are asking.
A key relationship to remember: halving the target effect roughly quadruples the required sample size. That is because sample size scales with one divided by effect size squared. So detecting a smaller effect is much more demanding. When you plan, inflate for real world loss. If you expect twenty percent dropout, recruit one and a quarter times your calculated sample. If you have clustering, such as students within classrooms, inflate further for the intraclass correlation.
Finally, report a sensitivity curve across plausible effects, variances, and intraclass correlations. That shows how robust your plan is to assumptions you cannot know for sure. In practice, this turns sample size from a single guess into a defensible range. Next, we will calculate and estimate beta in practice.
 2 min
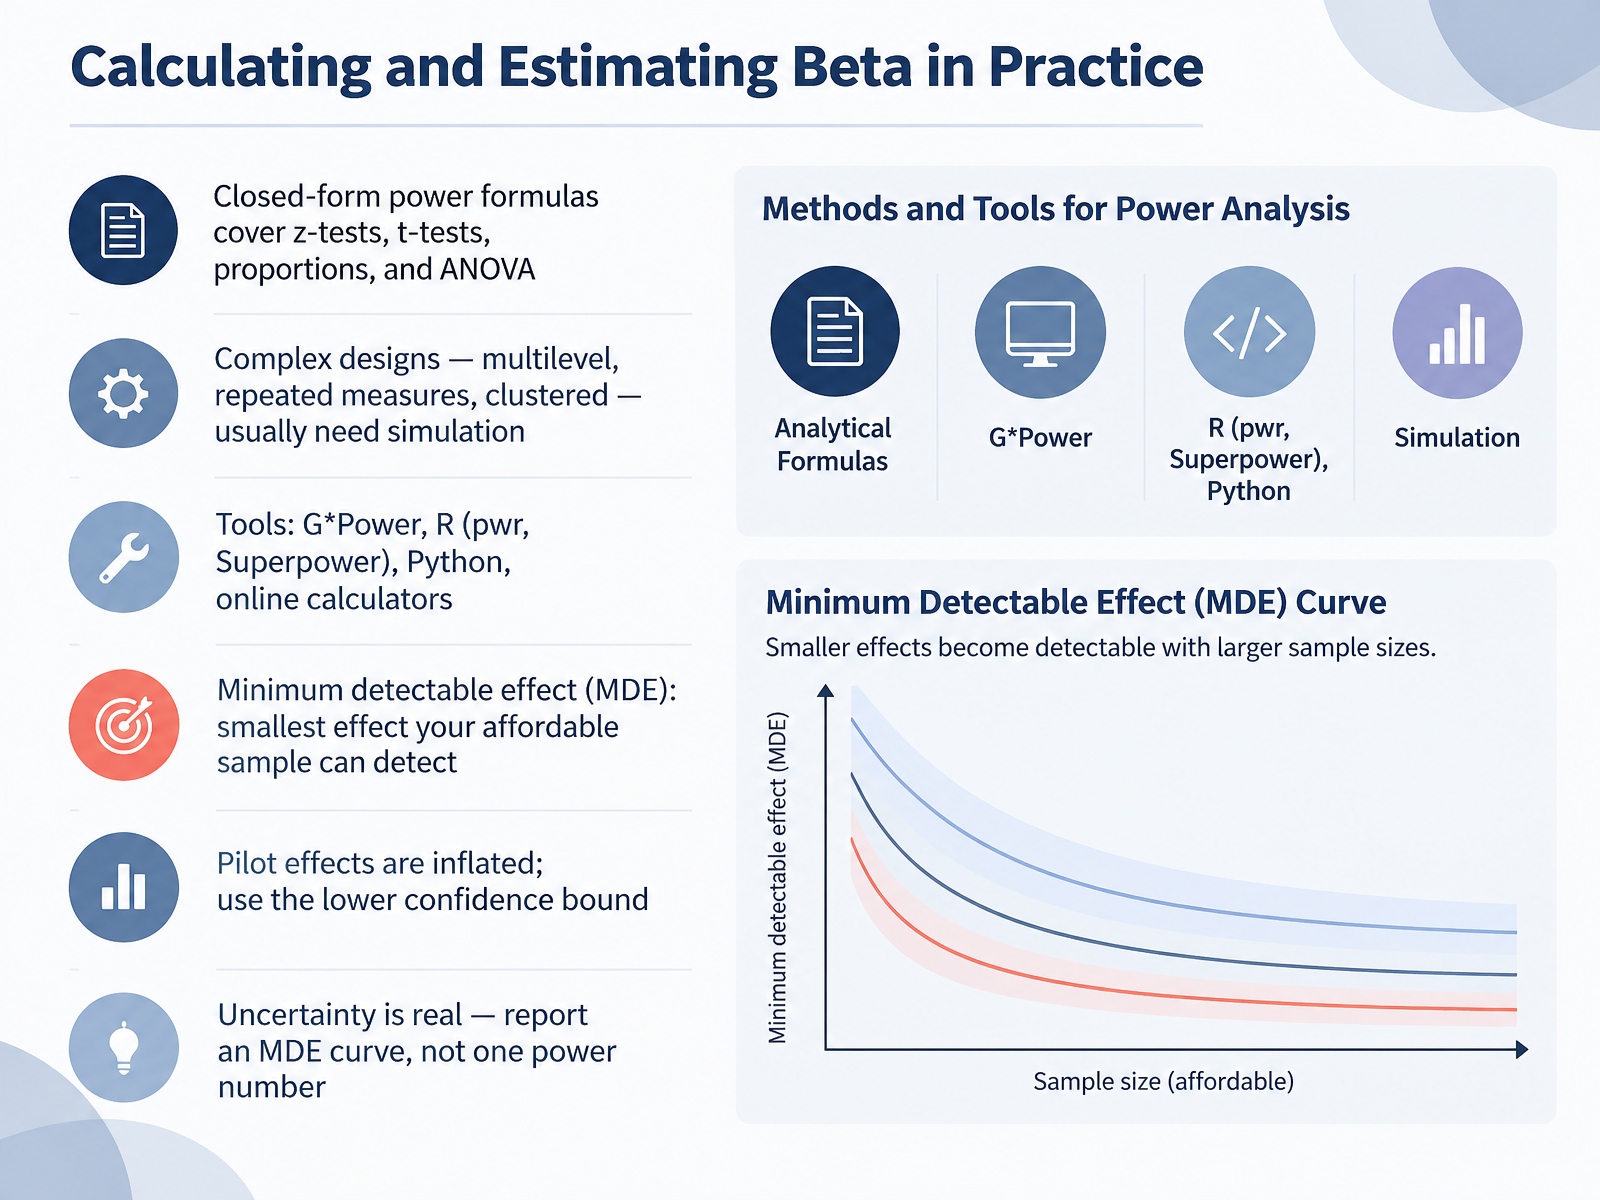
2 min - 06Calculating and Estimating Beta in PracticeNow let's get practical about calculating and estimating beta. For simple cases, closed-form power formulas exist. These cover z-tests, t-tests, proportions, and analysis of variance, or ANOVA. So if your design fits one of those, you can compute beta directly. But complex designs, such as multilevel models, repeated measures, or clustered data, usually need simulation instead. In practice, common tools include G Power, the pwr and Superpower packages in R, Python libraries, and online calculators. A key concept here is the minimum detectable effect, or MDE. That's the smallest effect your affordable sample can detect. It flips the usual question: instead of asking about power for an assumed effect, you ask what effect you could actually find. One caution: pilot study effects tend to be inflated. So use the lower confidence bound, not the pilot point estimate. And because uncertainty is real, report an MDE curve rather than a single power number. That gives a more honest picture of what your study can and cannot detect. Next, we'll look at post hoc power and observed power, and why you should use them with caution.
 2 min
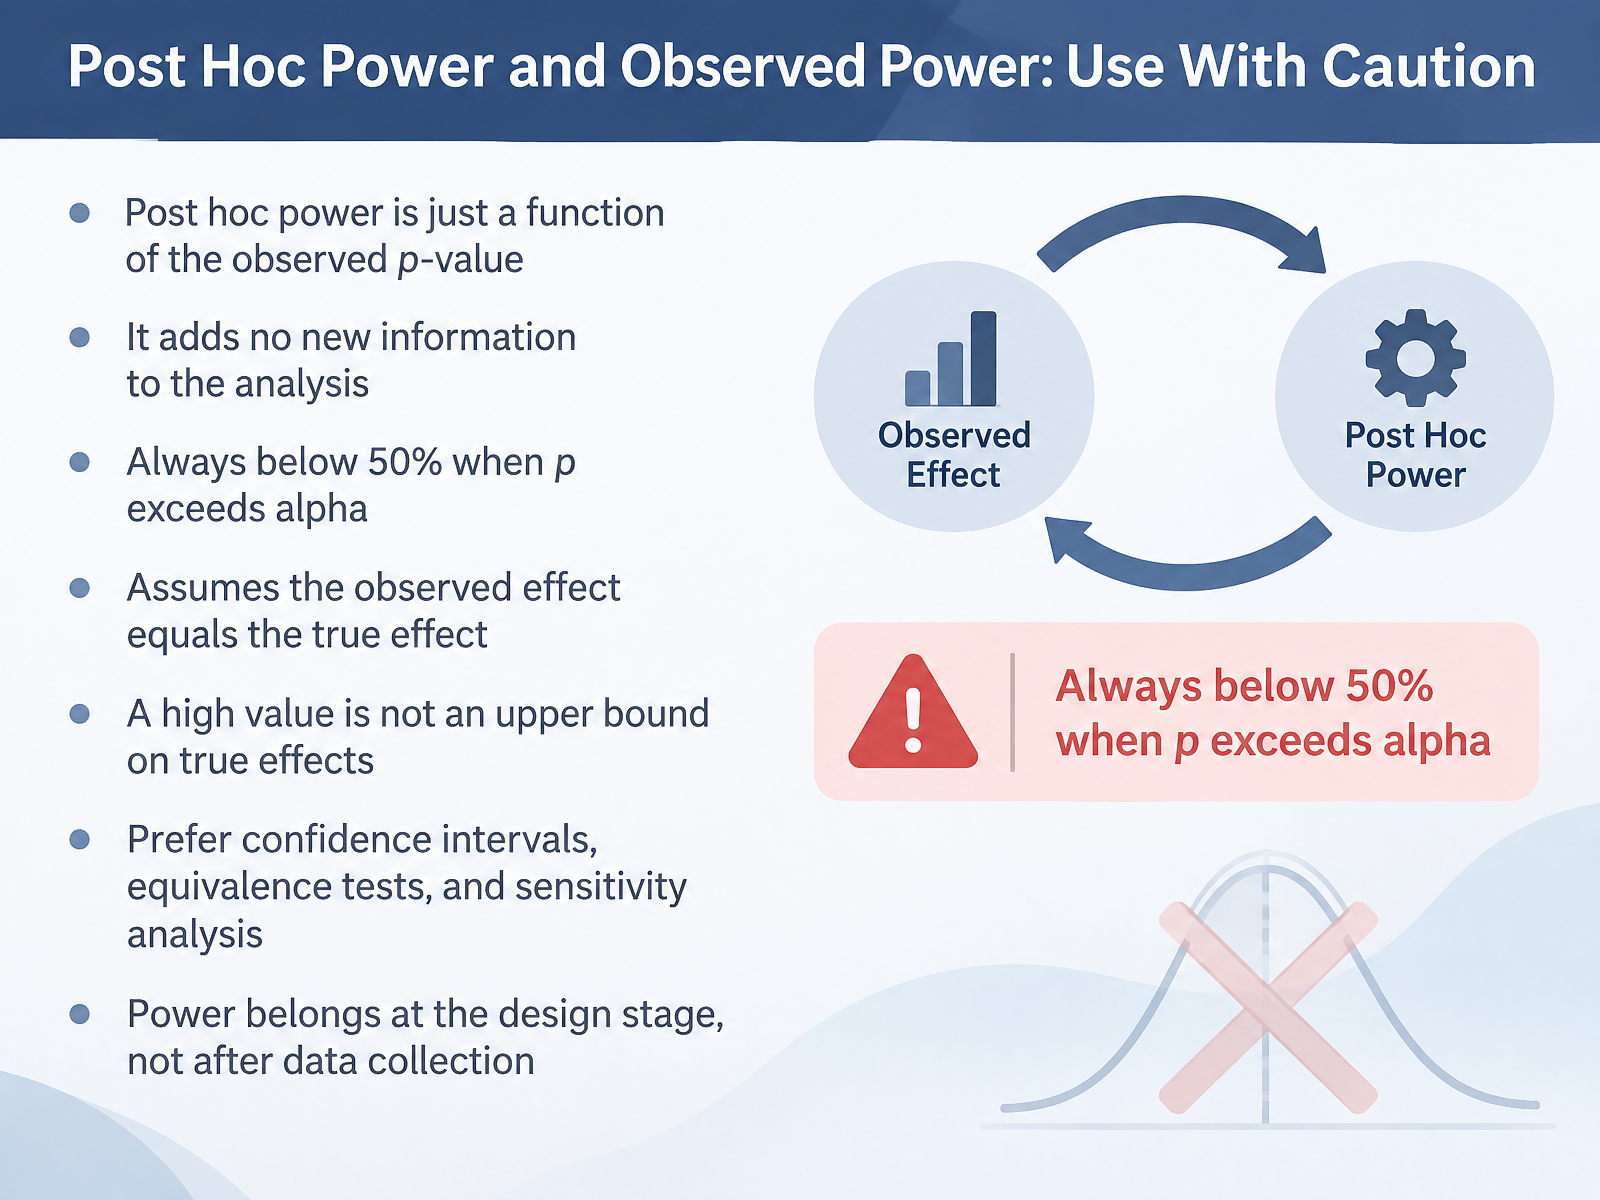
2 min - 07Post Hoc Power and Observed Power: Use With CautionLet's turn to a tempting but unreliable idea. Post hoc power, sometimes called observed power. It is calculated after you have your results, and here is the critical point. It is just a function of the observed p-value. That means it adds no new information to your analysis. It is not independent evidence. In fact, when your p-value is greater than alpha, post hoc power is always below fifty percent. It also assumes the observed effect equals the true effect, which is rarely safe. A high value is not an upper bound on true effects, and it does not rescue a non-significant result. So what should you use instead? Confidence intervals, equivalence tests, and sensitivity analysis. These show the range of plausible effects and how robust your conclusion is. In practice, power belongs at the design stage, before you collect data, not after. Treat post hoc power as a red flag, not a green light. Next, let's look at interpreting a non-significant result without overclaiming.
 1 min
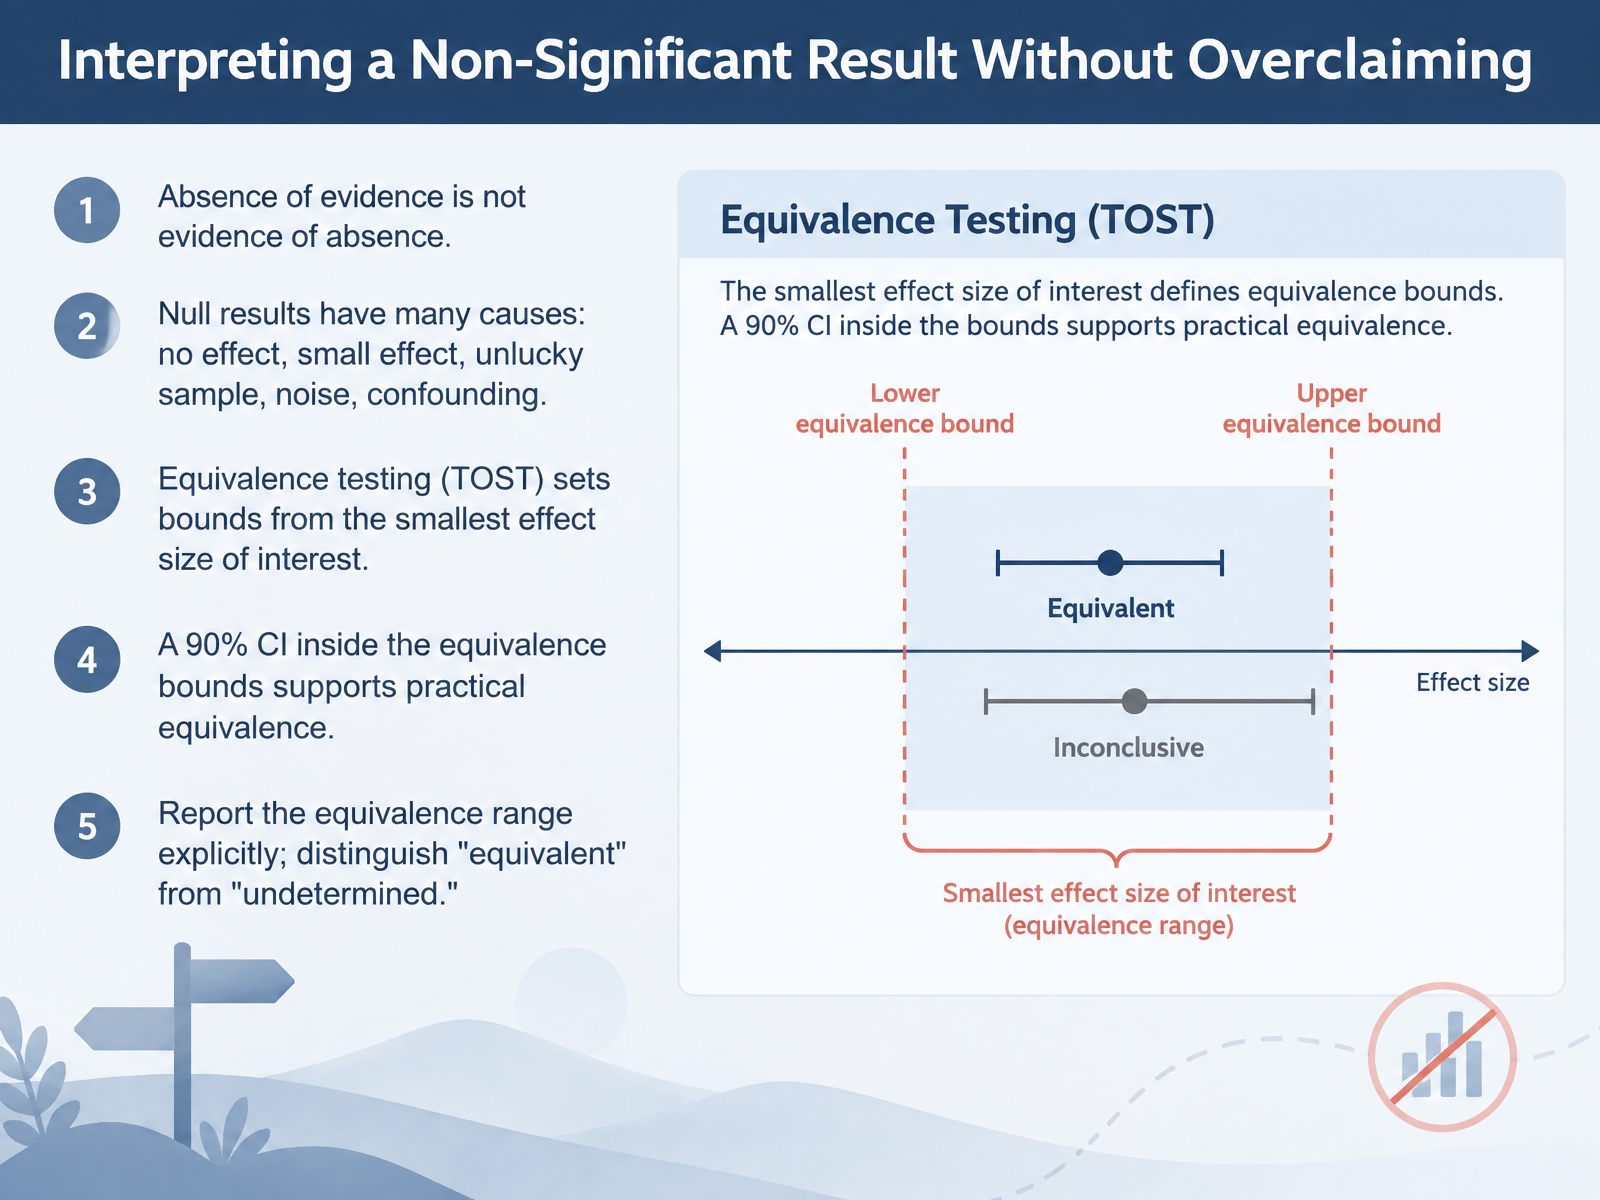
1 min - 08Interpreting a Non-Significant Result Without OverclaimingLet's talk about how to interpret a non-significant result without overclaiming. The key idea is this. Absence of evidence is not evidence of absence. Failing to find a significant effect does not prove the effect is zero. A null result can have many causes. There may truly be no effect, or the effect may be small. Your sample may have been unlucky, or noise and confounding may have hidden a real effect. So what can you do? One useful approach is equivalence testing, often called TOST, which stands for two one-sided tests. Instead of asking whether an effect exists, you set equivalence bounds from the smallest effect size that would actually matter in practice. Then you check whether the data are consistent with practical equivalence. For example, if a ninety percent confidence interval falls entirely inside those bounds, you have evidence for practical equivalence. Reporting matters here. State the equivalence range explicitly, and distinguish equivalent from undetermined. A non-significant result alone often leaves us undetermined. Next, we'll look at study design choices that reduce missed effects.
 2 min
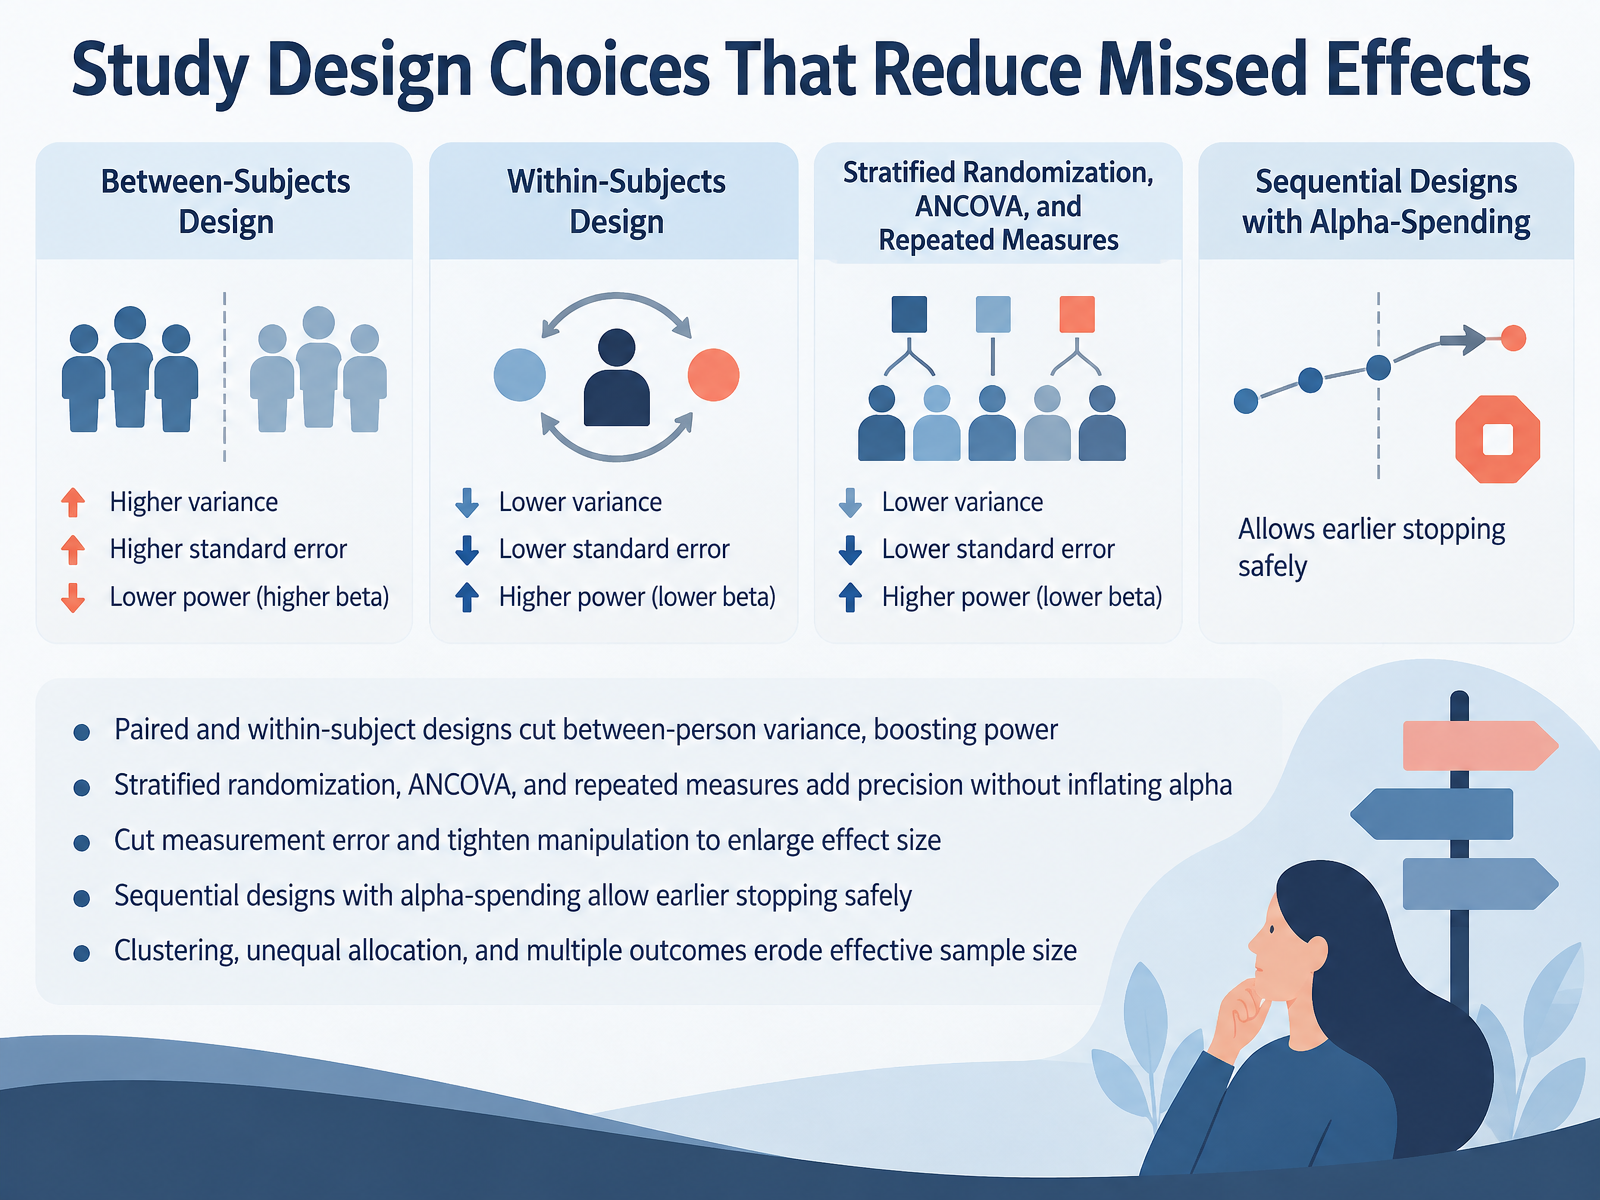
2 min - 09Study Design Choices That Reduce Missed EffectsLet's look at study design choices that reduce missed effects, also called Type 2 errors. In plain terms, these choices help you detect a real effect when it exists, without raising your false positive rate. First, paired and within-subject designs reduce between-person variance. For example, measuring the same person before and after treatment boosts power because you compare each person to themselves. Second, stratified randomization, analysis of covariance, and repeated measures add precision without inflating alpha, your false positive rate. They account for known sources of variability. Third, cutting measurement error and tightening your manipulation can enlarge the effect size, making a real difference easier to detect. Fourth, sequential designs with alpha-spending let you stop earlier safely, but only if you plan the spending rule in advance. Finally, be aware that clustering, unequal allocation, and multiple outcomes erode your effective sample size, reducing power. In practice, choose designs that control noise and preserve your alpha. Next, we'll examine Type 2 Errors in A/B Tests and Product Experiments.
 1 min
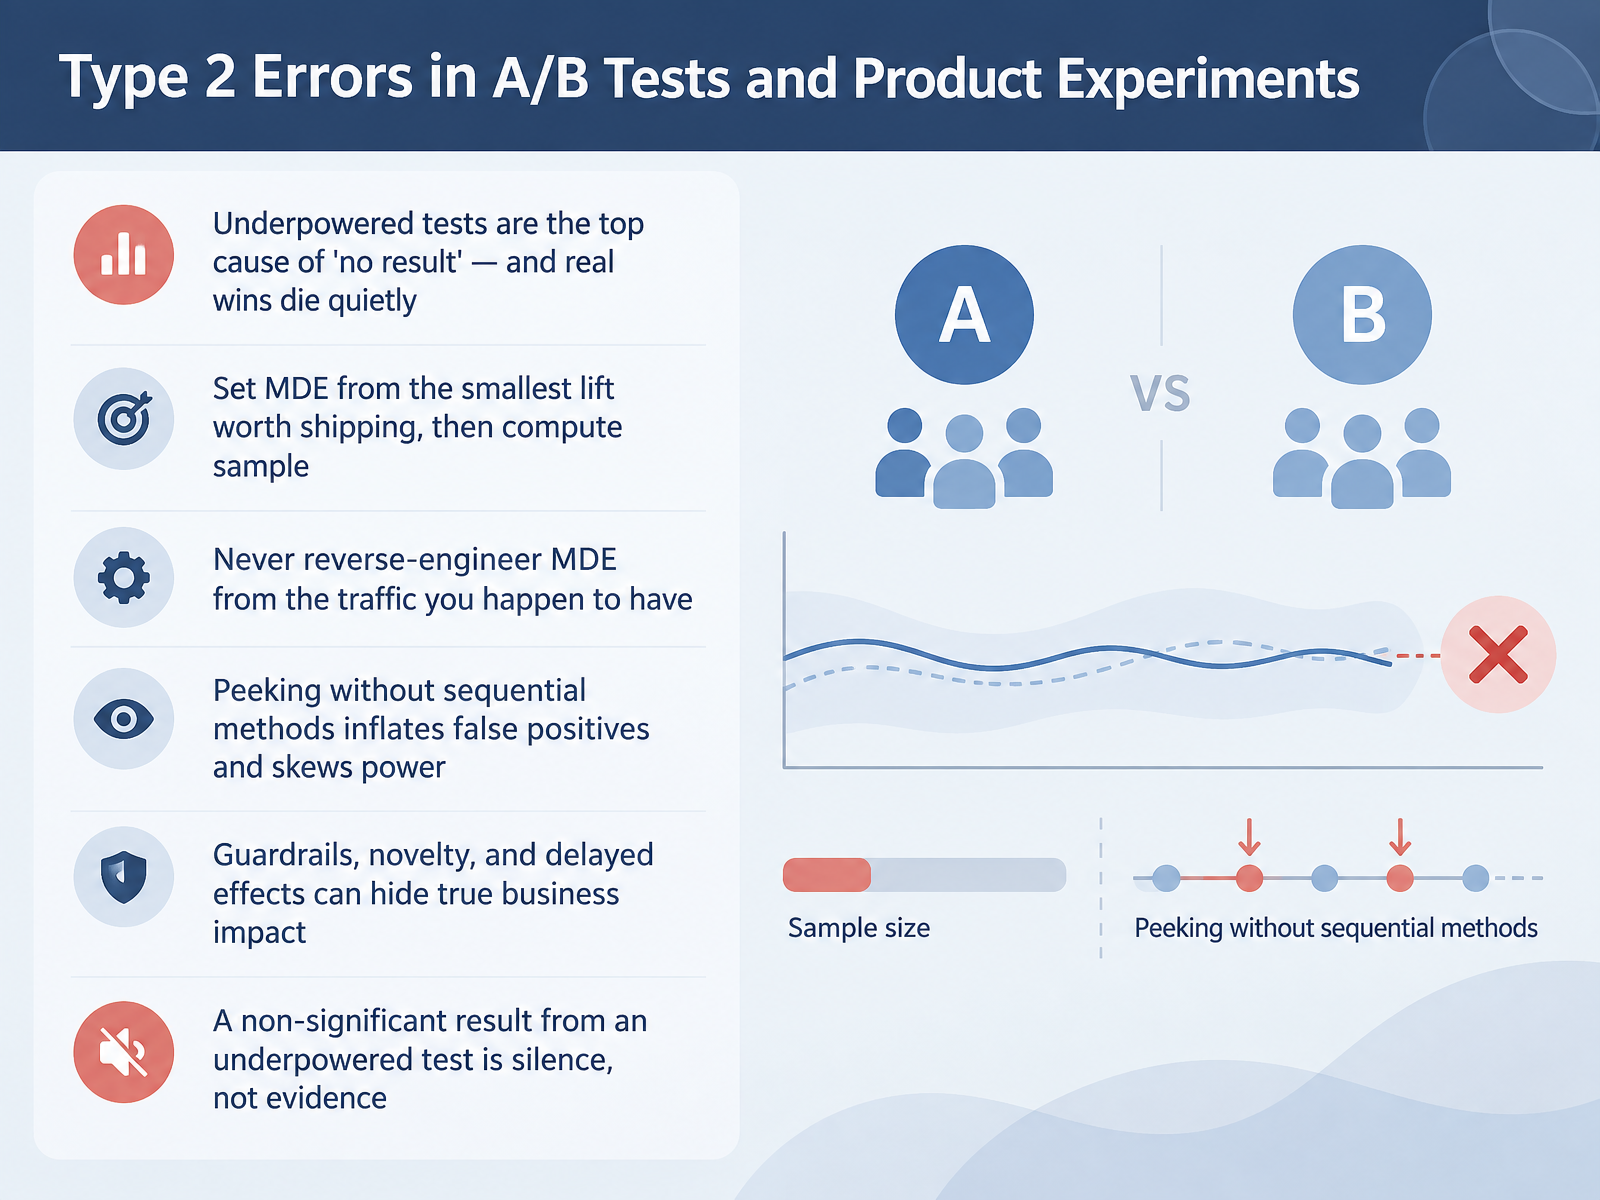
1 min - 10Type 2 Errors in A/B Tests and Product ExperimentsNow let's look at how Type 2 errors show up in A/B tests and product experiments. The single biggest cause of a "no result" is an underpowered test. That means too few users, or too small an effect, to detect a real difference. And when that happens, real wins die quietly. So how do you avoid it? First, set your minimum detectable effect, or M D E, from the smallest lift that would actually be worth shipping. Then compute the sample size you need. Never reverse-engineer the M D E from whatever traffic you happen to have. Second, be careful with peeking. Checking results every day without sequential methods inflates false positives and distorts your power. Third, guardrails, novelty effects, and delayed outcomes can hide true business impact. Here's the key takeaway. A non-significant result from an underpowered test is silence, not evidence. It does not mean the effect is zero. It means you could not hear it. Next, we'll see how missed effects play out in clinical, social, and policy research.
 2 min
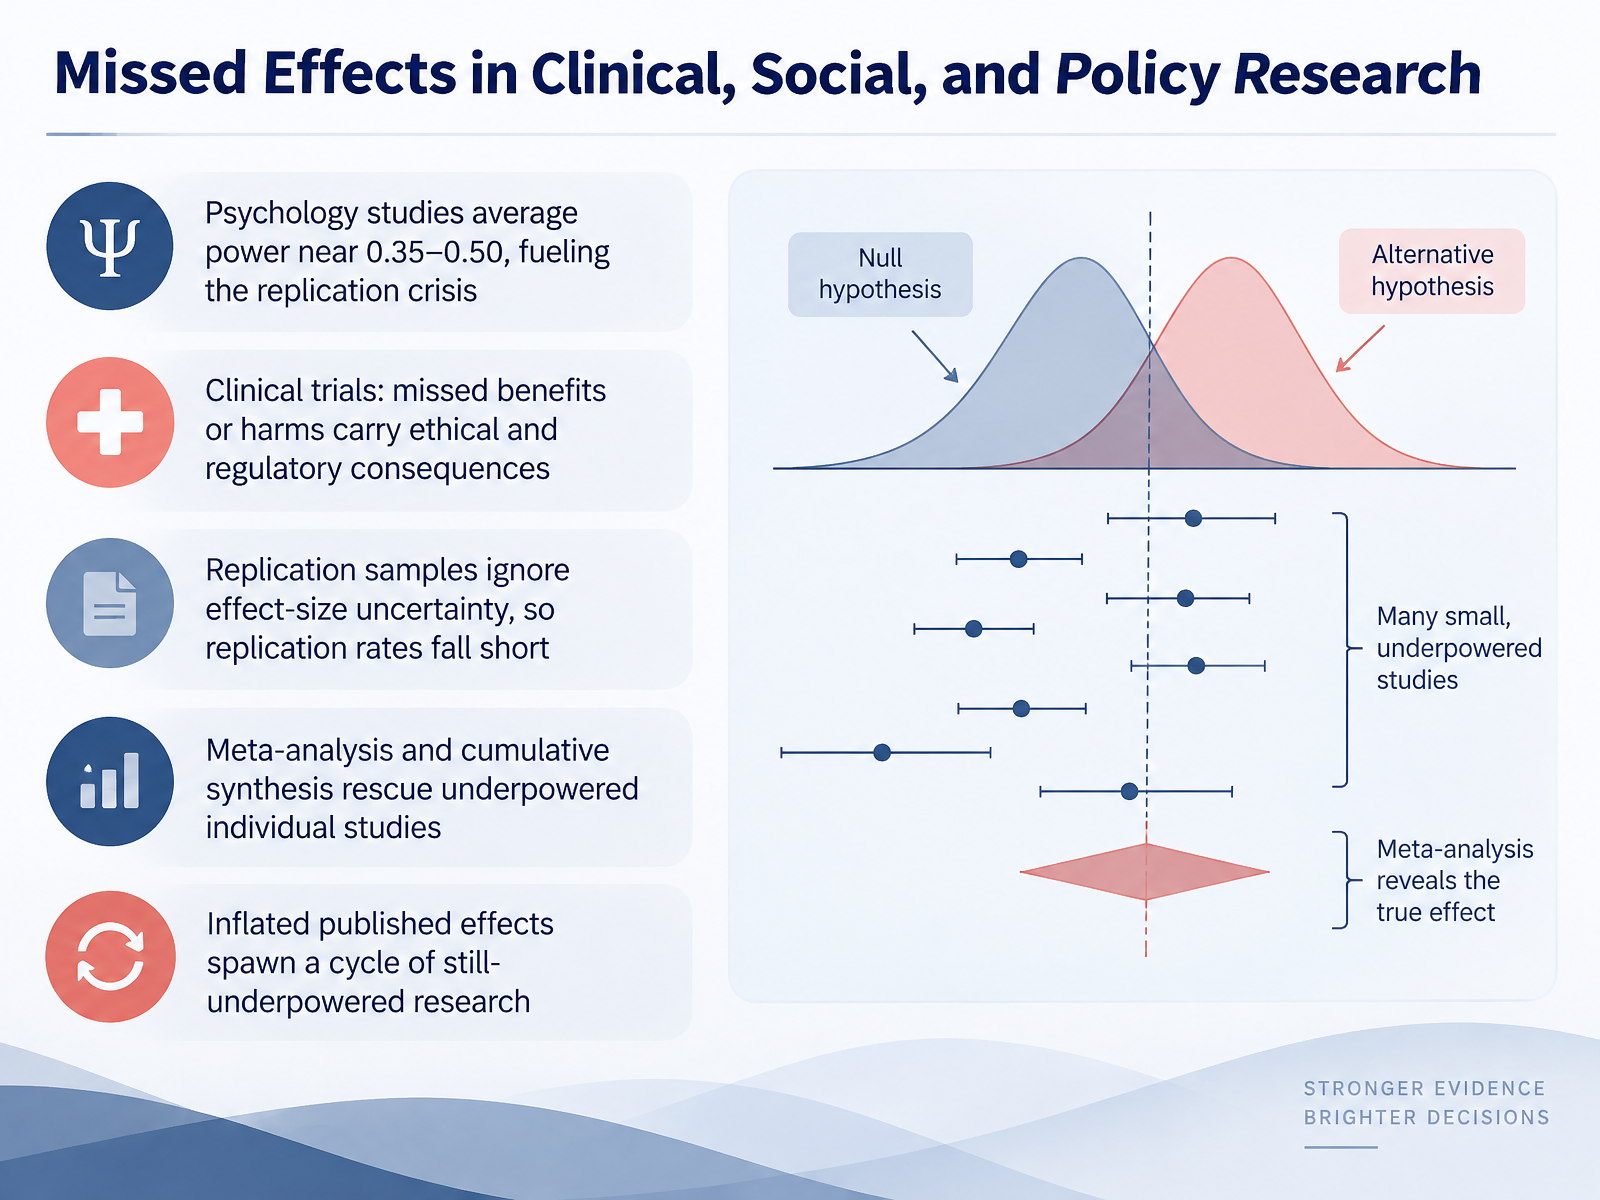
2 min - 11Missed Effects in Clinical, Social, and Policy ResearchLet's look at where missed effects cause real damage. In psychology, average power often falls between zero point three five and zero point five zero. That means a true effect has only about a thirty-five to fifty percent chance of being detected. This directly fuels the replication crisis. In clinical trials, a missed benefit leaves patients without effective treatment, and a missed harm lets a dangerous side effect go unnoticed. Both carry ethical and regulatory consequences. Replication studies add another problem. They often ignore uncertainty in the original effect size estimate, so replication rates fall short of what we would expect. Fortunately, meta-analysis and cumulative synthesis can rescue underpowered individual studies by combining evidence across many small samples. But there is a troubling cycle. Inflated published effects make later studies look adequately powered when they are not, producing still more underpowered research. So when you read a single study, ask about its power, and look for synthesis before drawing firm conclusions. Next, we turn to teaching and communicating type two error and power.
 2 min
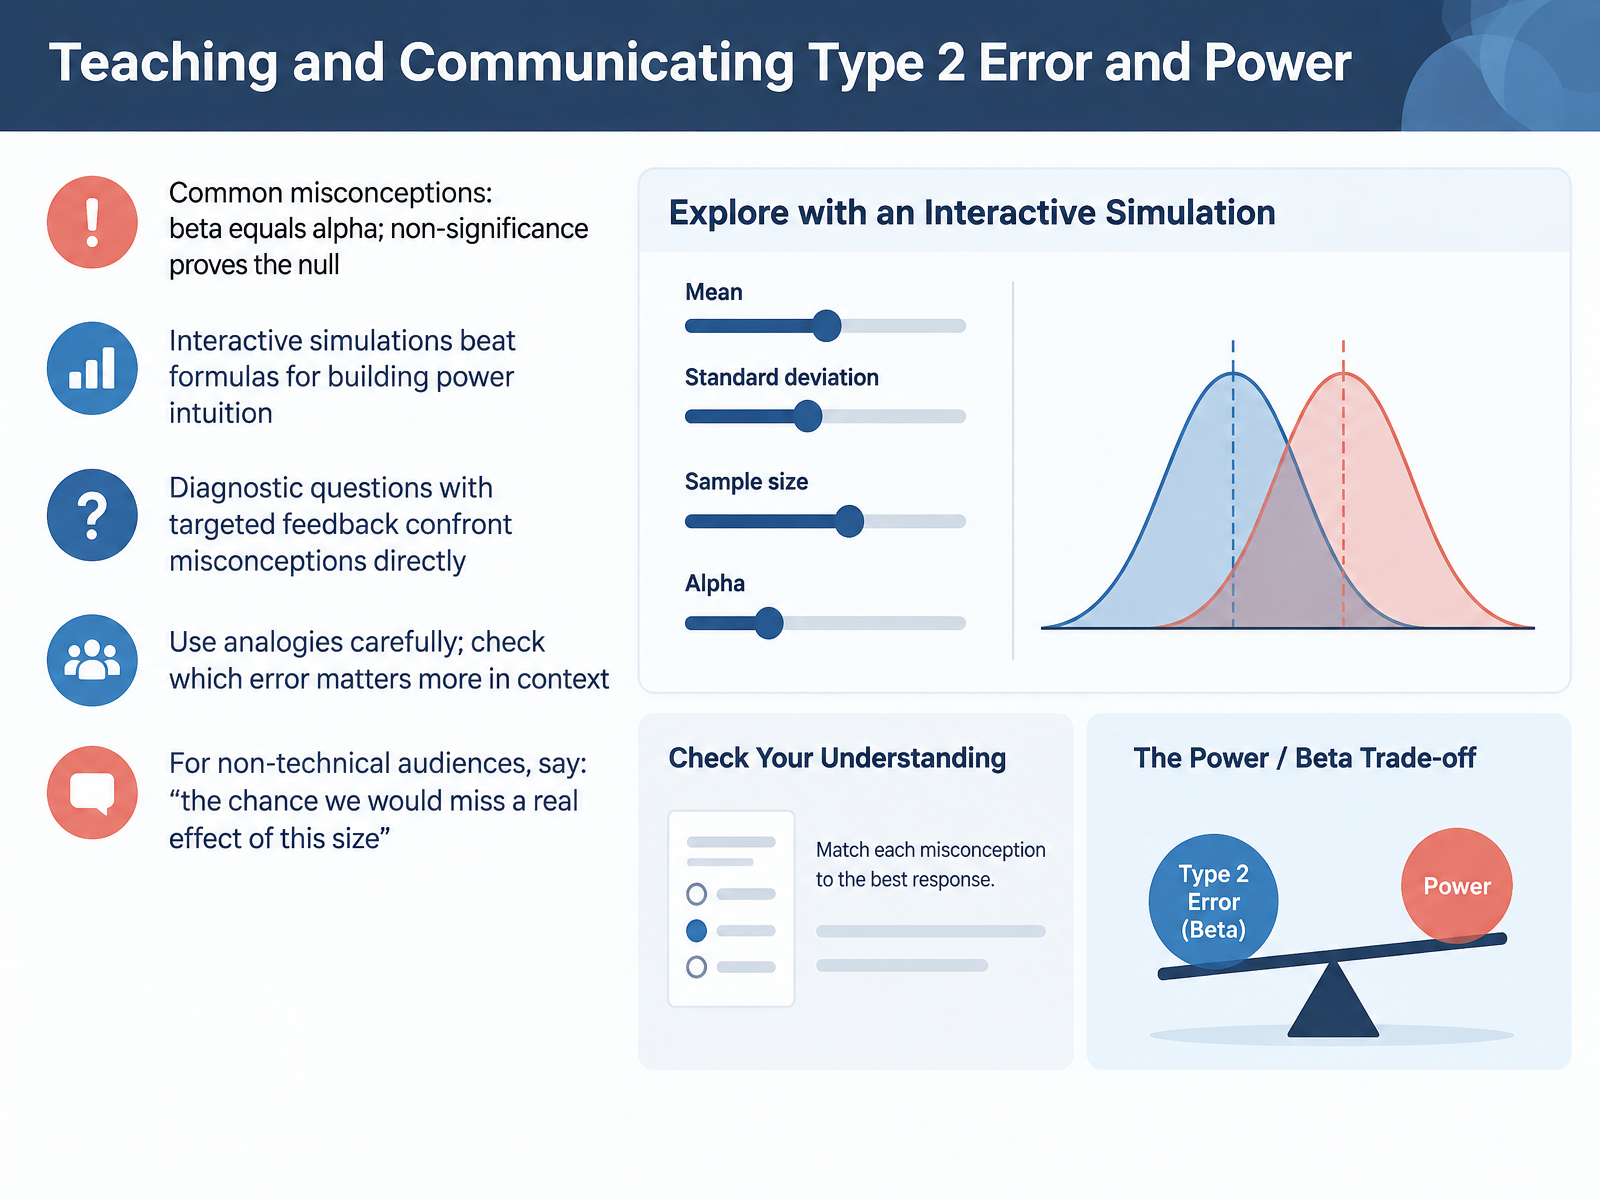
2 min - 12Teaching and Communicating Type 2 Error and PowerLet's talk about teaching and communicating Type 2 error and power, because these ideas are easy to say and surprisingly easy to get wrong. Start with two common misconceptions. One: beta equals alpha. It does not. Alpha is the false positive rate you set in advance, while beta is the false negative rate, and it depends on sample size, variability, and the true effect size. Two: non-significance proves the null. It does not. A non-significant result means the data did not provide strong evidence against the null, not that the null is true. In practice, a missed real effect could mean shipping nothing, stopping a study early, or abandoning a promising treatment. Interactive simulations often build better power intuition than formulas alone. Let learners adjust sample size and effect size, and watch beta shift. Diagnostic questions with targeted feedback then confront misconceptions directly. Be careful with analogies, and check which error matters more in context. For non-technical audiences, say, the chance we would miss a real effect of this size. That keeps the focus on the decision, not the notation. Next, we will look at reporting and decision guidance for false negatives.
 2 min
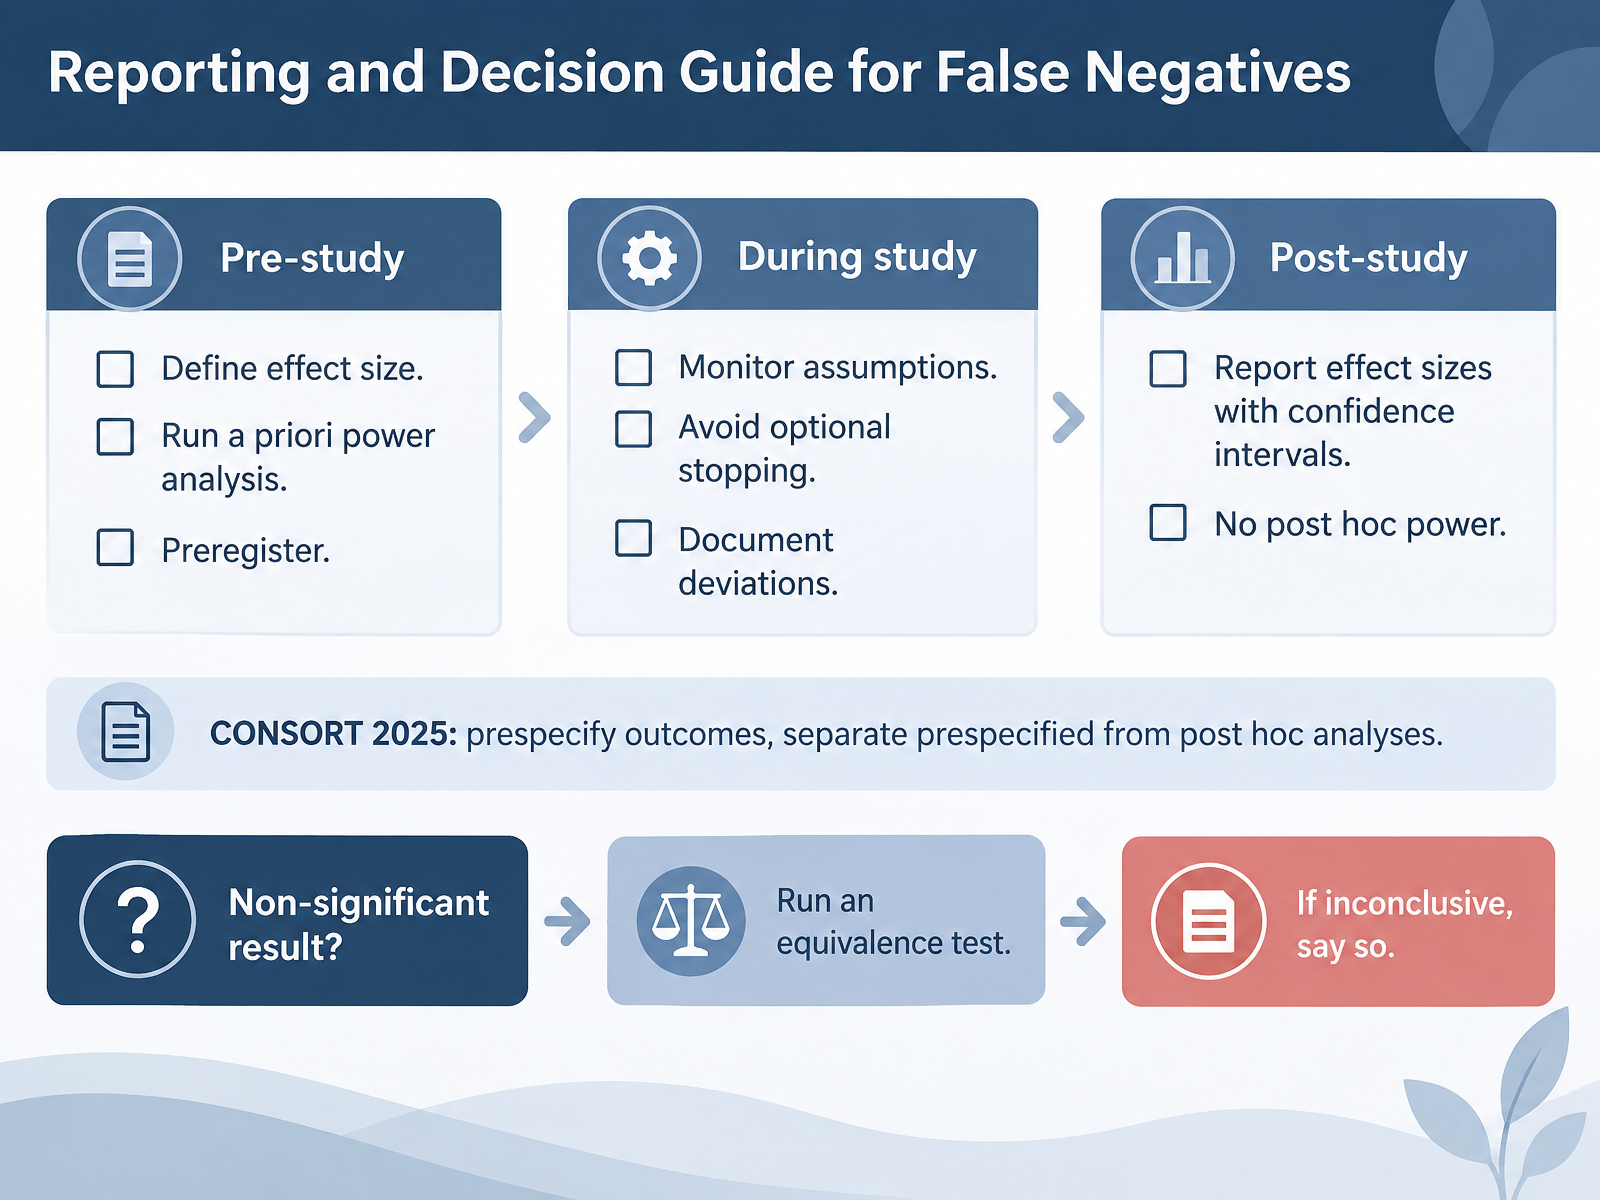
2 min - 13Reporting and Decision Guide for False NegativesNow let's put all of this into a practical reporting and decision guide. Before you run a study, define the effect size you care about, conduct an a priori power analysis, and preregister your plan. That upfront work determines how likely you are to detect a real effect. During the study, monitor your assumptions, avoid optional stopping, and document any deviations from the plan. These habits protect you from false negatives and from misleading results. After the study, report effect sizes with confidence intervals. Do not compute post hoc power; it adds little and can mislead. If you follow reporting standards like CONSORT 2025, prespecify outcomes and clearly separate prespecified from post hoc analyses. And when you get a non-significant result, don't simply accept the null. Run an equivalence test to see whether the effect is truly negligible. If the evidence is inconclusive, say so honestly. In practice, this guide helps you avoid missed effects, report transparently, and make better decisions. Next, we'll pull these ideas together in Key Takeaways and Further Learning.
 2 min
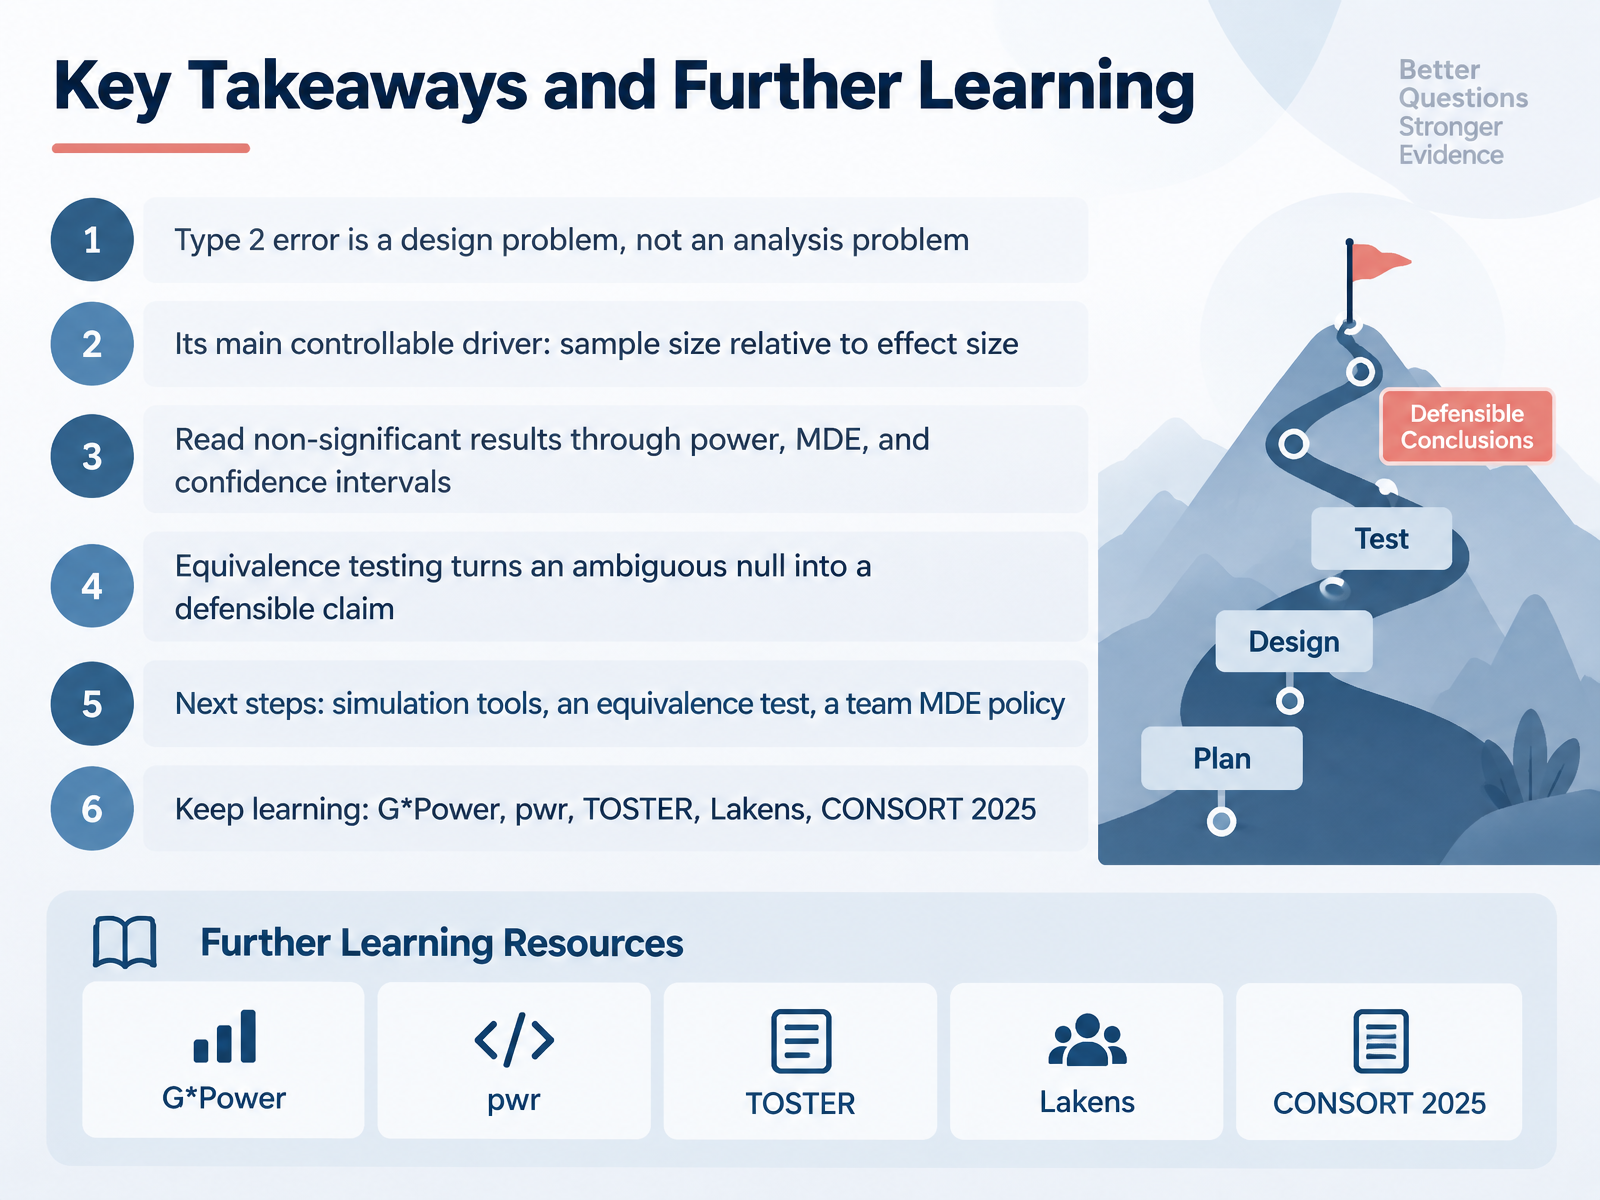
2 min - 14Key Takeaways and Further LearningLet's bring this all together. First, a Type 2 error is a design problem, not an analysis problem. If your study was too small, no clever statistics can recover the effect you missed. The main driver you can control is sample size relative to effect size. Halve the effect, and you roughly need four times the sample. So when you get a non-significant result, read it through power, the minimum detectable effect, and the confidence interval, not just the p value. And if your real question is whether an effect is practically absent, equivalence testing turns an ambiguous null into a defensible claim. For next steps, try a simulation, run one equivalence test, and agree on a team minimum detectable effect policy. To keep learning, look at G Power, the pwr package, TOSTER, work by Lakens, and the CONSORT twenty twenty-five guidance. Thank you for sticking with this. You now have the tools to treat Type 2 errors as a design choice you can manage. Go make your next study better powered.
 2 min
2 min
Take the deck with you
Download this course as a file — free, no sign-up needed.
- PDF handoutEvery slide page, ready to print or share.15 pages · 3.1 MBDownload
- Narrated PowerPointThe deck that presents itself — every slide carries the digital human's narration video.15 pages · 14.8 MBDownload
- PowerPoint slidesThe full deck as a .pptx — open it in PowerPoint, Keynote, or Google Slides.15 pages · 3.0 MBDownload
Free to use in your own training — please keep the PersonWise credit page at the end.
Have your own deck? Turn it into a course