Communicating Data Science to Stakeholders
Begin
13 pages · ~26 min
Communicating Data Science to Stakeholders
Equip data professionals to present data science insights clearly and persuasively to non-technical stakeholders.
What you’ll learn
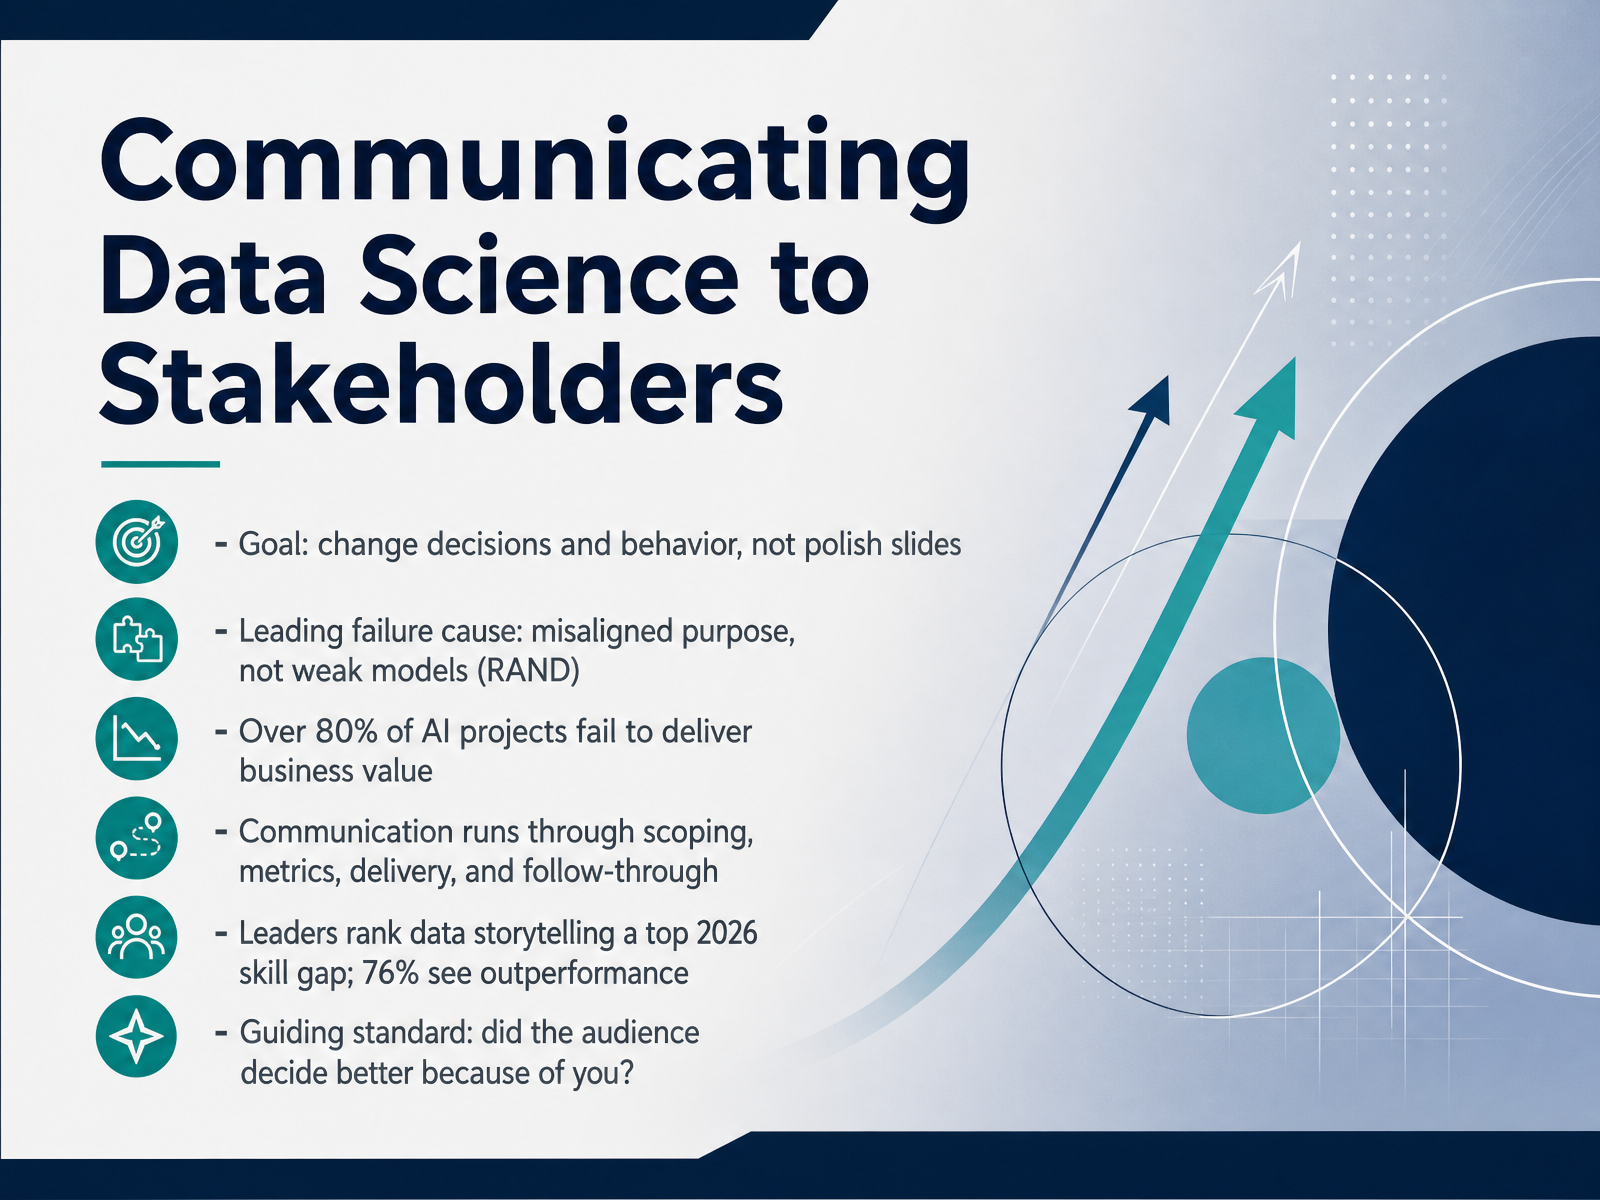
- 01Communicating Data Science to StakeholdersWelcome. Over the next few minutes, we are going to work on one of the highest-leverage skills in your career: communicating data science to the people who decide. Here is the frame. Our goal is not polished slides. Our goal is to change decisions and behavior. That distinction matters. RAND's research on why AI projects fail found the leading root cause is misaligned purpose, not weak models. Leaders and teams never agree on the problem, so success is never defined. By some estimates, more than eighty percent of AI projects fail to deliver business value. Notice where the failure lives: upstream of the model. Communication runs through scoping, metrics, delivery, and follow-through. It is not a final presentation. And leaders feel the gap. They rank data storytelling among the top skill gaps for twenty twenty-six, and seventy-six percent report that data-literate employees outperform those who are not. So here is the standard we will hold ourselves to throughout this course: did the audience decide better because of you? Keep that question in mind. Next, why communication is the bottleneck, not the bonus.rand.orgdoi.orgpertamapartners.com+22 min
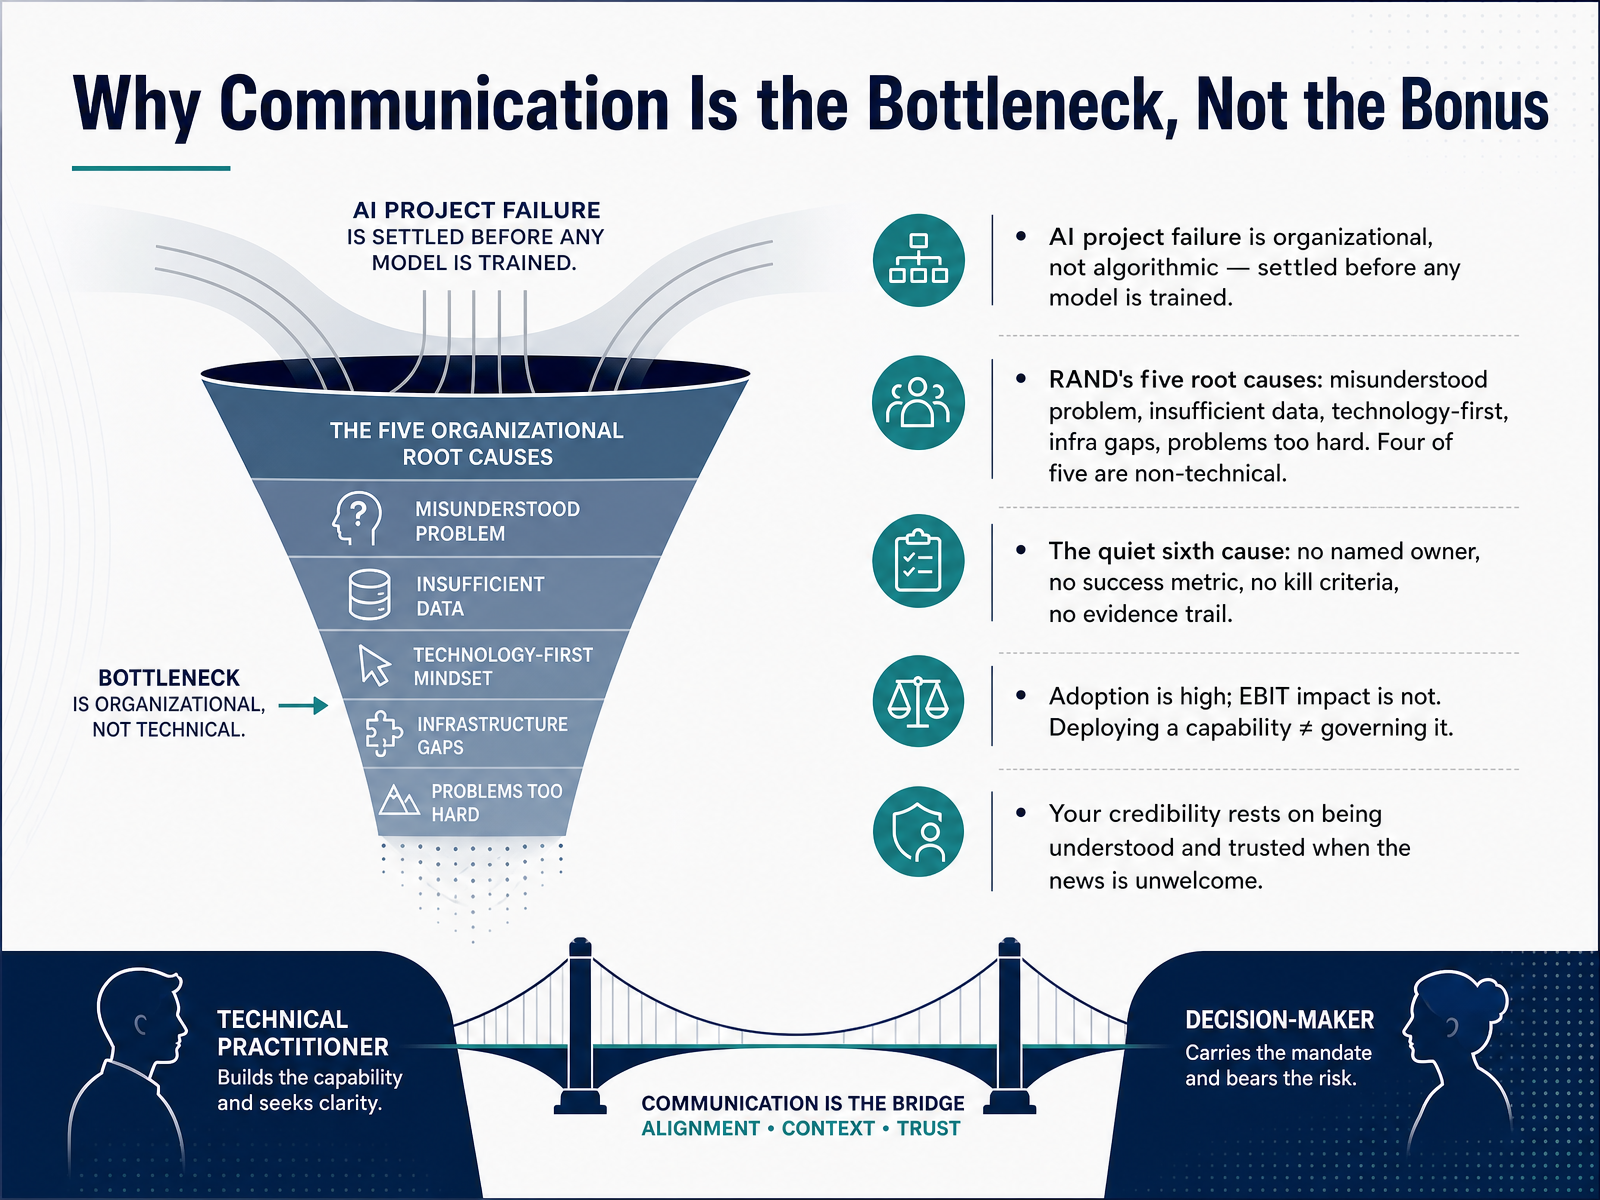
- 02Why Communication Is the Bottleneck, Not the BonusSo let's reframe where the real failure point sits. RAND's analysis found that more than eight in ten AI projects fail to deliver business value, and that failure is organizational, not algorithmic. It's settled before any model gets trained. Their five root causes are a misunderstood problem, insufficient data, technology-first thinking, infrastructure gaps, and problems too hard for the current state of the art. Four of those five are non-technical. There's also a quiet sixth cause: no named owner, no success metric, no kill criteria, and no evidence trail. Now look at the adoption picture. Adoption is high, EBIT impact is not. Deploying a capability is not the same as governing it. So your credibility doesn't just rest on the confidence interval or the holdout score. It rests on being understood and trusted when the news is unwelcome. Next, let's look at the stakeholder archetypes and what each one optimizes for.
 rand.orgdoi.orgpertamapartners.com+22 min
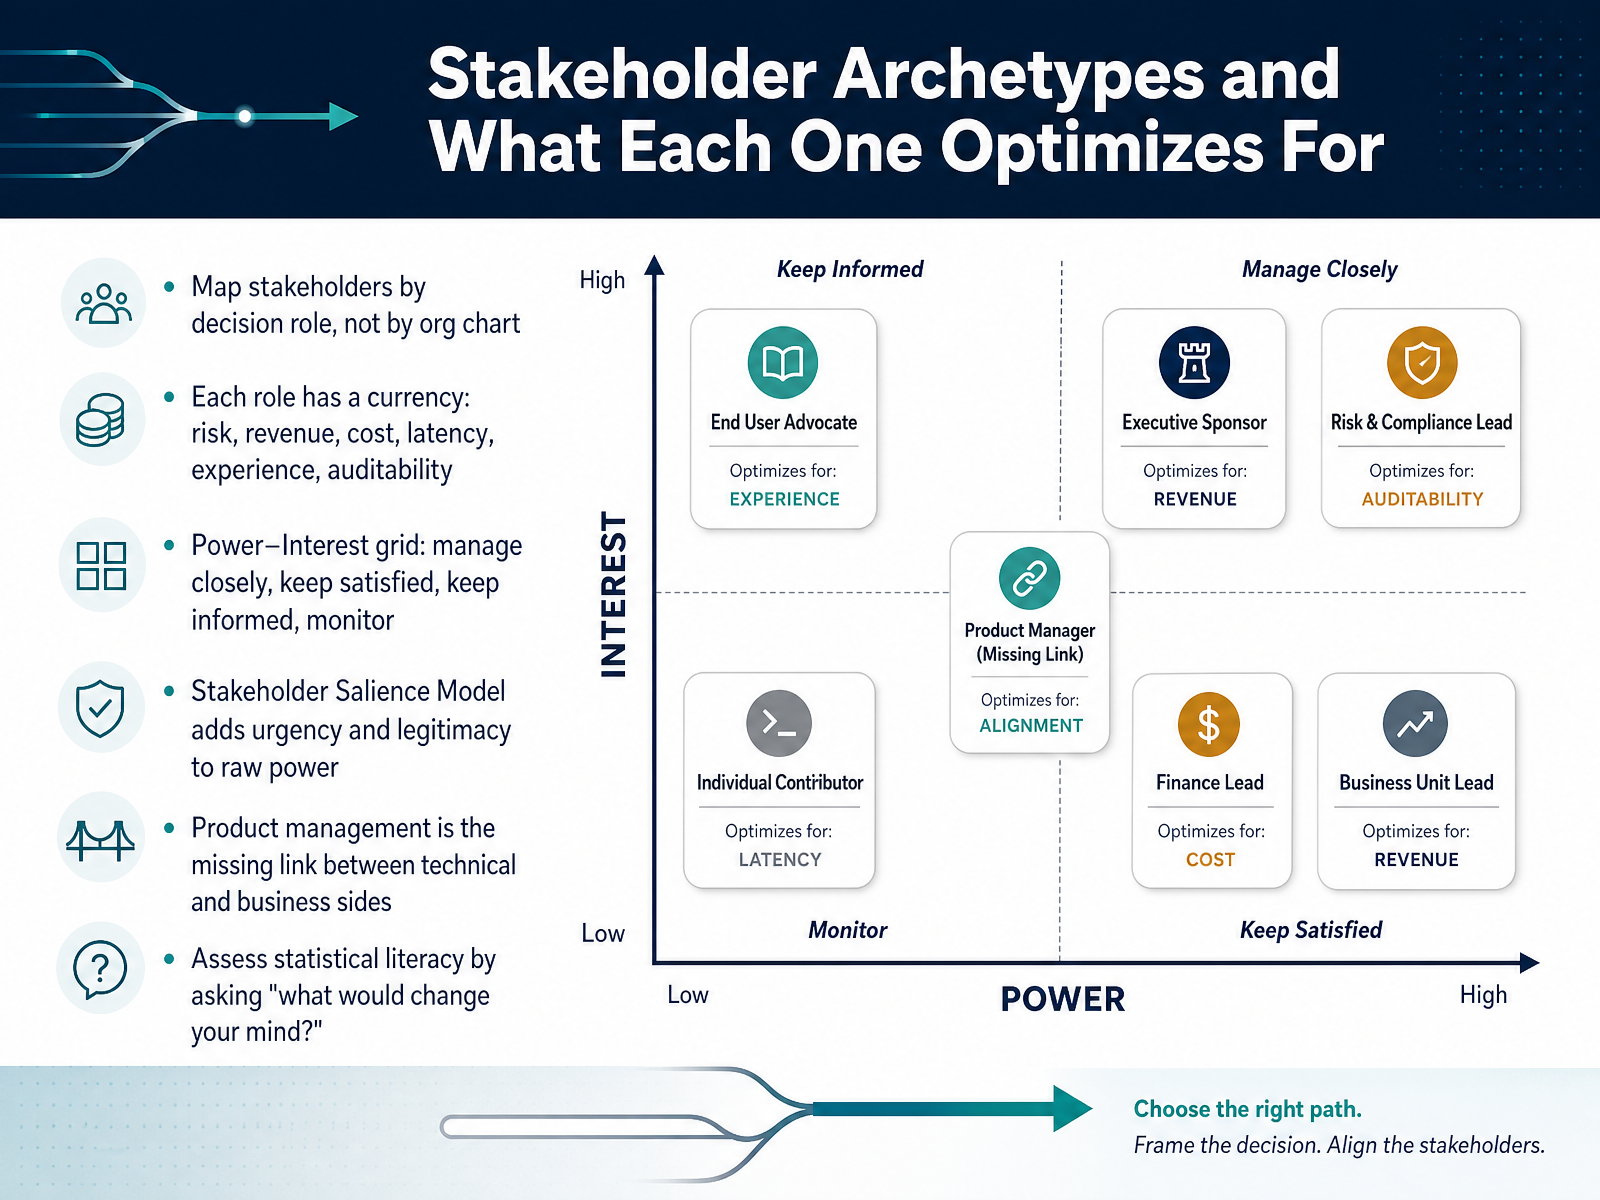
 - 03Stakeholder Archetypes and What Each One Optimizes ForLet's talk about who you're actually presenting to. Map stakeholders by decision role, not by org chart. A chief financial officer and a product lead may sit at the same level on the chart, but one is optimizing for cost and auditability, and the other for latency and user experience. That difference decides what your model needs to prove.
The Power and Interest grid still works for triage. High power, high interest means manage closely. High power, low interest means keep satisfied. Then the Stakeholder Salience Model adds urgency and legitimacy to raw power, so someone with a deadline and a credible claim moves up your priority list.
One structural note: product management is often the missing link between the technical and business sides. Use them.
Finally, gauge statistical literacy with one question. What would change your mind? If nothing would, the analysis is performative, and you should scope it accordingly.
Next, translating vague requests into decisions.
 varsitytutors.comiiba.orgbuildwithaitoday.com+22 min
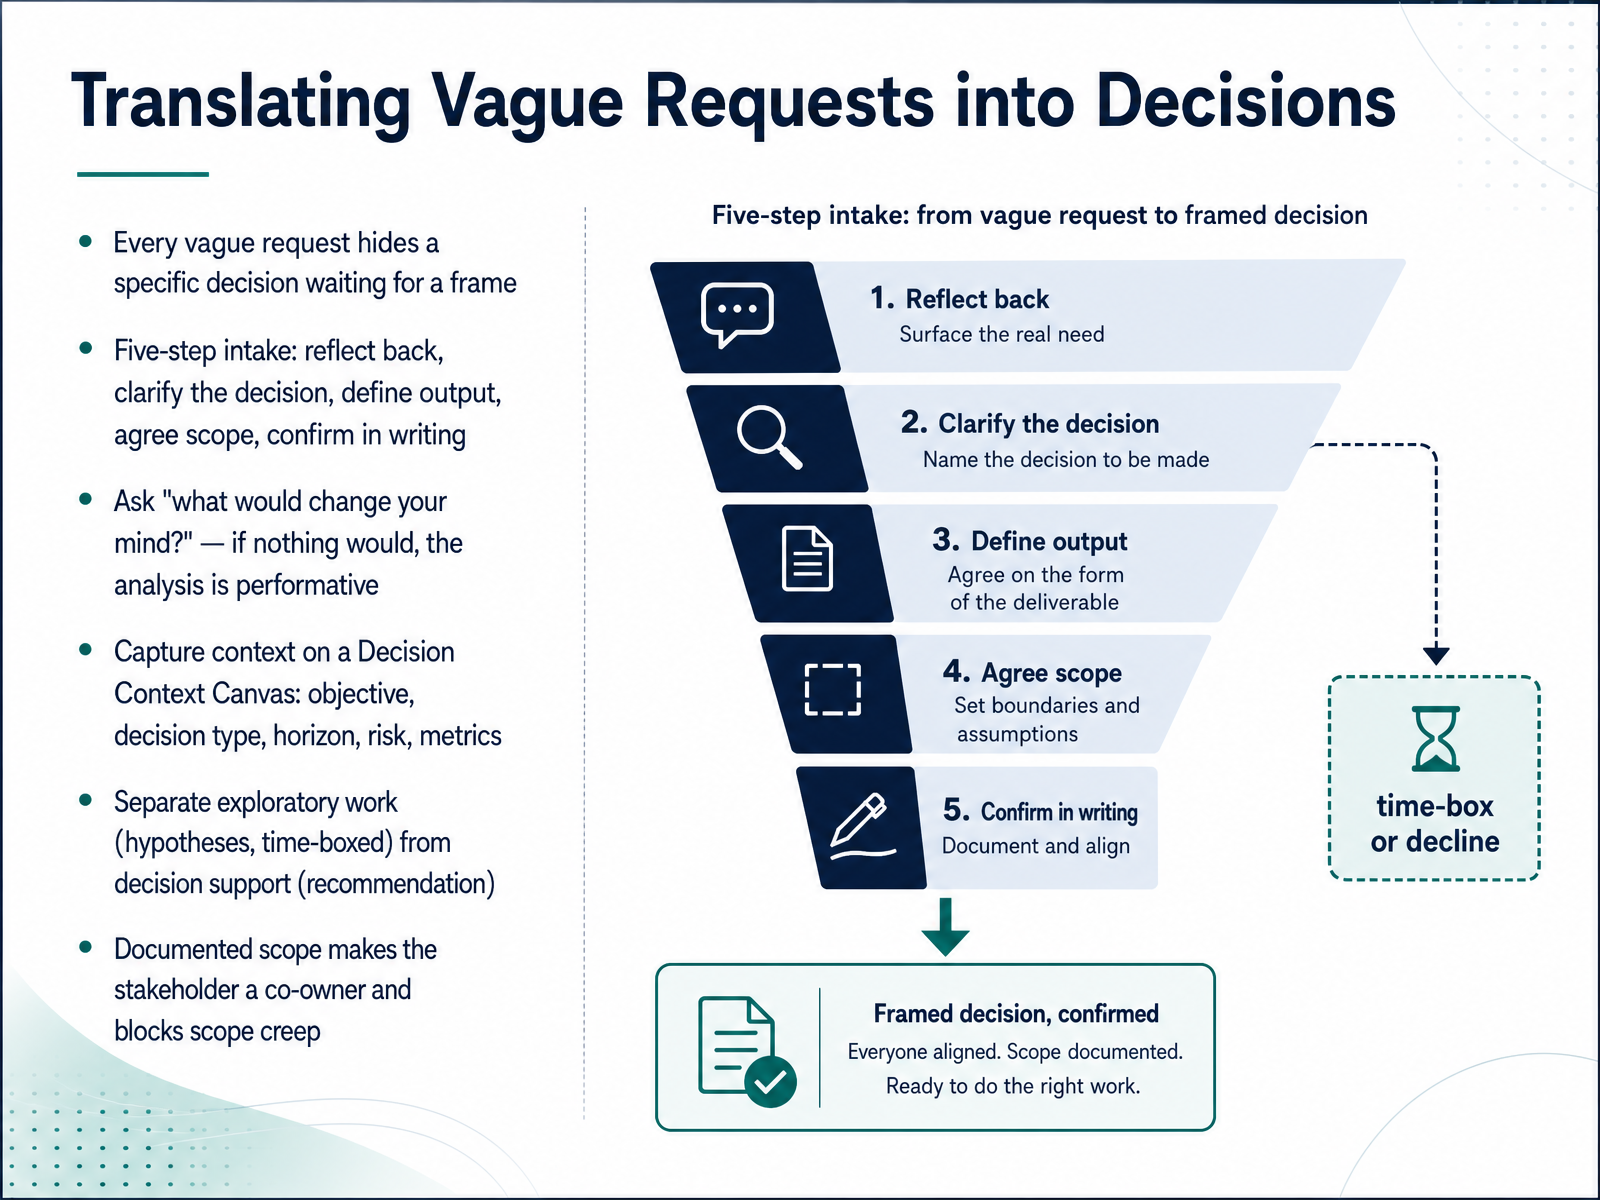
 - 04Translating Vague Requests into DecisionsNow let's talk about the intake conversation itself, because this is where most misalignment is created or prevented. Every vague request hides a specific decision waiting for a frame. So resist the urge to start scoping immediately. Instead, run a five-step intake: reflect back what you heard, clarify the decision, define the output format, agree on scope and timeline, then confirm it in writing. The most powerful question you can ask is, what would change your mind? If nothing would, the analysis is performative, and you should manage your time investment accordingly. Capture the context on a Decision Context Canvas: objective, decision type, horizon, risk tolerance, and success metrics. And separate exploratory work, which is time-boxed and produces hypotheses, from decision support, which produces a recommendation. That documented scope makes the stakeholder a co-owner and blocks scope creep before it starts. Coming up next, message architecture, answer first, evidence second.
 varsitytutors.comiiba.orgbuildwithaitoday.com+22 min
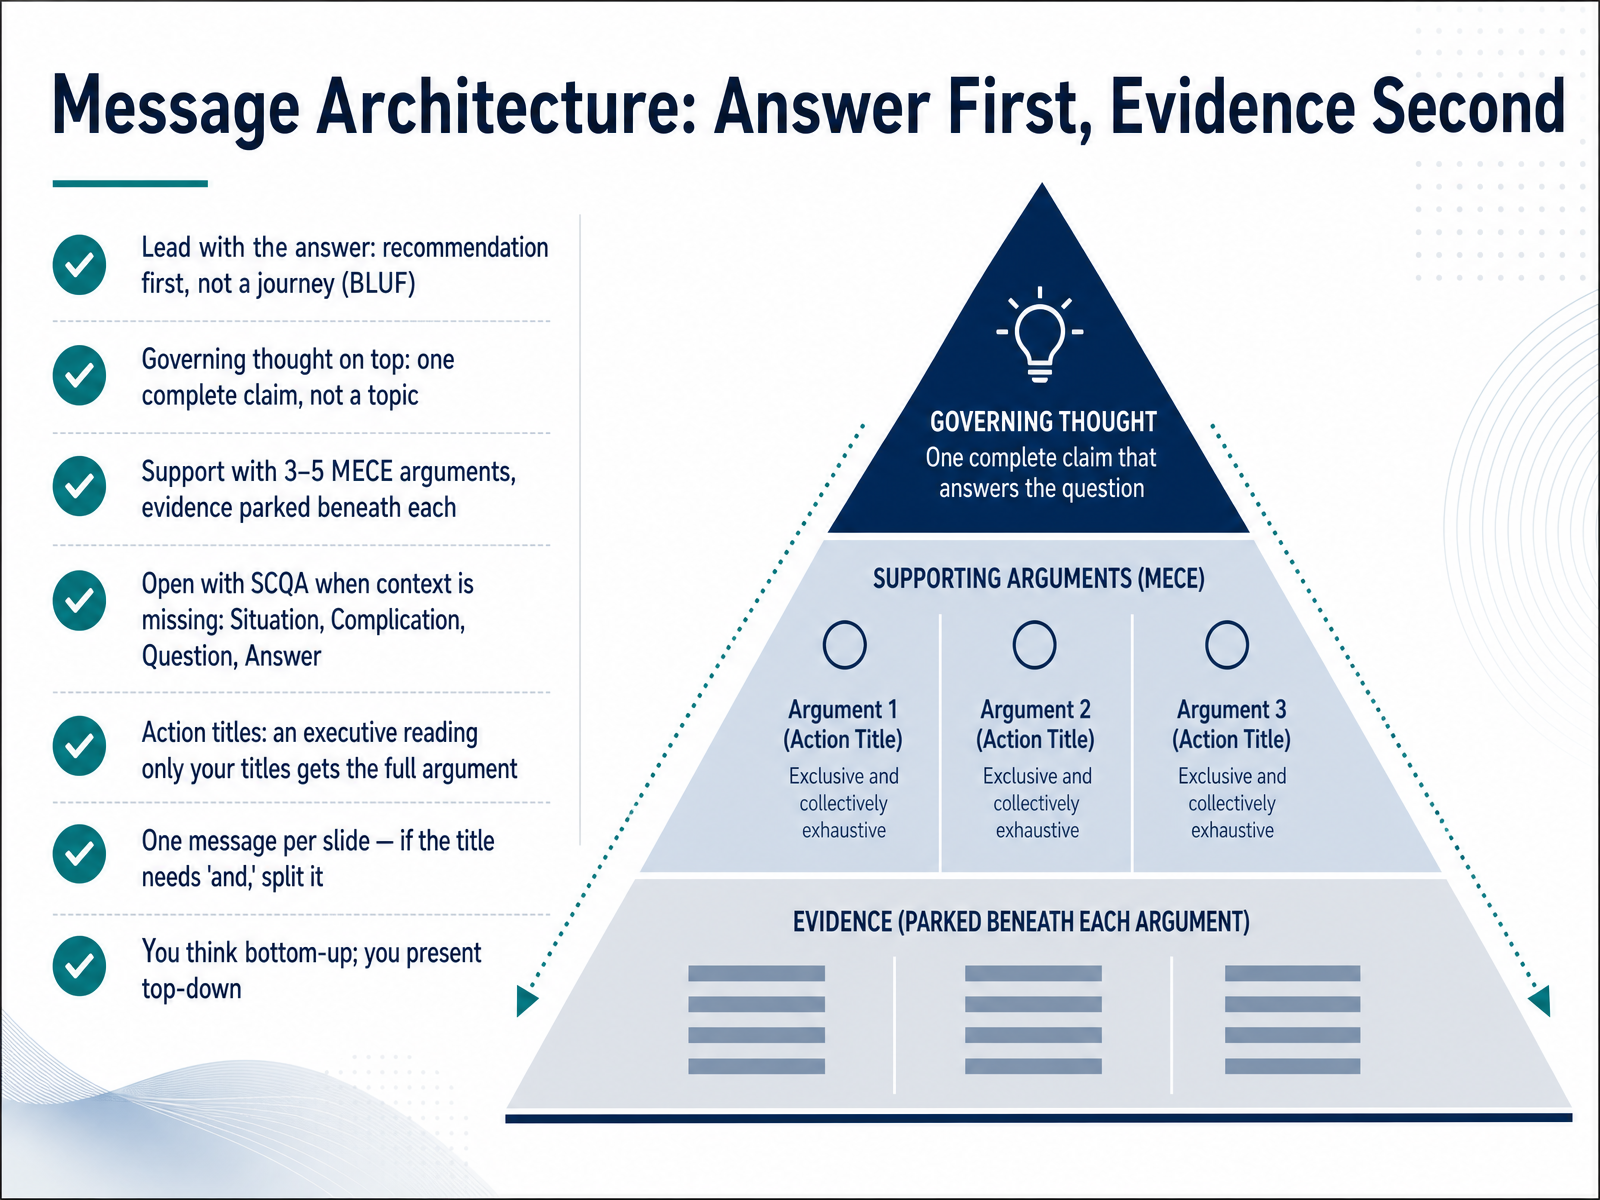
 - 05Message Architecture: Answer First, Evidence SecondSo how does that structure actually hold together in a deck? The Pyramid Principle. Lead with the answer, not the journey. The recommendation goes first. On top sits your governing thought, one complete claim. Not a topic like churn, but a claim: new-user churn rose eighteen percent last quarter, driven by onboarding drop-off. Below that, three to five mutually exclusive, collectively exhaustive arguments, each with its evidence parked directly beneath it. When context is missing, open with S C Q A. Situation, Complication, Question, Answer. Then think about your titles, because an executive who reads only them should still get the full argument. That is the titles test. And one message per slide. If your title needs the word and, split it. Remember, you think bottom-up, but you present top-down. Now, which format carries that message best?
 cadetx.co.ukdatarekha.comdatarekha.com+21 min
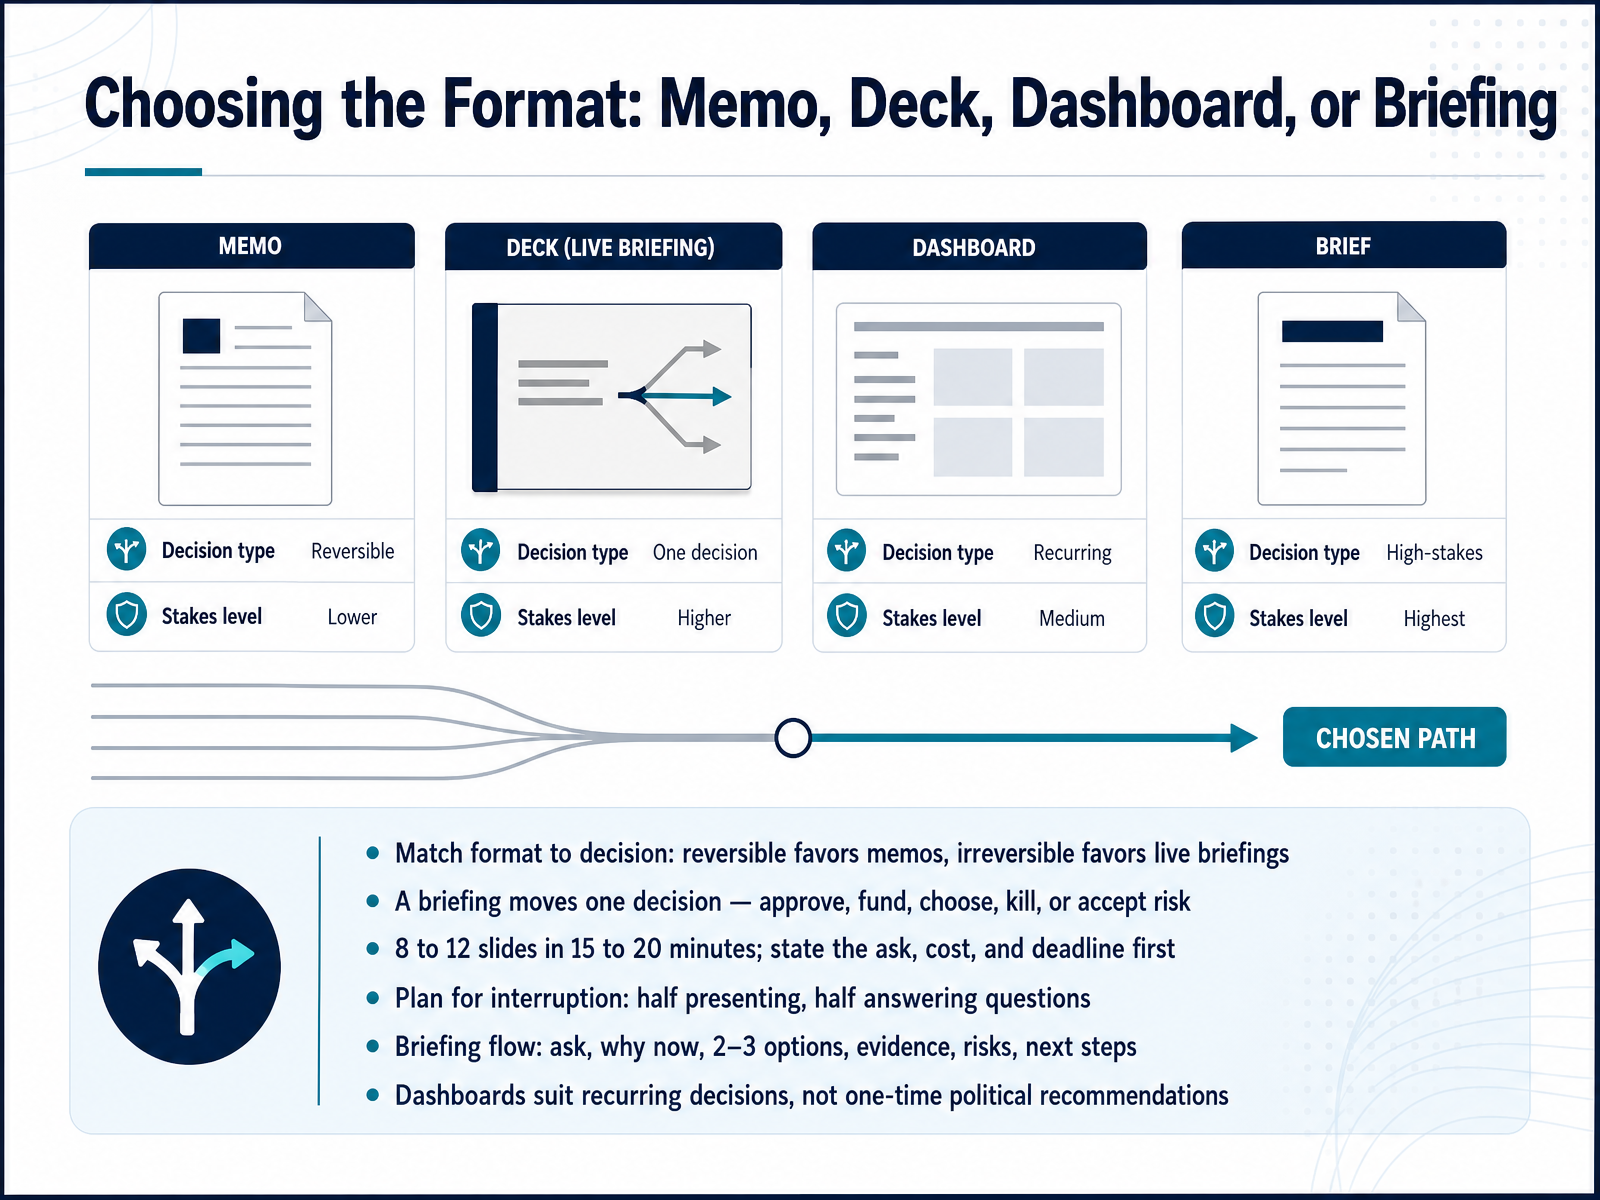
 - 06Choosing the Format: Memo, Deck, Dashboard, or BriefingLet's talk about format. The format should follow the decision, not the other way around. If the decision is reversible, a memo is usually enough. You write the recommendation, they read it, they respond, and if it is wrong, you reverse it. If the decision is irreversible, you want a live briefing. You want the room, the questions, and the commitment in real time. A briefing moves exactly one decision: approve, fund, choose, kill, or accept risk. If nothing is being decided, that is an update, and an update belongs in email. Eight to twelve slides in fifteen to twenty minutes. State the ask, the cost, and the deadline first. Then plan for interruption: half presenting, half answering questions. The flow is ask, why now, two or three real options including doing nothing, evidence, risks, next steps. Dashboards are different. They suit recurring decisions, not one-time political recommendations. Now, let's look at how to make the visuals decision-grade and accessible.
 deckova.aislidemodel.comdeepspeedai.com+22 min
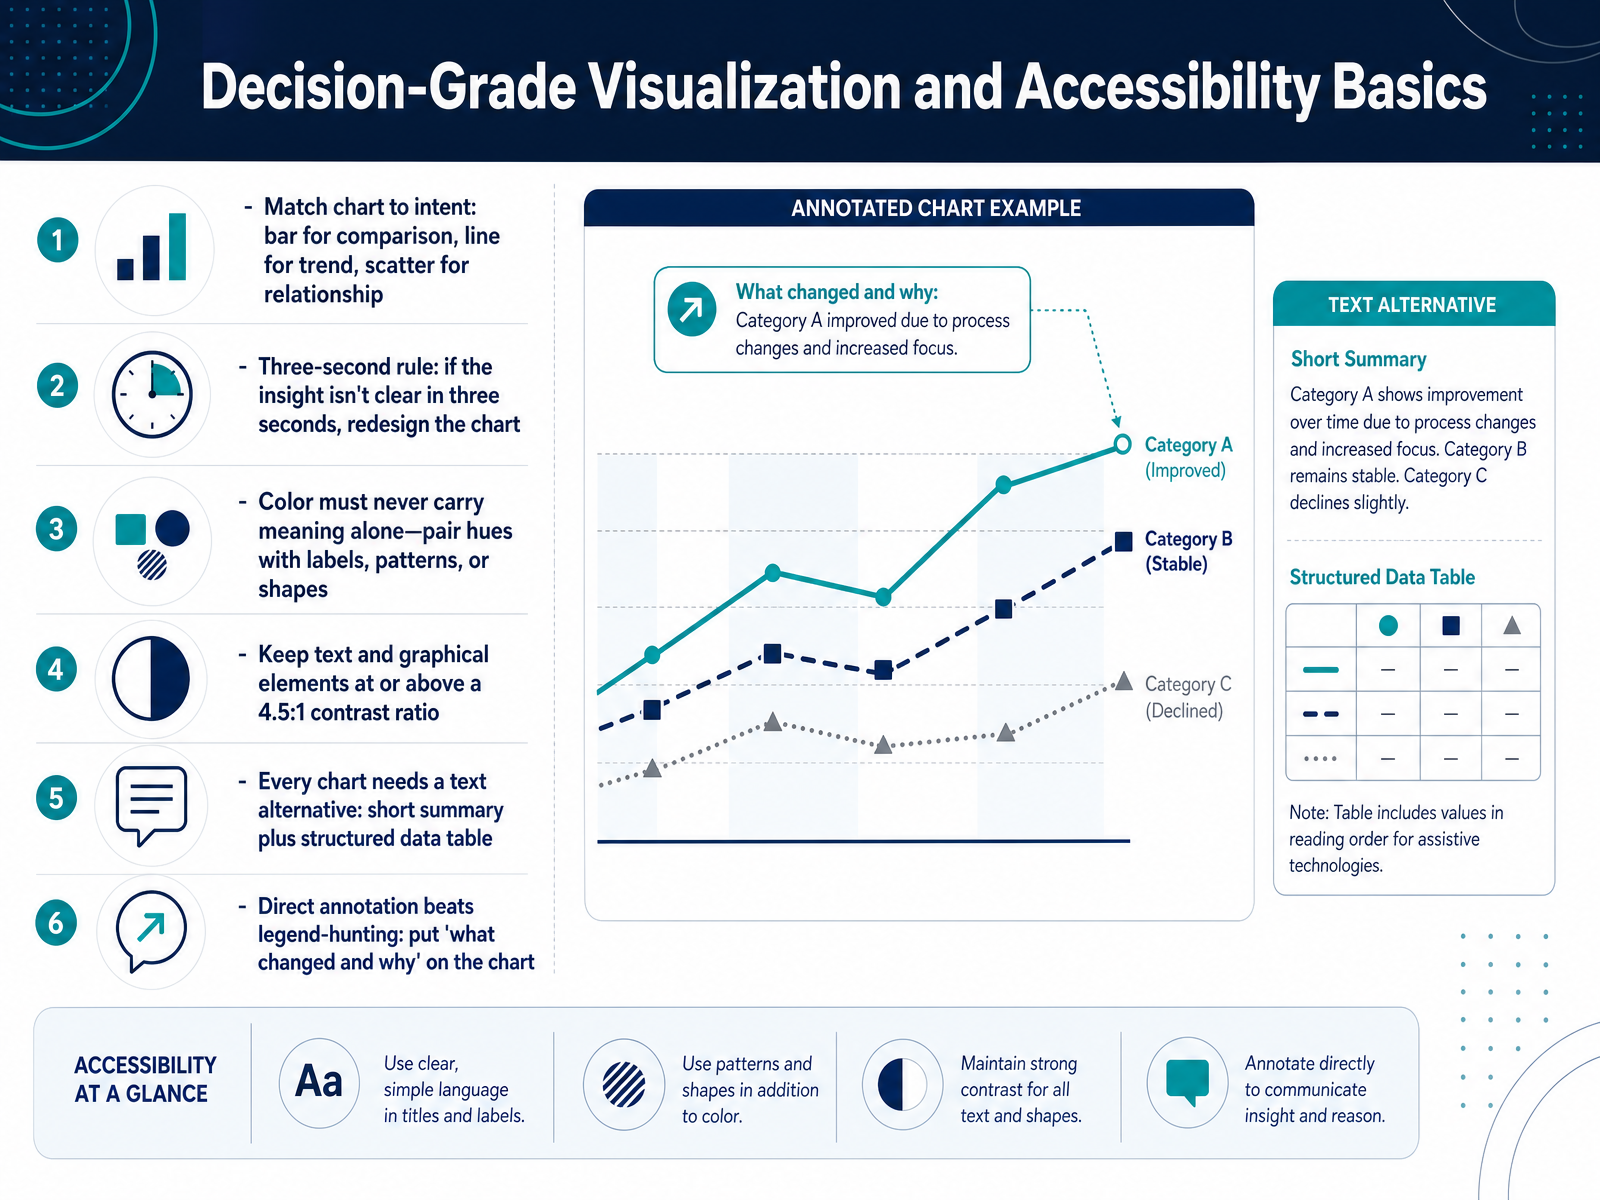
 - 07Decision-Grade Visualization and Accessibility BasicsLet's talk about turning an analysis into a decision-grade visualization. Start by matching the chart to your intent. Bar charts for comparison. Line charts for trend. Scatter plots for relationships. Then apply the three-second rule. If a stakeholder cannot grasp the core insight in three seconds, redesign the chart. Color must never carry meaning alone. Pair every hue with labels, patterns, or shapes. That matters because roughly one in twelve men has some form of color vision deficiency. Keep text and graphical elements at or above a four point five to one contrast ratio. Every chart needs a text alternative: a short summary plus a structured data table. And put the annotation directly on the chart. What changed and why. That beats legend-hunting every time. Next, we'll cover communicating uncertainty, limitations, and model risk.
 1 min
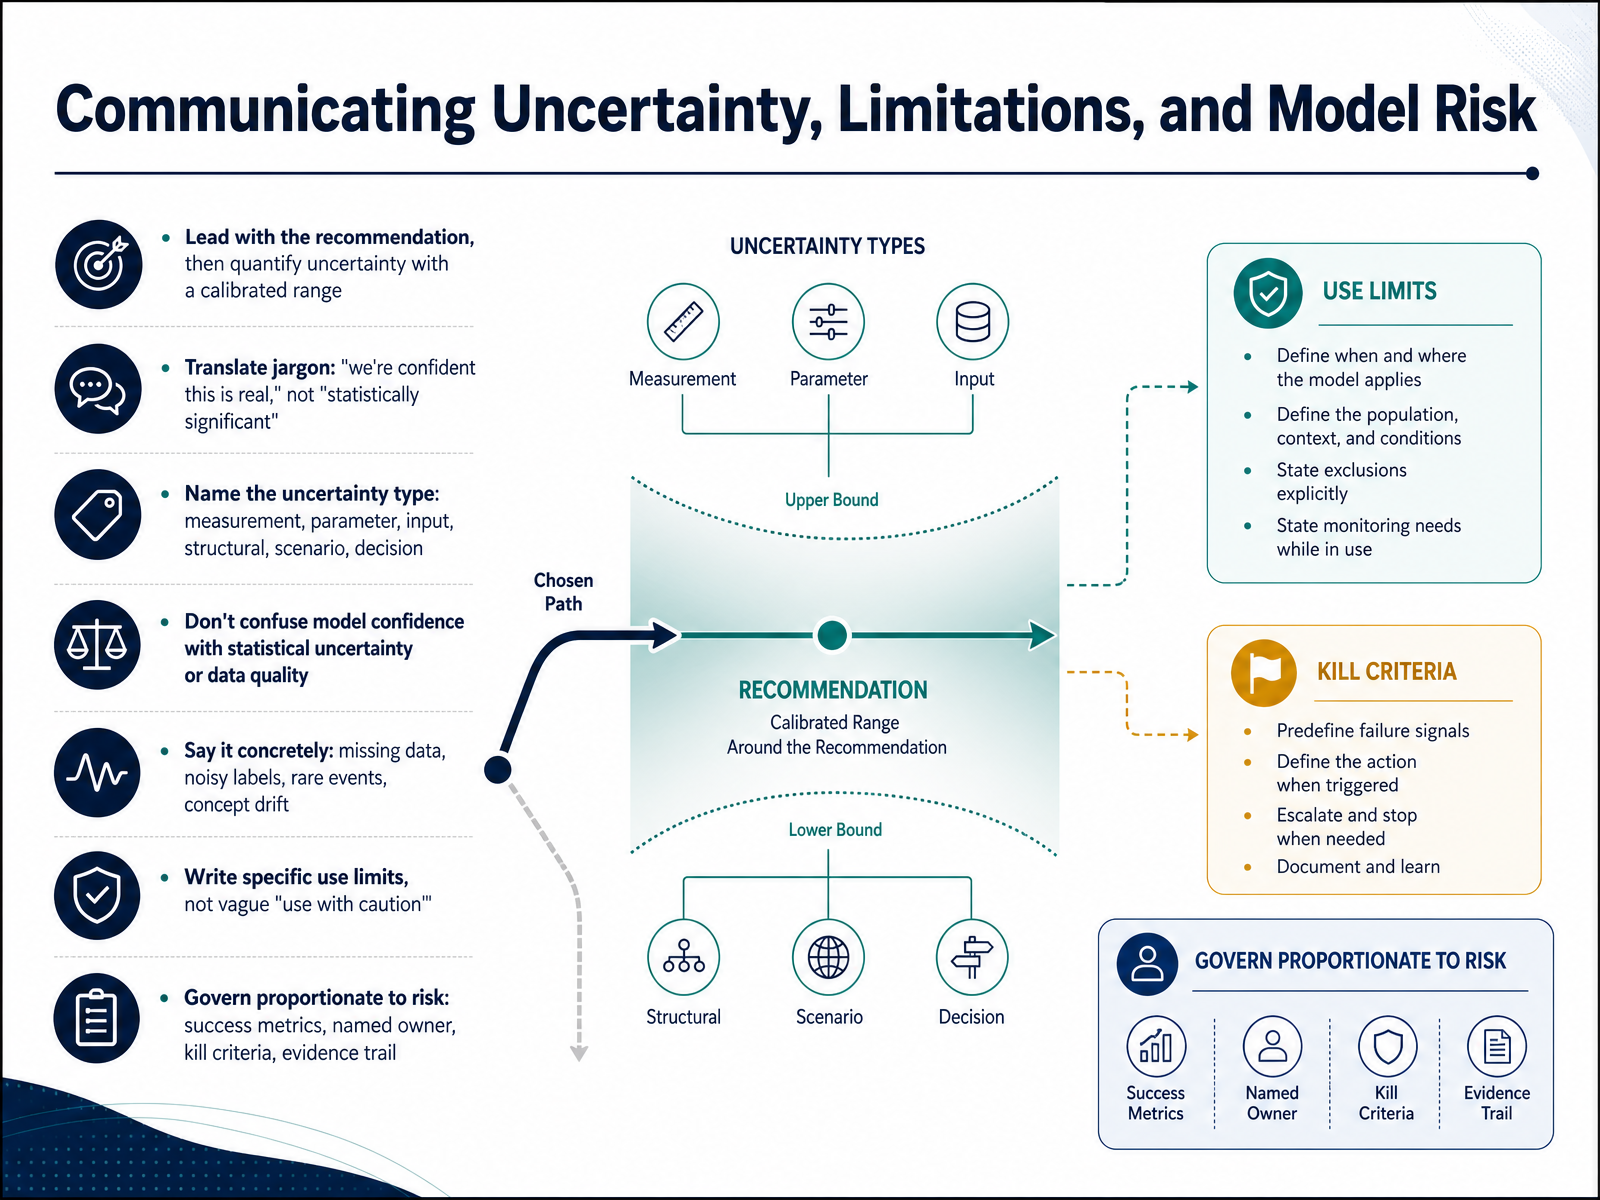
1 min - 08Communicating Uncertainty, Limitations, and Model RiskLet's talk about how we communicate uncertainty without losing the room. Lead with the recommendation and only then quantify the range. Not a p-value, but something like, we're confident this is real, and the lift is probably three percent, realistically between one and five. Name the uncertainty type, because measurement, parameter, input, structural, scenario, and decision uncertainty all point to different next steps. And be careful not to confuse model confidence, the score a model puts on its own output, with statistical uncertainty or data quality. Those are different things, and conflating them creates overconfidence. Say the limitation concretely. Missing data, noisy labels, rare events, concept drift. Then write a specific use limit, not vague caution. The model was validated on normal operating conditions, not extreme stress. Govern proportionately to risk, with success metrics, a named owner, kill criteria, and an evidence trail. That is what turns honesty about uncertainty into a decision your stakeholders can stand behind. Next, we'll look at data storytelling without manipulation.
 2 min
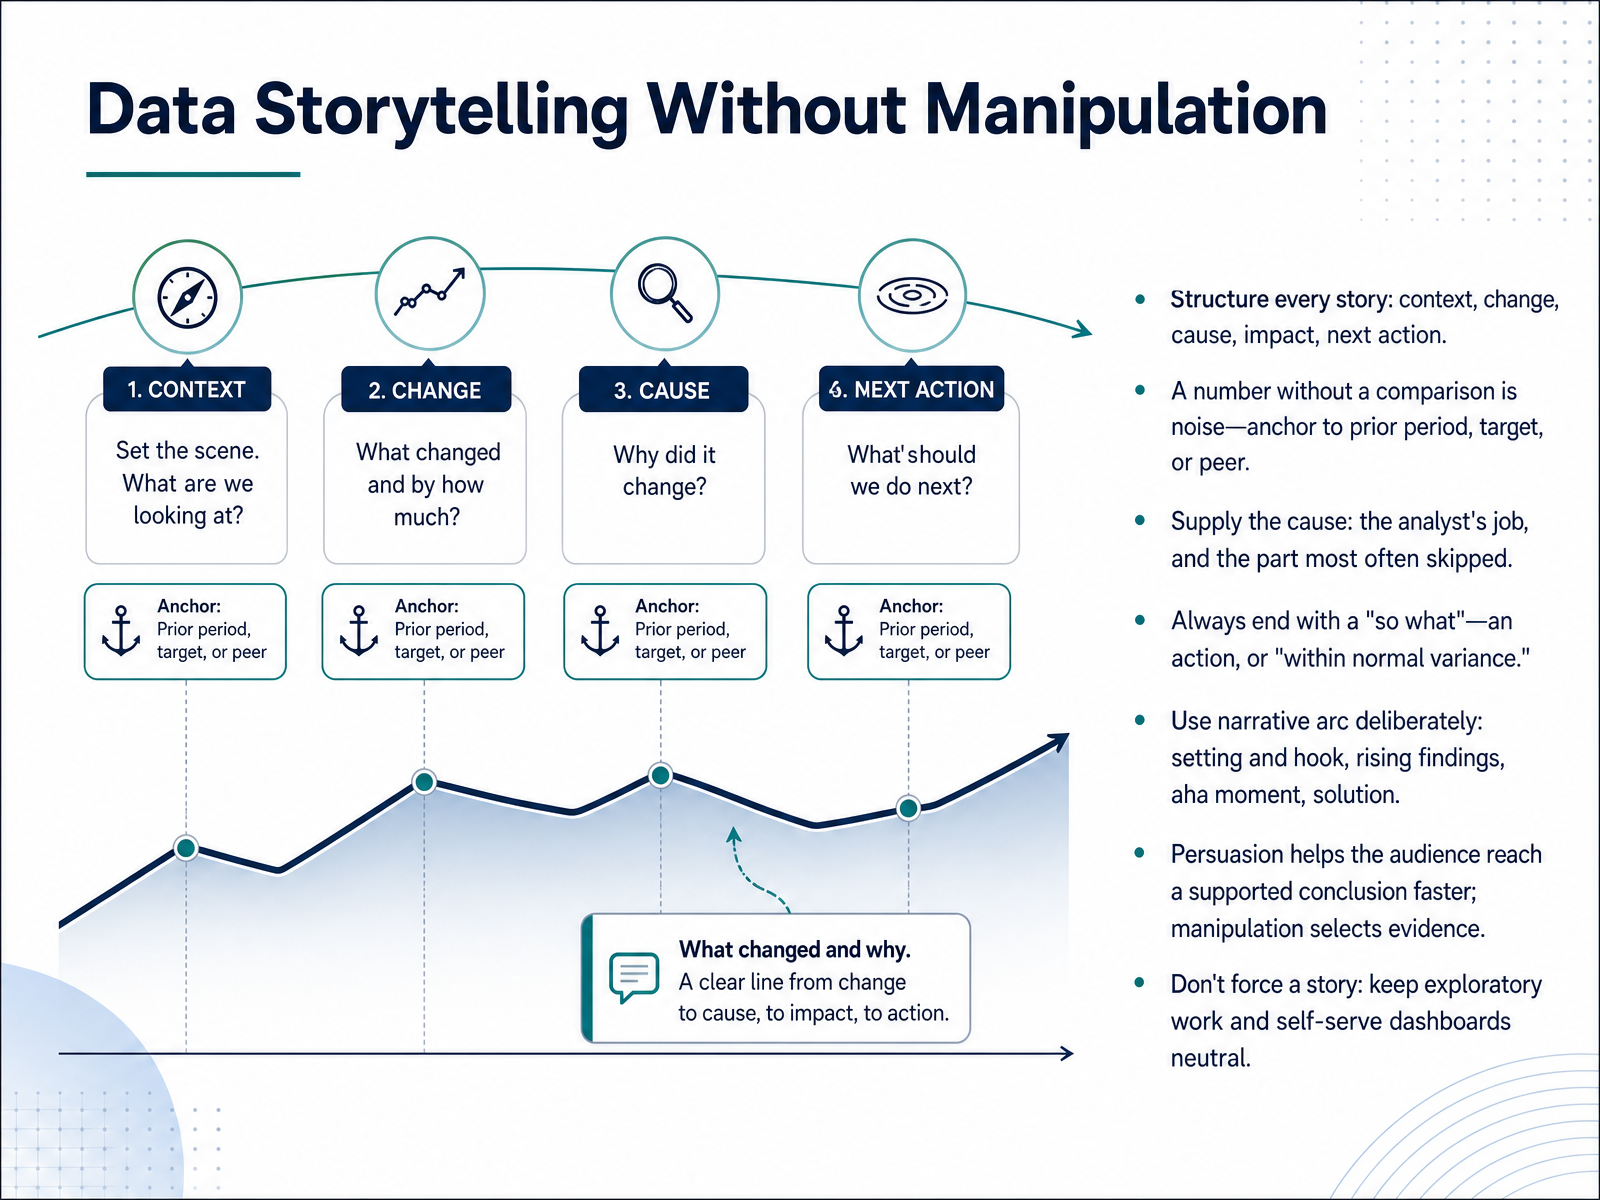
2 min - 09Data Storytelling Without ManipulationNow let's talk about data storytelling without manipulation. Structure every story the same way: context, change, cause, impact, next action. Context sets the baseline at one hundred fifty dollars for nine months. Change states it jumped forty seven percent, to two hundred twenty. Cause names the driver, a forty percent rise in paid search costs. Impact translates it into dollars, fourteen thousand a month. Next action says who does what, by when. A number without a comparison is noise, so anchor to a prior period, a target, or a peer. Supplying the cause is your job, and it is the step most often skipped. Always end with a so what, an action, or plainly, within normal variance. Persuasion helps an audience reach a supported conclusion faster. Manipulation selects the evidence, hiding the holdout that disagreed. So use narrative arc deliberately: setting and hook, rising findings, the aha moment, then the solution. But do not force a story. Keep exploratory analysis and self-serve dashboards neutral. Tell a story when you are moving a specific decision. Ending on the next slide, Presenting to Executives and Mixed-Literacy Rooms.
 datarekha.com2 min
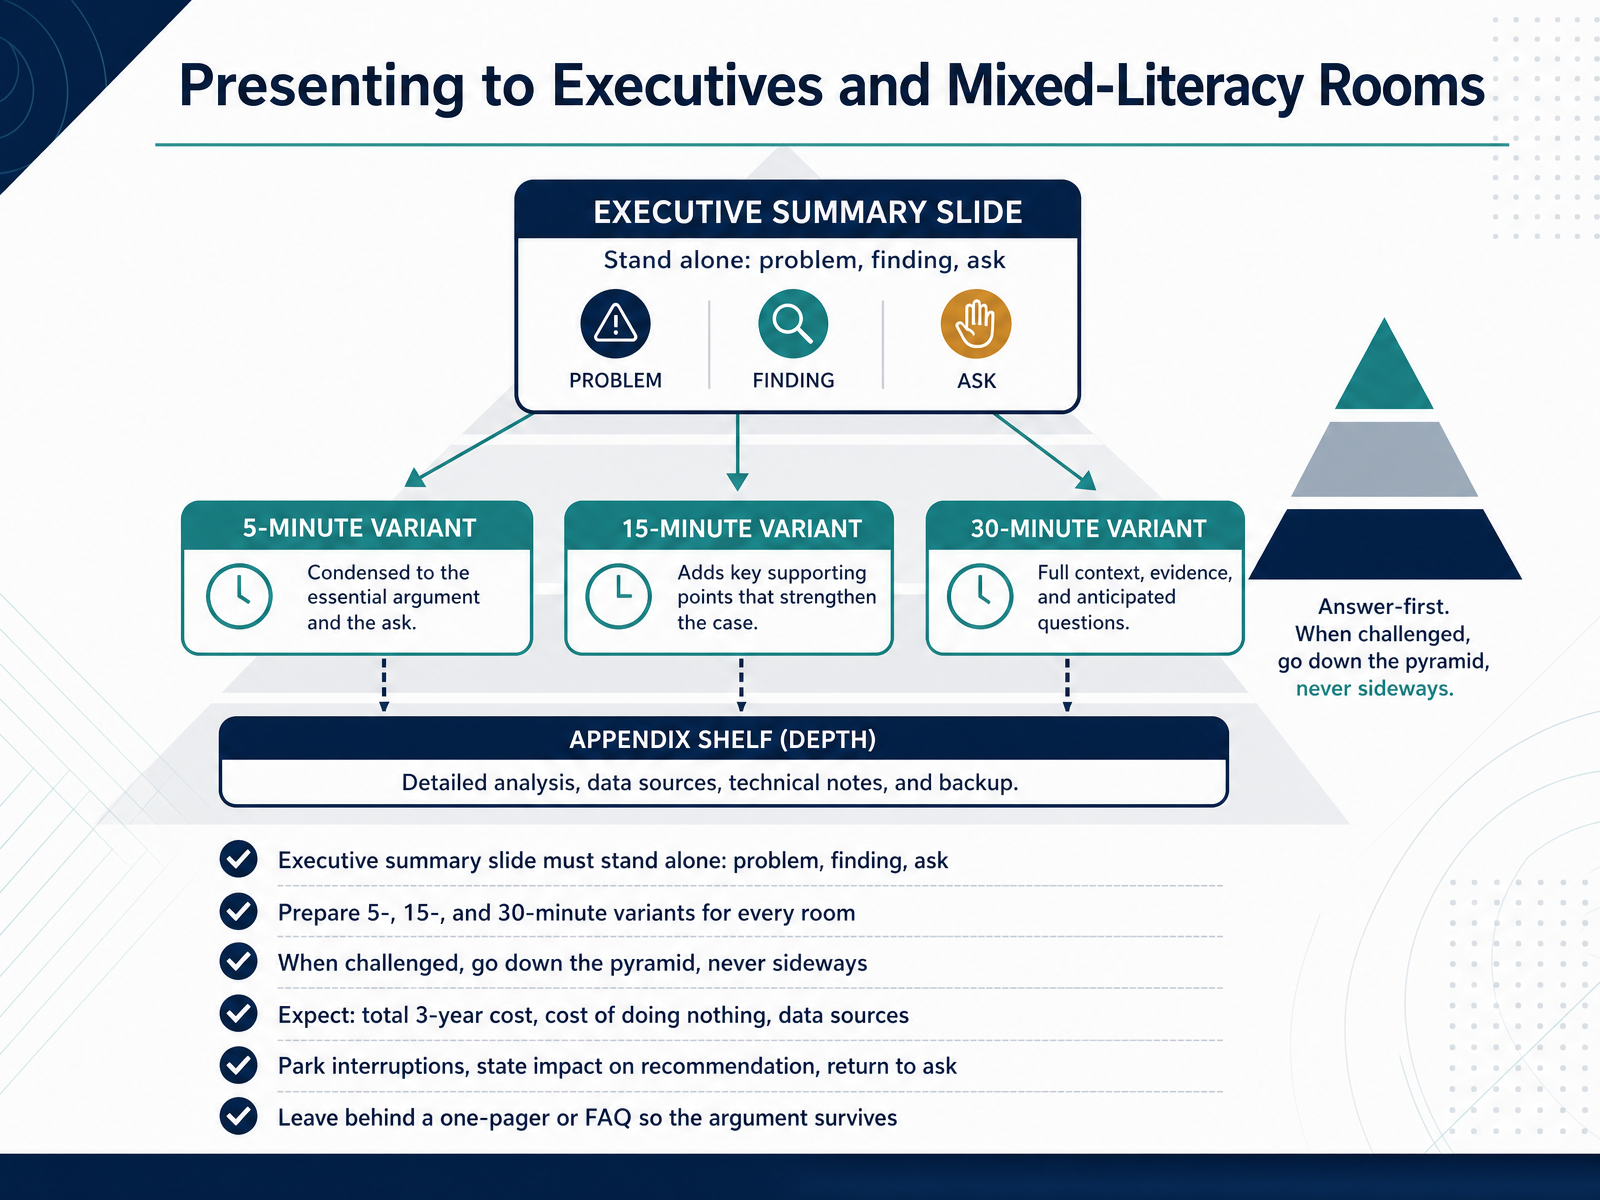
 - 10Presenting to Executives and Mixed-Literacy RoomsNow let's talk about the executive room. Your executive summary slide has to stand alone. Problem, finding, ask, all on one slide, so a deputy who takes the meeting instead of the VP can carry it back in one sentence. For a mixed-literacy room, prepare the same argument at five, fifteen, and thirty minutes. Same pyramid, different depth. When someone challenges your numbers, go down the pyramid, never sideways. Going sideways reads as defensiveness and burns trust fast. Expect three questions: the total three-year cost, not just this year, the cost of doing nothing, and where the data came from. Have those answers on the slide, with the source line visible.
When an interruption lands, park it, state its impact on your recommendation, and return to the ask. Leave behind a one-pager or FAQ so the argument survives after you leave the room.
Next, dashboards, metric governance, and self-service trust.
 deckova.aislidemodel.comdeepspeedai.com+22 min
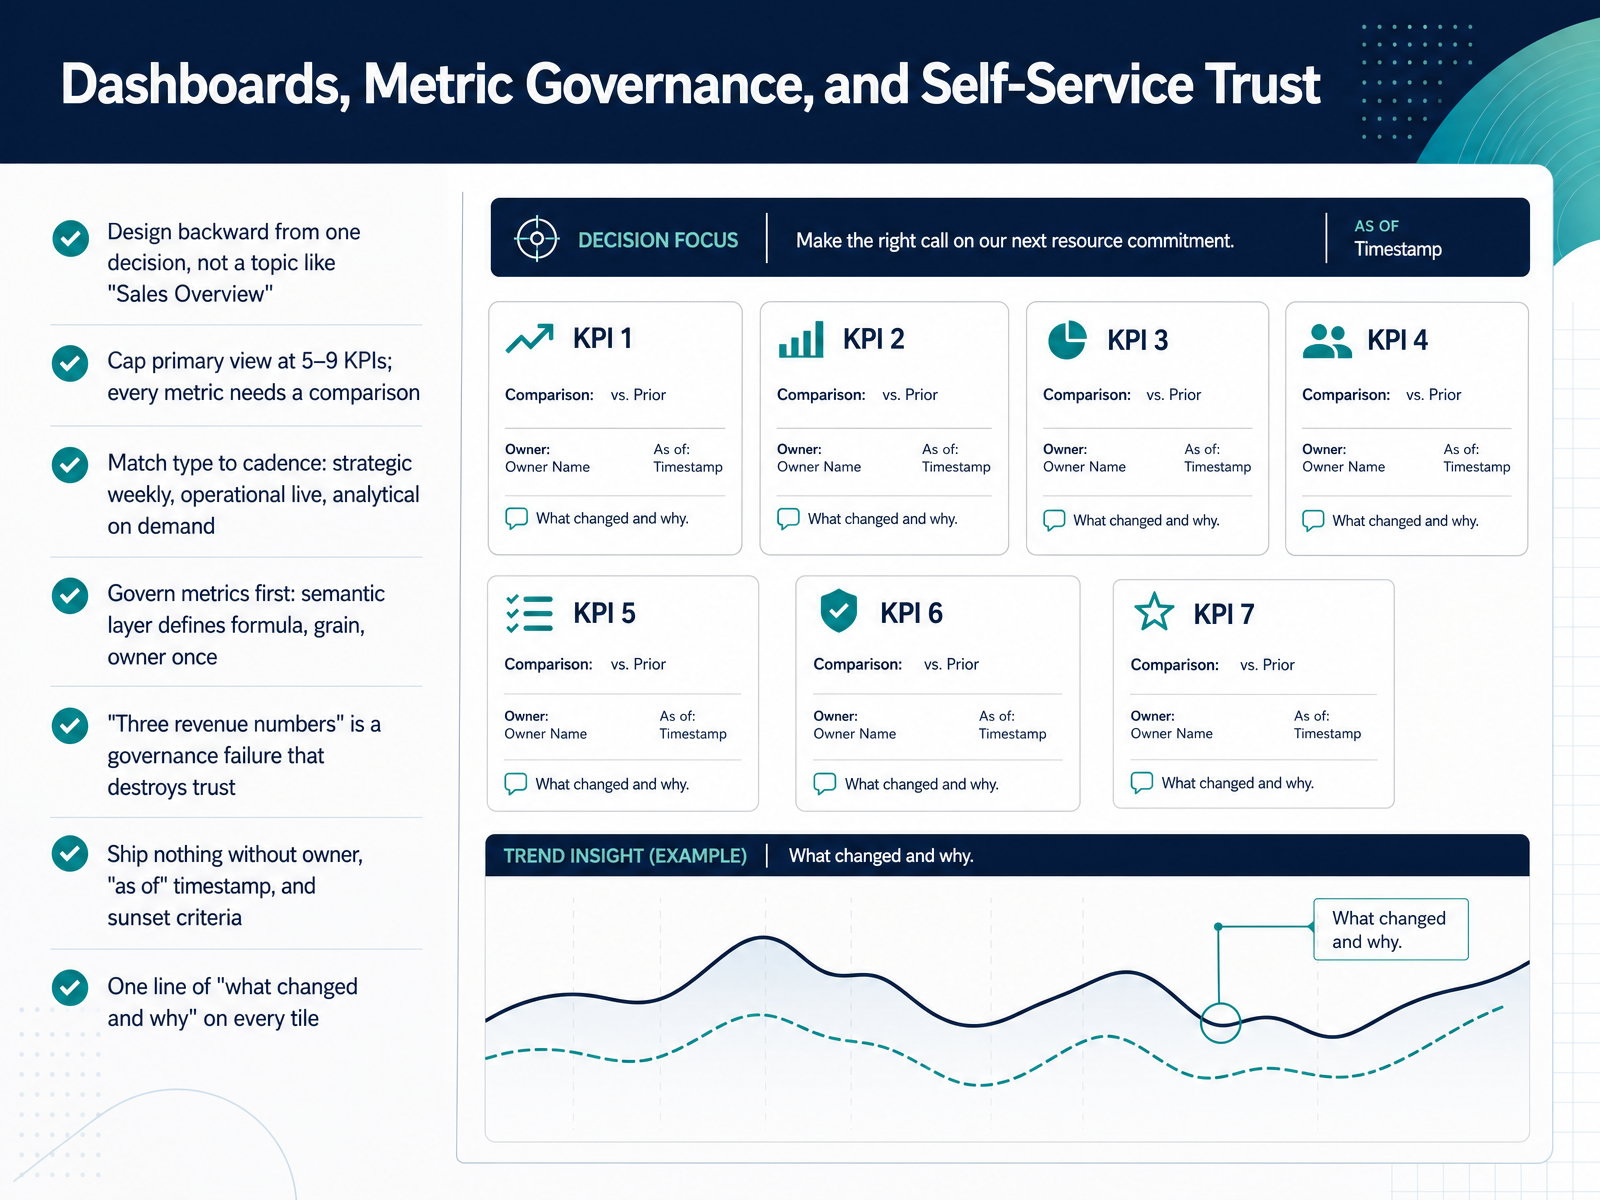
 - 11Dashboards, Metric Governance, and Self-Service TrustNow let's talk about dashboards, metric governance, and self-service trust. The anchor principle is this: design backward from one decision, not a topic. "Sales Overview" is a topic. "Should we reforecast Q three?" is a decision. Cap your primary view at five to nine KPIs, and give every metric an explicit comparison, versus last period, versus plan, versus target. Match type to cadence: strategic views refresh weekly, operational views live, analytical views on demand. Then govern metrics first. Your semantic layer defines formula, grain, and owner once, so revenue means the same thing everywhere. Three revenue numbers in a meeting is a governance failure, and it destroys trust fast. So ship nothing without a named owner, an as of timestamp, and sunset criteria. And put one line of what changed and why on every tile. That single sentence is often the highest value thing on the screen. Those annotations are where your holdout validation discipline shows up as business impact. Next, we'll work through handling pushback and difficult conversations.
 2 min
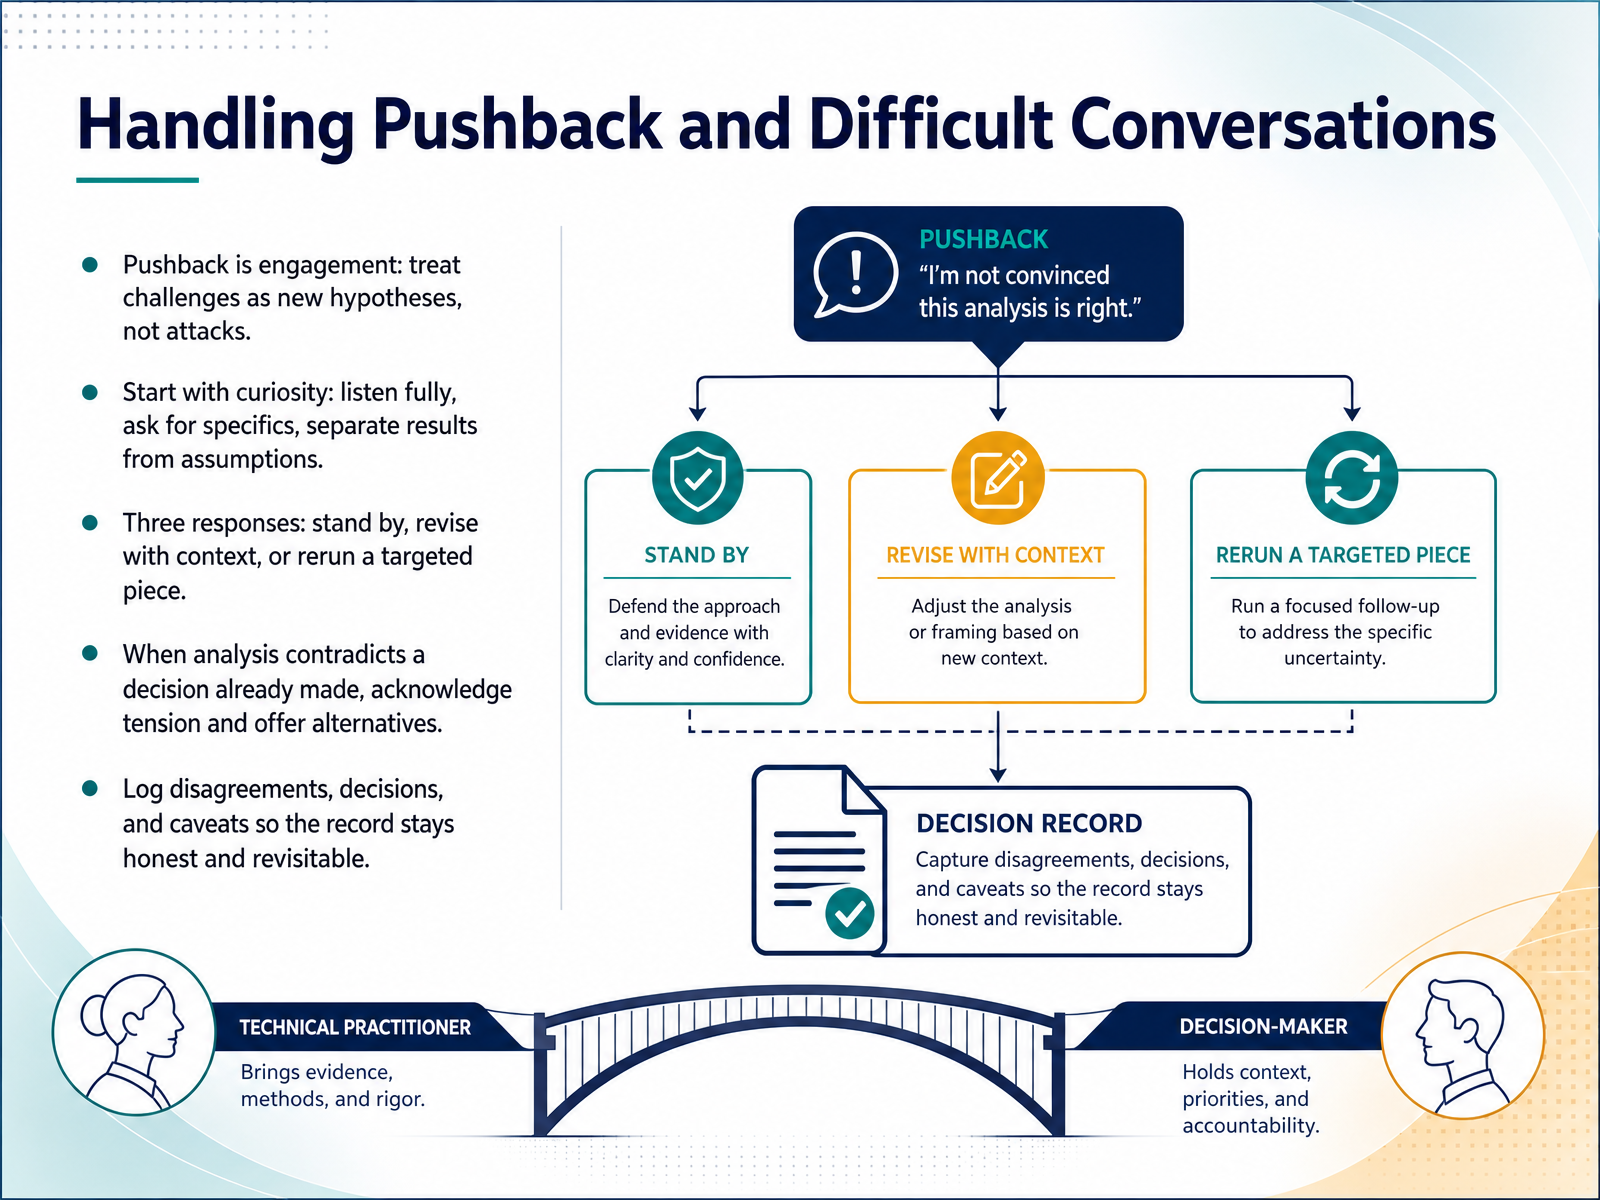
2 min - 12Handling Pushback and Difficult ConversationsLet's talk about pushback, because it is not a threat. It is engagement. When a stakeholder challenges your findings, they are handing you a new hypothesis. So start with curiosity. Listen fully, ask for specifics, and separate disagreement with your results from disagreement with your assumptions. From there, you have three responses. Stand by the result when the challenge rests on a misunderstanding of the metric. Revise when the pushback surfaces context your model did not capture. Or rerun a targeted piece when the concern exposes a real data quality issue. When your analysis contradicts a decision already made, name the tension directly. No statistically significant lift does not mean the change is worse. It means the effect is indistinguishable from noise at this sample size. Then offer alternatives, such as extending the test or a limited launch with monitoring. And document it. Log the disagreement, the decision, and the caveats. Your job is to inform, not to decide. Building a Communication Practice That Compounds.
 2 min
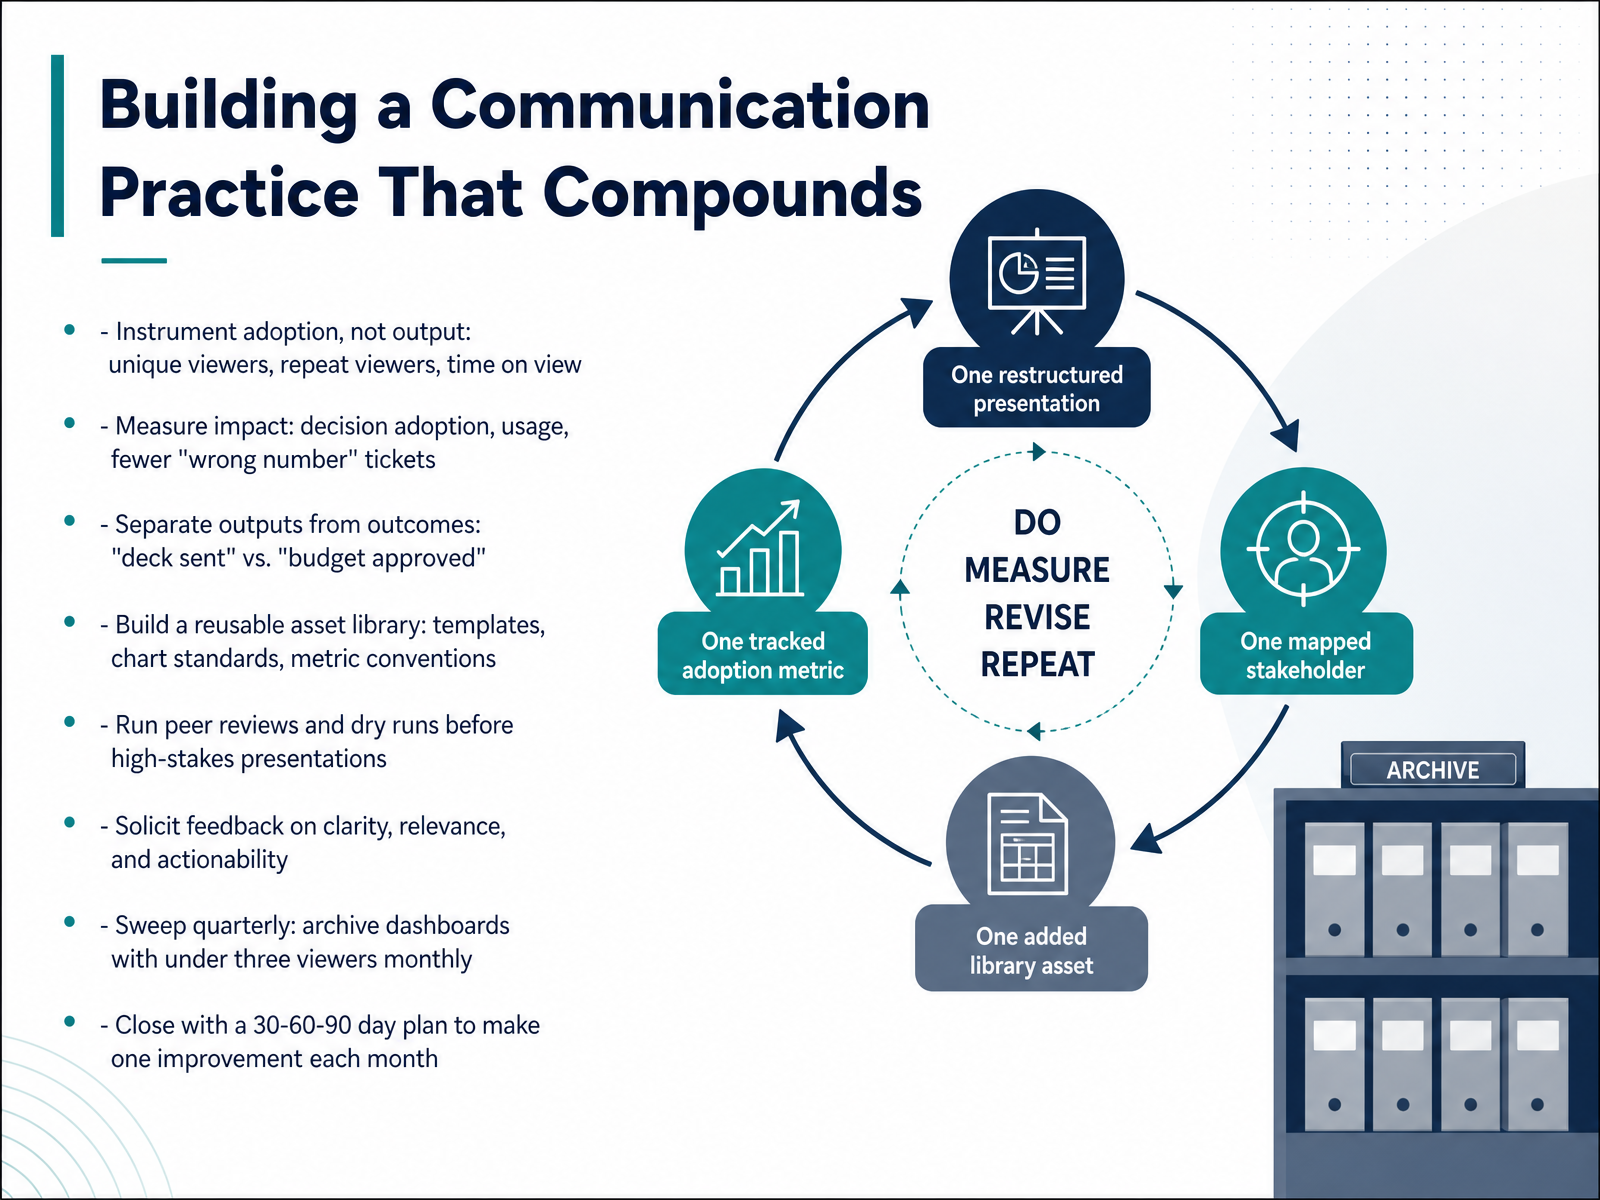
2 min - 13Building a Communication Practice That CompoundsLet's close by making this a practice that compounds. Instrument adoption, not output. Track unique viewers, repeat viewers, and time on view. A dashboard with under three viewers a month is a deprecation candidate, not a redesign candidate. Separate outputs from outcomes. Deck sent is an output. Budget approved is an outcome. Measure decision adoption, usage, and fewer wrong number tickets. Build a reusable asset library: templates, chart standards, metric conventions. One definition of revenue, owned and versioned. Run peer reviews and dry runs before high-stakes presentations. Solicit feedback on clarity, relevance, and actionability, not just whether people liked the deck. Sweep quarterly: archive dashboards with under three viewers monthly. And close with a thirty, sixty, ninety day plan to make one improvement each month. That is how communication stops being a soft skill and becomes an operating discipline. Thanks for working through this with me. Keep translating model mechanics into business impact, in the same sentence, every time. You are already good at the hard part. Now go make it land.
 2 min
2 min
Take the deck with you
Download this course as a file — free, no sign-up needed.
- PDF handoutEvery slide page, ready to print or share.14 pages · 3.5 MBDownload
- Narrated PowerPointThe deck that presents itself — every slide carries the digital human's narration video.14 pages · 12.5 MBDownload
- PowerPoint slidesThe full deck as a .pptx — open it in PowerPoint, Keynote, or Google Slides.14 pages · 3.4 MBDownload
Free to use in your own training — please keep the PersonWise credit page at the end.
Have your own deck? Turn it into a course
Sources consulted
Web sources consulted while building this course.
- The Root Causes of Failure for Artificial Intelligence ... — rand.org
- Institutional Factors That Impact the Success of Big Data Science Projects — doi.org
- AI Project Failure Rate 2026: 80% Fail | Pertama Partners — pertamapartners.com
- Why AI projects fail: what the numbers actually say — governanceai.io
- The need for a risk management framework for data science projects: a systematic literature review — doi.org
- Identify stakeholders, constraints, and decision context — varsitytutors.com
- 2.1.2 Identify and Understand the Stakeholders — iiba.org
- Stakeholder Management for Analytics - AI Is Easy — buildwithaitoday.com
- 3.16 Stakeholder List, Map, or Personas — iiba.org
- Designing Business Analytics Solutions - A Model-Driven Approach — aisel.aisnet.org
- Pyramid Principle for Data Analysts: Clear Data Storytelling | CadetX — cadetx.co.uk
- Presenting to executives: lead with the answer — datarekha — datarekha.com
- Storytelling with Data — Business Analytics — datarekha — datarekha.com
- Why "Data-Driven" Presentations Often Backfire With Executives — winningpresentations.com
- The Pyramid Principle - Consulting Toolbox (with Examples) — slideworks.io
- AI Executive Briefing Deck Generator — Deckova — deckova.ai
- Formal Executive Briefing PowerPoint Template — slidemodel.com
- executive insights: Executive Briefing Template | DeepSpeed AI Guide — deepspeedai.com
- Executive AI Briefing Memo Template: Structured Format for CAIO Communications to Leadership | BrianOnAI — brianonai.com
- Executive Briefing Pack Template - Free Word Download - PM Resource Hub - The Center Of Excellence For Project Professionals — pmresourcehub.com