Begin
14 pages · ~28 min
Reading Evolutionary Trees
This training teaches learners to read and interpret evolutionary trees, covering tree structure, common ancestors, and lineages. Ideal for biology students and life science professionals.
A digital instructor presents all 14 pages. Hold “Ask” at any point and ask out loud — the answer comes from this course. No sign-up needed.
What you’ll learn
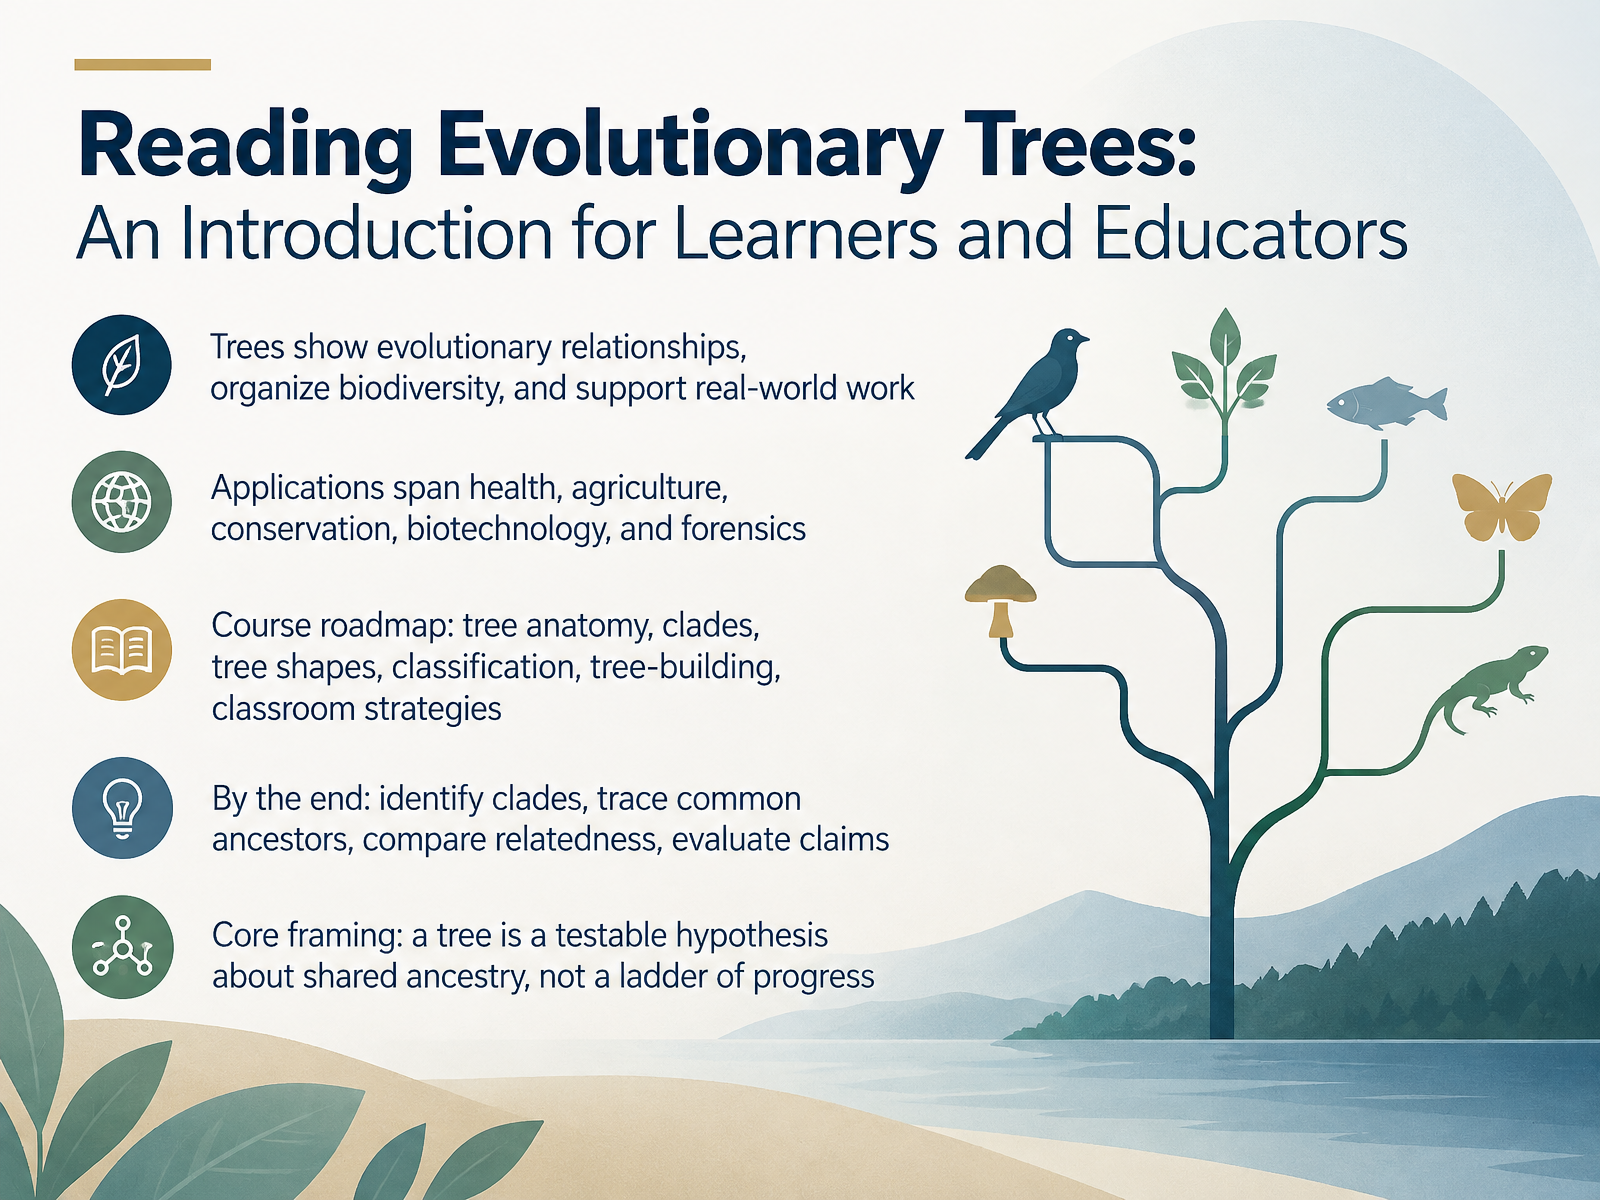
- 01Reading Evolutionary Trees: An Introduction for Learners and EducatorsWelcome. I'm glad you're here, because evolutionary trees show up everywhere, in textbooks, museums, and scientific news, and they're easier to read than they look. A phylogenetic tree is a diagram that shows evolutionary relationships, and it helps us organize the diversity of life. These trees support real work in health, agriculture, conservation, biotechnology, and even forensics. Over this course, we'll move step by step through tree anatomy, clades, tree shapes, classification, how trees are built, and classroom strategies. By the end, you'll be able to identify clades, trace common ancestors, compare relatedness, and evaluate claims that use trees. Here's the framing I want you to carry with you. A tree is a testable hypothesis about shared ancestry, not a ladder of progress. Notice that word, hypothesis. It means scientists propose a tree based on evidence, and it can be revised. Keep that in mind, and the rest will make sense. Next, let's look at why trees are misread, and why those everyday intuitions are so common.gnetum.eeb.uconn.eduen.wikipedia.orgdoi.org+22 min
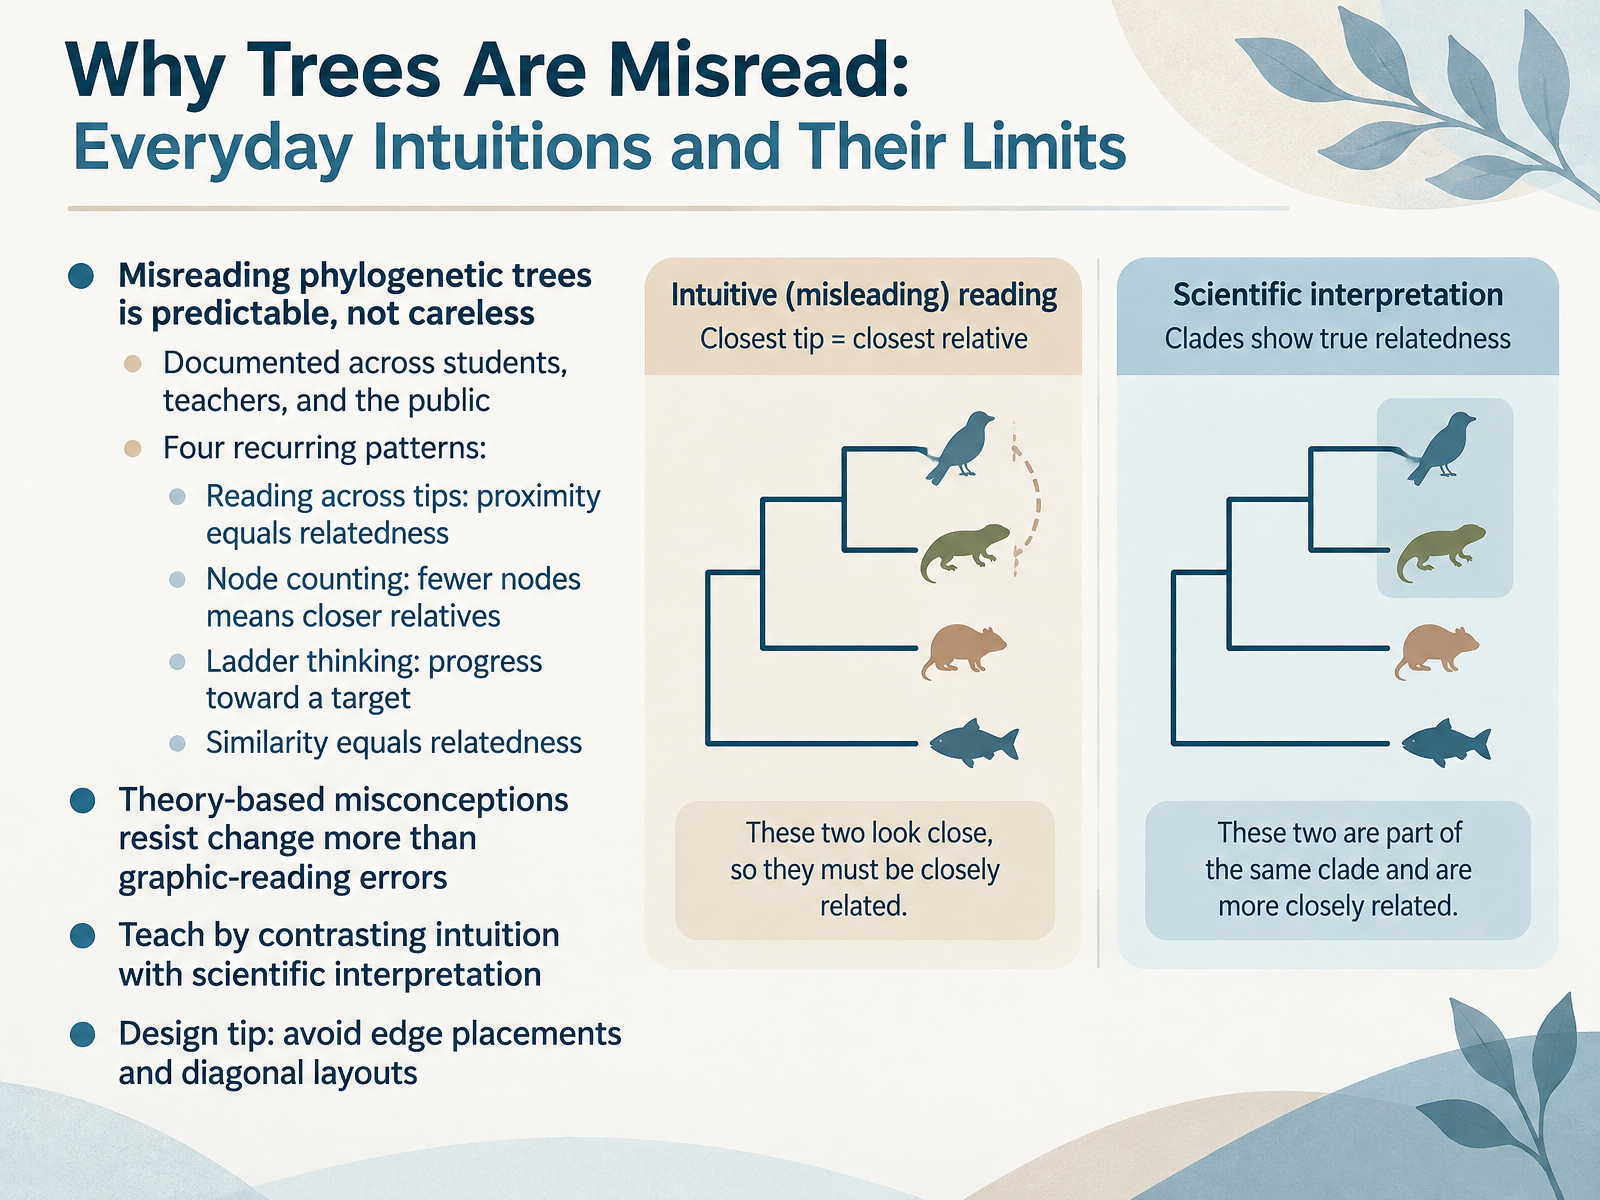
- 02Why Trees Are Misread: Everyday Intuitions and Their LimitsNow, let's look at why evolutionary trees are so often misread. Here is the reassuring part. Misreading them is predictable, not careless. Researchers have documented the same patterns in students, in teachers, and in the general public. Four patterns come up again and again. First, reading across tips, where learners assume that two species drawn close together must be closely related. Second, node counting, where fewer nodes between two species is taken to mean they are closer relatives. Third, ladder thinking, the idea that evolution climbs toward some target, with one group more advanced than another. And fourth, similarity equals relatedness, where organisms that look alike are assumed to be close relatives. Now, notice something important. The first two are graphic-reading errors. They tend to fade with practice. But ladder thinking and similarity-based reasoning are rooted in everyday intuition about the world. Those resist change, and they persist even in advanced students. So the goal is not to erase intuition. It is to contrast that intuition with the scientific interpretation, and let learners see where the two disagree. One quick design tip. Avoid placing a focal species at the very edge of a tree, and avoid diagonal layouts. Both layouts quietly encourage ladder thinking. Next, we will build the vocabulary you need. Tree Anatomy and Core Vocabulary.
 evolution.berkeley.edudoi.orgdoi.org+22 min
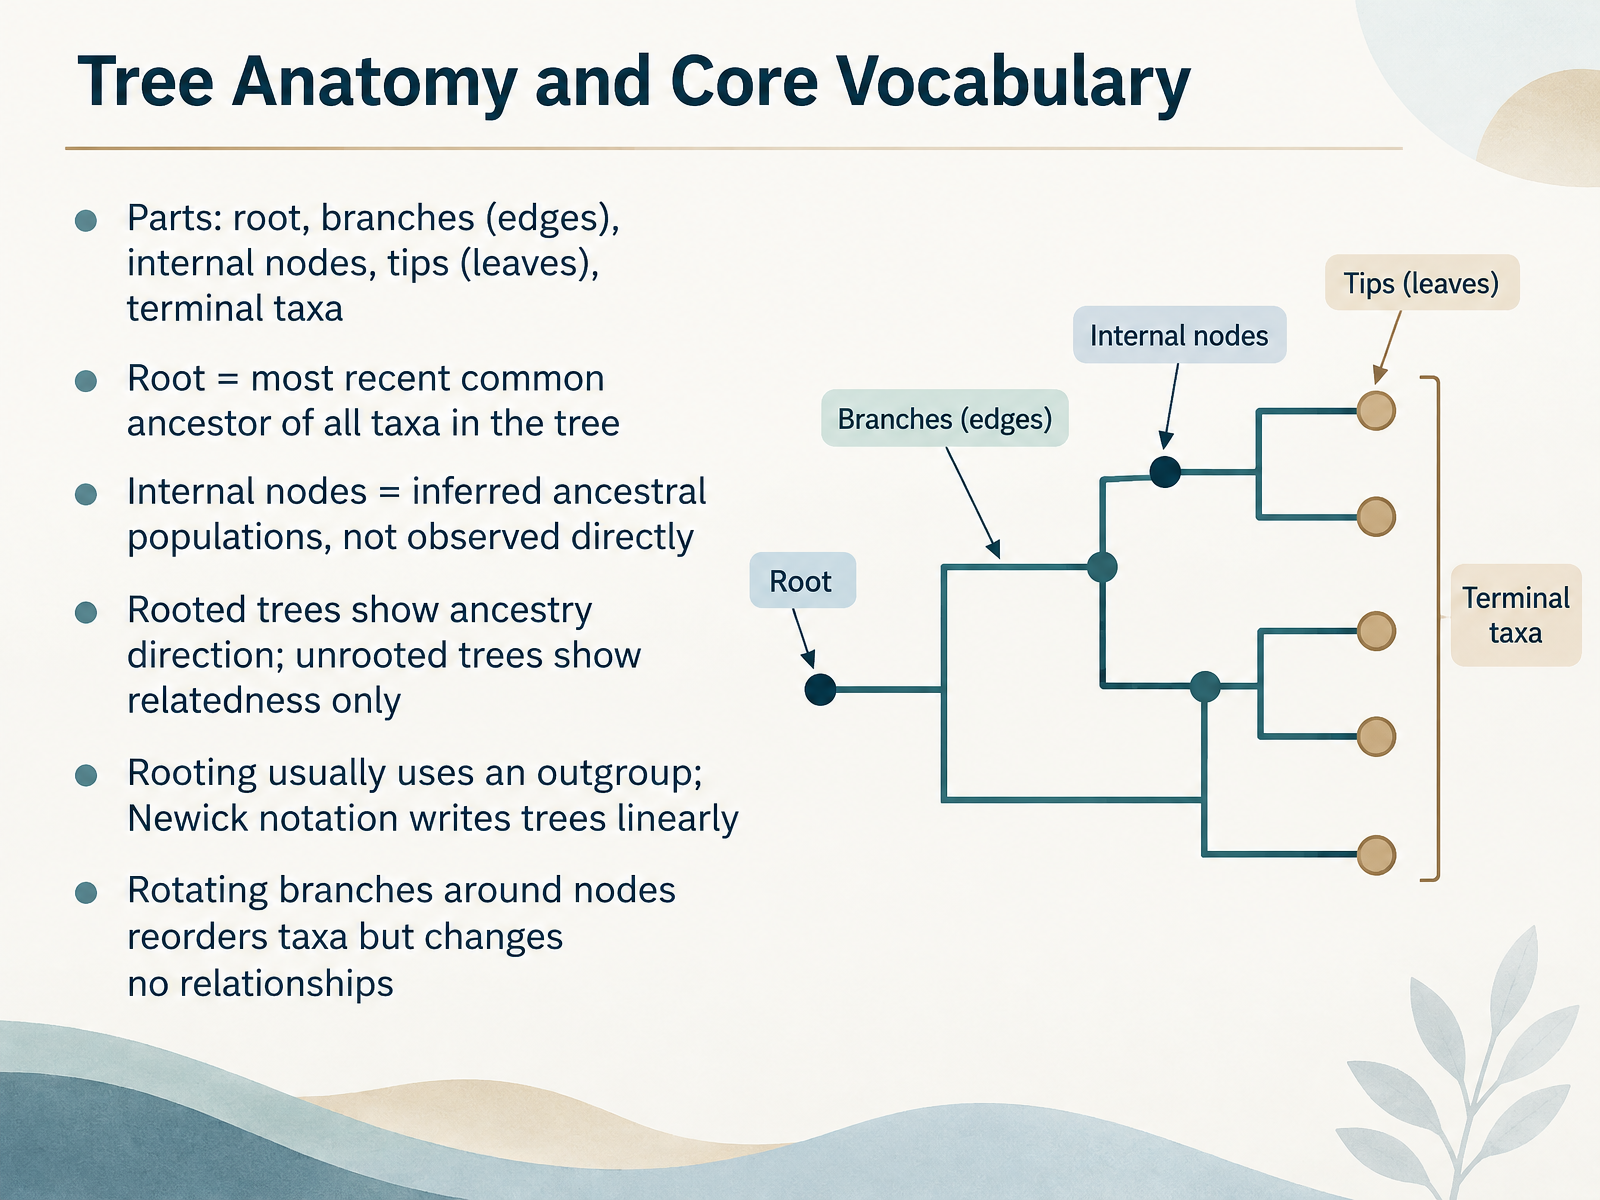
- 03Tree Anatomy and Core VocabularyLet's break the tree into its parts. The root sits at the base. It represents the most recent common ancestor of every taxon in the tree. From the root, branches, also called edges, carry lineages outward. Where branches meet, you find internal nodes. These are inferred ancestral populations. We never observe them directly. They are hypotheses, not fossils you can point to. At the far ends are the tips, or leaves. These are the terminal taxa, the actual organisms or sequences we compared. Notice that a rooted tree shows direction of ancestry, from root to tips. An unrooted tree shows relatedness only, no direction. To root a tree, scientists usually add an outgroup, a lineage known to fall outside the group of interest. Trees can also be written in Newick notation, a linear text format using parentheses and commas. Finally, here is a key point. Rotating branches around a node reorders the taxa on the page, but changes no relationships. The connections stay the same. Next, we will practice that idea: rotate, reread, and reinterpret.
 gnetum.eeb.uconn.eduen.wikipedia.orgdoi.org+21 min
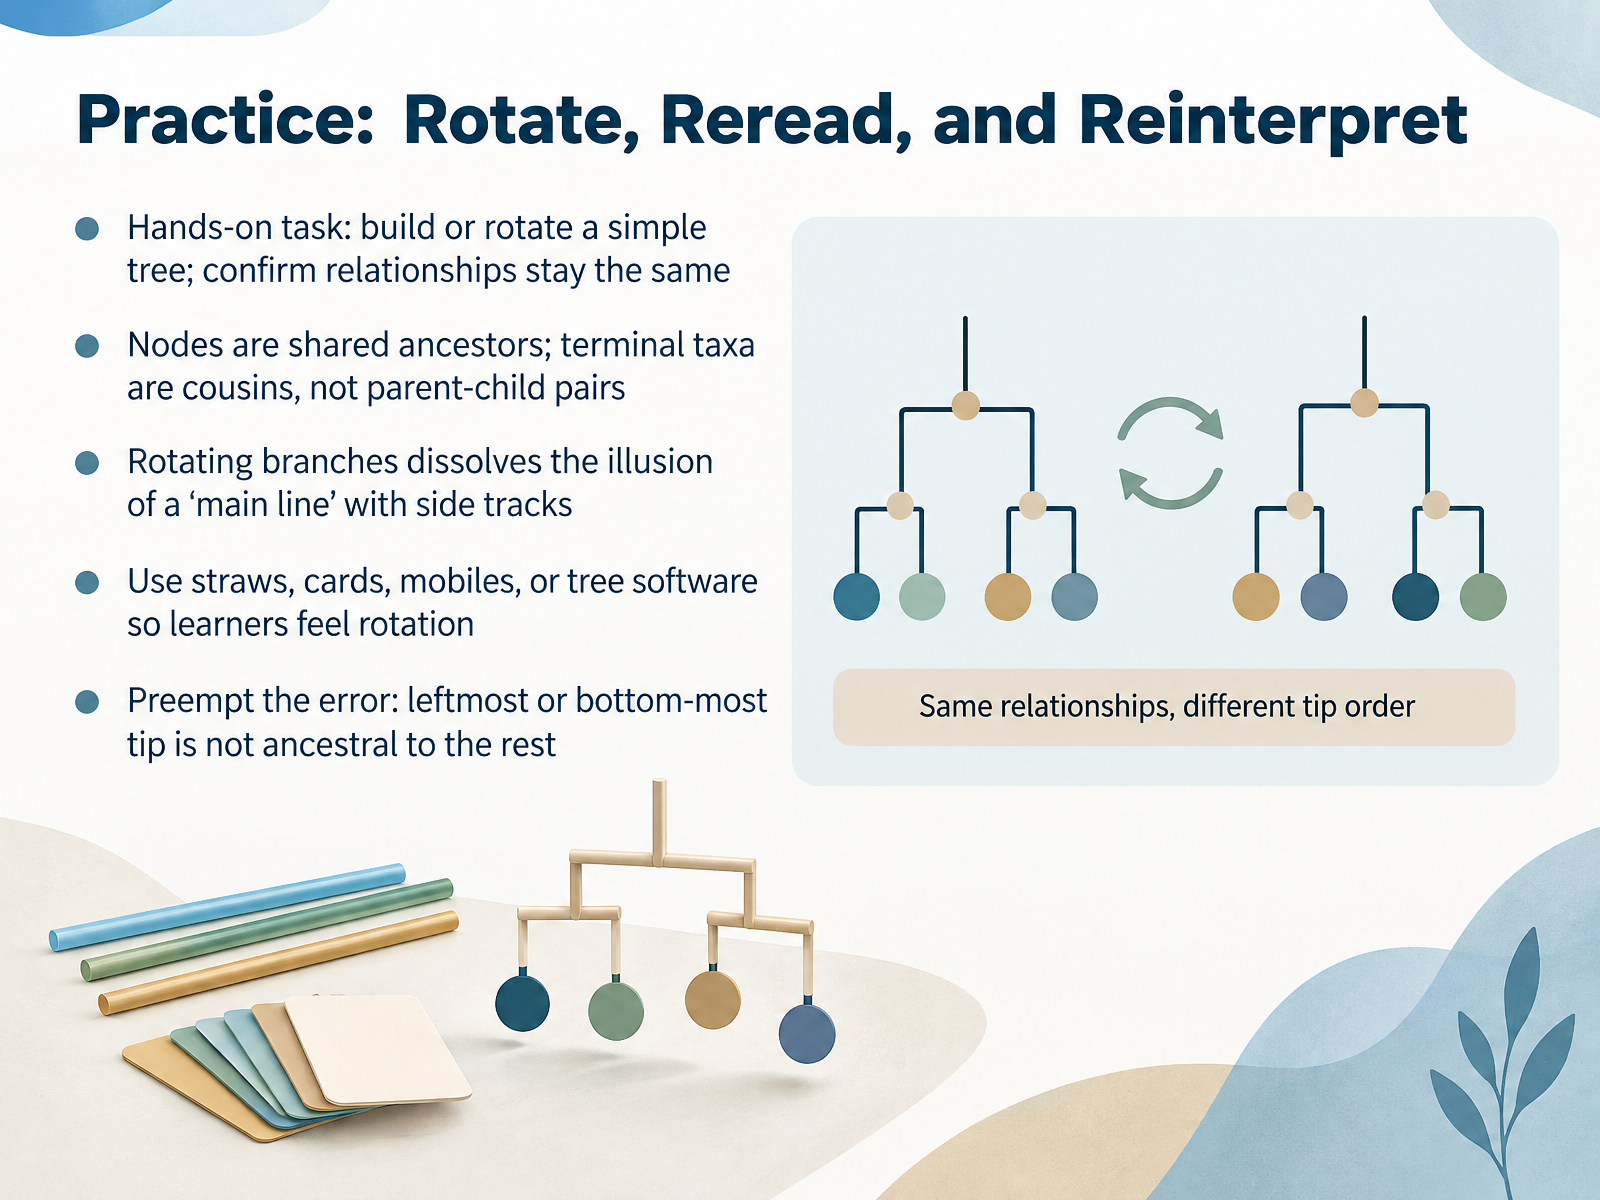
- 04Practice: Rotate, Reread, and ReinterpretNow let's practice with a hands-on task. Build a simple tree, or take a tree you already have, and rotate the branches around any node you like. A node is a shared ancestor, a branching point where two lineages split. Notice that when you rotate a branch, the order of the names at the tips changes, but the relationships do not. The terminal taxa, the species at the very tips, are cousins, not parents and children. Rotating branches dissolves the illusion of a main line with side tracks. You can use straws, cards, a hanging mobile, or tree software so you actually feel the rotation. Here's the error to preempt: the leftmost or bottom-most tip is not ancestral to the rest. It is just one cousin among many. Try it yourself and confirm the relationships stay the same. Next, we'll look at clades and common ancestors to determine relatedness.
 evolution.berkeley.edudoi.orgdoi.org+21 min
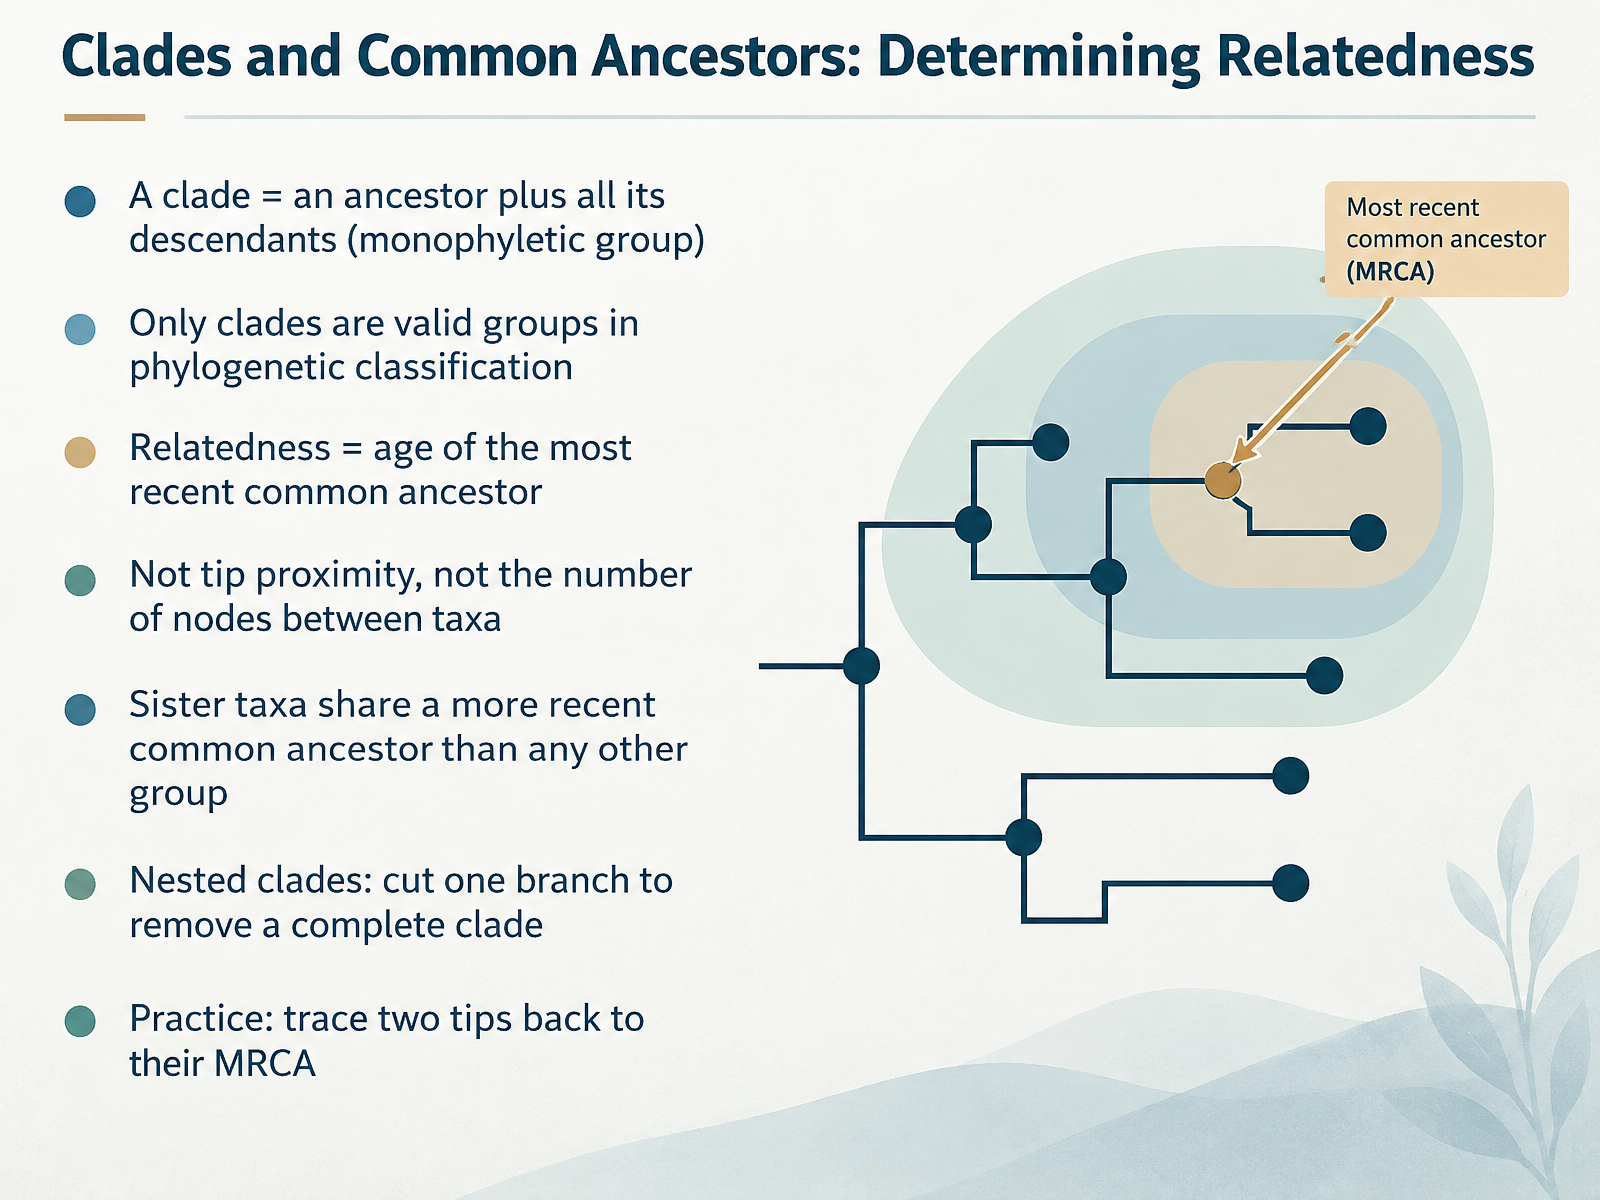
- 05Clades and Common Ancestors: Determining RelatednessNow let's focus on clades and common ancestors. A clade is one ancestor plus all of its descendants. That is called a monophyletic group, and only clades count as valid groups in phylogenetic classification. So how do we judge relatedness? By the age of the most recent common ancestor, or MRCA. Notice that tip proximity does not matter, and neither does the number of nodes between two taxa. Sister taxa share a more recent common ancestor with each other than with any other group. And clades are nested: cutting just one branch removes a complete clade. Here's a quick practice. Pick any two tips, trace each branch back toward the root, and stop where the two paths meet. That point is their most recent common ancestor. The closer that meeting point is to the tips, the more closely related those two taxa are. This is the single most useful tree-reading skill you can build. Next, we'll look at what trees do and do not tell us.
 gnetum.eeb.uconn.eduen.wikipedia.orgdoi.org+21 min
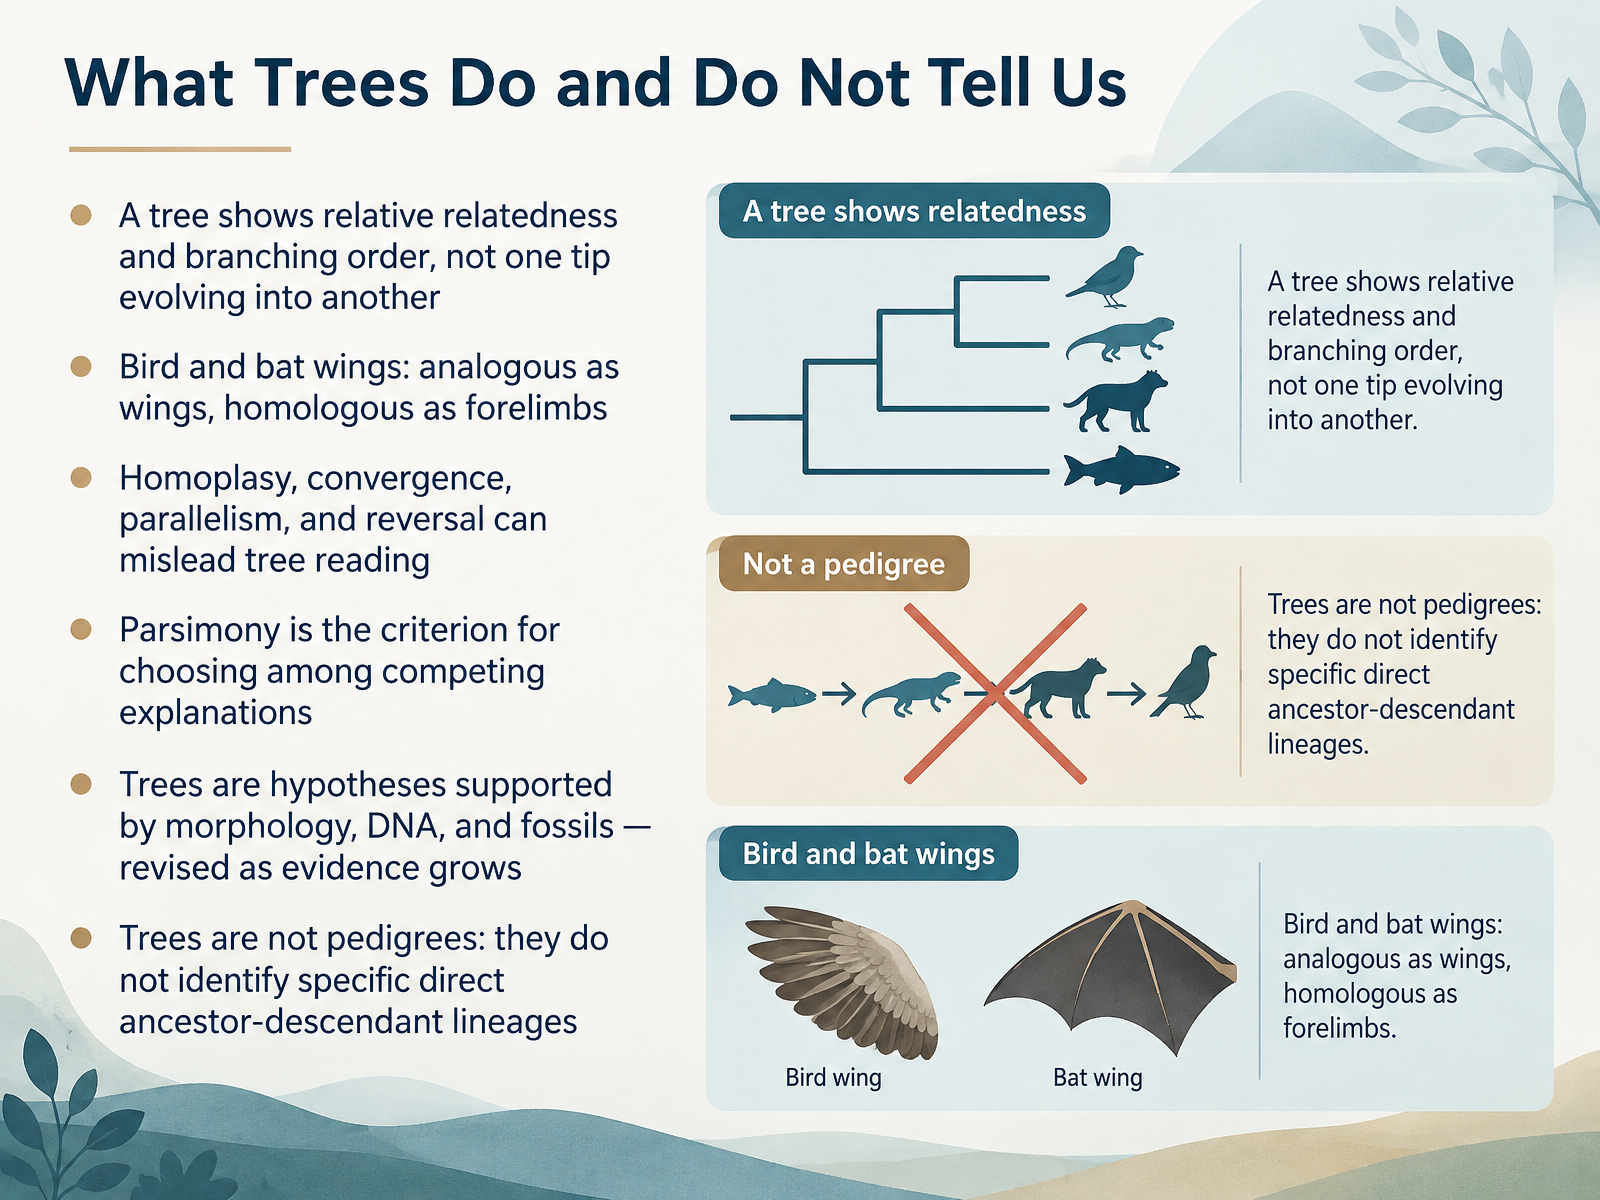
- 06What Trees Do and Do Not Tell UsNow let's clarify what a tree does and does not tell us. A tree shows relative relatedness and branching order. It does not show one tip evolving into another. Chimpanzees are not our ancestors. They are our evolutionary cousins. Notice that bird wings and bat wings look similar, but they evolved separately. As wings, they are analogous. As forelimbs, they are homologous, inherited from a shared ancestor. This means similarity alone can mislead us. Homoplasy, convergence, parallelism, and reversal can make unrelated lineages look alike. So how do scientists choose among competing explanations? They use parsimony, the criterion of preferring the explanation that requires fewer evolutionary changes. And remember, trees are hypotheses supported by morphology, DNA, and fossils, revised as evidence grows. Finally, trees are not pedigrees. They do not identify specific direct ancestor-descendant lineages. Next, we turn to Tree Shapes, Branch Lengths, and Time.
 evolution.berkeley.edudoi.orgdoi.org+22 min
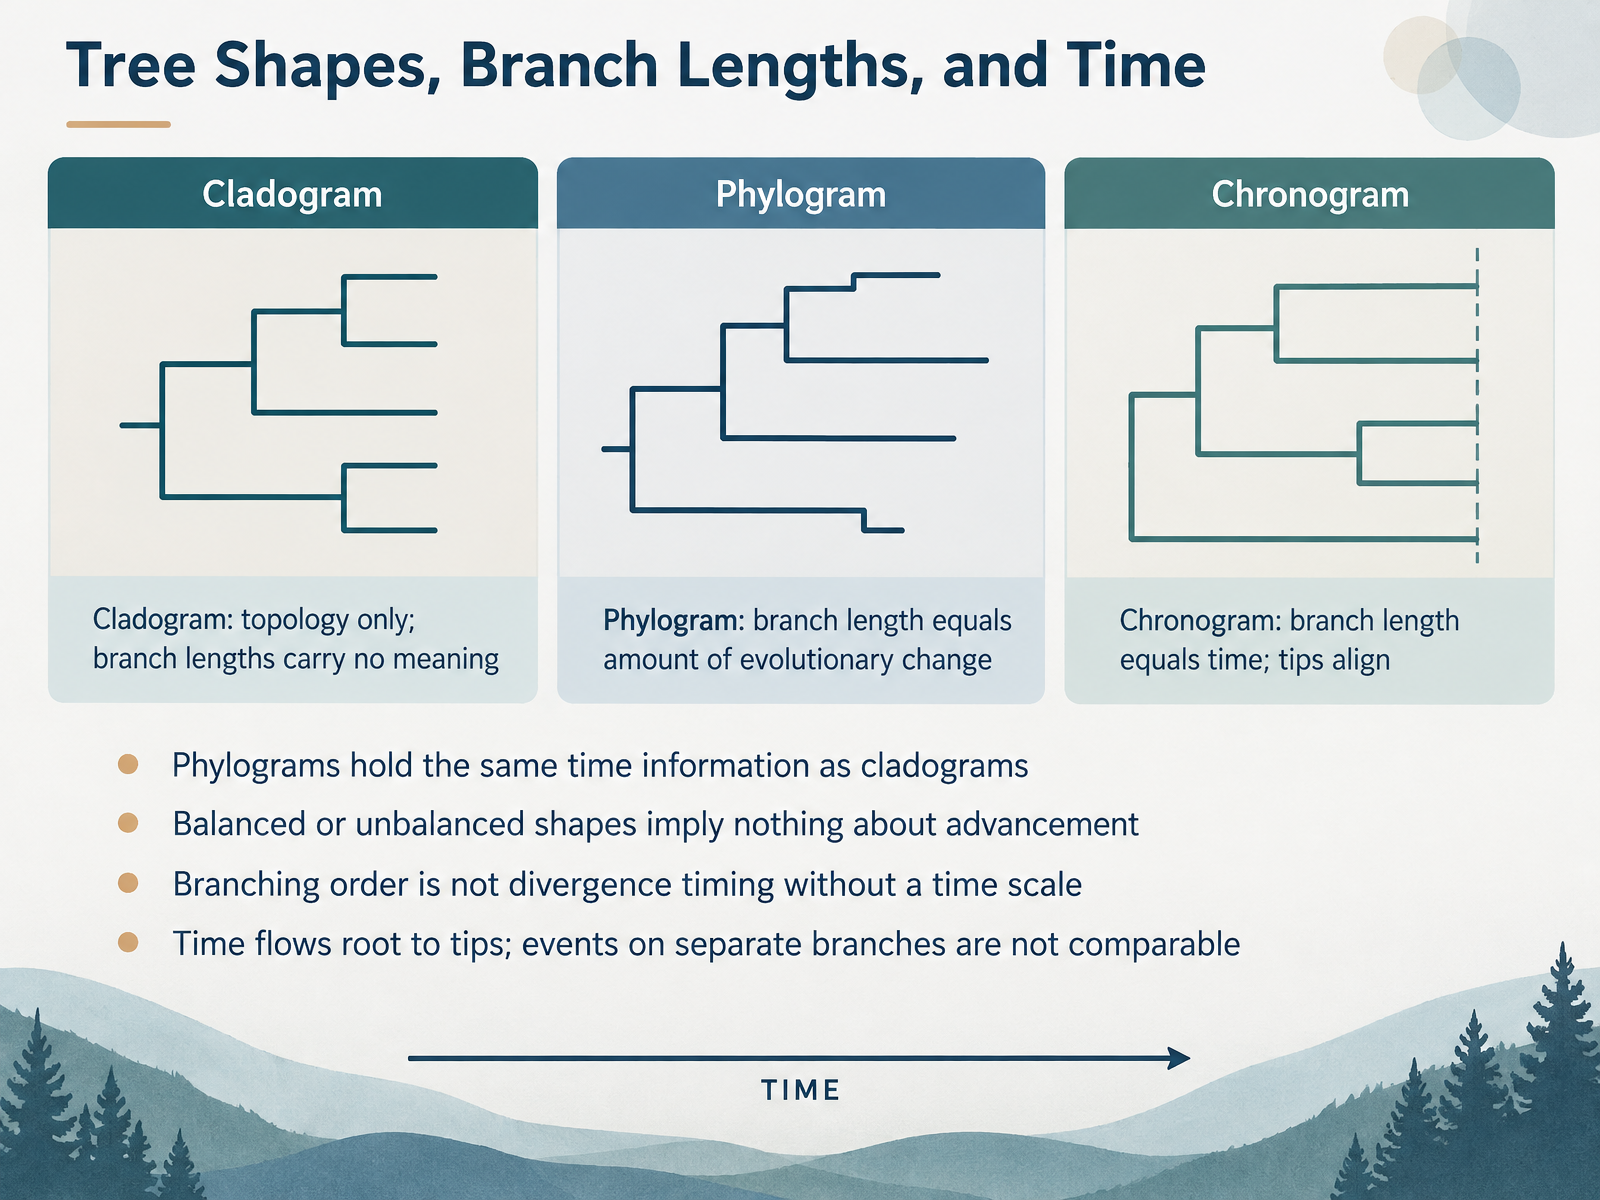
- 07Tree Shapes, Branch Lengths, and TimeNow let's look at tree shapes, branch lengths, and time. Not all evolutionary trees are drawn the same way, and branch length often means different things. A cladogram shows only the branching pattern, called its topology. Its branch lengths carry no meaning. A phylogram is different. There, branch length equals the amount of evolutionary change, such as the number of DNA substitutions. A chronogram goes one step further. Its branch lengths equal time, so all the tips line up at the present. Notice this important point. Phylograms actually hold the same time information as cladograms, because rates of evolution can vary. Here is another common confusion. A balanced or unbalanced tree shape tells you nothing about advancement. And the order of branching is not divergence timing unless there is a time scale. Remember, time flows from the root to the tips. That means events on separate branches cannot be compared directly. Next, we move from trees to taxonomy, and look at classification in practice.
 gnetum.eeb.uconn.eduen.wikipedia.orgdoi.org+22 min
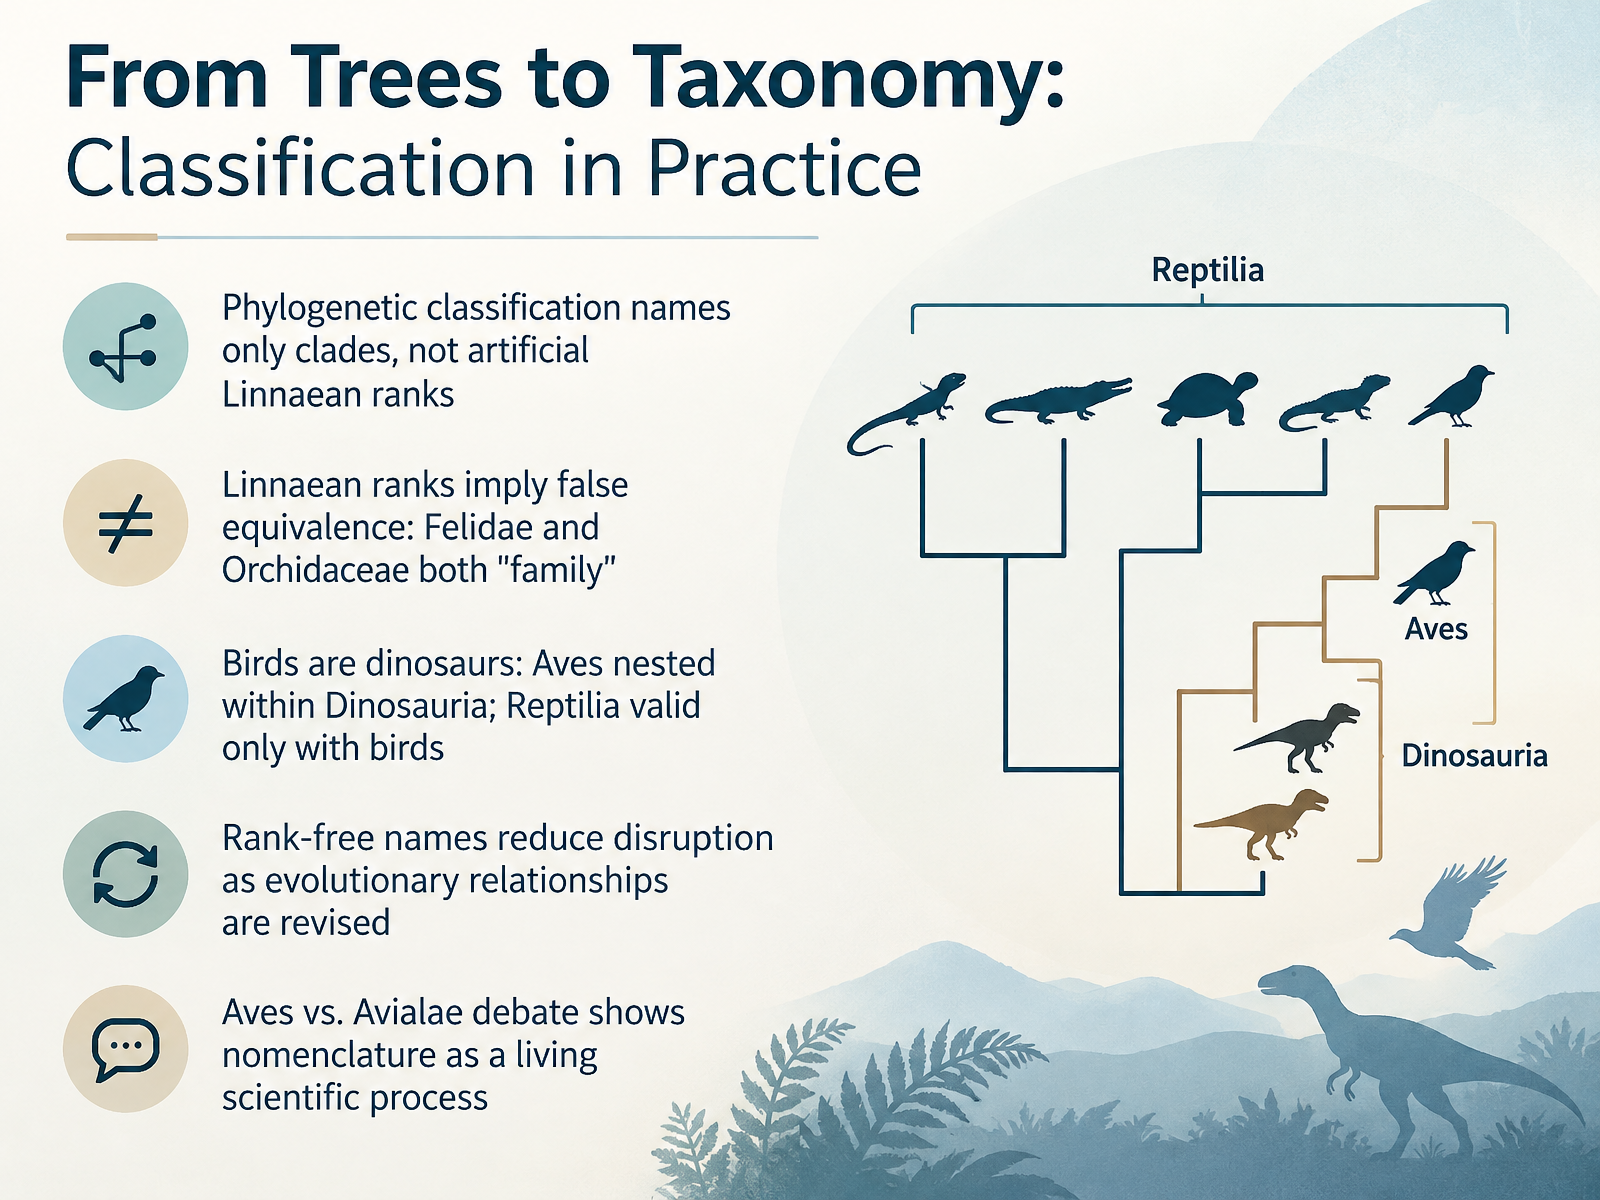
- 08From Trees to Taxonomy: Classification in PracticeLet's see how trees translate into actual names. Traditional Linnaean classification sorts life into ranks like kingdom, class, order, and family. Phylogenetic classification, by contrast, names only clades. A clade is a common ancestor plus all of its descendants. Here's the problem with ranks. Felidae, the cats, and Orchidaceae, the orchids, are both called a family. But those two groups are not comparable at all. The rank suggests an equivalence that does not exist. Now consider birds. Notice that Aves, the birds, sits nested inside Dinosauria. This means birds are dinosaurs. So Reptilia is only valid if you include birds within it; otherwise, reptiles are not a complete clade. Rank-free names help here, because when relationships are revised, the names disrupt less. And the debate over Aves versus Avialae shows that nomenclature is a living scientific process, not a fixed list. Next, we look at how trees are built from evidence and methods.
 evolution.berkeley.eduevolution.berkeley.edutandfonline.com+22 min
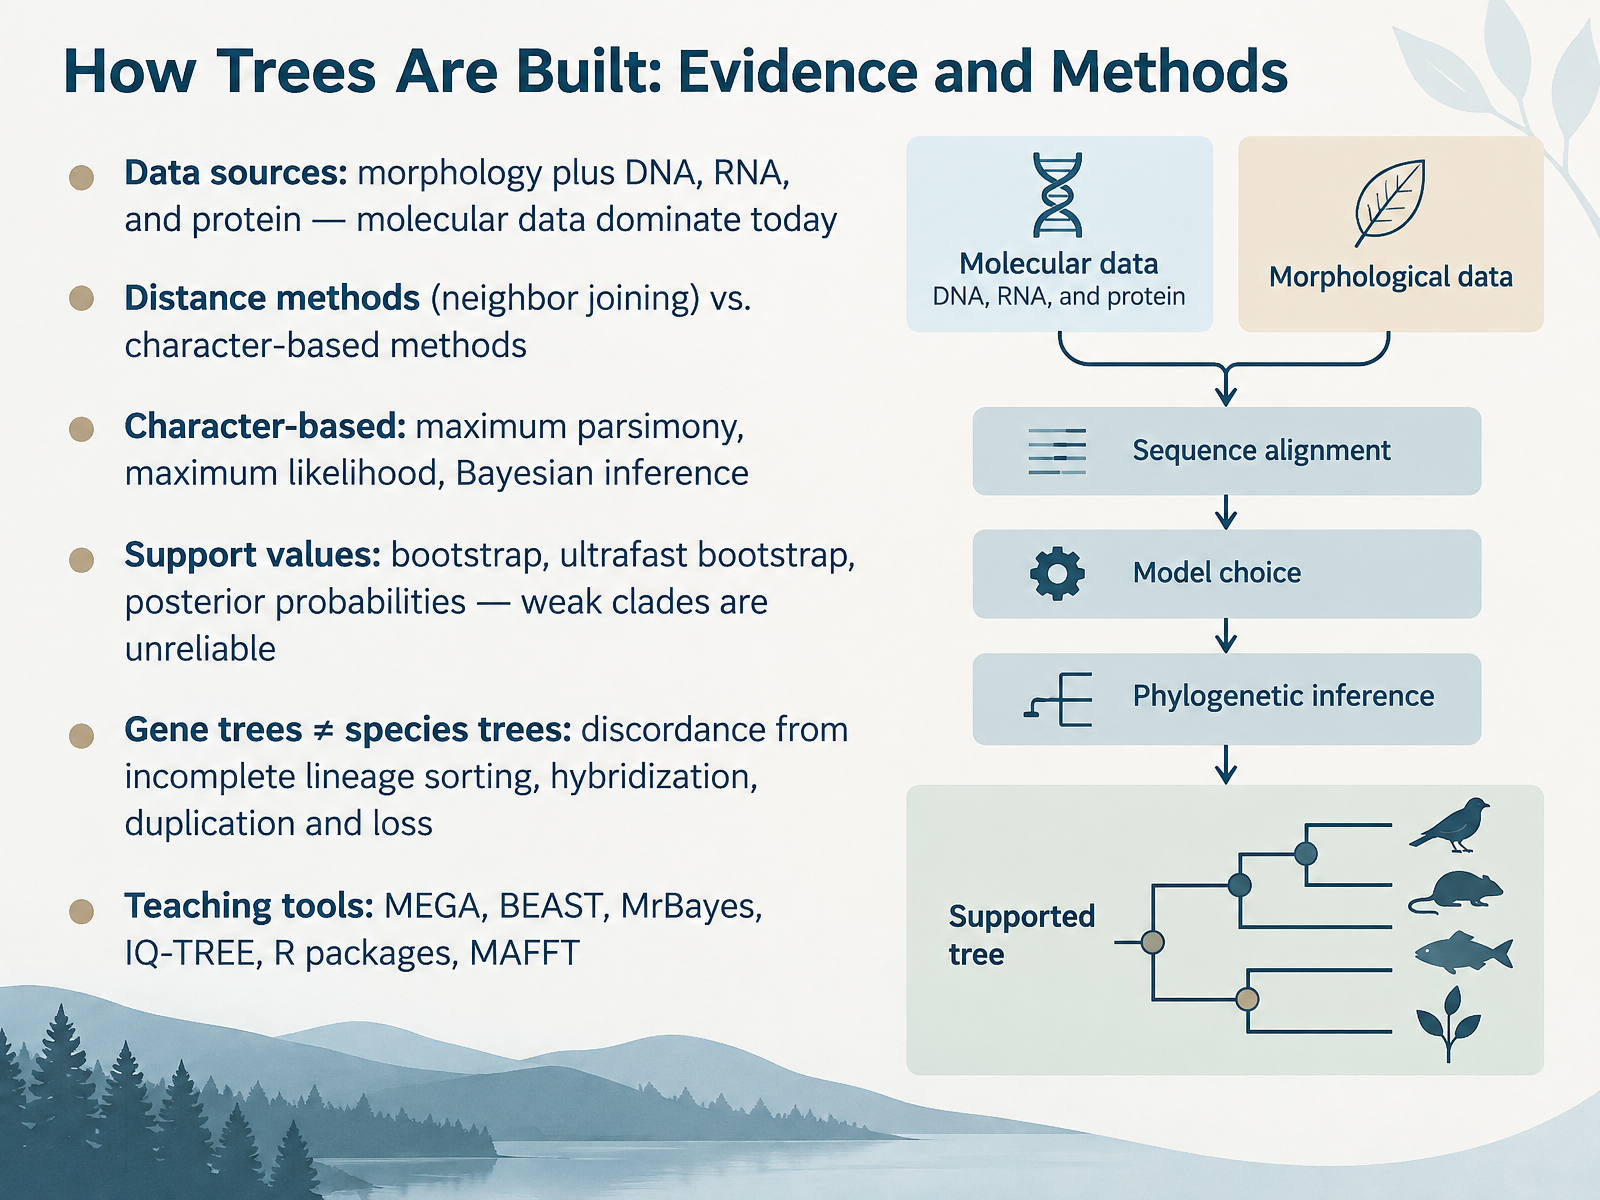
- 09How Trees Are Built: Evidence and MethodsLet's look at how these trees are actually built. Two data sources feed the process: morphology, meaning physical traits, plus molecular data from DNA, RNA, and proteins. Today, molecular data dominate. Methods split into two camps. Distance methods, like neighbor joining, turn data into a distance matrix and cluster from there. Character-based methods compare traits directly. Maximum parsimony picks the tree with the fewest changes. Maximum likelihood uses a model of sequence evolution. Bayesian inference combines prior knowledge with the data to produce posterior probabilities. Now, notice those numbers on the branches. They are support values. Bootstrap, ultrafast bootstrap, and posterior probabilities tell you how confident the analysis is. Here is the key warning: weak clades are unreliable. If support is low, treat that branch as uncertain. One more caution. A gene tree is not always the same as a species tree. Discordance can come from incomplete lineage sorting, hybridization, or gene duplication and loss. That is normal, not a mistake. Finally, common teaching and research tools include MEGA, BEAST, MrBayes, IQ-TREE, R packages, and MAFFT for alignment. Next, we will explore classroom strategies for teaching tree reading.
 nature.comdoi.orgpmc.ncbi.nlm.nih.gov+22 min
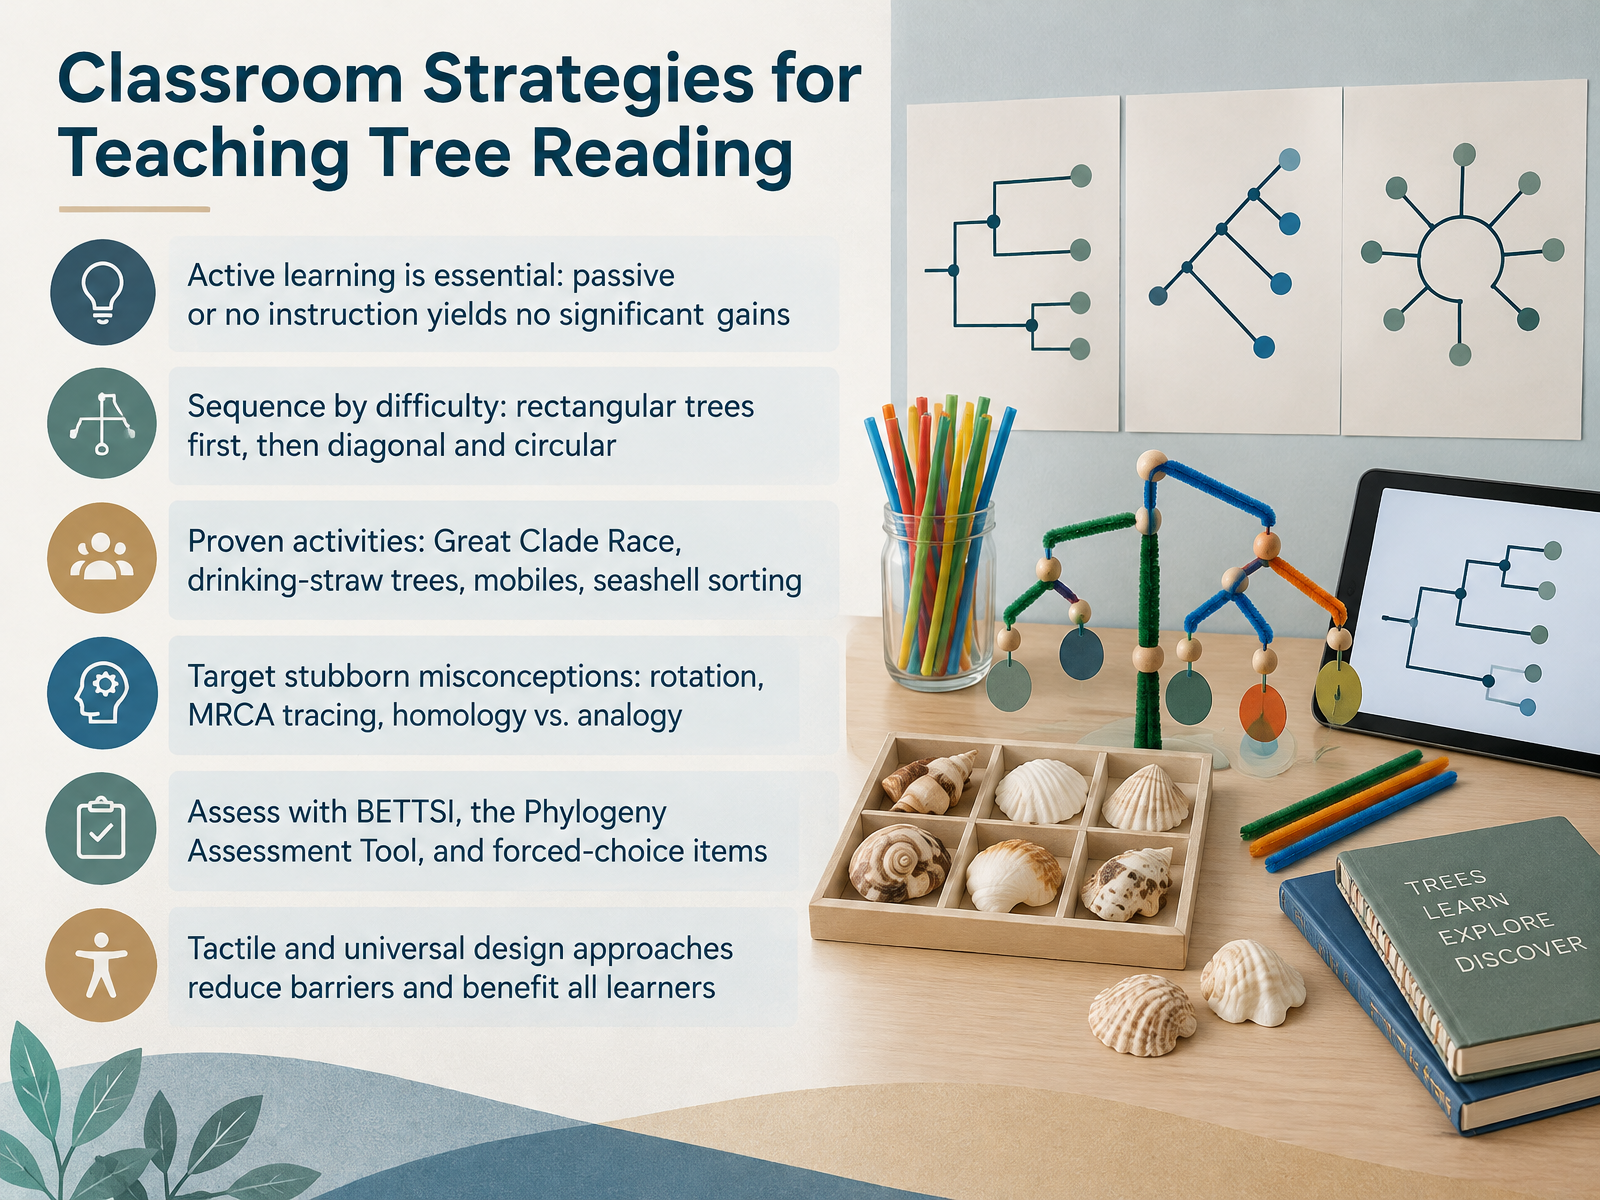
- 10Classroom Strategies for Teaching Tree ReadingNow let's bring all of this into the classroom. The single most important finding is that active learning is essential. Passive exposure to trees, or no instruction at all, produces no significant gains. Students must actively engage. So how do you sequence the material? Start with rectangular trees, which are easiest to read. Introduce diagonal and circular formats later, once the basics are solid. Several proven activities work well. The Great Clade Race uses a simple puzzle to build cladistic thinking. Students can build trees from drinking straws, which makes node rotation tangible. Mobiles and seashell sorting also help. Target the stubborn misconceptions directly, especially rotation, tracing the most recent common ancestor, and distinguishing homology from analogy. For assessment, consider the Basic Evolutionary Tree-Thinking Skills Inventory, or BETTSI, the Phylogeny Assessment Tool, or forced-choice items with distracters built from common incorrect strategies. Finally, tactile and universal design approaches remove barriers and benefit all learners. The key takeaway is simple. Be explicit, be active, and sequence by difficulty. Next, we move to real-world applications, starting with disease tracking and public health.
 evolution.berkeley.edudoi.orgdoi.org+22 min
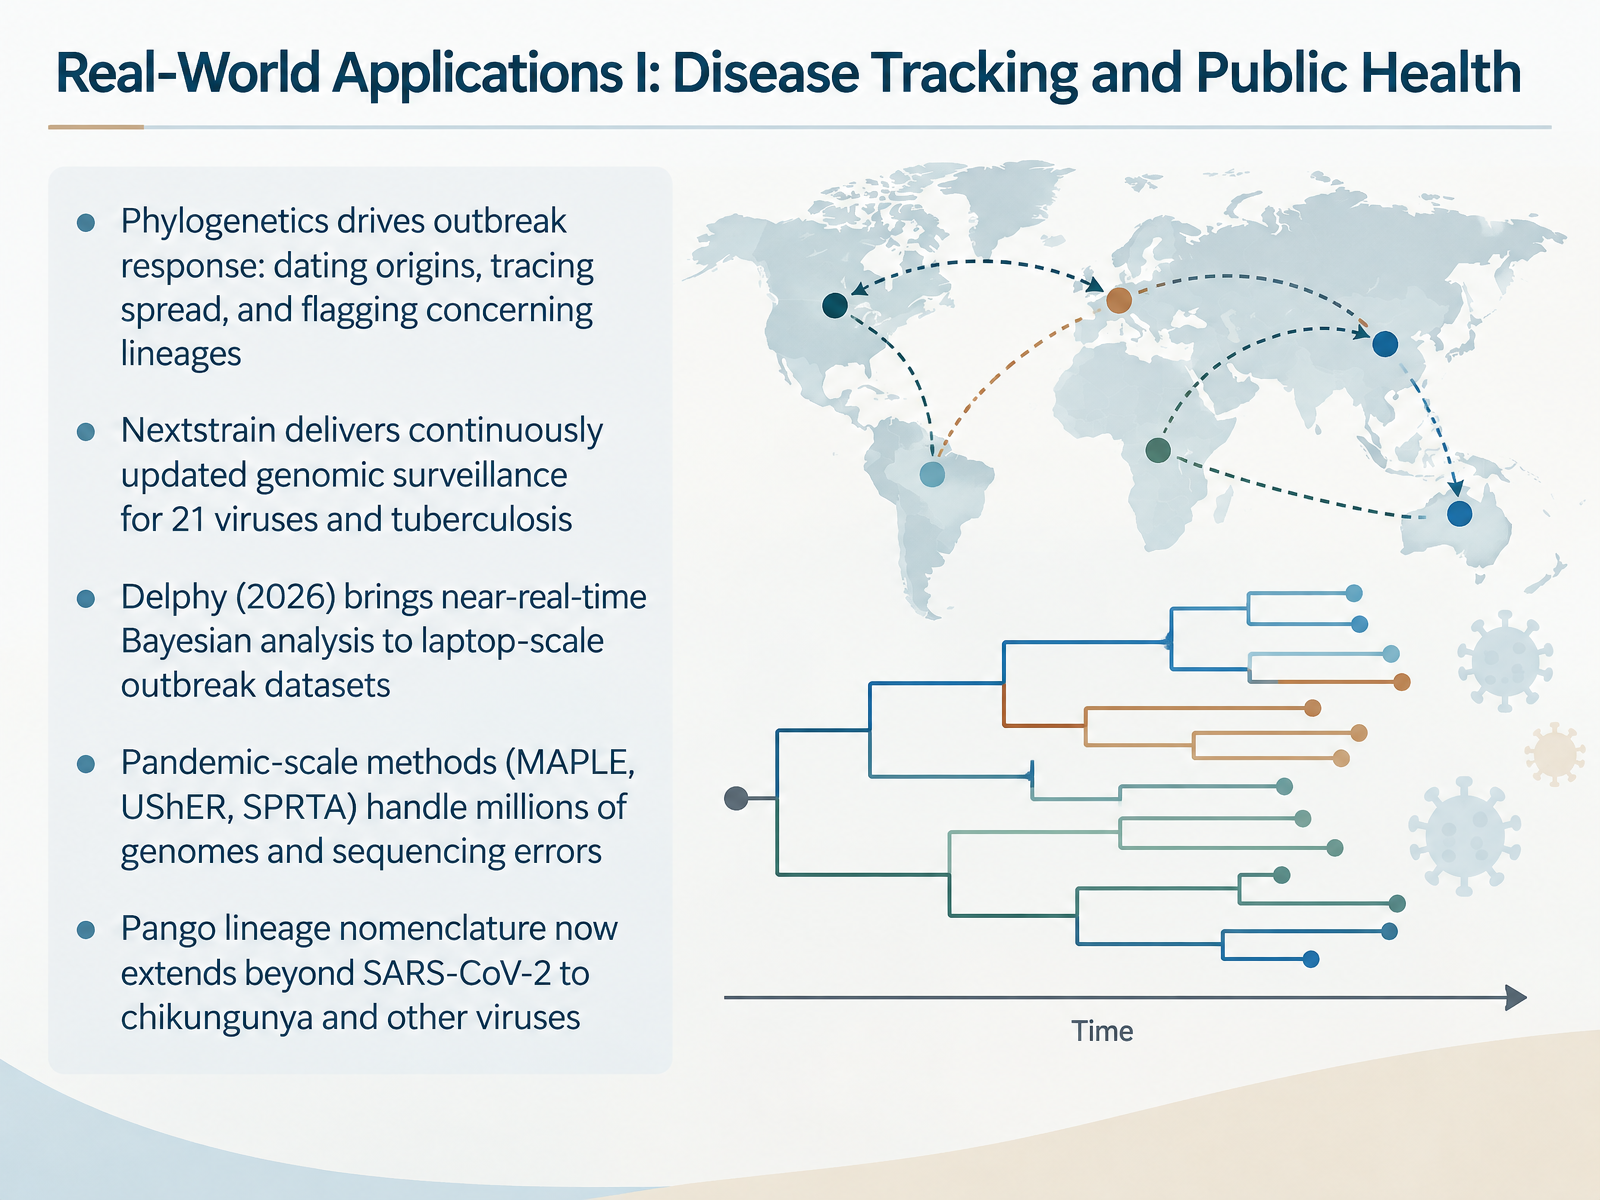
- 11Real-World Applications I: Disease Tracking and Public HealthNow let's see phylogenetics at work in disease tracking and public health. During an outbreak, researchers sequence pathogen genomes, then build trees to date when an outbreak began, trace how it spread, and flag worrying new lineages. For example, real-time pipelines such as Nextstrain deliver continually updated genomic surveillance for twenty-one viruses and tuberculosis, often refreshing daily from open data. Newer tools lower the barrier further. Delphy, released in twenty twenty-six, brings near-real-time Bayesian analysis to a laptop, analysing a hundred thousand sequences in under a day. Pandemic-scale methods like MAPLE, UShER, and SPRTA handle millions of genomes and correct for recurrent sequencing errors. And the Pango lineage naming system, first built for SARS-CoV-2, now extends to chikungunya and other viruses. Notice how each advance moves trees from the lab into frontline decisions. Next, we turn to Real-World Applications Two: Conservation, Biotechnology, and the Evolving Tree of Life.
 nature.comdoi.orgpmc.ncbi.nlm.nih.gov+22 min
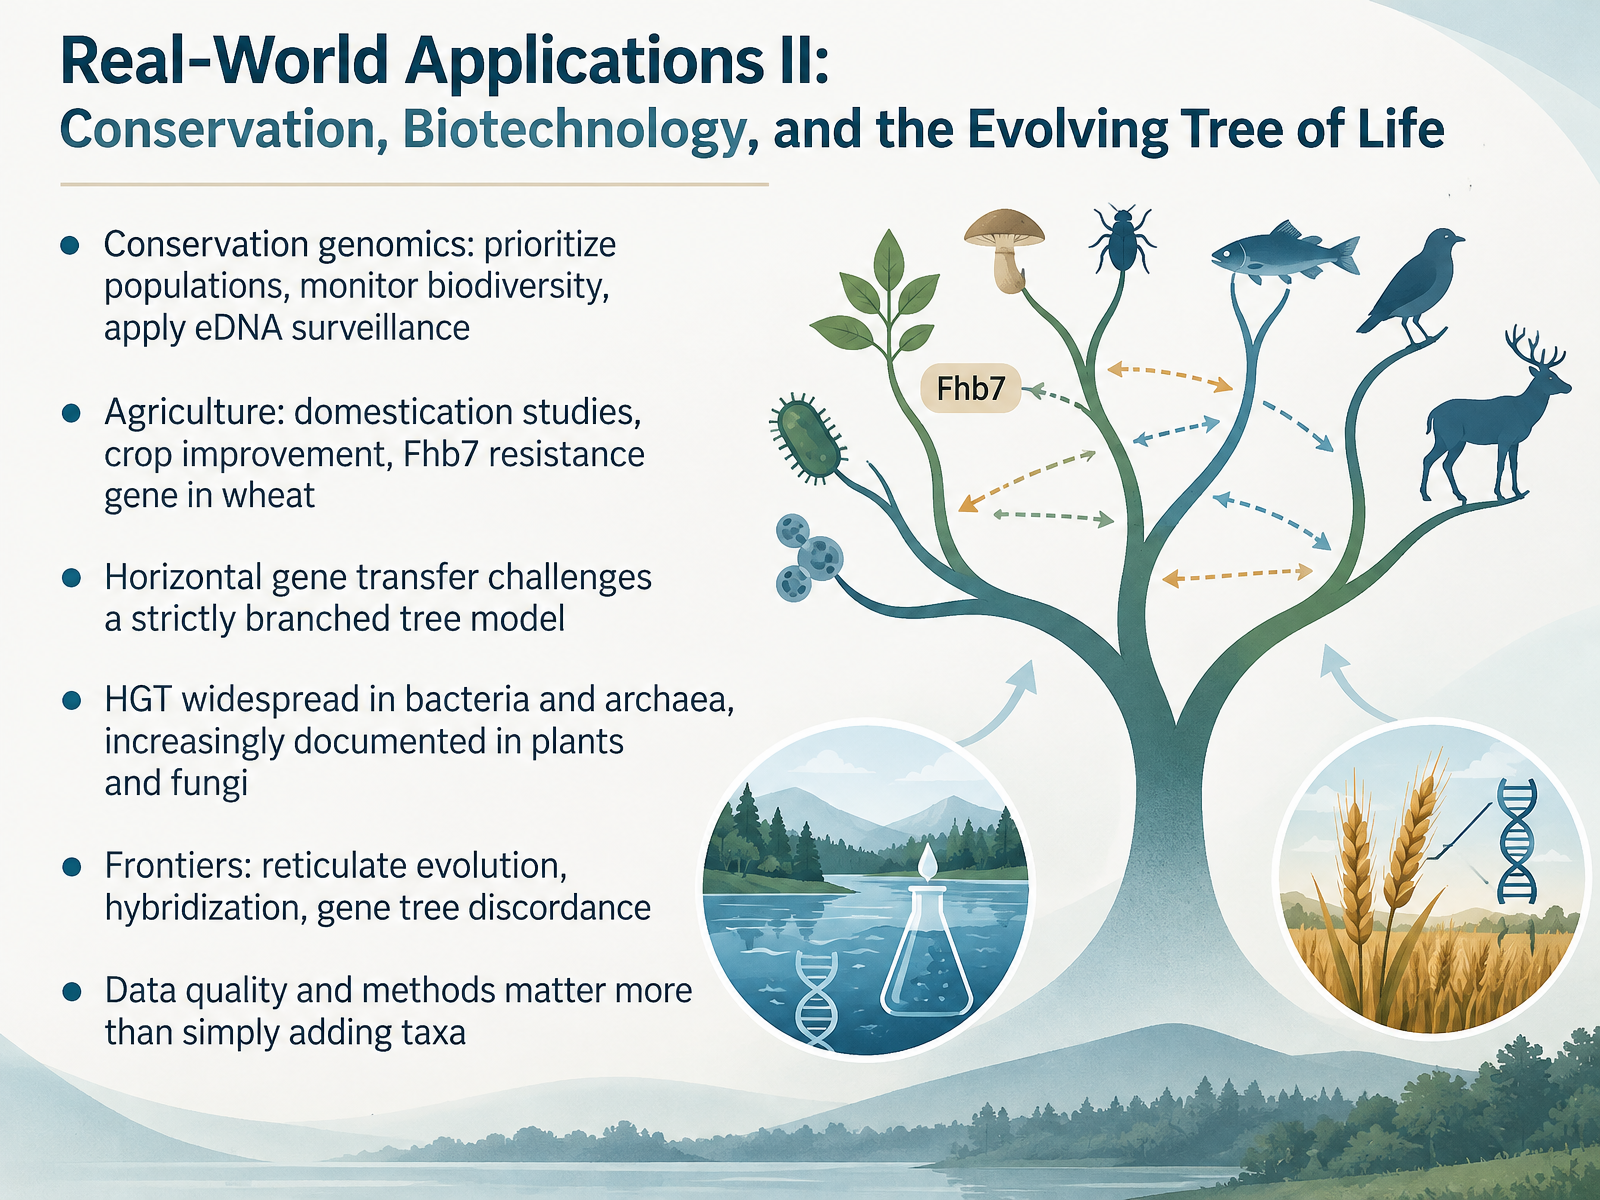
- 12Real-World Applications II: Conservation, Biotechnology, and the Evolving Tree of LifeNow let's see how these trees solve real-world problems. In conservation genomics, evolutionary trees help scientists decide which populations to protect first, monitor biodiversity, and even track species through environmental DNA, or eDNA, the genetic traces left in water or soil. In agriculture, tree-building reveals how crops were domesticated. A powerful example: the Fhb7 gene, which gives wheat resistance to a fungal disease, arrived not by normal inheritance, but through horizontal gene transfer. Horizontal gene transfer, or HGT, means genes move between unrelated organisms. That challenges a strictly branching tree model, and it's widespread in bacteria and archaea, with growing evidence in plants and fungi. Notice the frontier here: reticulate evolution, hybridization, and gene tree discordance, where different genes tell different stories. This means data quality and careful methods often matter more than simply adding more species. So the takeaway is this: trees are working tools, and knowing their limits makes your conclusions stronger. Next, let's practice reading and explaining novel trees in the Practice Studio.
 evolution.berkeley.eduevolution.berkeley.edutandfonline.com+22 min
- 13Practice Studio: Reading Novel Trees and Explaining RelatednessNow let's put your skills into practice with some guided studio work on an unfamiliar tree. First, label the root, the nodes, the branches, and the tips. The root is the oldest point, where the whole tree begins. Nodes are the branching points, and tips are the taxa at the ends. Next, circle two nested monophyletic groups. Remember, a monophyletic group contains an ancestor and all of its descendants. For each group, state one synapomorphy, a shared derived trait that defines that clade. Then, find the most recent common ancestor of two taxa and justify your answer in words. Think of it as tracing back from each tip until their branches meet. Now compare two different drawings of the same tree. Notice that rotated branches or different spacing do not change the relationships. The branching order is what matters. After that, practice character mapping. Mark where a trait arose or was lost, and explain the most parsimonious reconstruction, the one requiring the fewest evolutionary changes. Finally, use peer critique to strengthen your explanations and surface any leftover misconceptions. Remember, getting confused is normal, and practice is how you improve. Coming up next, we will wrap up with key takeaways and resources for continued practice.
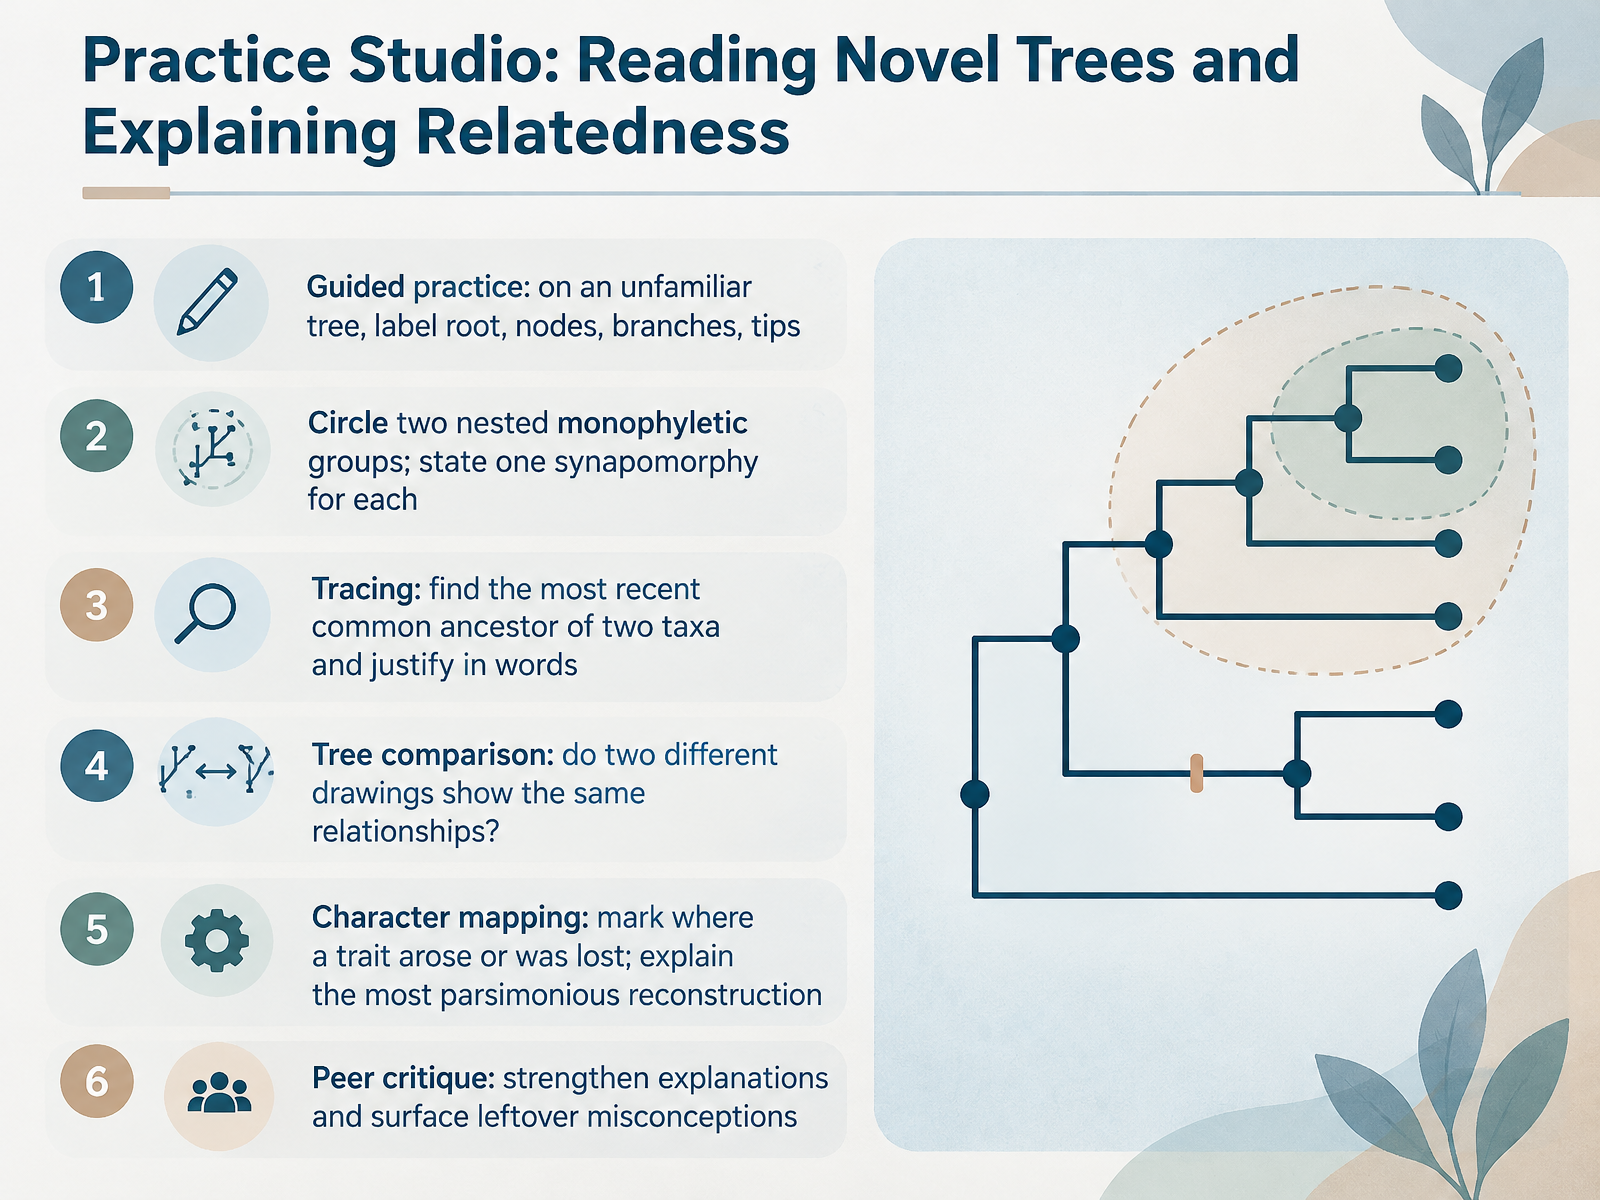 doi.org2 min
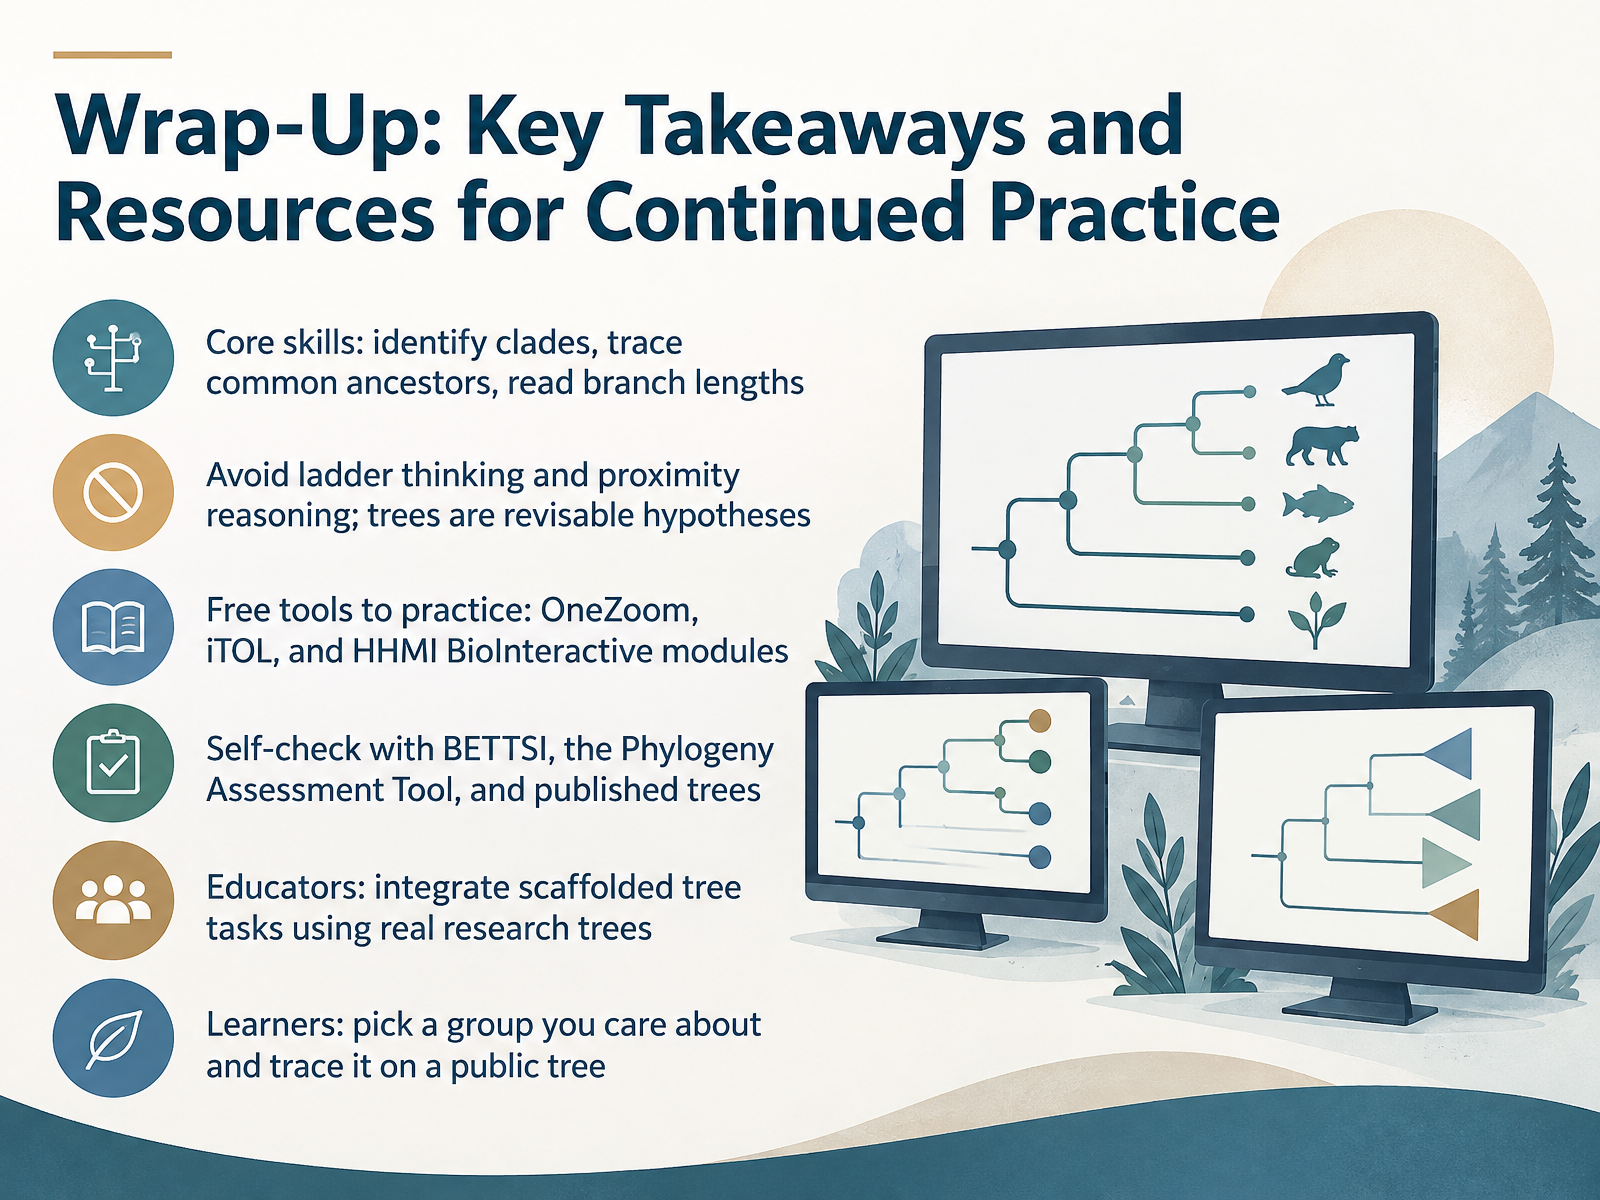
- 14Wrap-Up: Key Takeaways and Resources for Continued PracticeLet's bring everything together. You have built three core skills: identifying clades, tracing common ancestors, and reading branch lengths. And you have learned to avoid two common traps: ladder thinking, which treats one species as higher than another, and proximity reasoning, which assumes nearby tips are close relatives. Remember, every tree is a revisable hypothesis.
To keep practicing, try free tools like OneZoom, the Interactive Tree of Life, and HHMI BioInteractive modules. Check your understanding with the BETTSI assessment, the Phylogeny Assessment Tool, and published trees. Educators, integrate scaffolded tree tasks using real research trees. Learners, pick a group you care about, maybe birds or ferns, and trace it on a public tree.
Thank you for working through this course. Keep exploring, keep questioning, and enjoy seeing life's story unfold.
 1 min
Take the deck with you
Download this course as a file — free, no sign-up needed.
- PDF handoutEvery slide page, ready to print or share.15 pages · 3.8 MBDownload
- Narrated PowerPointThe deck that presents itself — every slide carries the digital human's narration video.15 pages · 15.4 MBDownload
- PowerPoint slidesThe full deck as a .pptx — open it in PowerPoint, Keynote, or Google Slides.15 pages · 3.8 MBDownload
Free to use in your own training — please keep the PersonWise credit page at the end.
Have your own deck? Turn it into a course
Sources consulted
Web sources consulted while building this course.
- Phylogenetics (EEB 5349) Spring 2026 — gnetum.eeb.uconn.edu
- Phylogenetic tree — en.wikipedia.org
- Phylogenetic Inference — doi.org
- 1. Phylogenetic trees — isu-molphyl.github.io
- Tree Terminology — www2.stat.duke.edu
- Tree misinterpretations — evolution.berkeley.edu
- A Comparison of Measured Outcomes across Tree-Thinking Interventions — doi.org
- Building Phylogenetic Trees with Drinking Straws — doi.org
- Teleological pitfalls in reading evolutionary trees and ways to avoid them | Evolution: Education and Outreach | Springer Nature Link — link.springer.com
- Lineage Thinking in Evolutionary Biology: How to Improve the Teaching of Tree Thinking | Science & Education | Springer Nature Link — link.springer.com
- Using trees for classification — evolution.berkeley.edu
- #post_title #separator_sa #site_title — evolution.berkeley.edu
- Full article: A bird’s eye view of the fossil record: perspectives on avian systematics — tandfonline.com
- Reading Trees — doi.org
- The evolution of ornithischian nomenclature — doi.org
- Phylogeny estimation: traditional and Bayesian approaches — nature.com
- Measures of Branch Support in Phylogenetics — doi.org
- Performance of tree-building methods using a morphological dataset and a well-supported Hexapoda phylogeny — pmc.ncbi.nlm.nih.gov
- Common Methods for Phylogenetic Tree Construction and Their Implementation in R — pmc.ncbi.nlm.nih.gov
- Common Methods for Phylogenetic Tree Construction and ... — mdpi.com