Begin
15 pages · ~30 min
Rice Method Product Management
Introduces product managers to the Rice Method for prioritizing features using reach, impact, confidence, and effort. Ideal for teams seeking data-driven prioritization.
A digital instructor presents all 15 pages. Hold “Ask” at any point and ask out loud — the answer comes from this course. No sign-up needed.
What you’ll learn
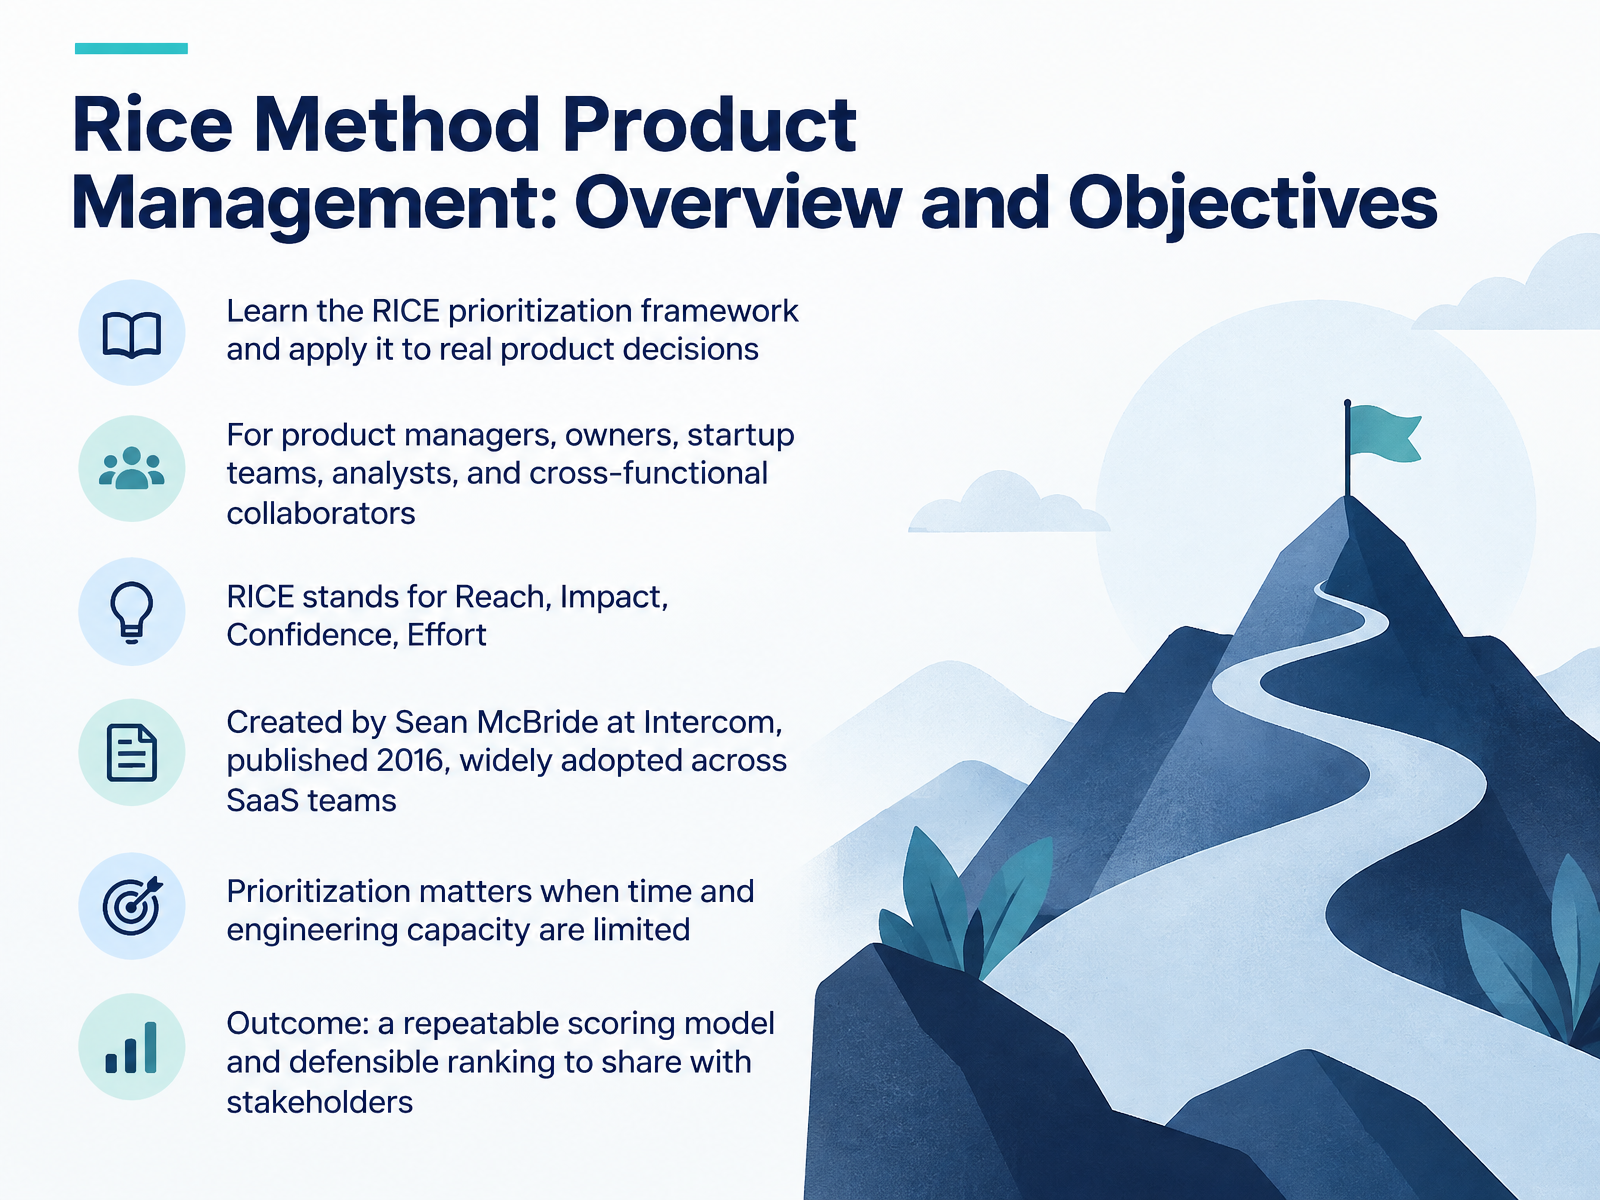
- 01Rice Method Product Management: Overview and ObjectivesWelcome. Over the next fifteen slides, we are going to work through RICE, a prioritization framework you can use to make product decisions you can actually defend. This first session is an overview, so let us set the goal. By the end, you will be able to score competing ideas using four factors: Reach, Impact, Confidence, and Effort. RICE was created by Sean McBride at Intercom and published in twenty sixteen, and it is now widely used across SaaS teams. The audience here is product managers, product owners, startup teams, analysts, and cross-functional partners. That matters, because prioritization is a shared problem. When time and engineering capacity are limited, you cannot build everything, so you need a repeatable way to compare options and explain the trade-offs to stakeholders. Here is the outcome I want for you: a scoring model you can run on your own backlog, and a ranked list you can bring into your next planning meeting. Let us start with why this is hard in the first place.unifiedproductgraph.orgproductpeople.coproductschool.com+22 min
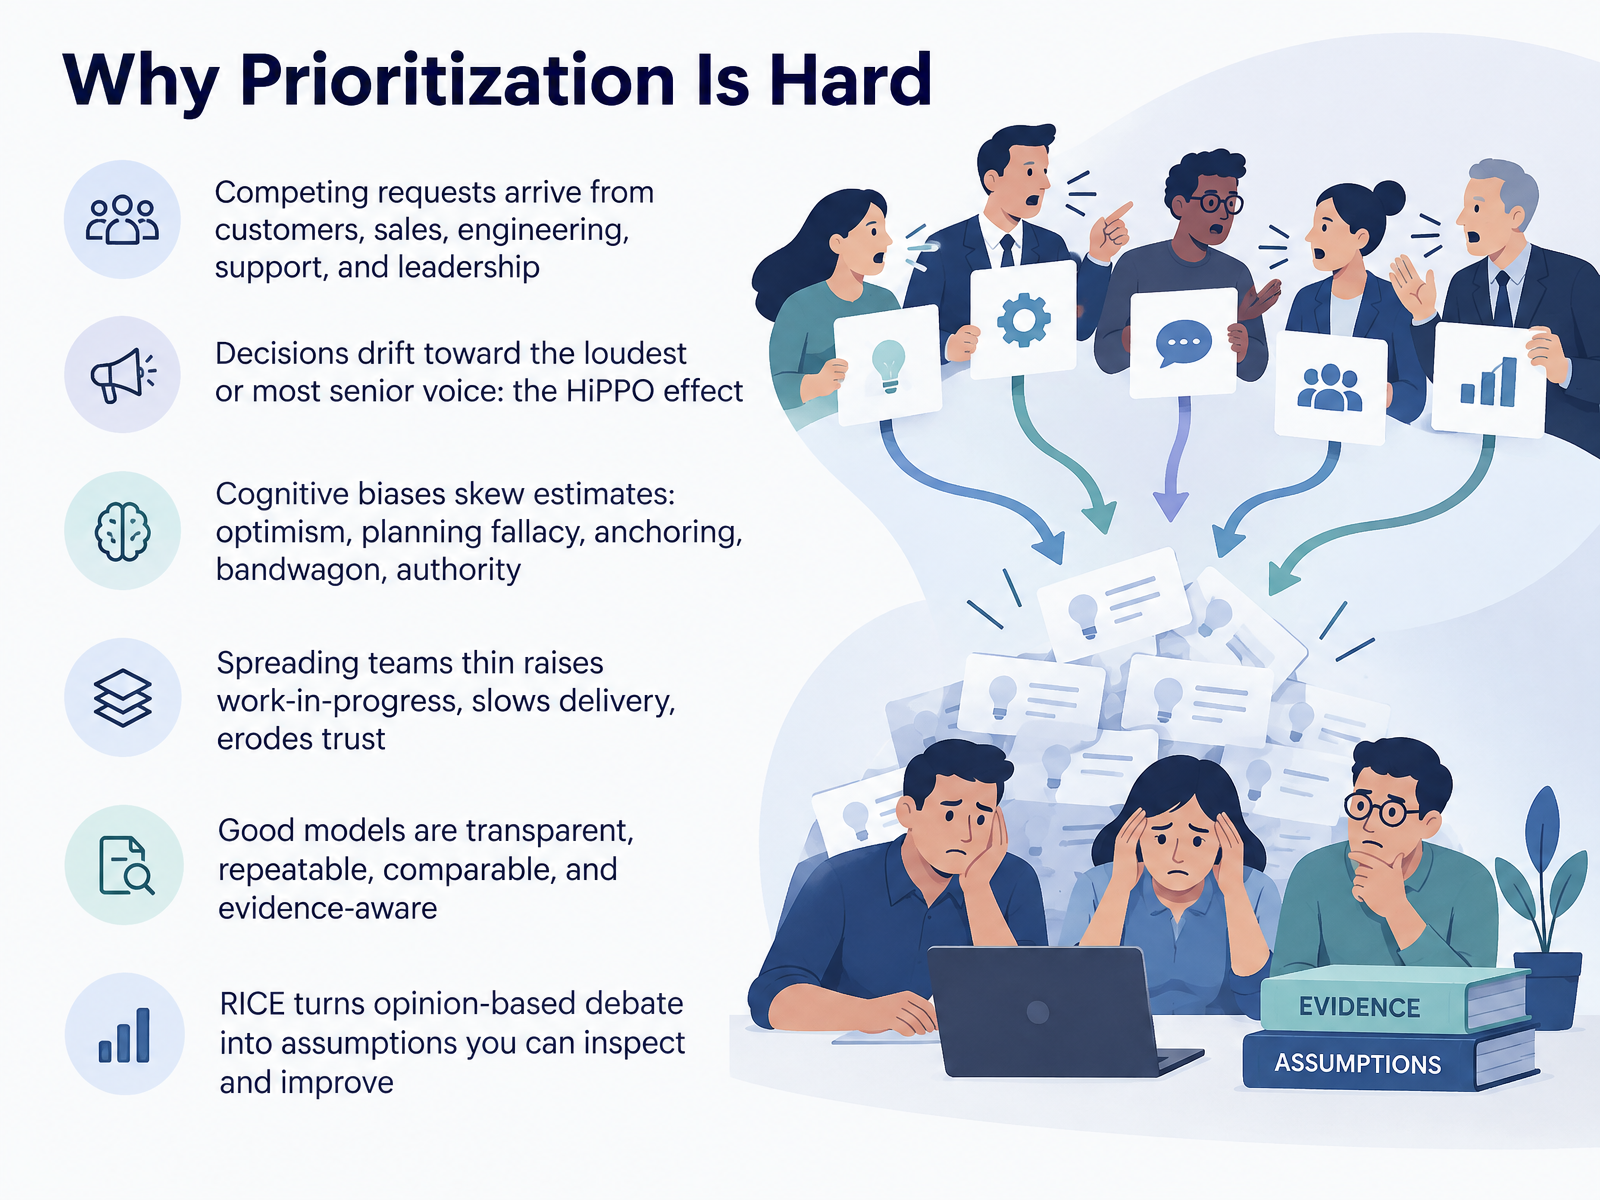
- 02Why Prioritization Is HardSo let's talk about why prioritization is genuinely hard, not just busy. Requests arrive from everywhere at once: customers, sales, engineering, support, leadership. Each one sounds urgent, and from that person's view, it probably is. Without a shared method, decisions drift toward the loudest or most senior voice. That's the HiPPO effect, and you've seen it. Biases make it worse. Optimism inflates estimates, the planning fallacy shortens timelines, anchoring ties you to the first number you hear, and bandwagon and authority pressure reward agreement over evidence. The cost is real. Spread teams thin and work in progress climbs, delivery slows, and trust erodes. So what makes a model good? It should be transparent, repeatable, comparable, and evidence-aware. That is what RICE gives you. It turns opinion-based debate into assumptions you can inspect, challenge, and improve. Next, let's look at RICE core concepts and the formula.
 jamesbradleyuxr.comconsole.todayshraddha2789.github.io+22 min
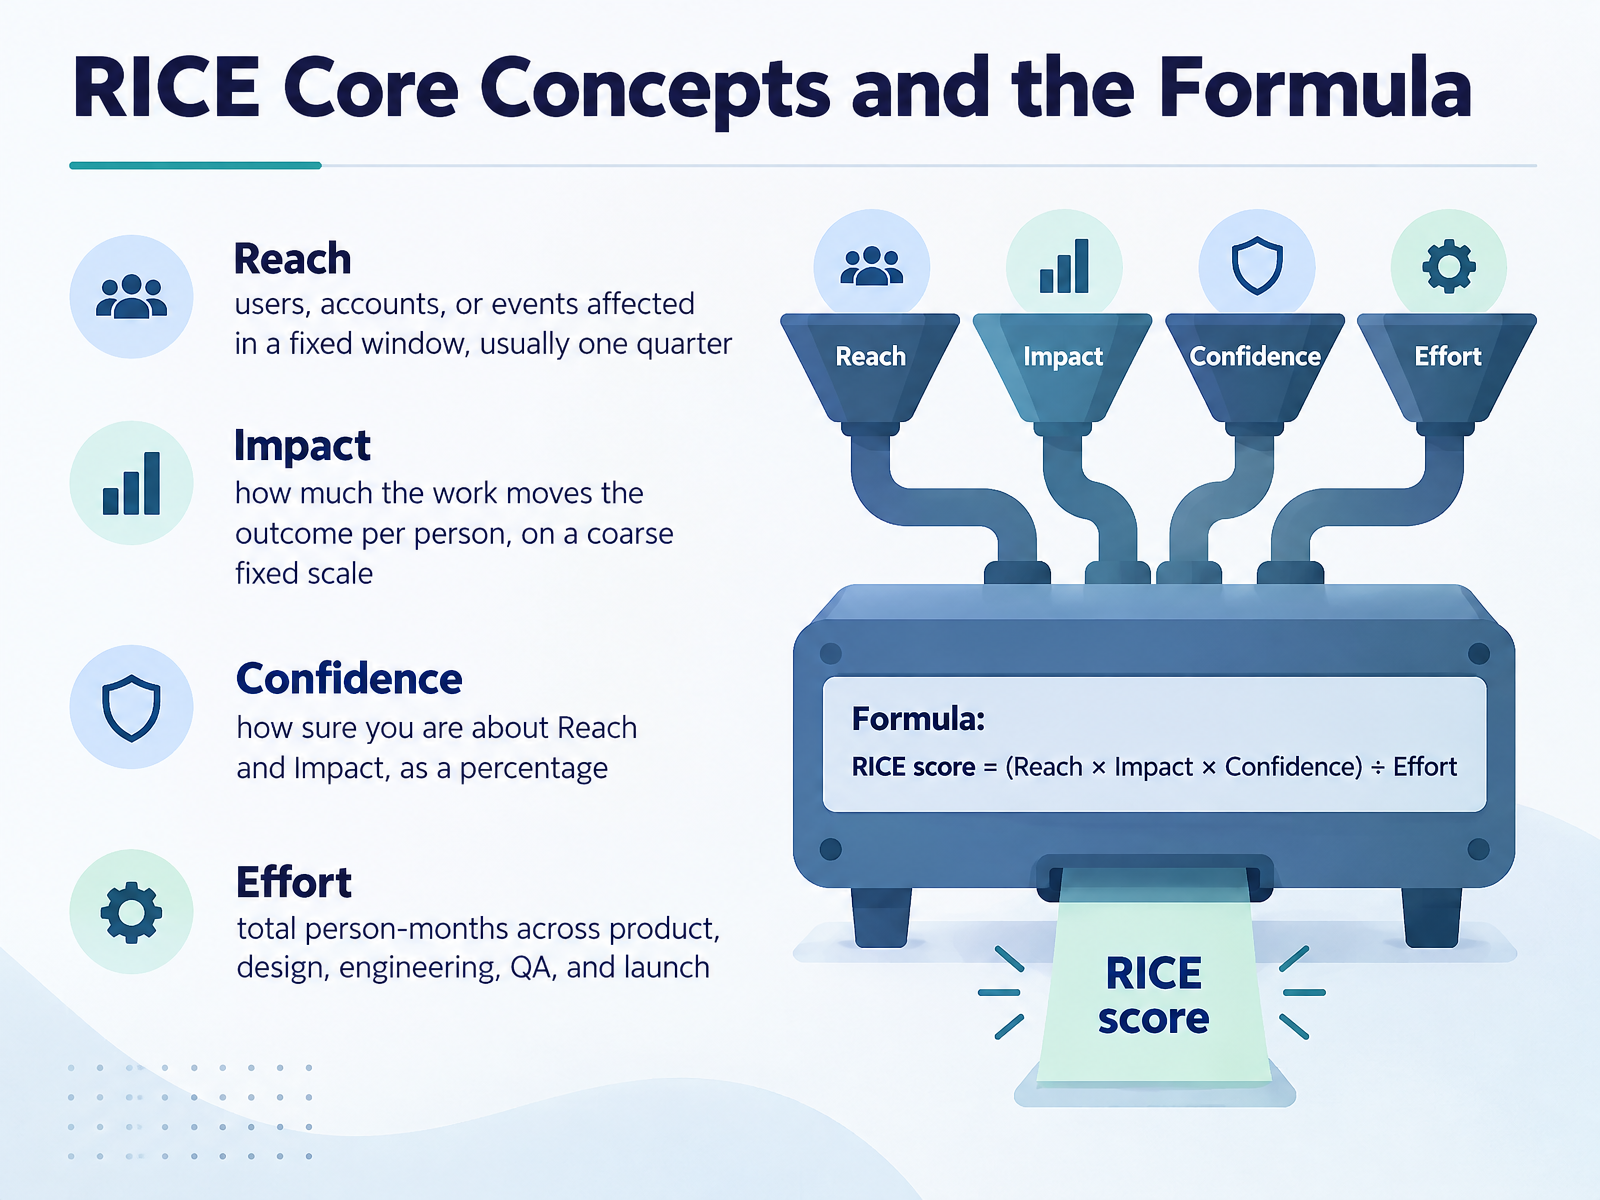
 - 03RICE Core Concepts and the FormulaNow let's break down the four inputs and the formula. Reach is the number of users, accounts, or events affected in a fixed window, usually one quarter. Pick one window and keep it for every item, so the scores stay comparable. If a checkout improvement touches twelve thousand users a quarter, that is your Reach. Impact is how much the work moves the outcome for each person it reaches, on a coarse fixed scale. Three is massive, two is high, one is medium, and below that you have low and minimal. Confidence is how sure you are about your Reach and Impact, as a percentage. One hundred percent means strong evidence. Eighty percent means some evidence. Fifty percent means it is mostly a hypothesis. Effort is the total person months across product, design, engineering, quality assurance, and launch. Put it together and the RICE score equals Reach times Impact times Confidence, divided by Effort. Higher is better. Next, let's look at scoring Reach and Impact consistently.
 unifiedproductgraph.orgproductpeople.coproductschool.com+22 min
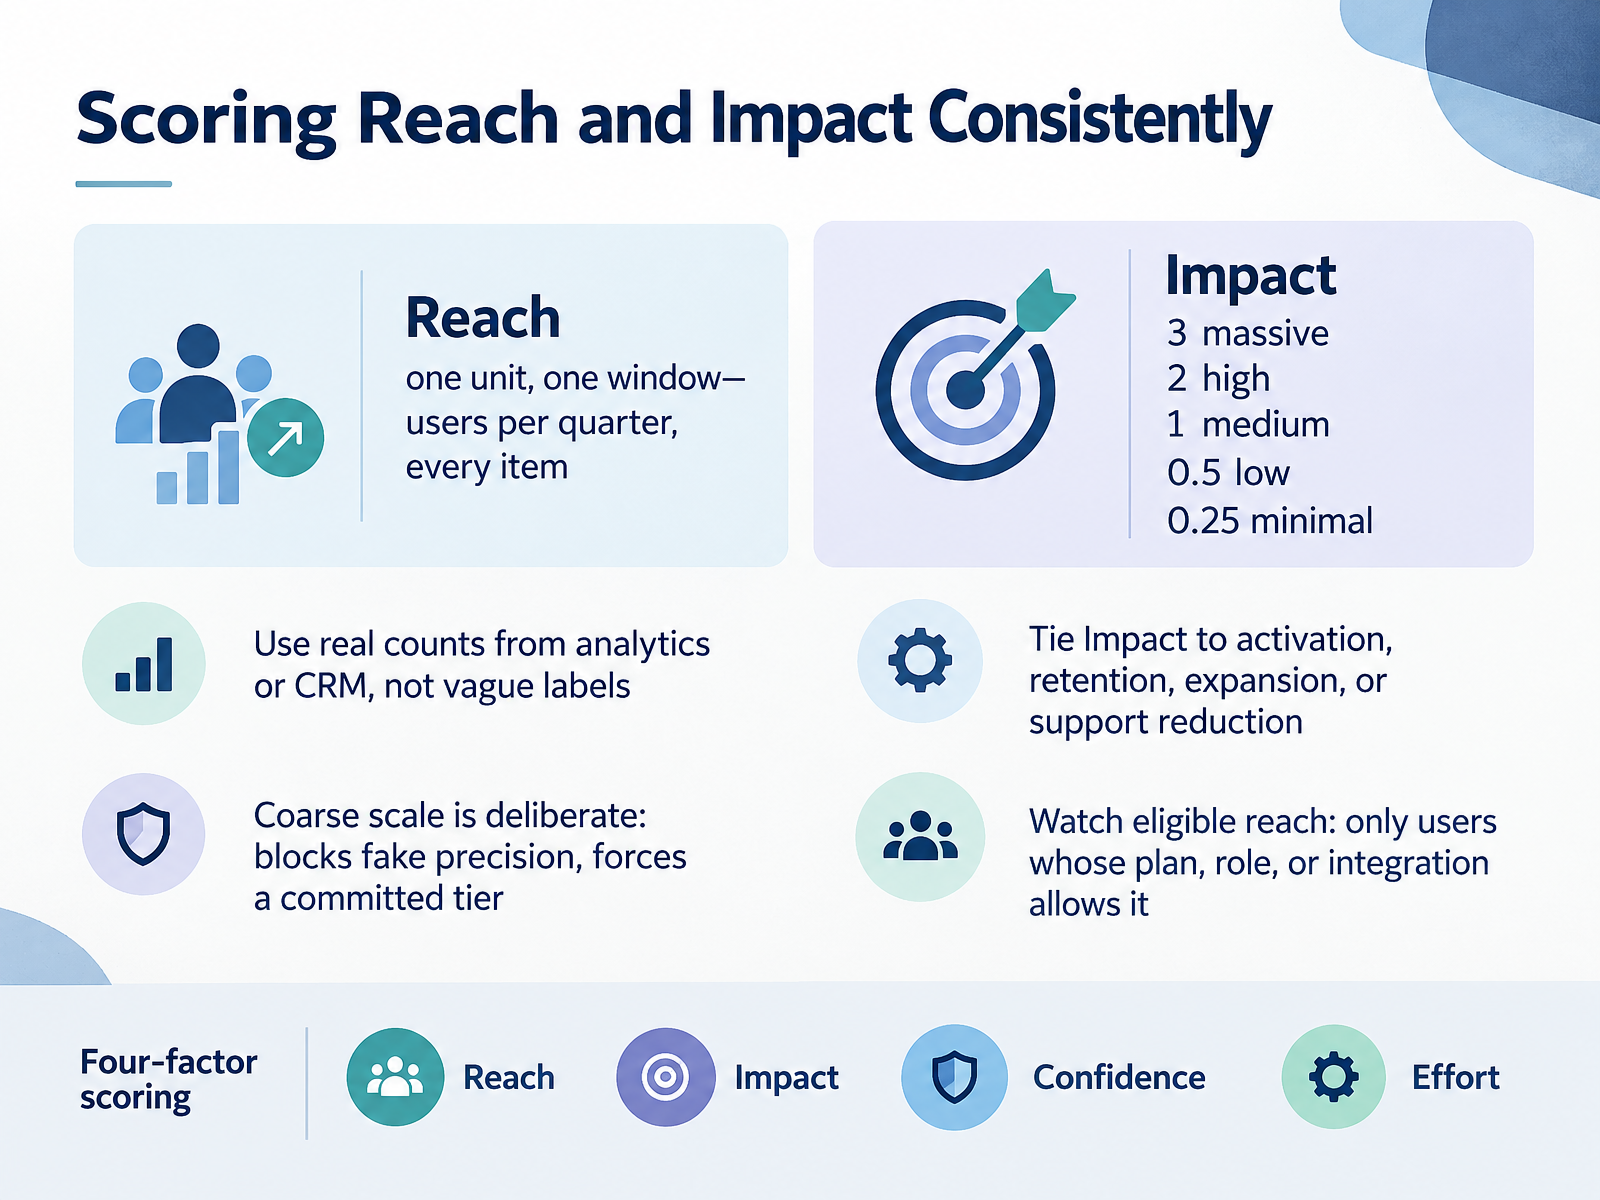
 - 04Scoring Reach and Impact ConsistentlyNow let's get consistent about scoring Reach and Impact. First, Reach. Pick one unit and one window, and use it for every item. Users per quarter is a good default. Pull real counts from analytics or your CRM. Not "lots of users," not "high reach." A real number.
Next, Impact. Use Intercom's scale: three for massive, two for high, one for medium, zero point five for low, zero point two five for minimal. That scale is deliberately coarse. It blocks fake precision and forces you to commit to a tier. Tie Impact to something real: activation, retention, expansion, or support reduction.
One more thing. Watch eligible reach. Only count users whose plan, role, or integration actually allows them to use the feature. If only twelve percent of your base has the required integration, your reach is twelve percent of the total, not everyone. Get that wrong and you can over-rank a feature by eight times. So score Reach with real counts, score Impact in committed tiers, and check eligibility before you rank.
That sets up the two inputs that are hardest to get honest. Let's look at Confidence and Effort: The Honesty Inputs.
 unifiedproductgraph.orgproductpeople.coproductschool.com+22 min
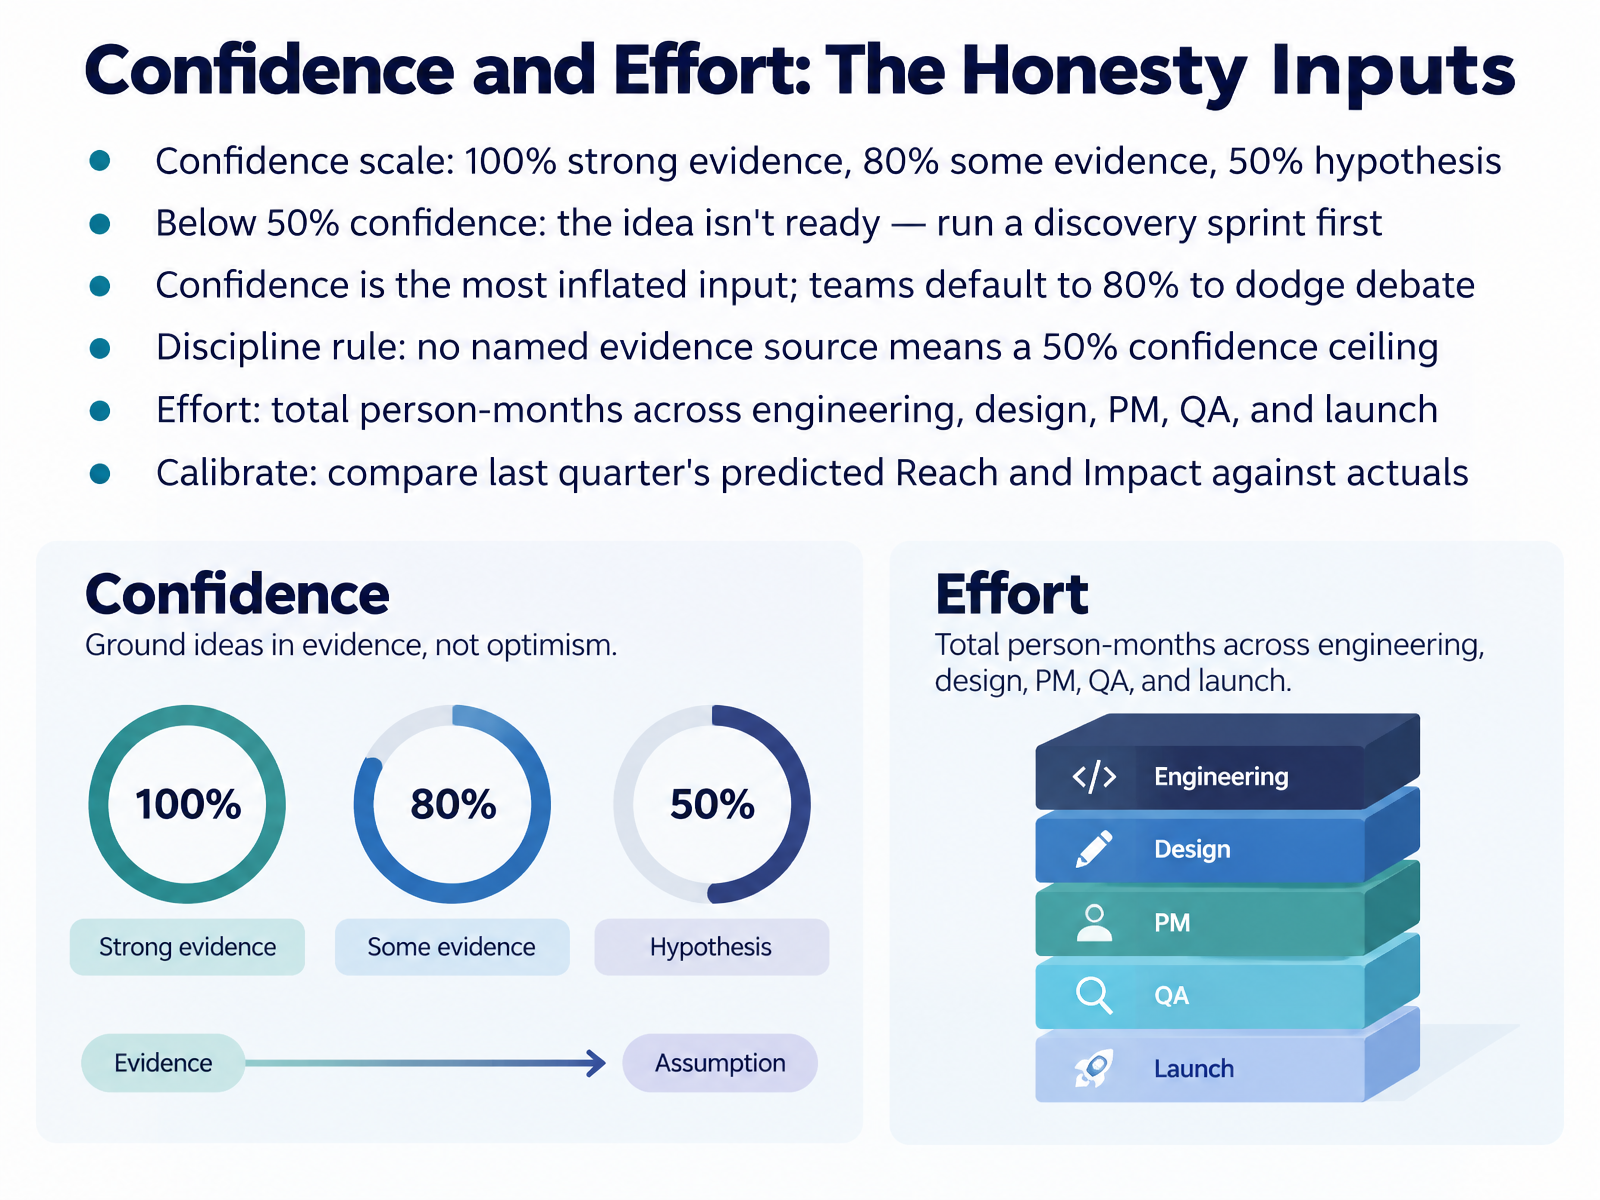
 - 05Confidence and Effort: The Honesty InputsLet's look at the two inputs that keep your RICE scores honest: Confidence and Effort.
Confidence measures how sure you are about your Reach and Impact estimates. Use three levels. One hundred percent means strong evidence, like analytics or user research. Eighty percent means some evidence, but key assumptions remain. Fifty percent means it's mostly a hypothesis.
Here's the discipline rule. If you cannot name the evidence source, your confidence ceiling is fifty percent. And anything below fifty percent means the idea isn't ready to prioritize. Run a discovery sprint first.
Why be strict? Confidence is the most inflated input in RICE. Teams default to eighty percent to dodge debate. A real evidence source, a dashboard, a study, a ticket cluster, earns that number.
Now Effort. Estimate total person-months across engineering, design, product, QA, and launch. Not just engineers. A two-person team for three months is six person-months.
One calibration habit: compare last quarter's predicted Reach and Impact against actuals. If your numbers ran high, apply a team discount next time.
Next, we'll walk through calculating RICE step by step.
 unifiedproductgraph.orgproductpeople.coproductschool.com+22 min
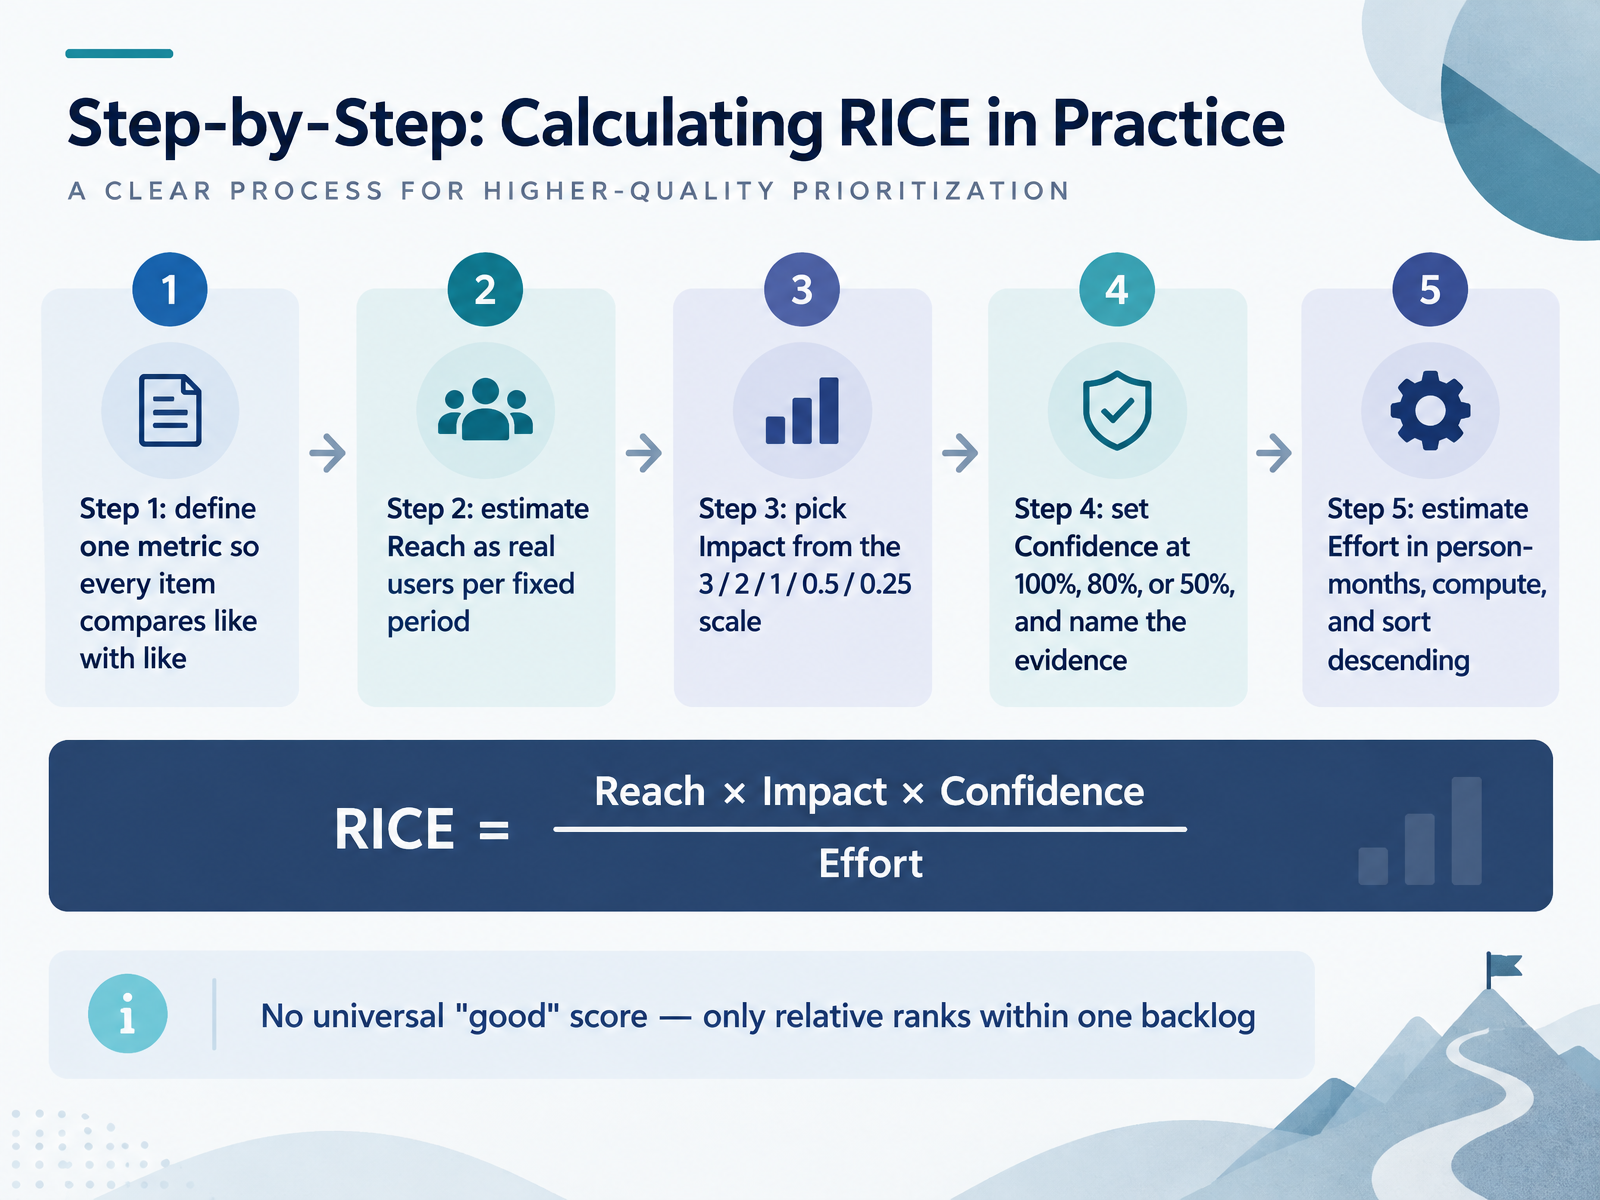
 - 06Step-by-Step: Calculating RICE in PracticeLet's walk through the five steps for calculating a RICE score. First, define one metric you're prioritizing against, so every item compares like with like. Second, estimate Reach as real users per fixed period, usually a quarter. Say eight thousand users per quarter, not 'lots of people.' Third, pick Impact from the fixed scale: three, two, one, zero point five, or zero point two five. When you're torn between two tiers, take the lower one. Fourth, set Confidence at one hundred, eighty, or fifty percent, and name the evidence behind it. User research and analytics justify one hundred percent. A hunch is fifty. Fifth, estimate Effort in person-months, compute Reach times Impact times Confidence divided by Effort, then sort descending. One caution: there's no universal good score. A score of four thousand means nothing on its own. Scores only rank items within one backlog, against one metric, using one time window. Next, we'll work through a full SaaS backlog scored with RICE.
 unifiedproductgraph.orgproductpeople.coproductschool.com+22 min
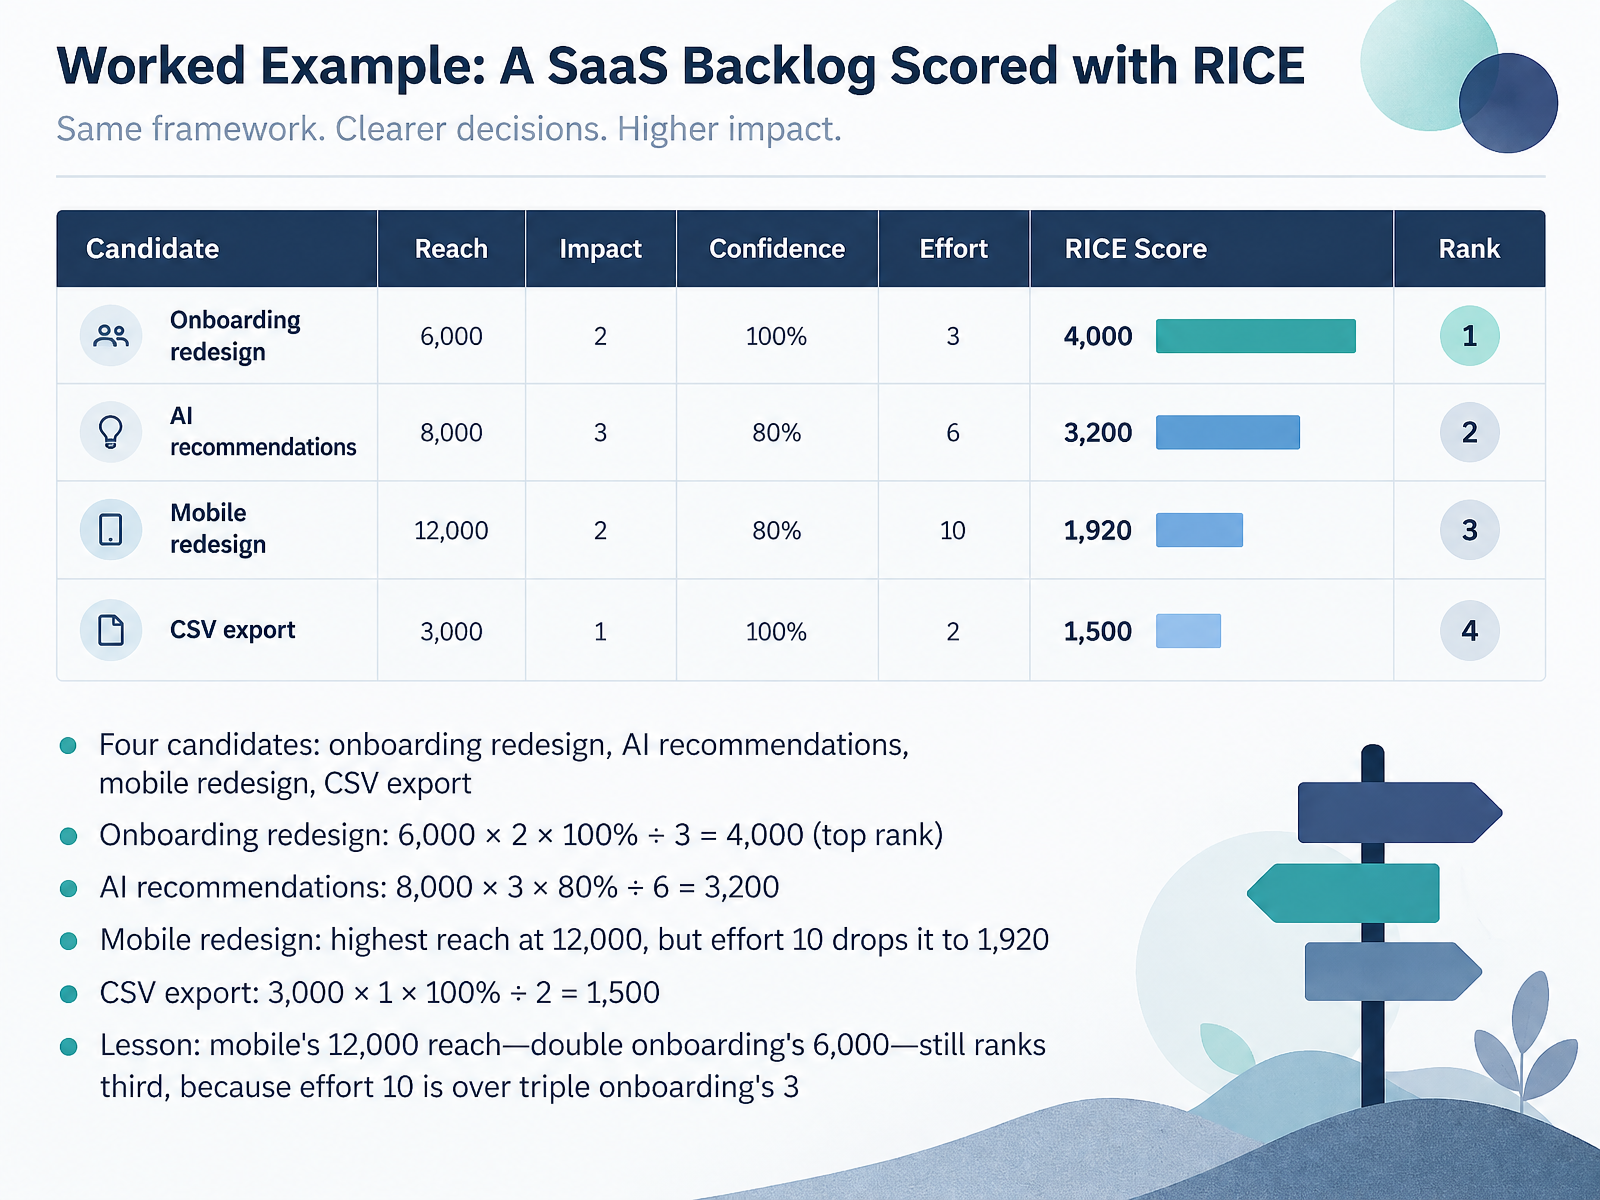
 - 07Worked Example: A SaaS Backlog Scored with RICELet's work through a real backlog and score it. Four candidates. Onboarding redesign, AI recommendations, mobile redesign, and CSV export. Watch the arithmetic and where it lands each item.
Onboarding redesign: reach six thousand, impact two, confidence one hundred percent, effort three. Six thousand times two divided by three equals four thousand. That's your top rank.
AI recommendations: eight thousand times three times eighty percent, divided by six. That equals three thousand two hundred. Second place, despite the highest reach so far.
Now mobile redesign. Highest reach in the whole list, twelve thousand. But effort is ten person-months. Twelve thousand times two times eighty percent, divided by ten, gives one thousand nine hundred twenty. Third.
CSV export: three thousand times one times one hundred percent, divided by two, equals one thousand five hundred. Fourth.
The lesson sits with mobile. Its reach of twelve thousand is double onboarding's six thousand. It still ranks third, because effort ten is over triple onboarding's three. Reach alone doesn't win. The denominator decides. Before you argue rankings, check effort first.
Next, common pitfalls and how to avoid them.
 frameworklist.compmtoolkit.aiproductlift.dev+22 min
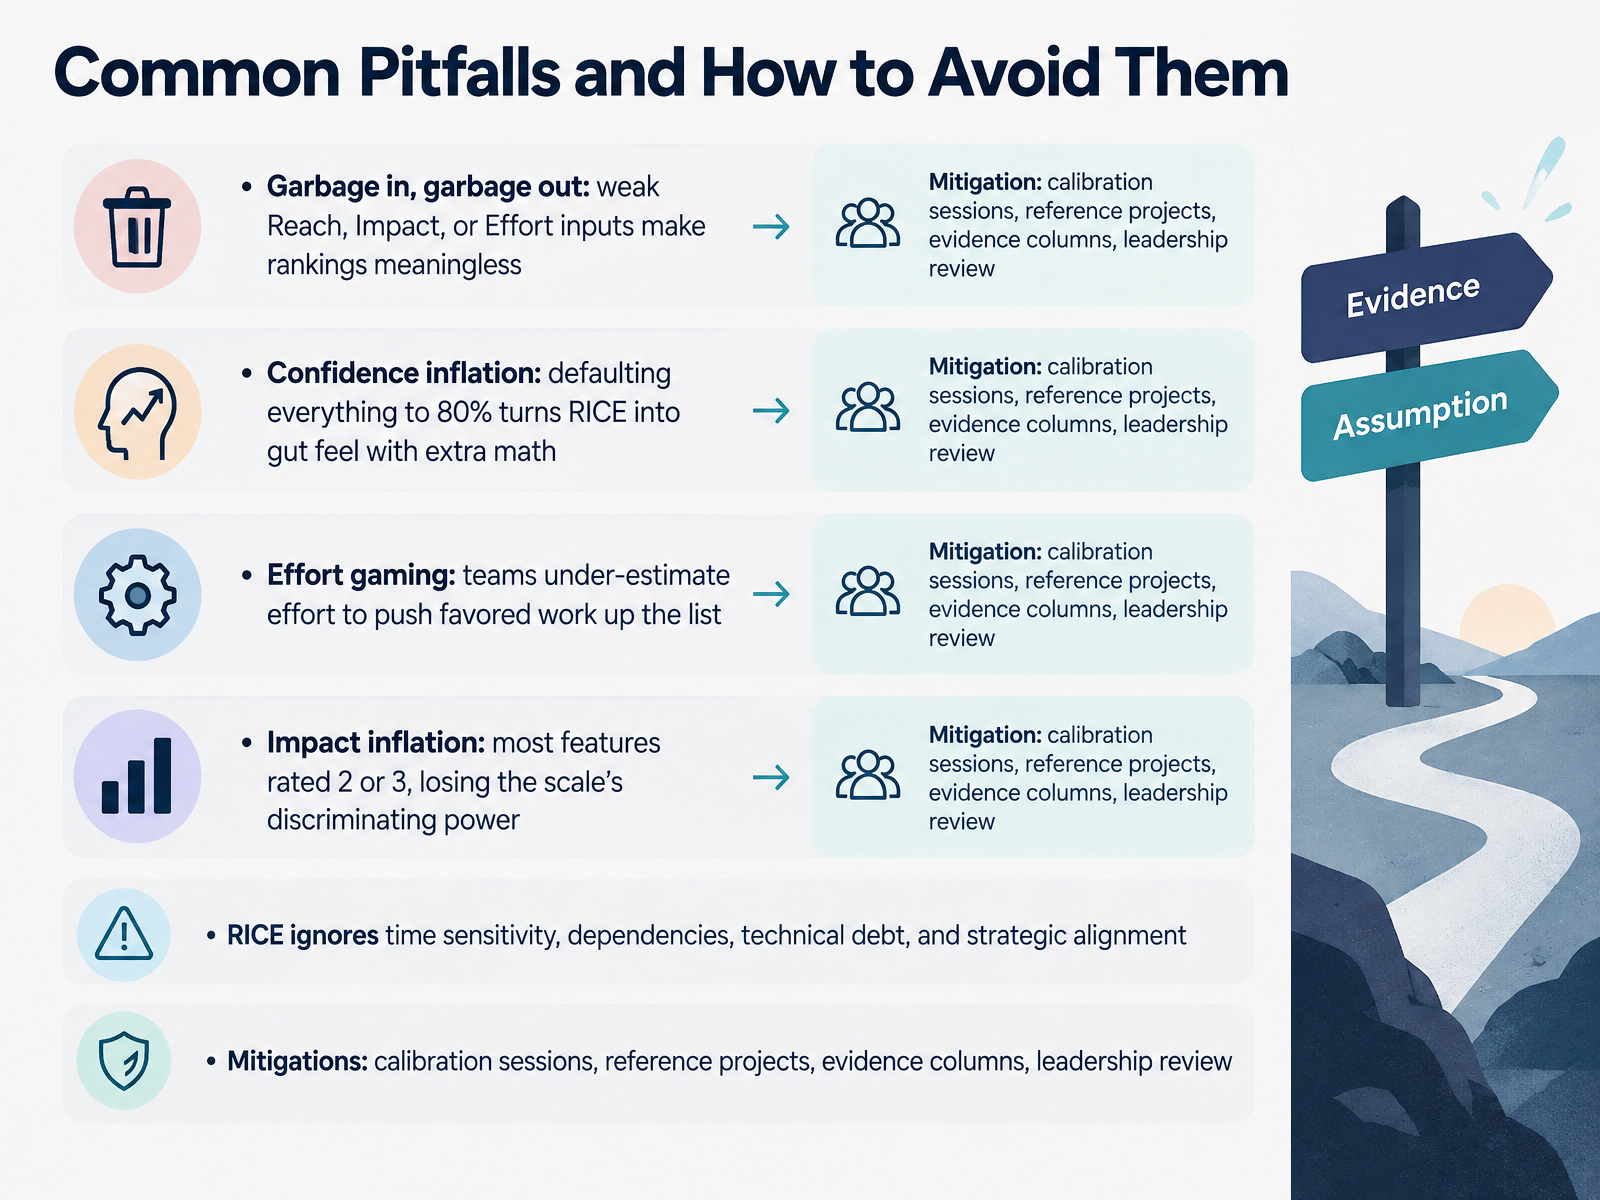
 - 08Common Pitfalls and How to Avoid ThemNow let's look at where RICE quietly breaks down, and how to prevent it. The first pitfall is garbage in, garbage out. If your Reach, Impact, or Effort inputs are weak, the ranking is meaningless. Next, confidence inflation. When everything defaults to eighty percent, RICE becomes gut feel with extra math. Then there is effort gaming. Teams under-estimate effort to push favored work up the list. And impact inflation. When most features are rated a two or a three, the scale loses its discriminating power. Remember, RICE also ignores time sensitivity, dependencies, technical debt, and strategic alignment. So what are the mitigations? Run calibration sessions. Use reference projects for effort. Add an evidence column to every score. And bring leadership in for review. Treat the score as a decision aid, not a decision maker. That leads us to the next slide, When the Score Is Not the Decision.
 productschool.comairfocus.comproductpeople.co+22 min
 - 09When the Score Is Not the DecisionNow let's talk about the limits of scoring. RICE ranks items already under consideration. It is not your product strategy. Strategic alignment, market entry, platform rewrites, and long-term bets may score low and still matter a great deal. Platform rewrites, in particular, score badly because reach is speculative and effort is enormous. That is not a failure of the model. It is the model telling you it cannot price that decision. So yes, you can override the score. Treat three overrides as legitimate: strategic alignment, dependency chains, and customer-relationship risk. A security requirement does not need to beat an onboarding experiment on reach to deserve capacity. A feature that unblocks ten other projects will never show that value in a single RICE number. Here is the discipline that keeps overrides honest. Document every override with a stated reason, then review it next cycle. No silent exceptions. When you write down why you went around the score, you create something you can actually learn from. Finally, audit your override patterns quarterly. If you are consistently overriding in one direction, that is not a series of exceptions. That is a signal your rubric is mis-calibrated. Fix the rubric, not the exceptions. Let's move on to running a RICE scoring session with cross-functional teams.
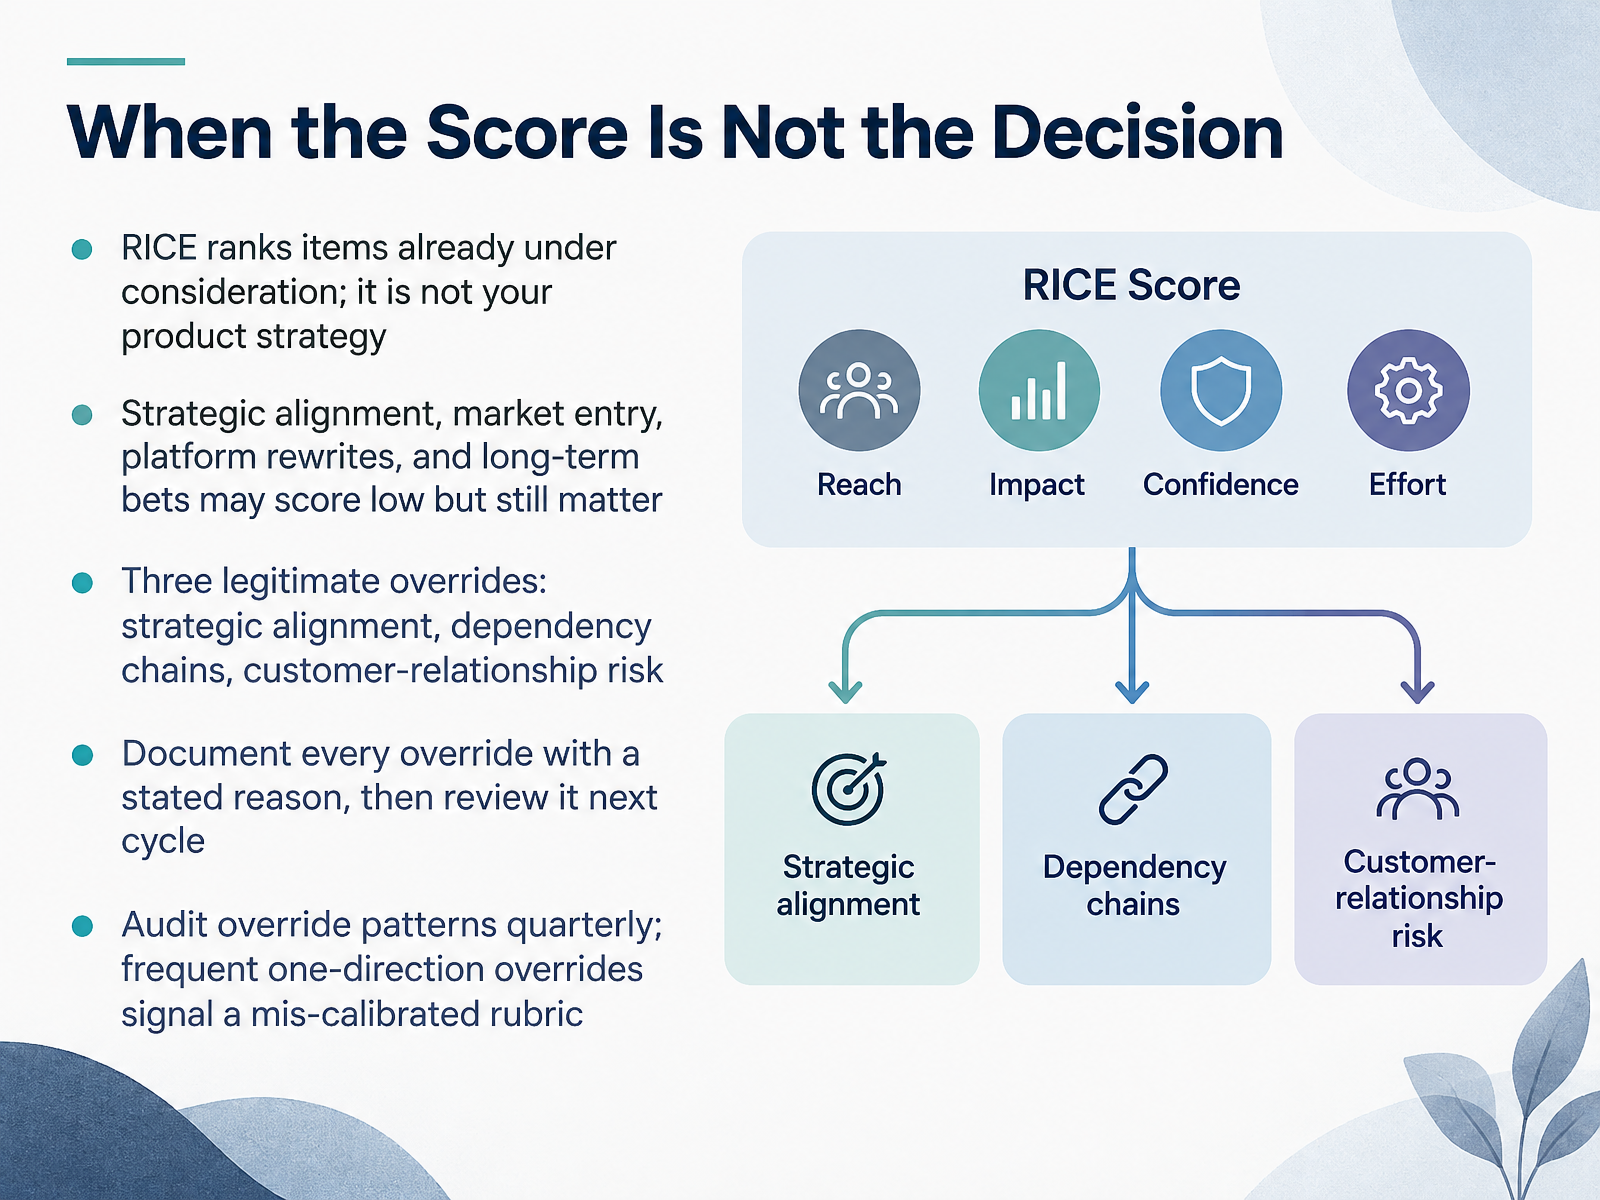 productschool.comairfocus.comproductpeople.co+22 min
 - 10Running a RICE Scoring Session with Cross-Functional TeamsLet's talk about how you actually run a RICE scoring session with your cross-functional team. Preparation matters. Bring ten to thirty real backlog items. Fewer than ten feels trivial, and more than thirty exhausts the room. Pre-fill Reach from your analytics, because that is data, not opinion. Engineering owns Effort. Design and product will argue Impact, and that is healthy. Before scoring anything, calibrate. Agree on what high impact and high effort actually mean for your product this quarter. Then score item by item and reveal simultaneously, so no one anchors on the loudest voice. If any spread is more than one tier, flag it for debate. In that debate round, let the low scorer speak first, then the high scorer responds, then the group re-scores. Close the session by agreeing three things: the cut line, the parked list, and who communicates not now. Doing this gives you a ranking your team can defend. Next, we compare RICE against ICE, MoSCoW, WSJF, and Kano.
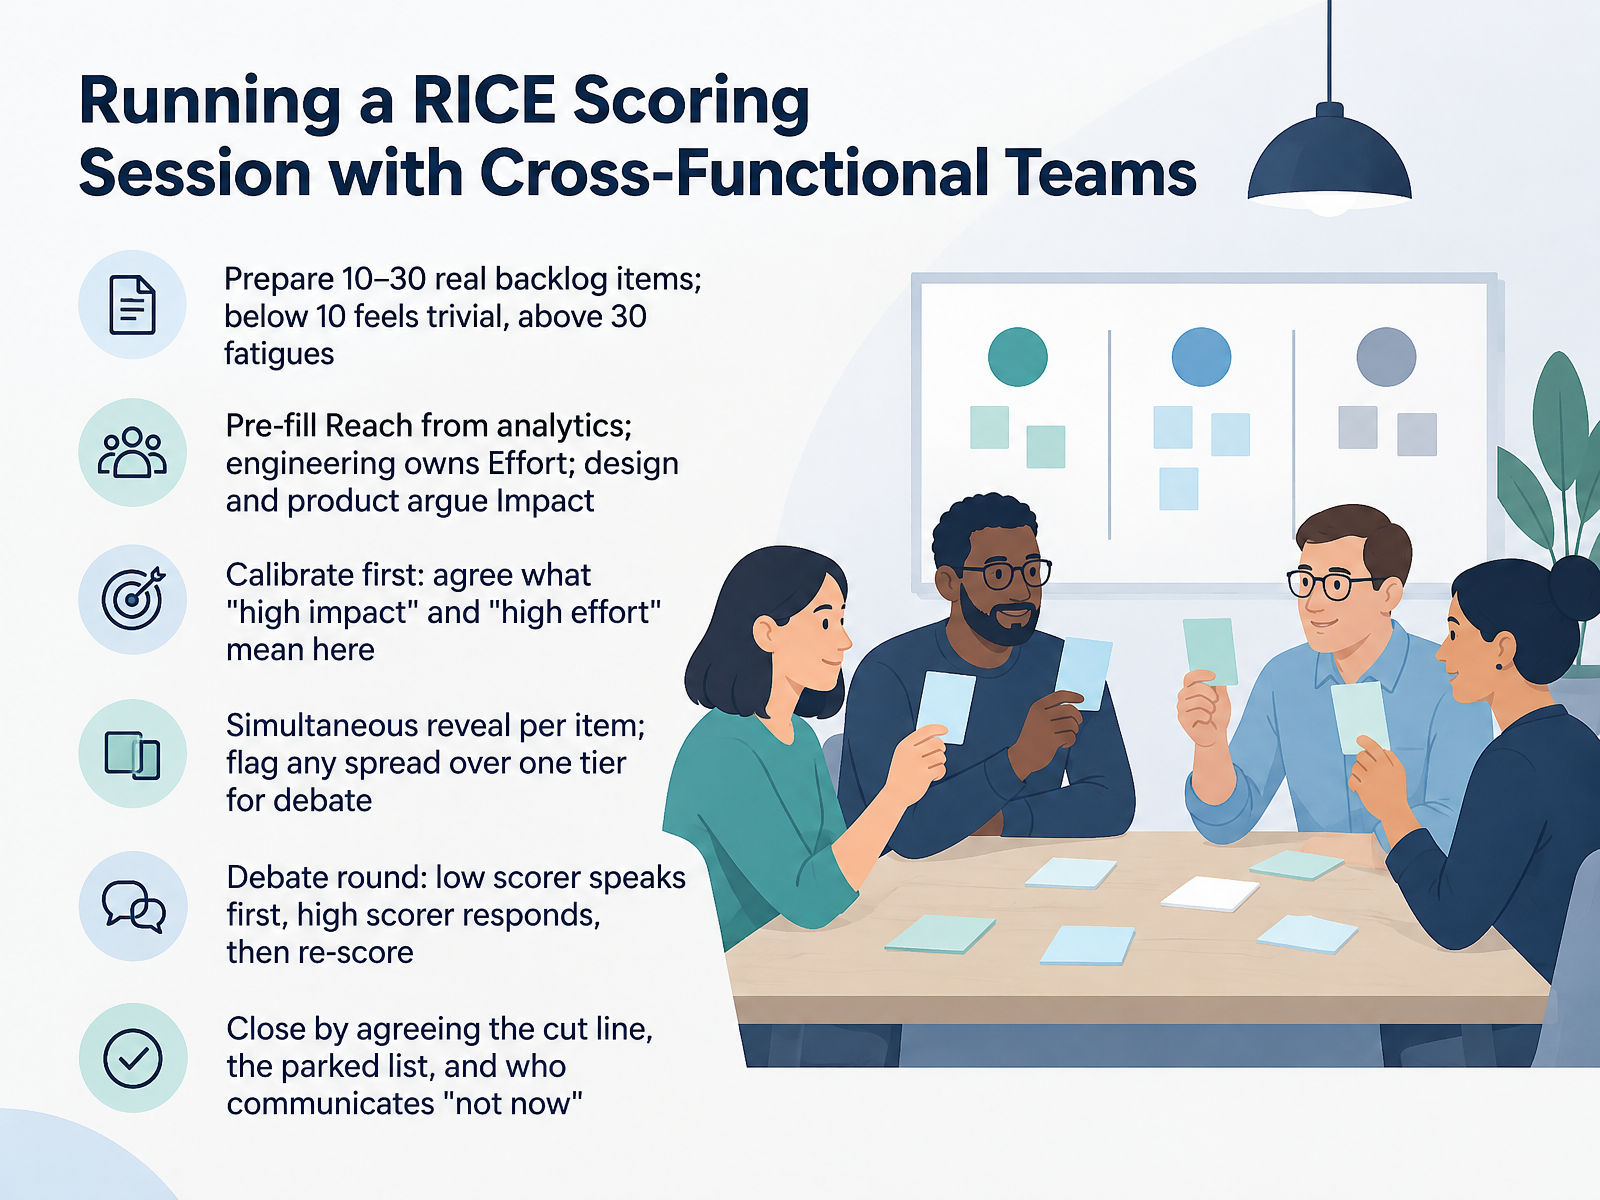 workshopweaver.comideaplan.ioideaplan.io+12 min
 - 11RICE vs ICE, MoSCoW, WSJF, and KanoNow let us compare RICE with the alternatives, so you can pick the right tool. ICE is faster, but it has no Reach term, so it overvalues niche features. MoSCoW sorts work into Must, Should, Could, and Won't, and it is great for scope negotiation, but it does not rank inside those buckets. WSJF brings in Cost of Delay and time criticality. RICE has no time term at all, so a feature with a hard deadline can score the same as an evergreen one. Kano explains what drives satisfaction, but it will not rank a mixed backlog. So where does RICE fit? Tightly scoped feature sets with analytics backed Reach data. My recommendation: pick one primary framework, and layer a second only to fill a real gap. Next, let us look at how to adapt RICE to your organization.
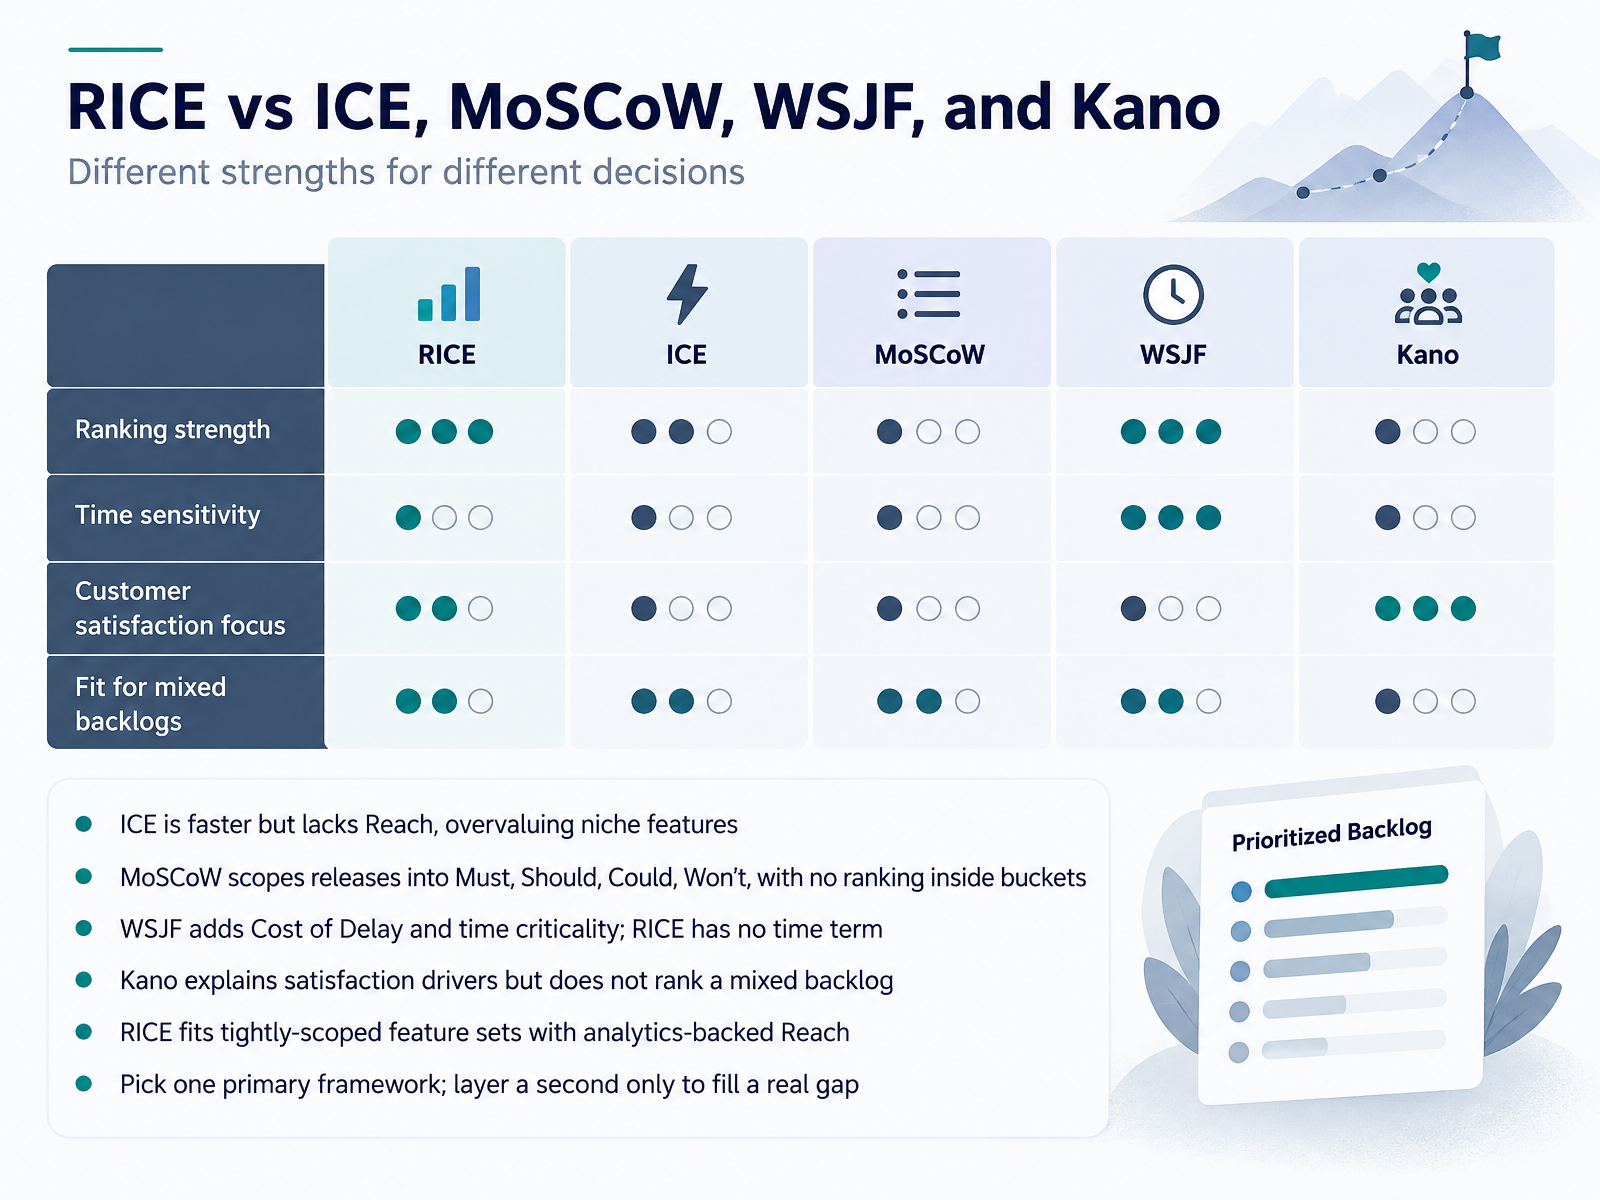 jamesbradleyuxr.comconsole.todayshraddha2789.github.io+21 min
 - 12Adapting RICE to Your OrganizationNow let's make RICE yours. The framework only works if your definitions are written down. So document your rubric: the reach time window, your impact tiers, your confidence rules, and what counts as an effort unit. Then build one reusable sheet with these columns: Feature, Reach, Impact, Confidence, Effort, Score, and Evidence. Re-score quarterly, and re-score sooner when customer, market, or delivery facts change. Two common adaptations. For SaaS, consider NRR-weighted Reach, and split Impact into retention and expansion. For platform work, define Reach as internal users and Impact as saved time. Finally, track your Confidence Discount: compare predicted versus actual Reach times Impact each quarter, take the median ratio, and apply it to next quarter's Confidence scores. That keeps inflated confidence honest. Next, we'll see this in practice with a case study. Case Study: Prioritizing a Roadmap with RICE.
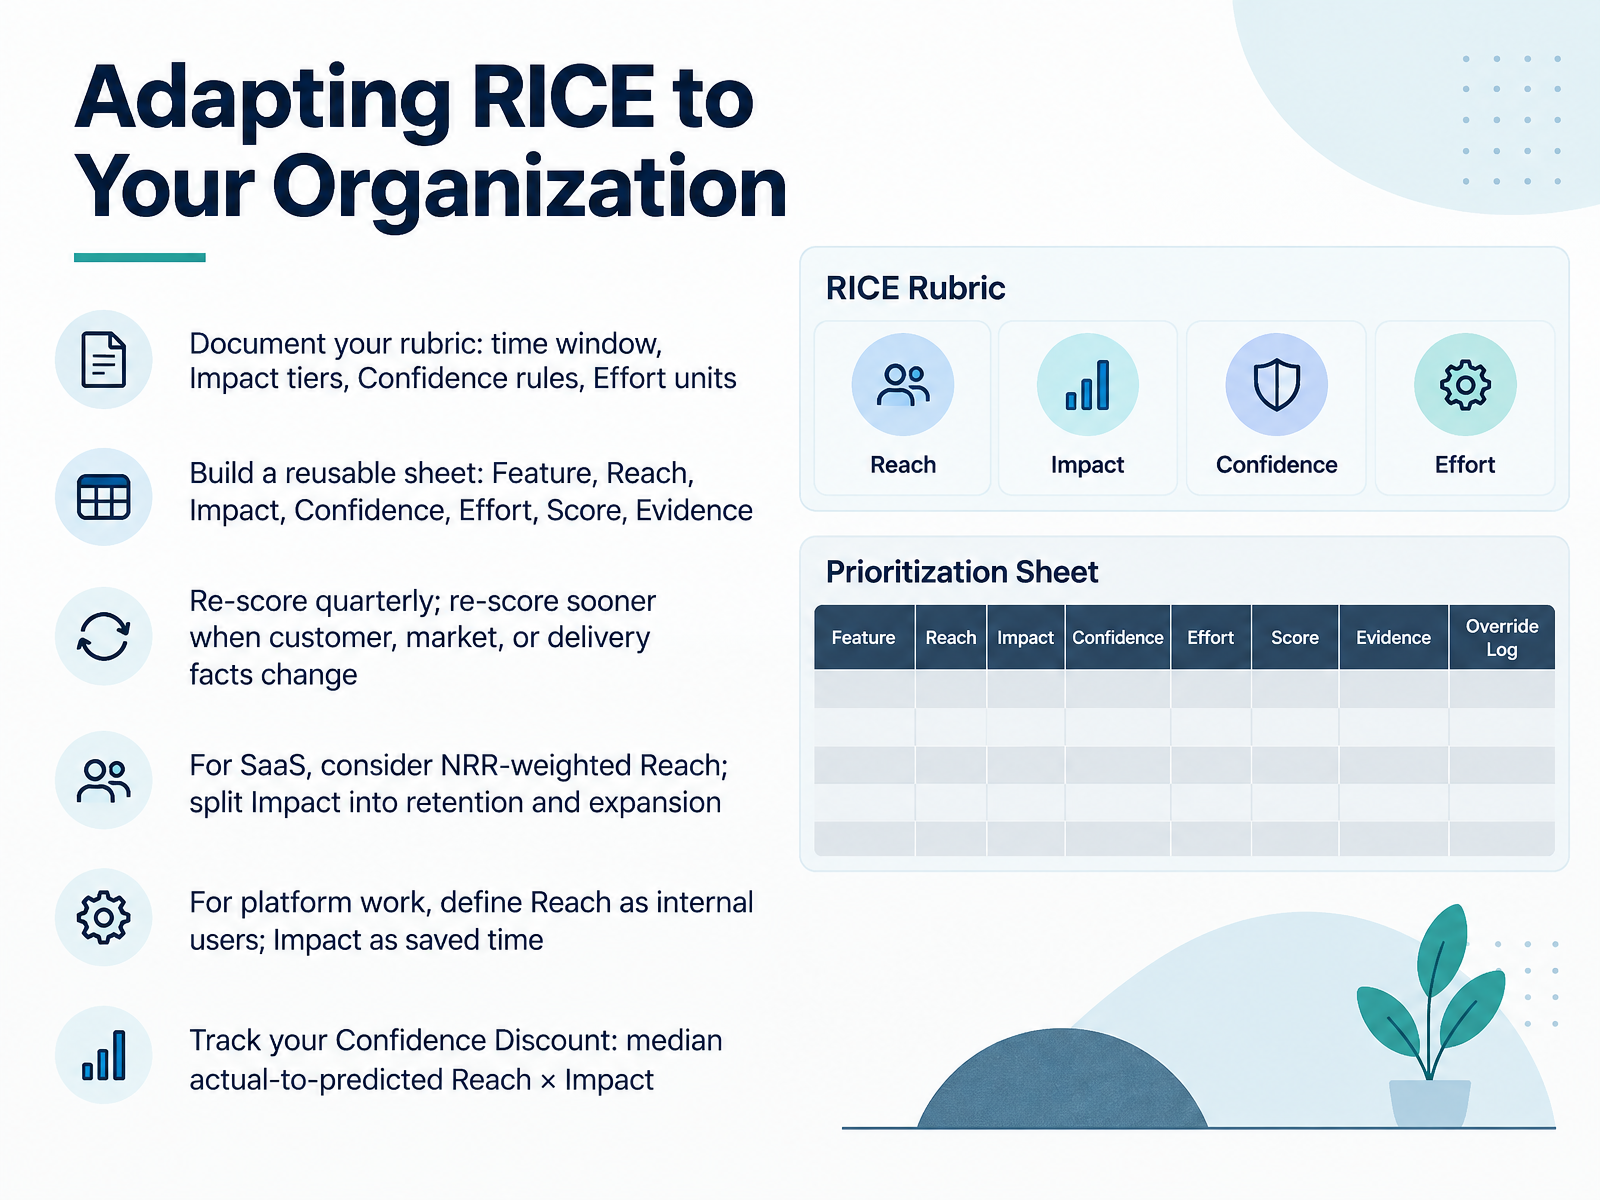 pmtoolkit.aiworkshopweaver.comideaplan.io+12 min
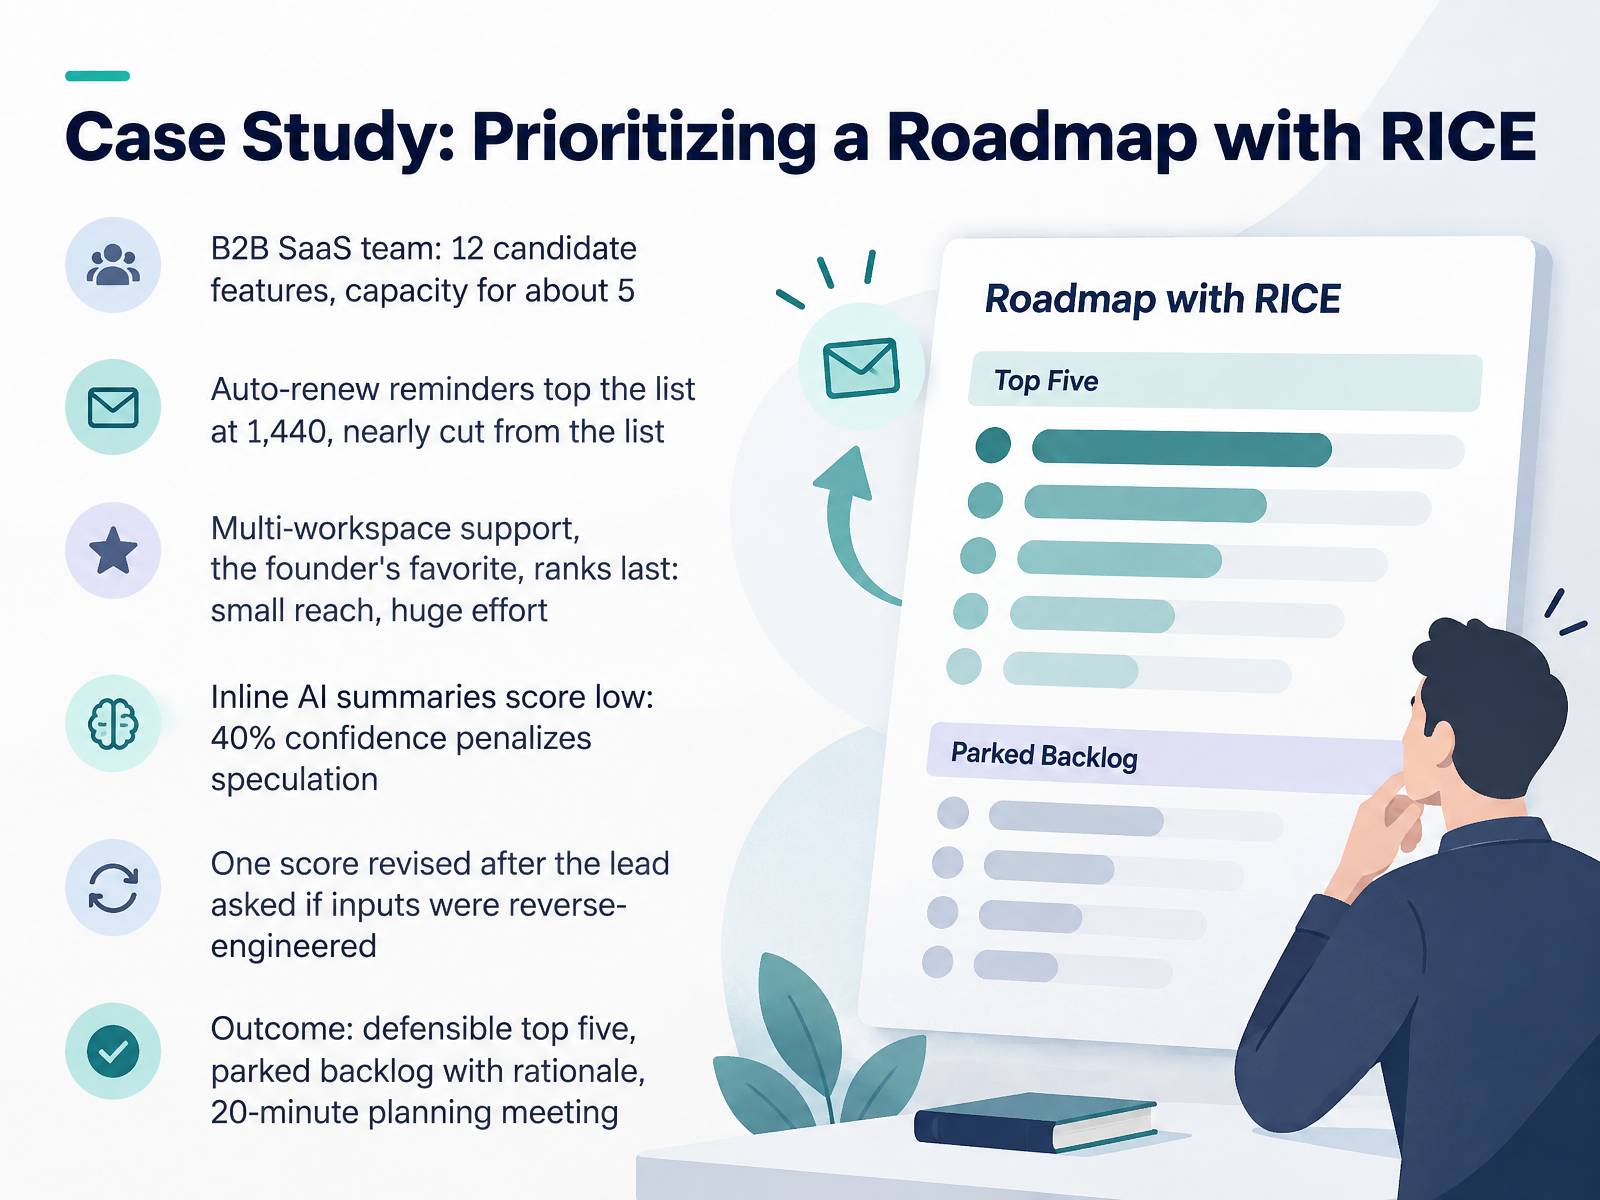
 - 13Case Study: Prioritizing a Roadmap with RICELet's ground all of this in a real case. A B2B SaaS team had twelve candidate features for one quarter and capacity for about five. They ran RICE on a Tuesday afternoon. Auto-renew reminder emails, which nearly got cut from the list, scored 1,440 and finished at the top, because reach was high, impact was modest, confidence was high, and effort was half a person-month. Multi-workspace support, the founder's favorite, ranked dead last, with a score of eighty. Small reach, huge effort. Inline AI summaries looked promising, but forty percent confidence dropped the score to 288, penalizing speculation. Then the lead asked one question: are any of these scores what we wanted the answer to be? One score was revised, and the ranking held. The outcome was a defensible top five, a parked backlog with written rationale, and a planning meeting that took twenty minutes instead of two hours. So the lesson is simple. Score honestly, and let the numbers start the conversation. Next, we'll practice. In the hands-on exercise, you'll score three competing ideas.
 jamesbradleyuxr.comconsole.todayshraddha2789.github.io+22 min
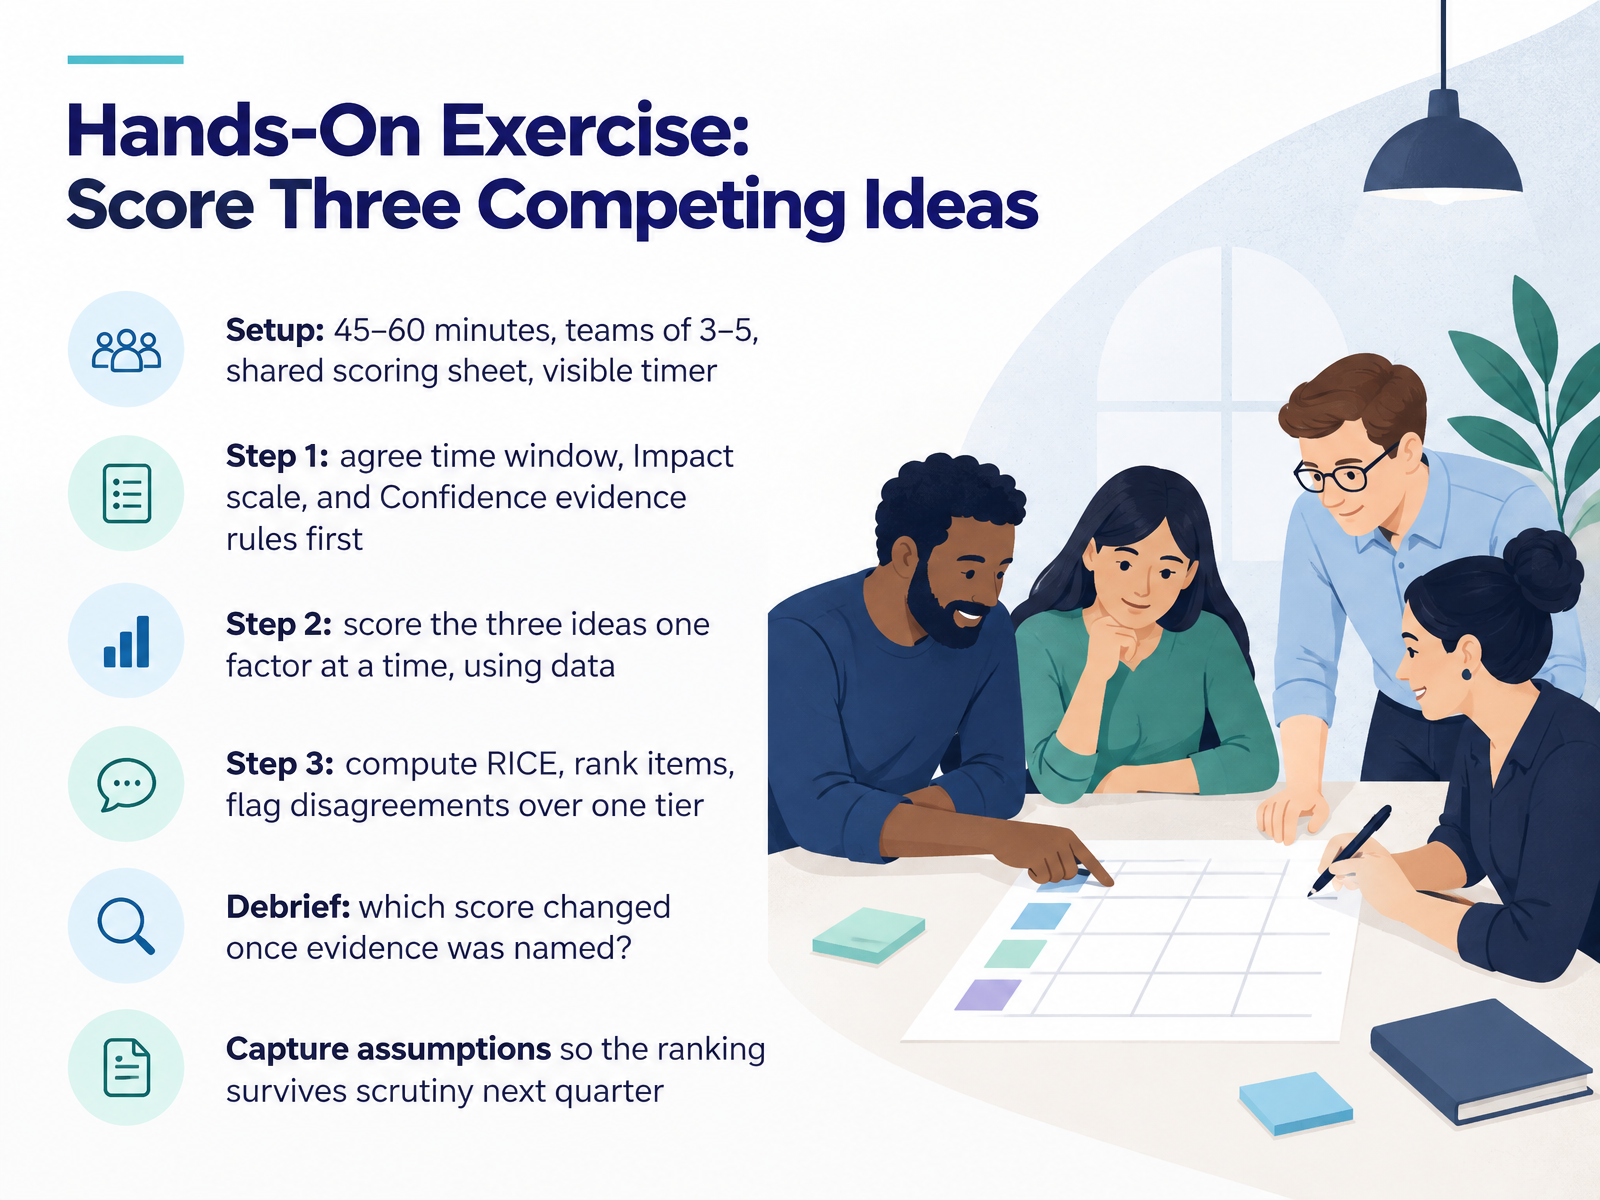
 - 14Hands-On Exercise: Score Three Competing IdeasNow let's put RICE to work on your own backlog. This exercise takes forty-five to sixty minutes with teams of three to five people. You need a shared scoring sheet and a visible timer. Step one, before anyone scores anything, agree three things: the Reach time window, the Impact scale, and what evidence earns a high Confidence score. Step two, score the three ideas one factor at a time, using real data wherever you have it. Step three, compute the RICE score, rank the items, and flag any disagreement larger than one tier instead of arguing it out in the moment. In the debrief, ask which score moved once someone named actual evidence. Then capture the assumptions behind each number, so the ranking still holds up when you revisit it next quarter.
 workshopweaver.comideaplan.ioideaplan.io+21 min
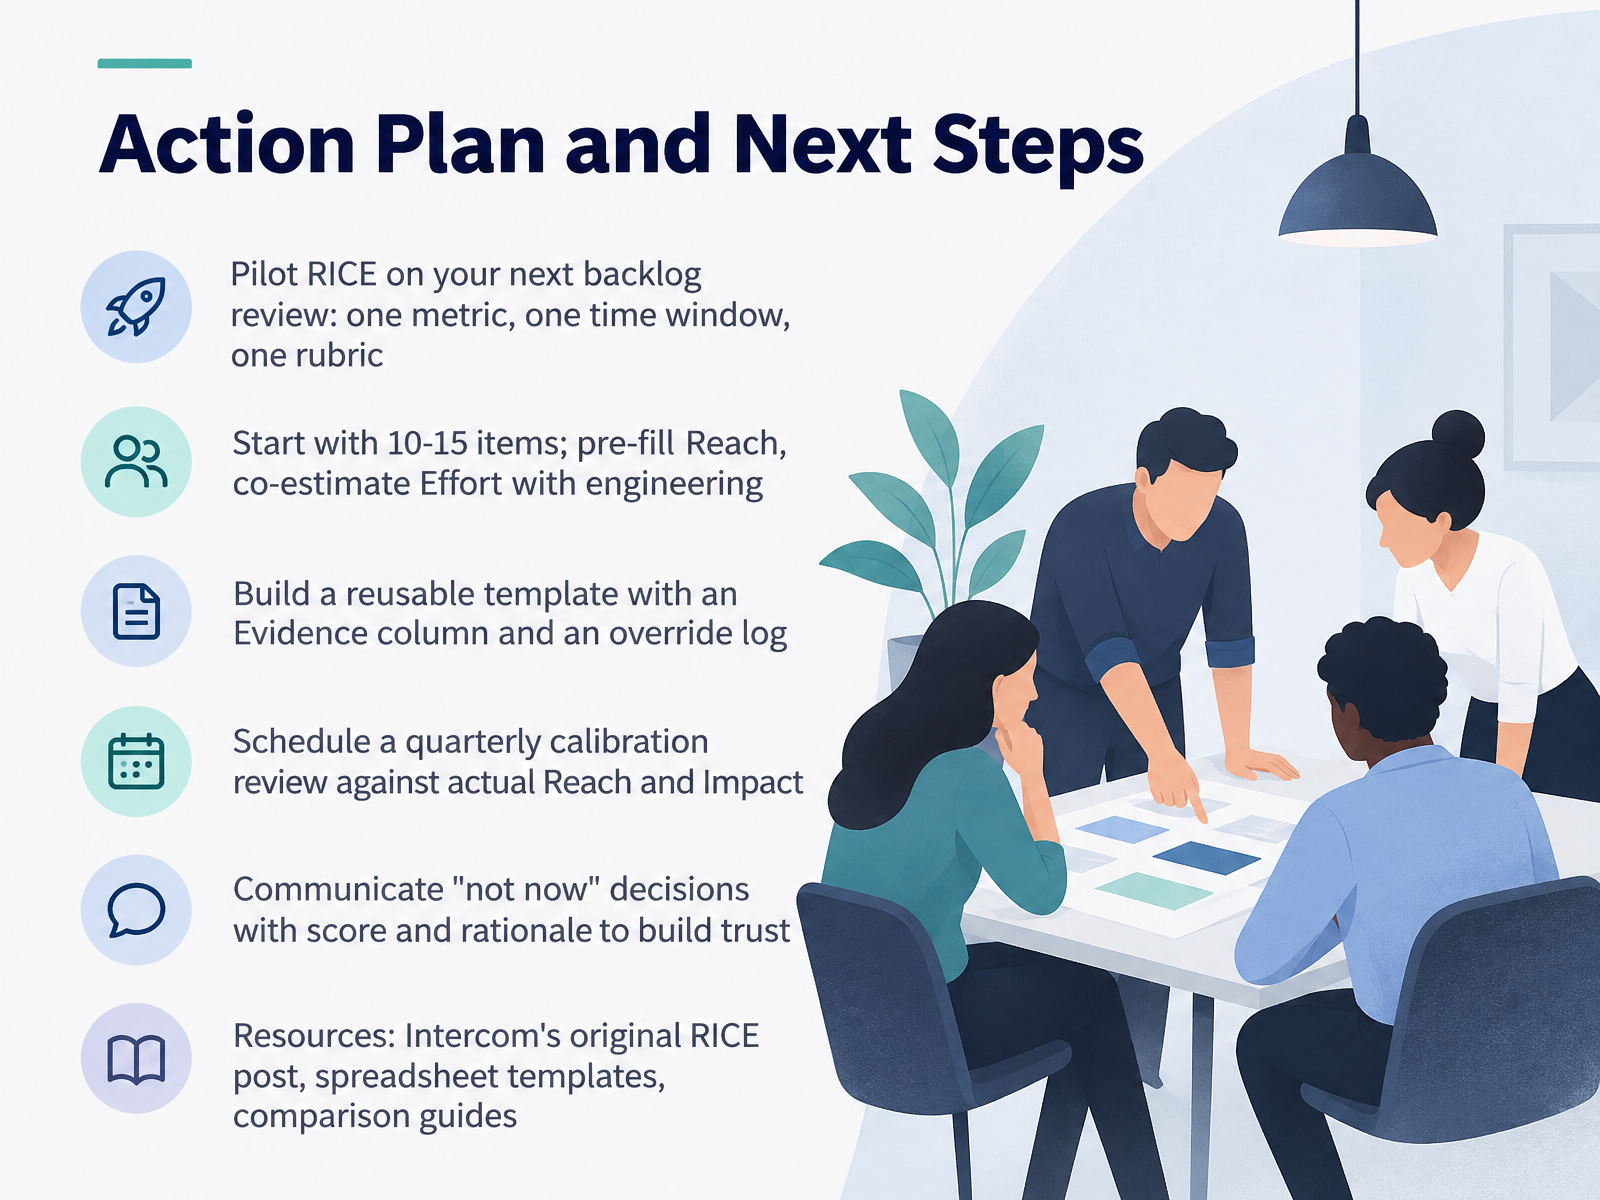
 - 15Action Plan and Next StepsLet's close with what you actually do next. Pick your next backlog review and pilot RICE on it. One metric, one time window, one rubric. Start with ten to fifteen items. Pre-fill Reach from your analytics, and co-estimate Effort with engineering so the numbers are grounded, not guessed. Then build a reusable template, and add two things most teams skip: an Evidence column, and an override log for exceptions you make. Both protect you later when someone asks why the ranking shifted. Schedule a quarterly calibration review. Compare your predicted Reach and Impact against what actually shipped. That is how your estimates improve over three or four cycles. And when something does not make the cut, communicate it clearly. Say the score, say the rank, say it is not now rather than never, and give the rationale. That transparency builds trust. If you want a starting point, look up Intercom's original RICE post, the free spreadsheet templates, and the RICE versus ICE comparison guides. You now have the framework, the scoring, and the next steps. Run one pilot, keep the debate honest, and let the evidence do the arguing. Thanks for staying with me. Go prioritize well.
 pmtoolkit.aiworkshopweaver.comideaplan.io+12 min
Take the deck with you
Download this course as a file — free, no sign-up needed.
- PDF handoutEvery slide page, ready to print or share.16 pages · 3.6 MBDownload
- Narrated PowerPointThe deck that presents itself — every slide carries the digital human's narration video.16 pages · 15.7 MBDownload
- PowerPoint slidesThe full deck as a .pptx — open it in PowerPoint, Keynote, or Google Slides.16 pages · 3.6 MBDownload
Free to use in your own training — please keep the PersonWise credit page at the end.
Have your own deck? Turn it into a course
Sources consulted
Web sources consulted while building this course.
- RICE Scoring | UPG Framework | UPG Reference — unifiedproductgraph.org
- RICE Framework: A Practical Guide to Product Prioritization | ProductPeople — productpeople.co
- How to Use the RICE Framework for Better Prioritization — productschool.com
- RICE Scoring Template: How to Set Up RICE for Your Team | PM Toolkit — pmtoolkit.ai
- RICE Prioritization Framework: How to Score and Rank Product Ideas — koji.so
- Transforming Resource Allocation: From Opinion-Based to Evidence-Driven Decisions – James M. Bradley Jr., Ph.D. — jamesbradleyuxr.com
- Why RICE Scores Failed Our Roadmap: A Post-Mortem Analysis | Console | DevOps, Cloud Computing, AI Infra & Backend — console.today
- Sapiens CoreSuite — Case Study · Shraddha Singh — shraddha2789.github.io
- Prioritization frameworks are just opinion laundering — productcoalition.com
- ●A leading company in the consumer-packaged goods (CPG) industry faced a critical bottleneck. One of its technology teams was struggling to manage incoming work from five different business units—each demanding immediate attention. Without a single product manager or a unified backlog, the team foun — iconagility.com
- RICE score calculator: the formula, explained with 3 worked examples — Framework — frameworklist.com
- RICE Scoring Framework: Complete Prioritization Guide | PM Toolkit | PM Learning Hub — pmtoolkit.ai
- Free RICE Calculator & Scoring Template | ProductLift — productlift.dev
- RICE Score Calculator: Prioritize Your Product Roadmap With Product Analytics - Thoughts about Product Adoption, User Onboarding and Good UX | Userpilot Blog — userpilot.com
- What Is RICE Framework? Definition, Benefits & Examples — agilemania.com
- RICE prioritization: useful scoring model, dangerous decision system | airfocus by Lucid — airfocus.com
- Maximizing Value with the RICE Framework Prioritization Model — productstrategy.co
- RICE Scoring: Steps, Timing & Tips | Workshop Weaver — workshopweaver.com
- Prioritization Workshop Template — ideaplan.io
- Prioritization Workshop: Help Your Team Make Better — ideaplan.io