SEO Metrics: Measurement and Interpretation
Begin
12 pages · ~24 min
SEO Metrics: Measurement and Interpretation
Learn to measure and interpret key SEO metrics to evaluate performance, identify optimization opportunities, and drive data-informed search strategy decisions.
What you’ll learn
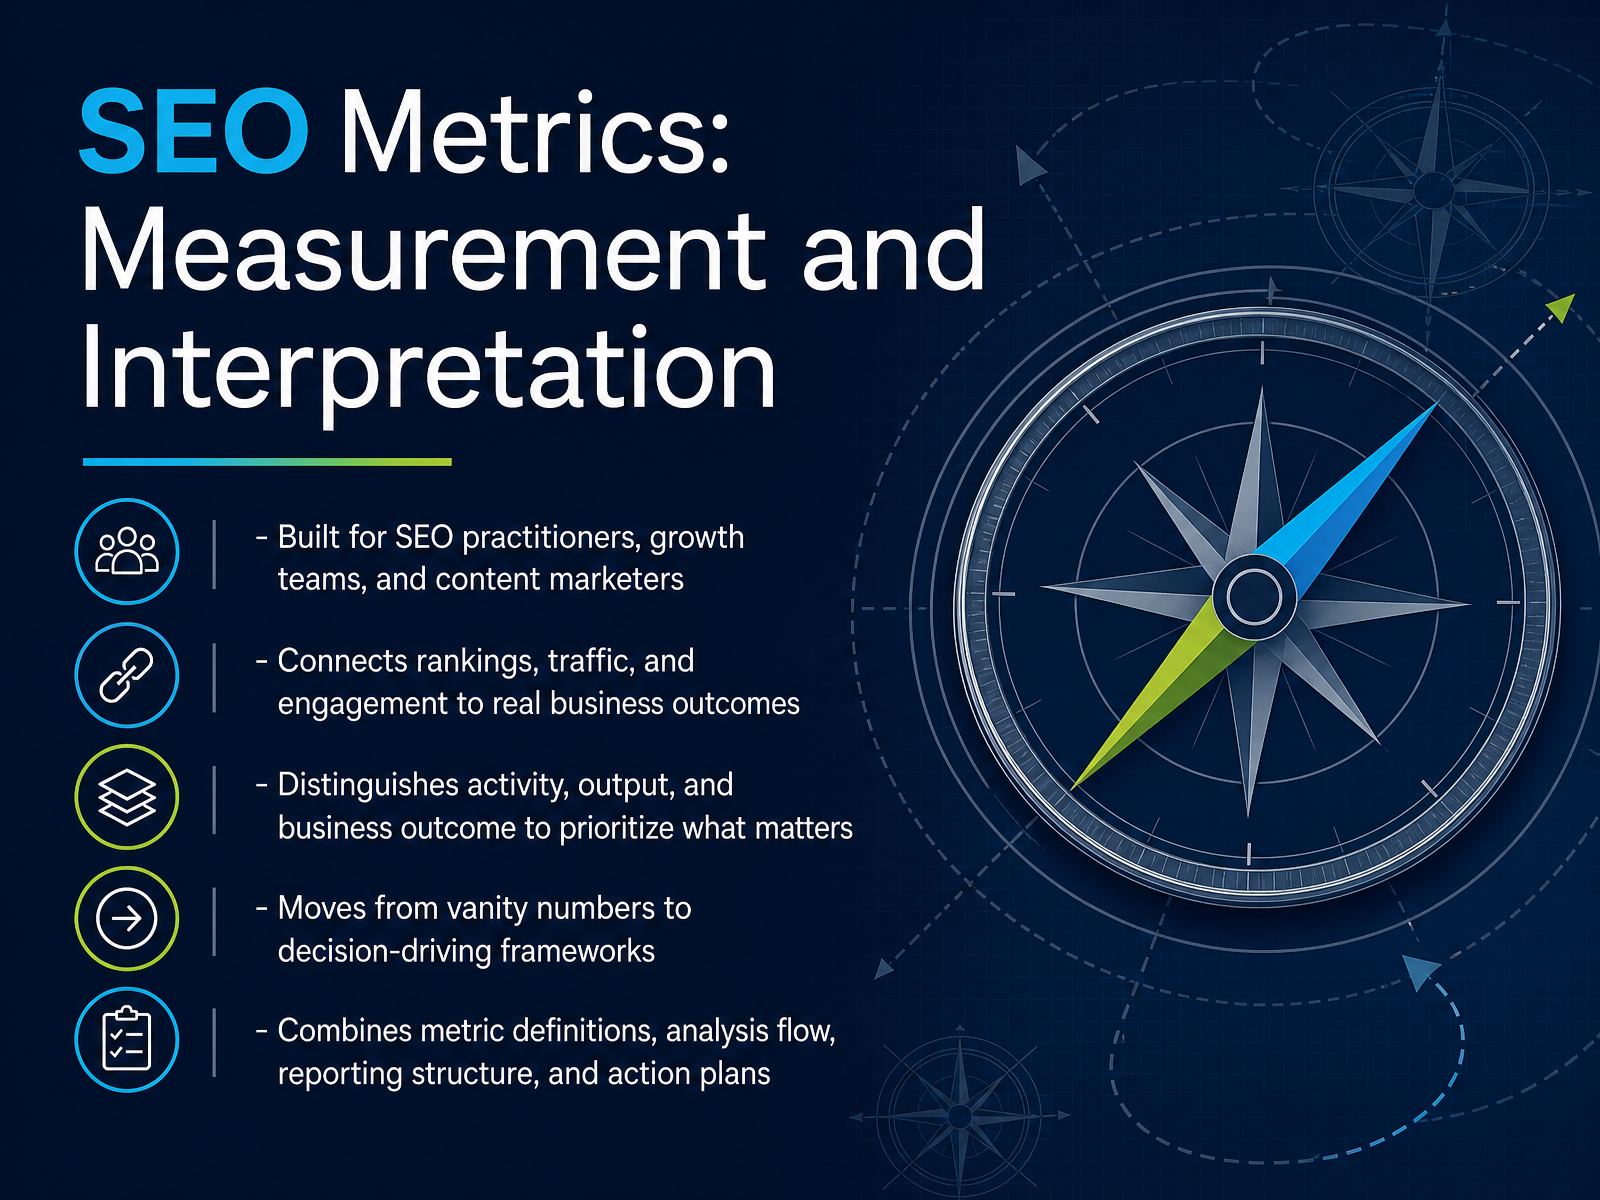
- 01SEO Metrics: Measurement and InterpretationWelcome to SEO Metrics, Measurement and Interpretation. If you work in SEO, growth, or content marketing, you already know that data is everywhere. The challenge is that not all of it deserves your attention. In this course, we'll connect rankings, traffic, and engagement to what actually matters: revenue, conversions, and business outcomes. We'll distinguish between activity, like posts published, output, like rankings gained, and the business results leadership cares about. You'll learn to move beyond vanity numbers and toward decision driving frameworks. We'll cover metric definitions, a practical analysis flow, reporting structure, and clear action plans. By the end, you'll be equipped to prioritize the numbers that change decisions. Let's begin with the foundations of SEO measurement.keygrow.coblog.hubspot.comrankai.ai+21 min
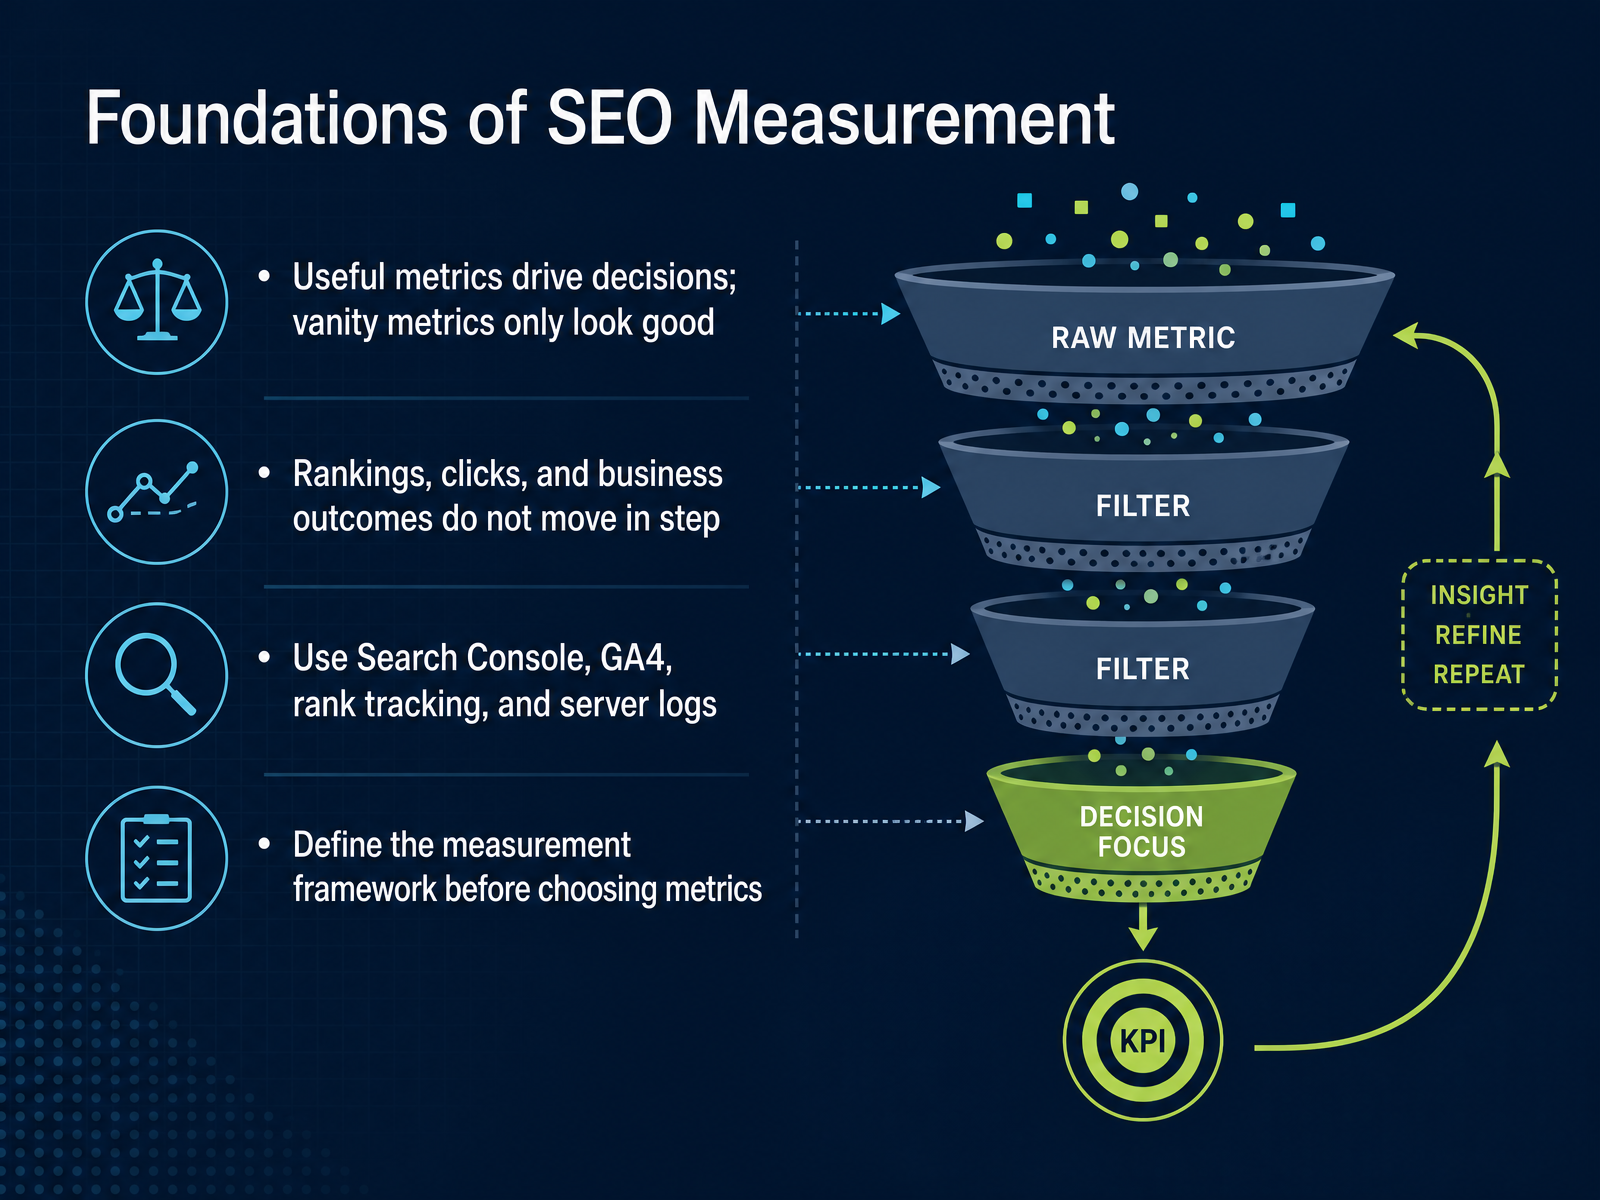
- 02Foundations of SEO MeasurementLet's start with the foundation. Before you open any dashboard, you need to know why you are measuring. Useful metrics drive decisions. Vanity metrics only look good in a report. Rankings, clicks, and business outcomes do not move in step. A page can rank number one for a query with no commercial intent and deliver zero revenue. Another page can rank eighth for a high intent query and win the deal. So keep those layers separate. Your toolkit should include Search Console for what happens on Google, GA4 for what happens on your site, rank tracking for visibility over time, and server logs when you need to verify how Googlebot actually behaves. Most important is this. Define the measurement framework before choosing metrics. Start with the business question. Are you diagnosing a traffic drop, evaluating content quality, or proving the value of a campaign? That decision tells you which data layers matter and which differences between tools you can safely ignore. Next, we will look at a structured way to read SEO data.
 support.google.comdevelopers.google.comsearchroost.com+21 min
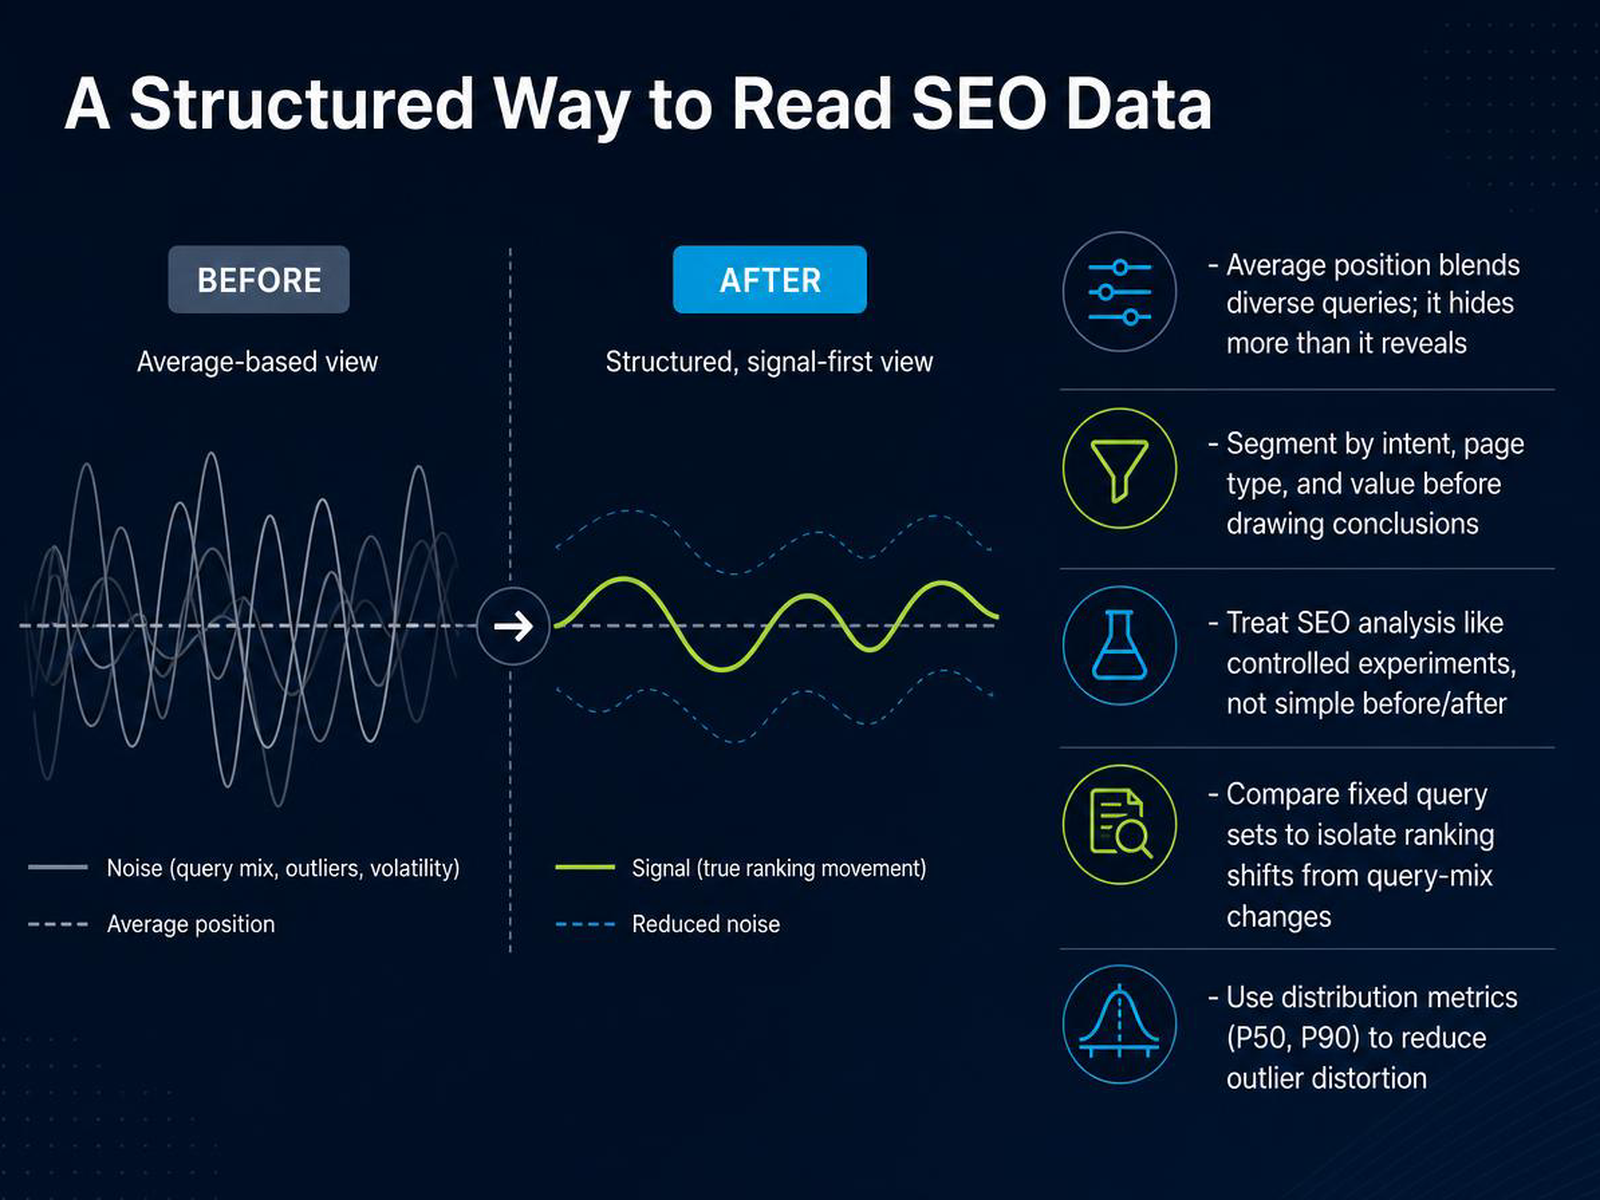
 - 03A Structured Way to Read SEO DataThis brings us to a more structured way of reading SEO data. The first thing to accept is that the average position metric in Search Console is a blended number. It averages your ranking across a huge mix of very different queries. Because of that, it often hides more than it reveals. A single page might rank first for a low-value term and fortieth for a term that matters to your business. The average won't show you that split. So before drawing any conclusions, segment your performance. Break the data down by search intent, by page type, and by the value those pages actually drive. Think of product pages differently from how you think of blog posts. Next, treat SEO analysis like a controlled experiment. Instead of a simple before and after view, compare a fixed set of queries over time. This isolates true ranking shifts from changes in your query mix. When your average position changes, ask why. Did your rankings move, or did the set of queries Google matched you for simply change? Finally, use distribution metrics. Look at the fiftieth and ninetieth percentiles for position. This reduces the distortion from outliers and gives you a more stable signal for trend direction. We'll build on this structured approach by looking at the core SEO metric categories next.
 support.google.comdevelopers.google.comsearchroost.com+21 min
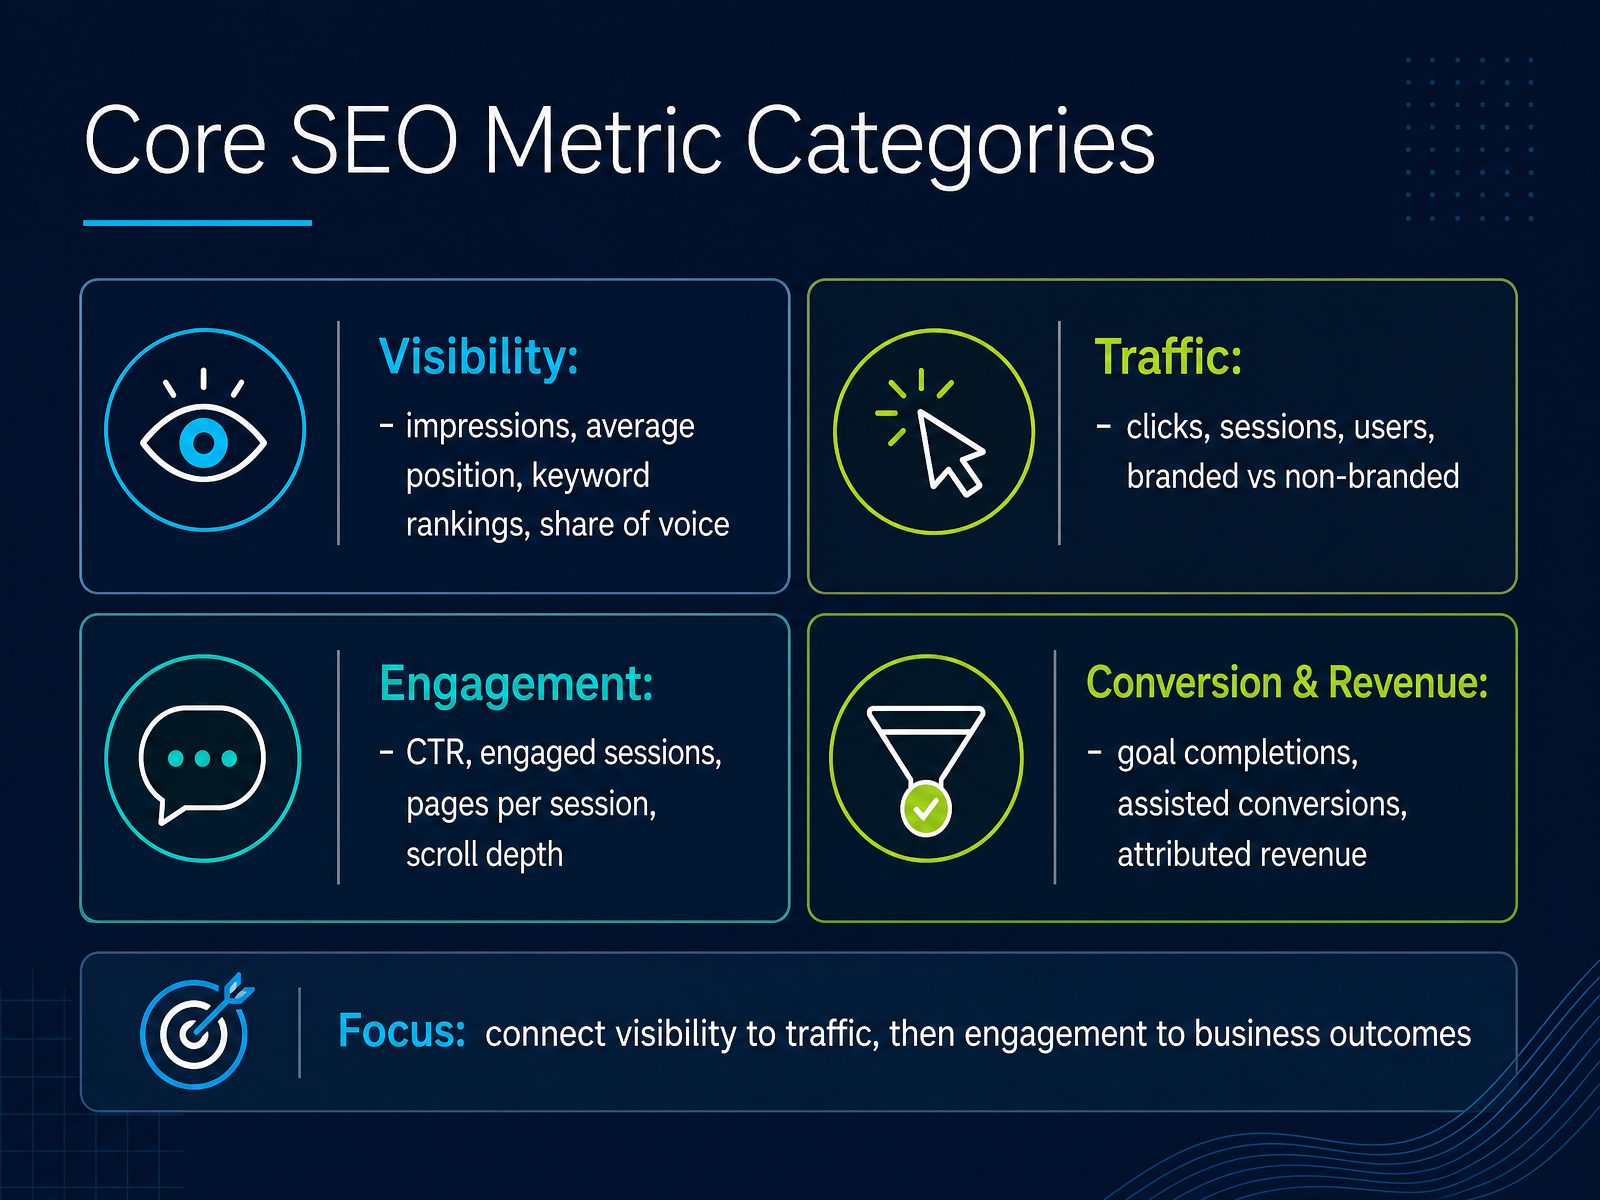
 - 04Core SEO Metric CategoriesLet's organize the core SEO metrics into four practical categories. First is visibility, which covers impressions, average position, keyword rankings, and share of voice. These tell us whether people can find you in search at all. Second is traffic, so clicks, sessions, users, and the critical split between branded and non-branded search. Non-branded traffic is the cleaner signal of how well you're acquiring new potential customers. Third is engagement, where CTR, engaged sessions, pages per session, and scroll depth show whether visitors actually find your content useful after they arrive. And fourth is conversion and revenue, which includes goal completions, assisted conversions, and attributed revenue. This is where SEO proves its business value. The real focus should always be on connecting these layers, linking visibility to traffic, and then linking engagement to business outcomes. A ranking is only meaningful if it drives clicks that convert. Now let's look at how these metrics function as leading and lagging indicators in SEO.
 keygrow.coblog.hubspot.comrankai.ai+21 min
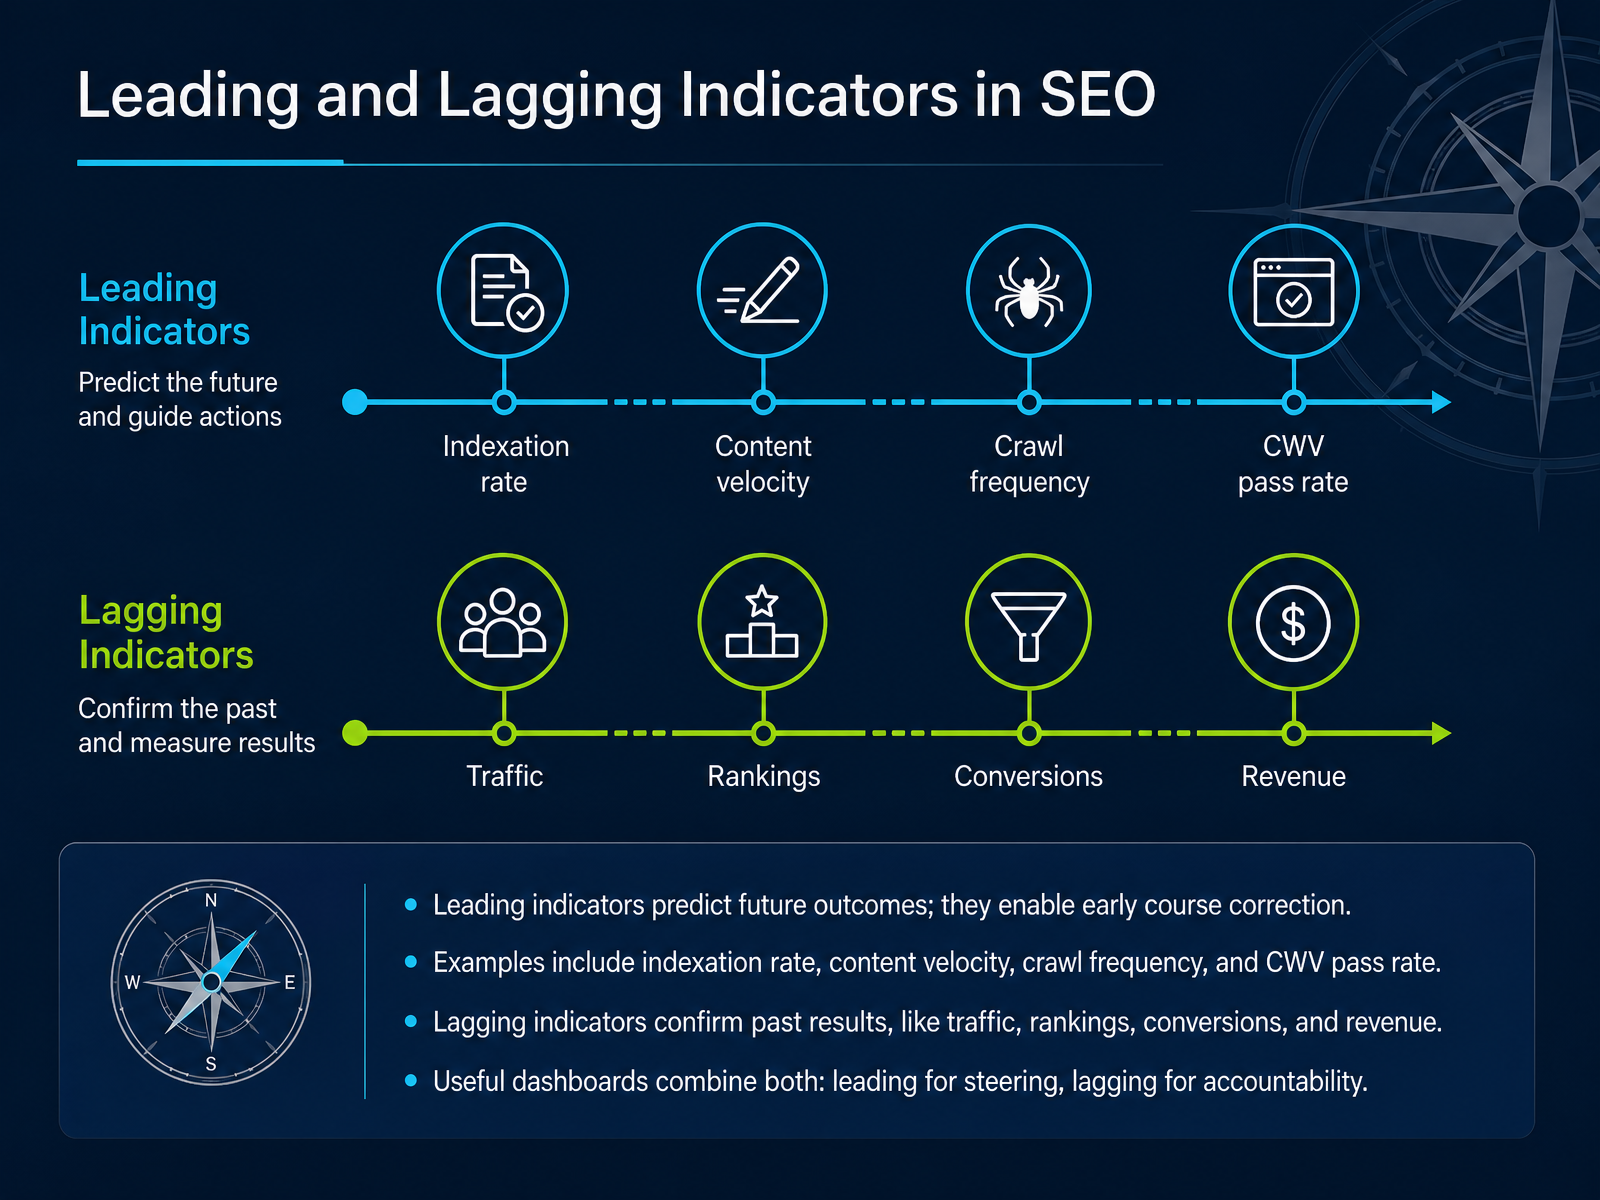
 - 05Leading and Lagging Indicators in SEOLet's talk about how leading and lagging indicators work together in SEO measurement. Leading indicators predict future outcomes, which means they give you room to correct course before problems show up in your results. Think about indexation rate, content velocity, crawl frequency, or your Core Web Vitals pass rate. These are signals you can act on now, not numbers you have to wait months to see move. Lagging indicators are the opposite. Traffic, rankings, conversions, and revenue confirm what already happened. They're essential for accountability, but by the time they shift, the cause is already behind you. The most useful dashboards combine both. You use leading metrics to steer the work week to week, and lagging metrics to prove the work is creating business value. If your dashboard is heavy on lagging numbers, you're driving with only a rearview mirror. Now let's look at how to interpret keyword rankings and visibility more closely.
 stridec.comscreamingcat.netawilix.ai+21 min
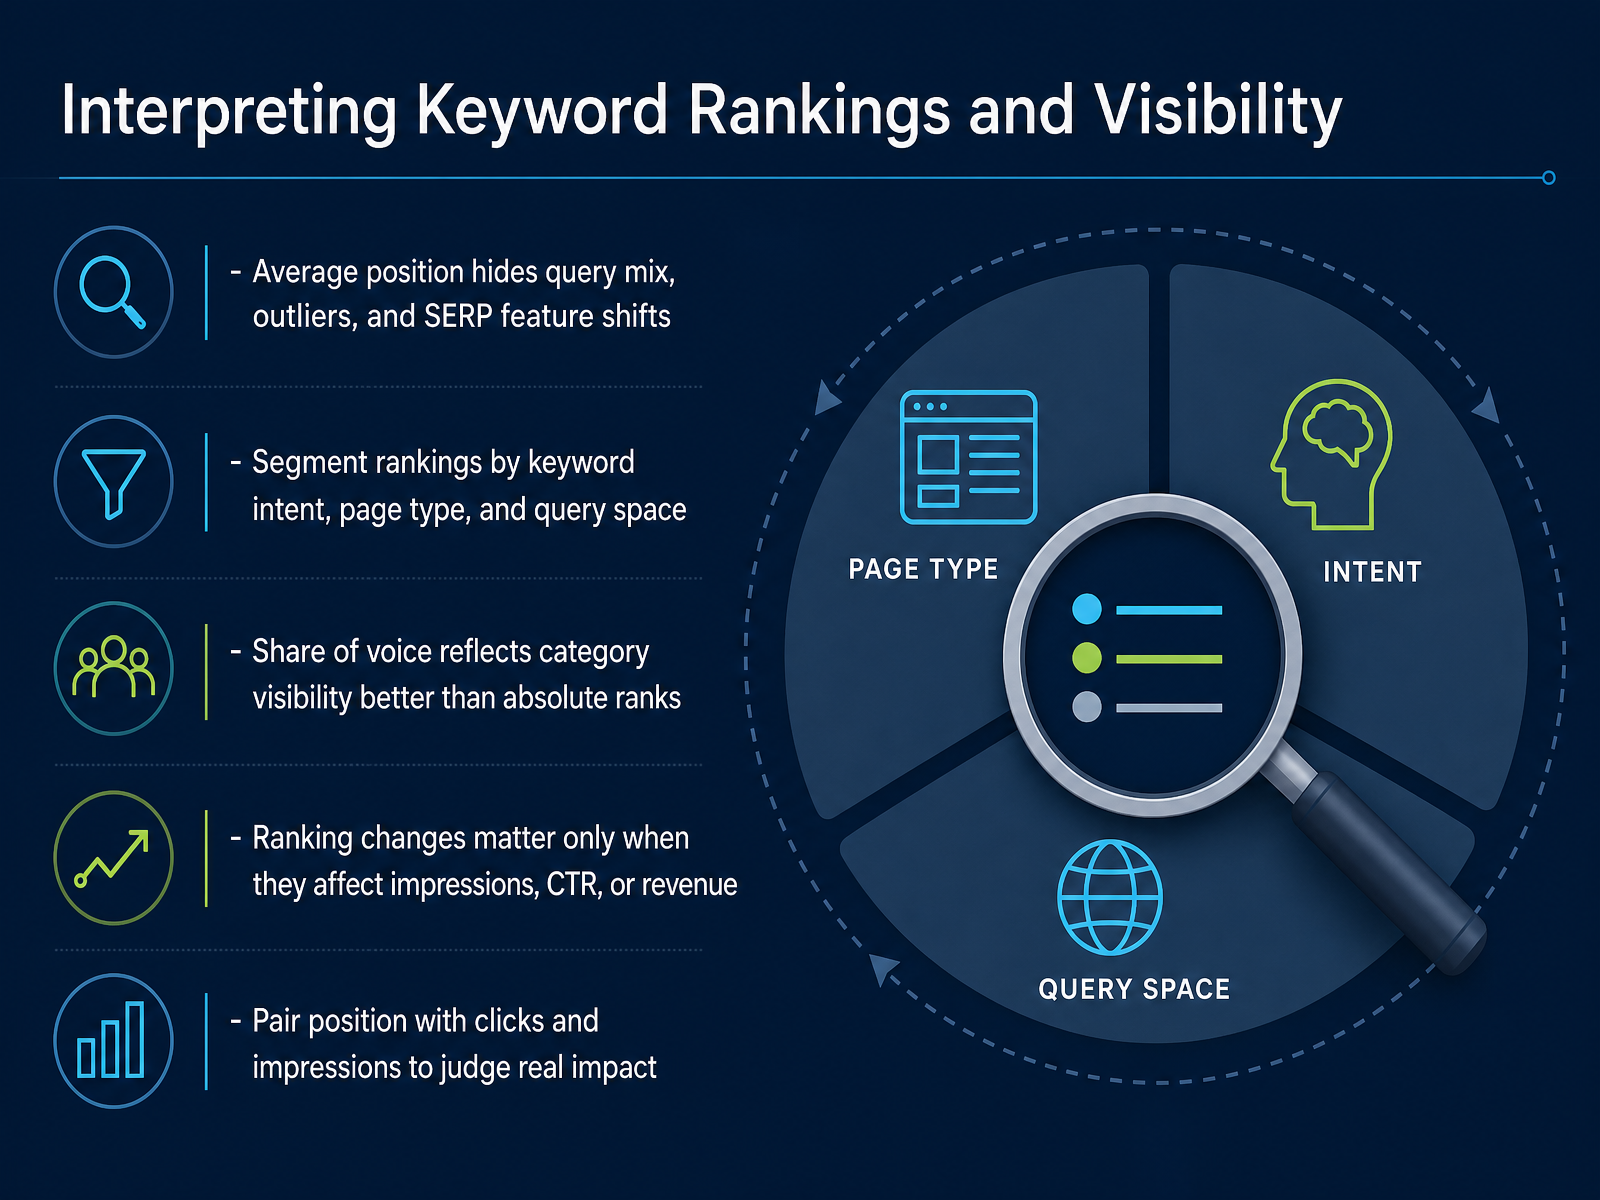
 - 06Interpreting Keyword Rankings and VisibilityNow, let's look at how to interpret keyword rankings and visibility. Average position is the metric everyone watches, but on its own, it can hide more than it reveals. It blends thousands of queries, different locations, and SERP layouts into one number. A high-volume head term might be stuck on page two while low-volume long-tail terms pull the average up. That leaves you with a healthy-looking number and zero meaningful traffic. The fix is segmentation. Group rankings by keyword intent. Informational, navigational, and transactional queries should never be judged together, because they have very different business value. You also need to segment by page type. A blog post ranking in position six is not the same as a product page in position six. For category-level health, look at share of voice. That tells you how visible you are within the total available search demand, which is more honest than absolute ranks. And when a ranking does move, always ask what changed in clicks or impressions. If position dropped but impressions held, the title or snippet might be the problem, not the page itself. A ranking change only matters when it changes behavior. Keep that pairing in mind. Next, we will diagnose how those shifts show up in traffic, CTR, and engagement.
 searchengineranktracker.comsearchenginejournal.comqueryscope.dev+22 min
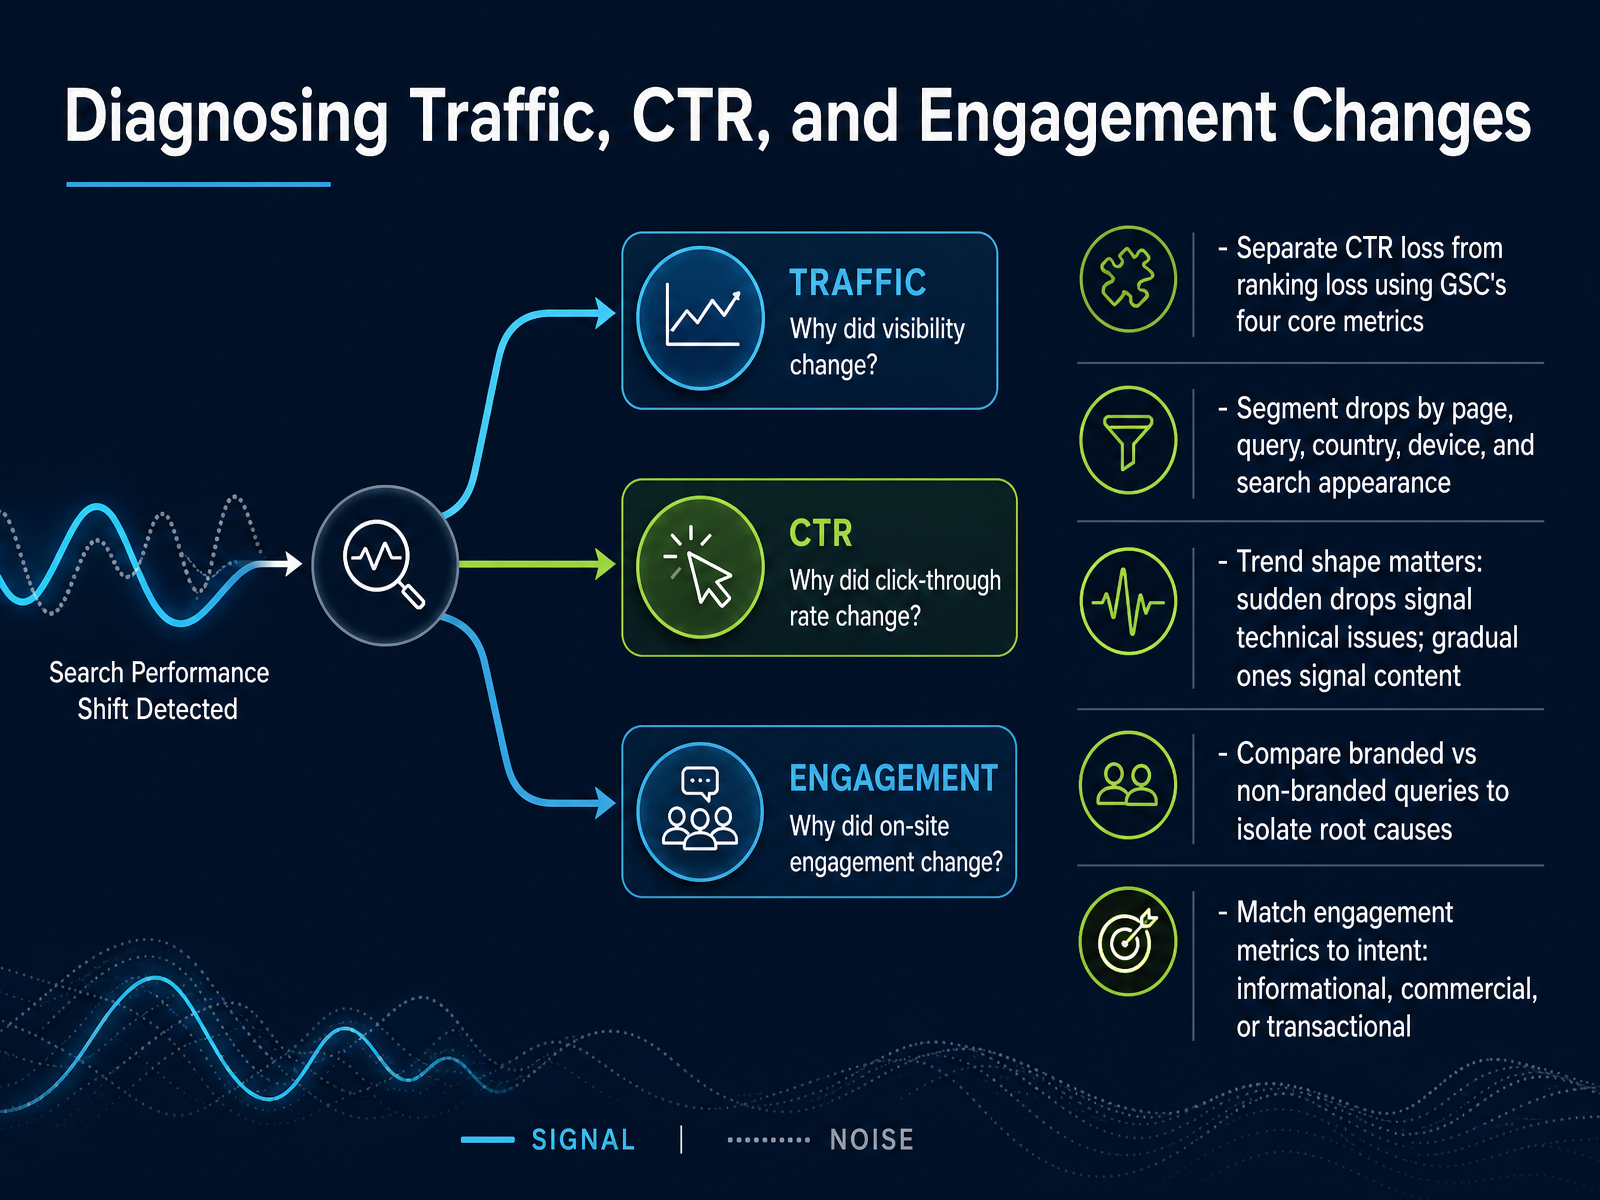
 - 07Diagnosing Traffic, CTR, and Engagement ChangesLet's get more precise about what's actually changing. To diagnose traffic, CTR, and engagement drops, you first need to separate a CTR loss from a ranking loss. Use Search Console's four core metrics together: clicks, impressions, average position, and CTR. If impressions and position stay steady while clicks fall, you have a presentation problem, not a visibility problem. But if position drops alongside impressions, you are looking at a ranking or indexing issue. The shape of the trend matters too. A sudden cliff often points to a technical fault, deployment, or manual action. A slow gradual decline usually signals stale content or a shifting search landscape that now favors competitors. Also segment the drop by page, query, country, device, and search appearance. A template-wide issue will show a clear pattern across one directory. And always compare branded versus non-branded queries. If only branded traffic is down, that is a demand or brand awareness problem, not an SEO failure. Finally, match engagement metrics to intent. Pages targeting informational queries should be judged on scroll depth or time on page, while transactional pages should be judged on clicks to checkout or form starts. Using the same engagement bar for both will lead you to the wrong conclusions. Next, we'll connect these diagnostics to the metrics that actually matter for the business: attributing conversions and revenue to SEO.
 2 min
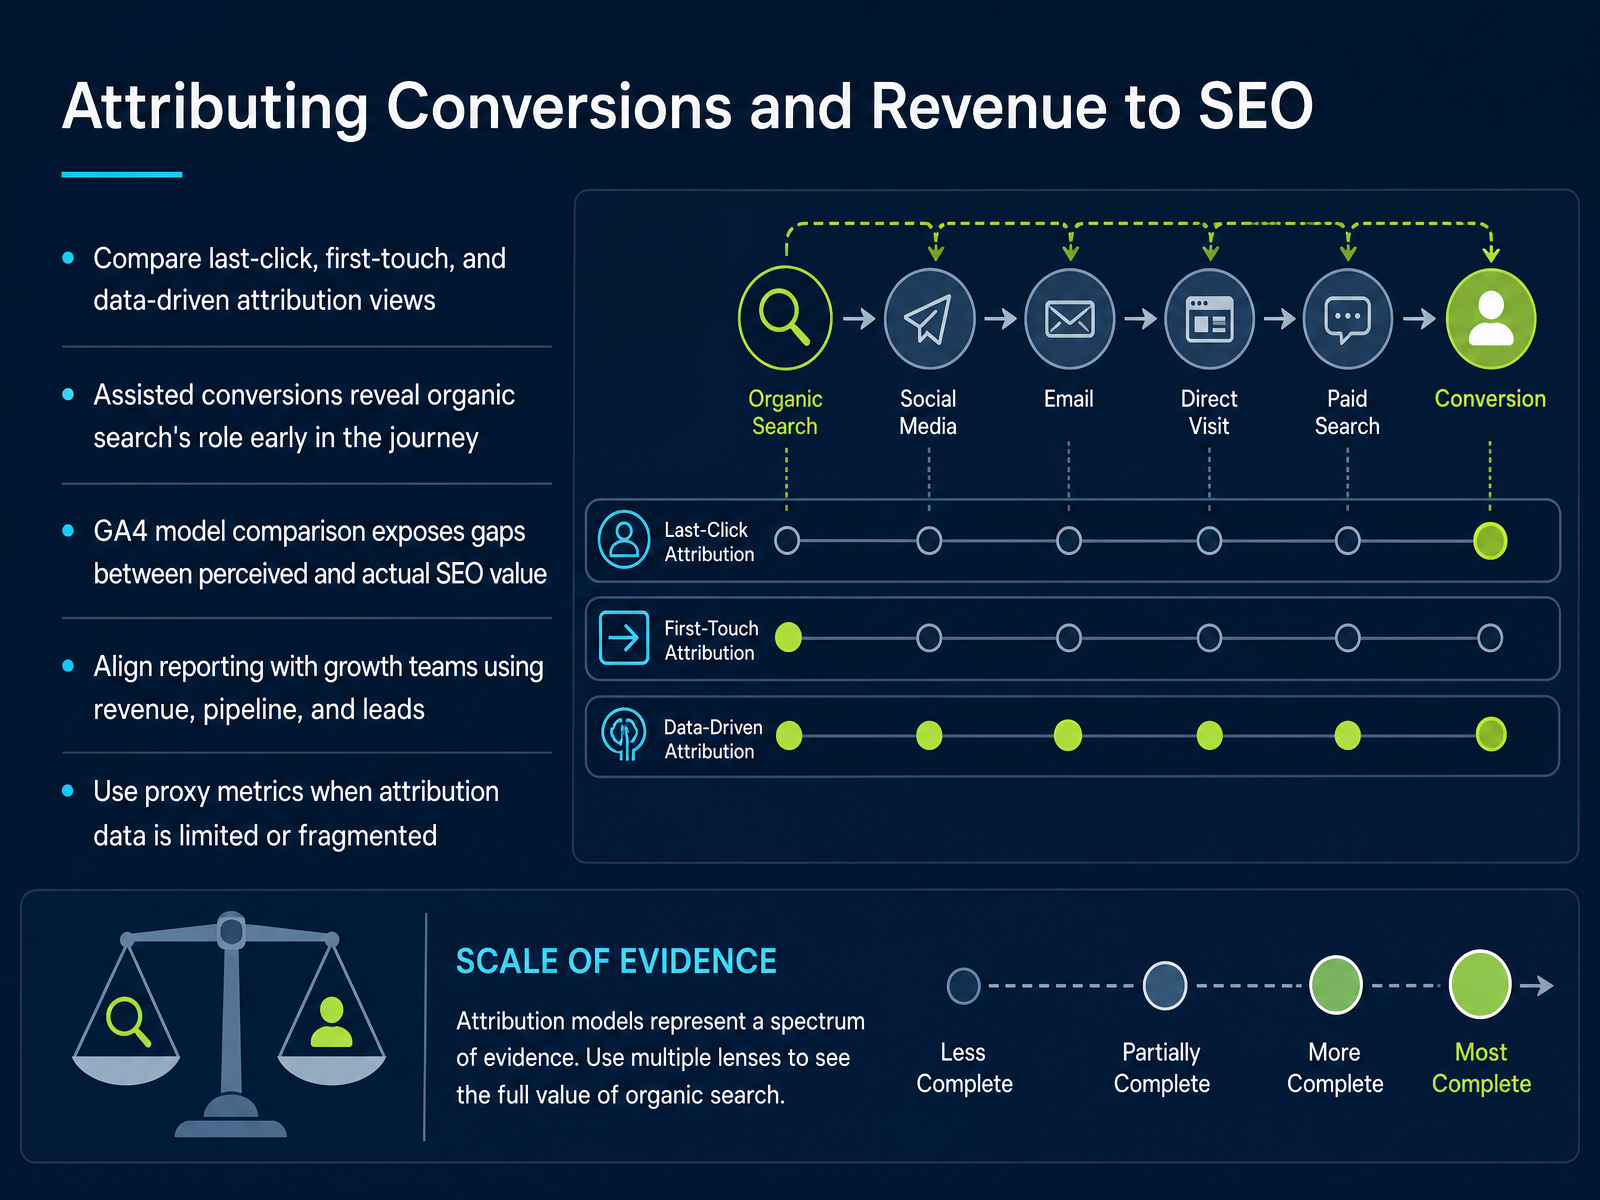
2 min - 08Attributing Conversions and Revenue to SEOLet's move into attribution, because this is where SEO's real contribution gets decided. If your reporting stops at last-click, you are likely undervaluing organic search every single week. Compare three views. Last-click gives all credit to the final touch, which favors direct visits and brand searches. First-touch gives everything to the first interaction, which overstates discovery content. Data-driven attribution sits in the middle, assigning fractional credit based on actual influence. The model comparison tool in GA four makes this gap visible. Set last-click next to data-driven, filter to organic, and the percentage change tells you whether SEO is truly a catalyst or just a passenger. Assisted conversions matter here, even though the report name has changed in GA four. Look for early and mid touchpoints in conversion paths. A blog post may close only five last-click conversions but assist fifty more. That is a top-of-funnel engine, not a failure. To align with your growth team, stop reporting rankings alone. Report revenue, pipeline, and qualified leads. And when attribution data is fragmented, use proxy metrics like organic-driven quote requests or demo bookings. Those tell the business story your sales team can act on. Next, we shift to the health of the machine itself: technical health and crawlability metrics.
 2 min
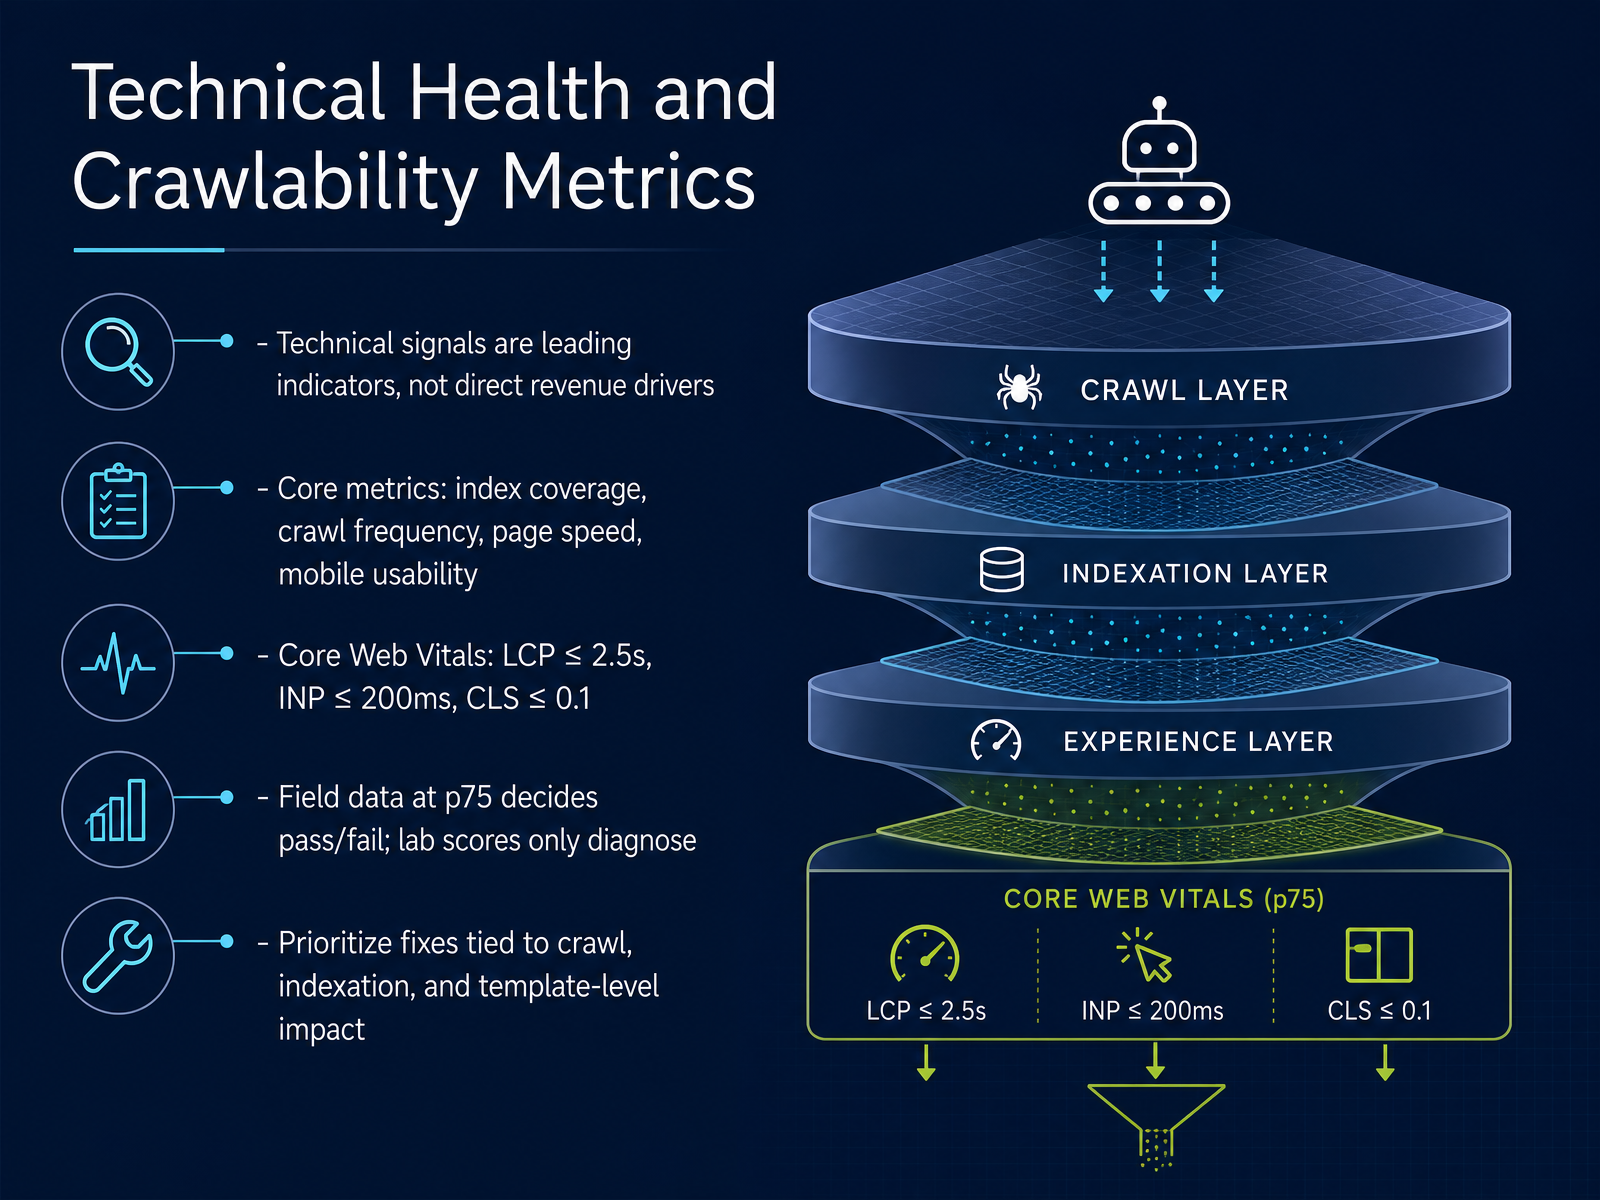
2 min - 09Technical Health and Crawlability MetricsNow let's shift from traffic outcomes to the technical signals that make them possible. When we talk about technical health, remember that these metrics are leading indicators, not direct revenue drivers. A fast page won't sell your product, but a slow one will absolutely prevent that sale from happening. The core areas we track are index coverage, crawl frequency, page speed, and mobile usability. For page speed, the practical targets are the Core Web Vitals. That's an LCP of two point five seconds or less, an INP of two hundred milliseconds or less, and a CLS of zero point one or less. The key detail here is that you must look at field data at the seventy-fifth percentile. Lab scores from tools like Lighthouse are useful for diagnosing problems, but they don't determine pass or fail. Real user data does. Now, when you're prioritizing fixes, don't start with the metric that's easiest to tweak. Focus on issues that block crawling, prevent indexation, or that affect an entire template. A single template fix can resolve problems across thousands of URLs at once. That's where your engineering time pays off fastest. Next, we'll move into how you can use competitive SEO benchmarking to put these numbers in context.
 2 min
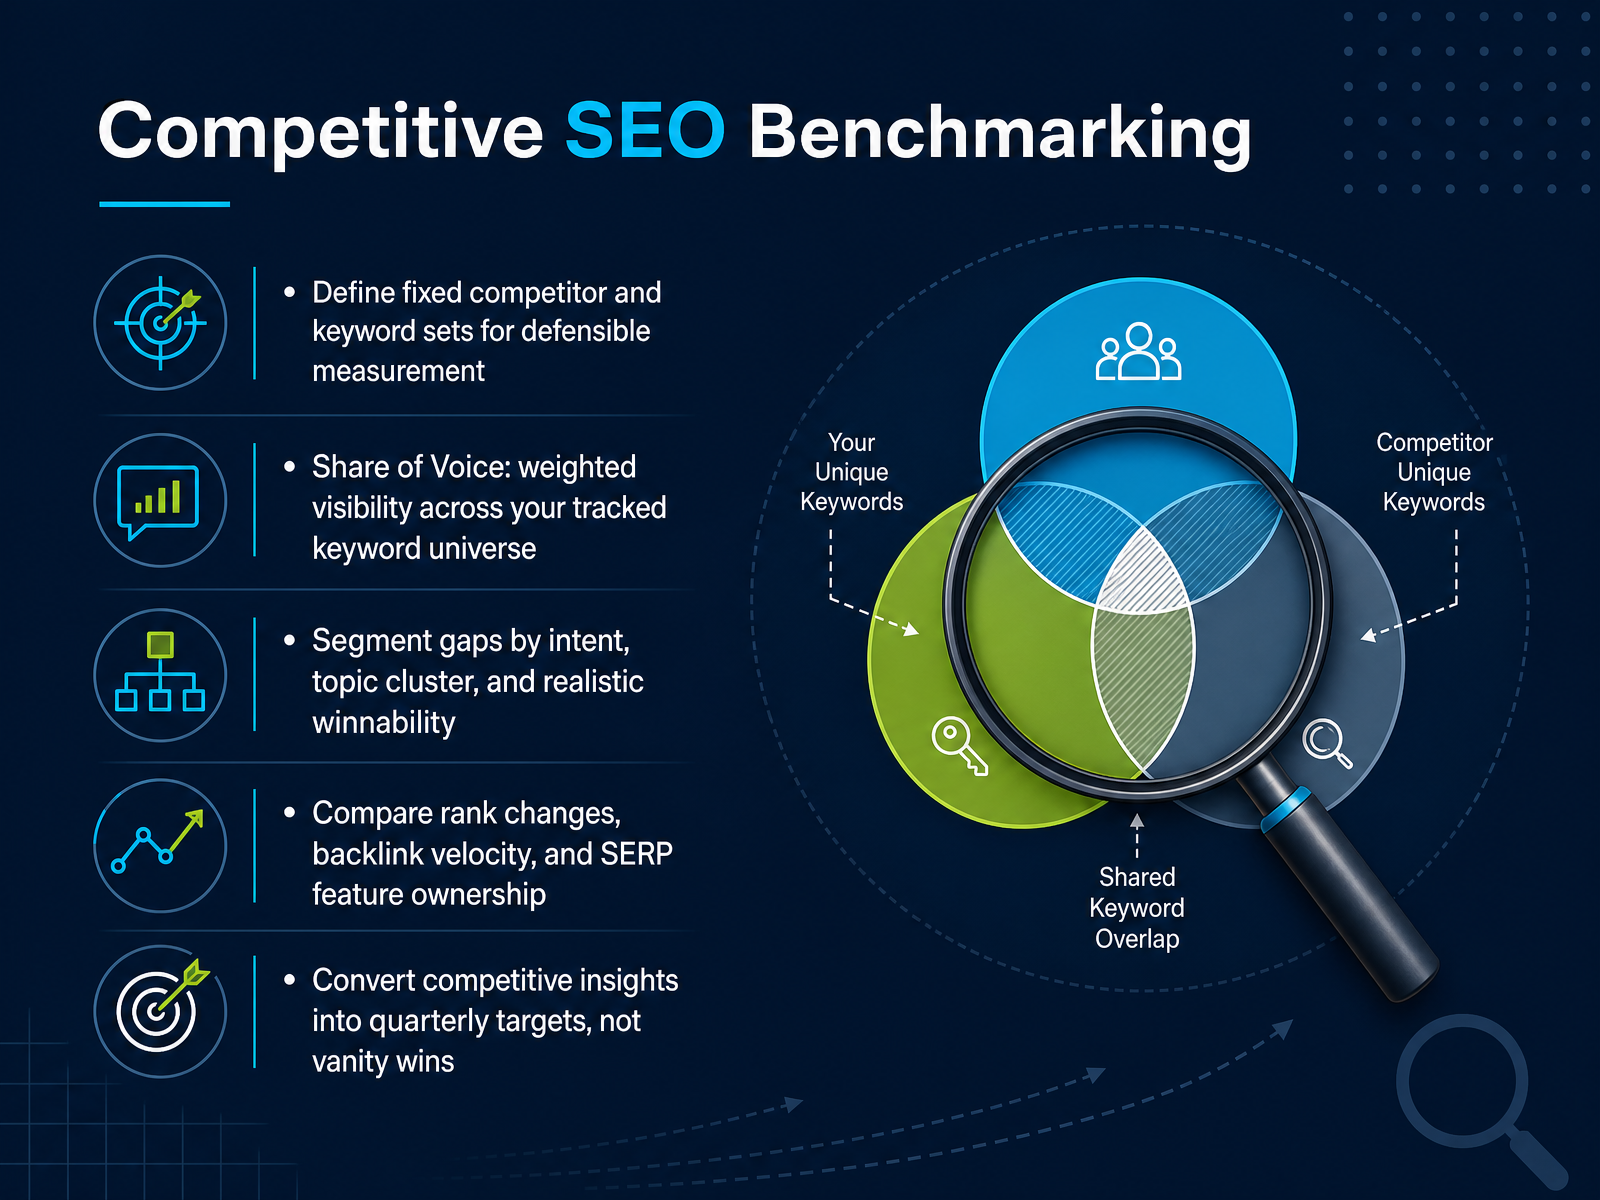
2 min - 10Competitive SEO BenchmarkingLet’s move into competitive benchmarking, because SEO gains only mean something when you measure them against a stable baseline. Start by defining a fixed set of competitors and keywords. If you let that universe shift every month, your share of voice becomes useless because you keep changing the denominator. Share of voice itself is weighted visibility across your tracked keyword set, which means it accounts for search volume and click-through rates, not just raw rankings. A term with ten searches should not count the same as one with ten thousand. Once you have that number, segment the gaps by intent, topic cluster, and realistic winnability. A low share on a high-difficulty, high-volume head term is a different problem than a low share on a long-tail cluster where you already have partial coverage. Then compare rank changes, backlink velocity, and SERP feature ownership. Backlink velocity often tells you who is about to move before the rankings do, and owning a featured snippet can change your visibility without changing your position. Finally, convert those insights into quarterly targets, not vanity wins. Pulling one or two high-visibility snippets is often more valuable than adding twenty low-intent rankings. Up next, we’ll bring these benchmarks together in building SEO dashboards and reports.
 2 min
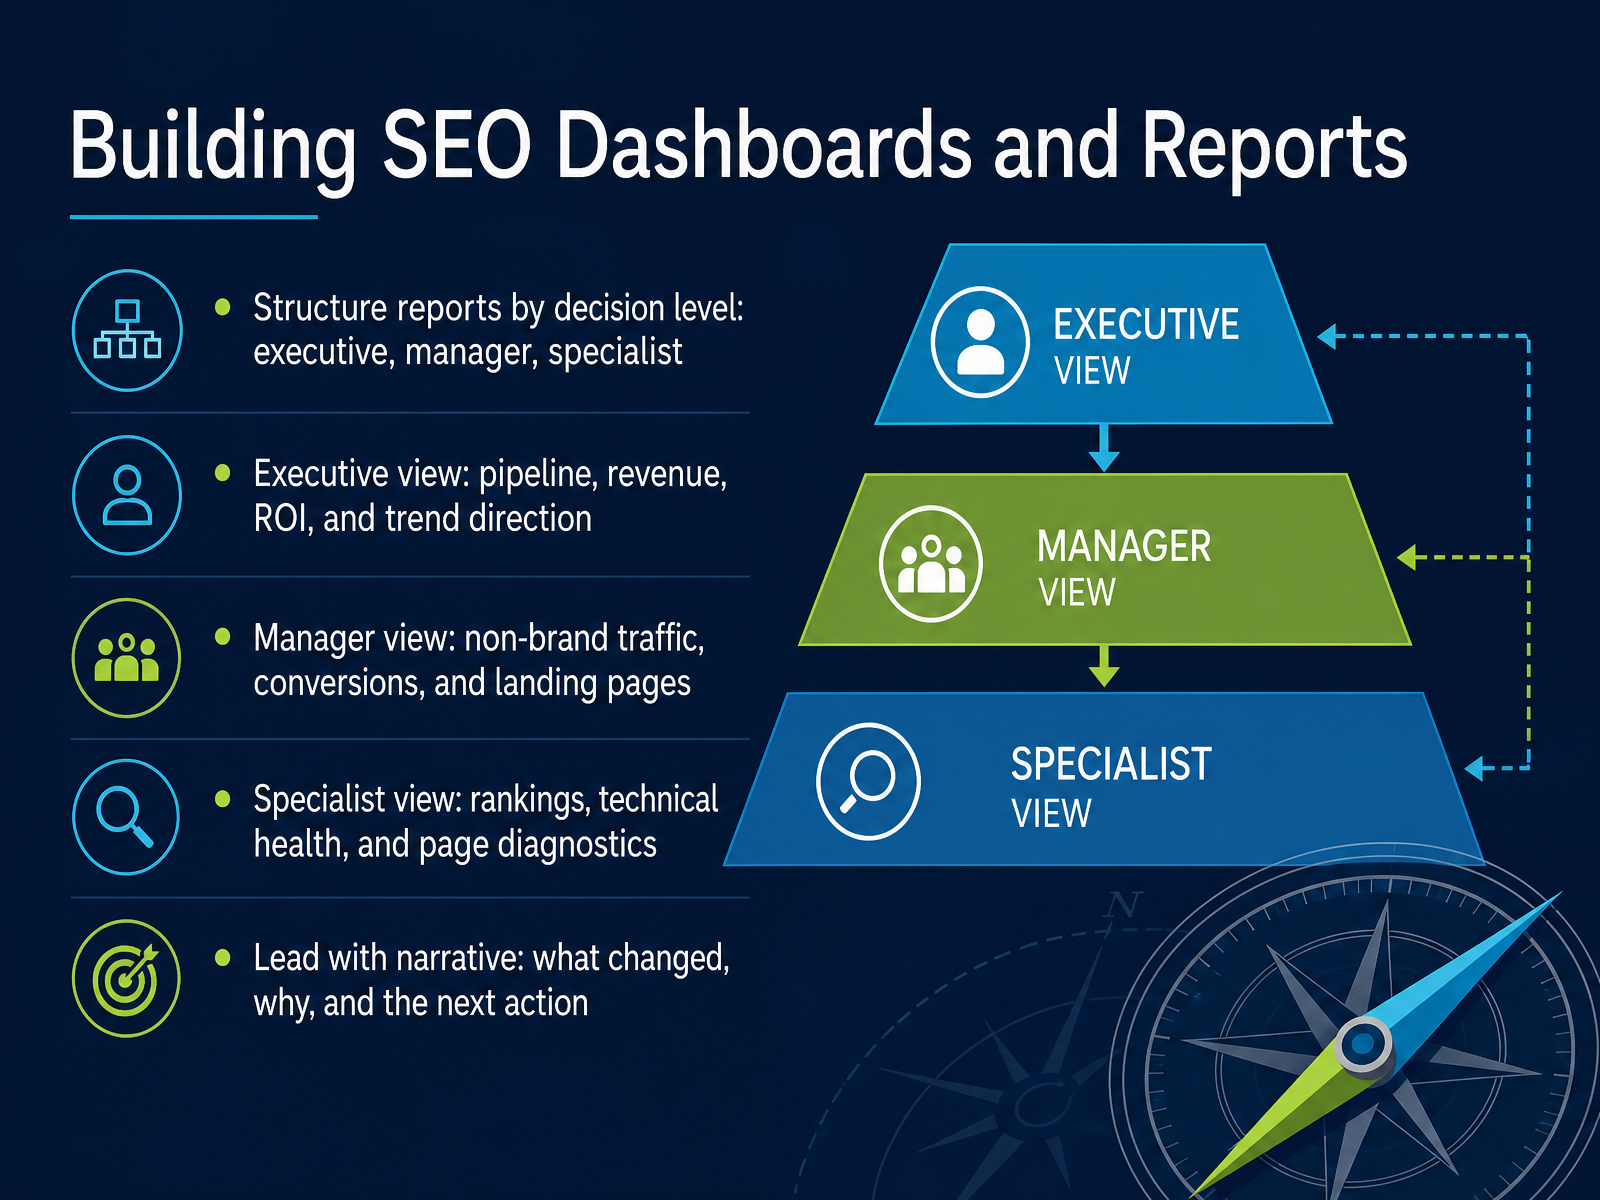
2 min - 11Building SEO Dashboards and ReportsNow let's turn reporting into a tool for decisions, not just a regular update. The key is to structure your dashboard by decision level, because an executive, a manager, and a specialist are asking very different questions. The executive view should be a fast read. Lead with pipeline, influenced revenue, and return on investment. Show trend direction, and avoid raw query tables. A manager needs context for growth. Focus that view on non-brand traffic, conversions by landing page, and momentum in priority segments. Specialists need the diagnostic layer where the work actually happens. That means ranking shifts, technical health, indexation issues, and page-level drill-downs. Above all, lead with a narrative. State what changed, why it changed, and the next action you recommend. A number that does not point to a decision is just noise. So keep each metric tied to the question it answers for that audience. That discipline makes the difference between a report people skim and a dashboard people use to move faster. Next, let's put all of this interpretation into practice.
 1 min
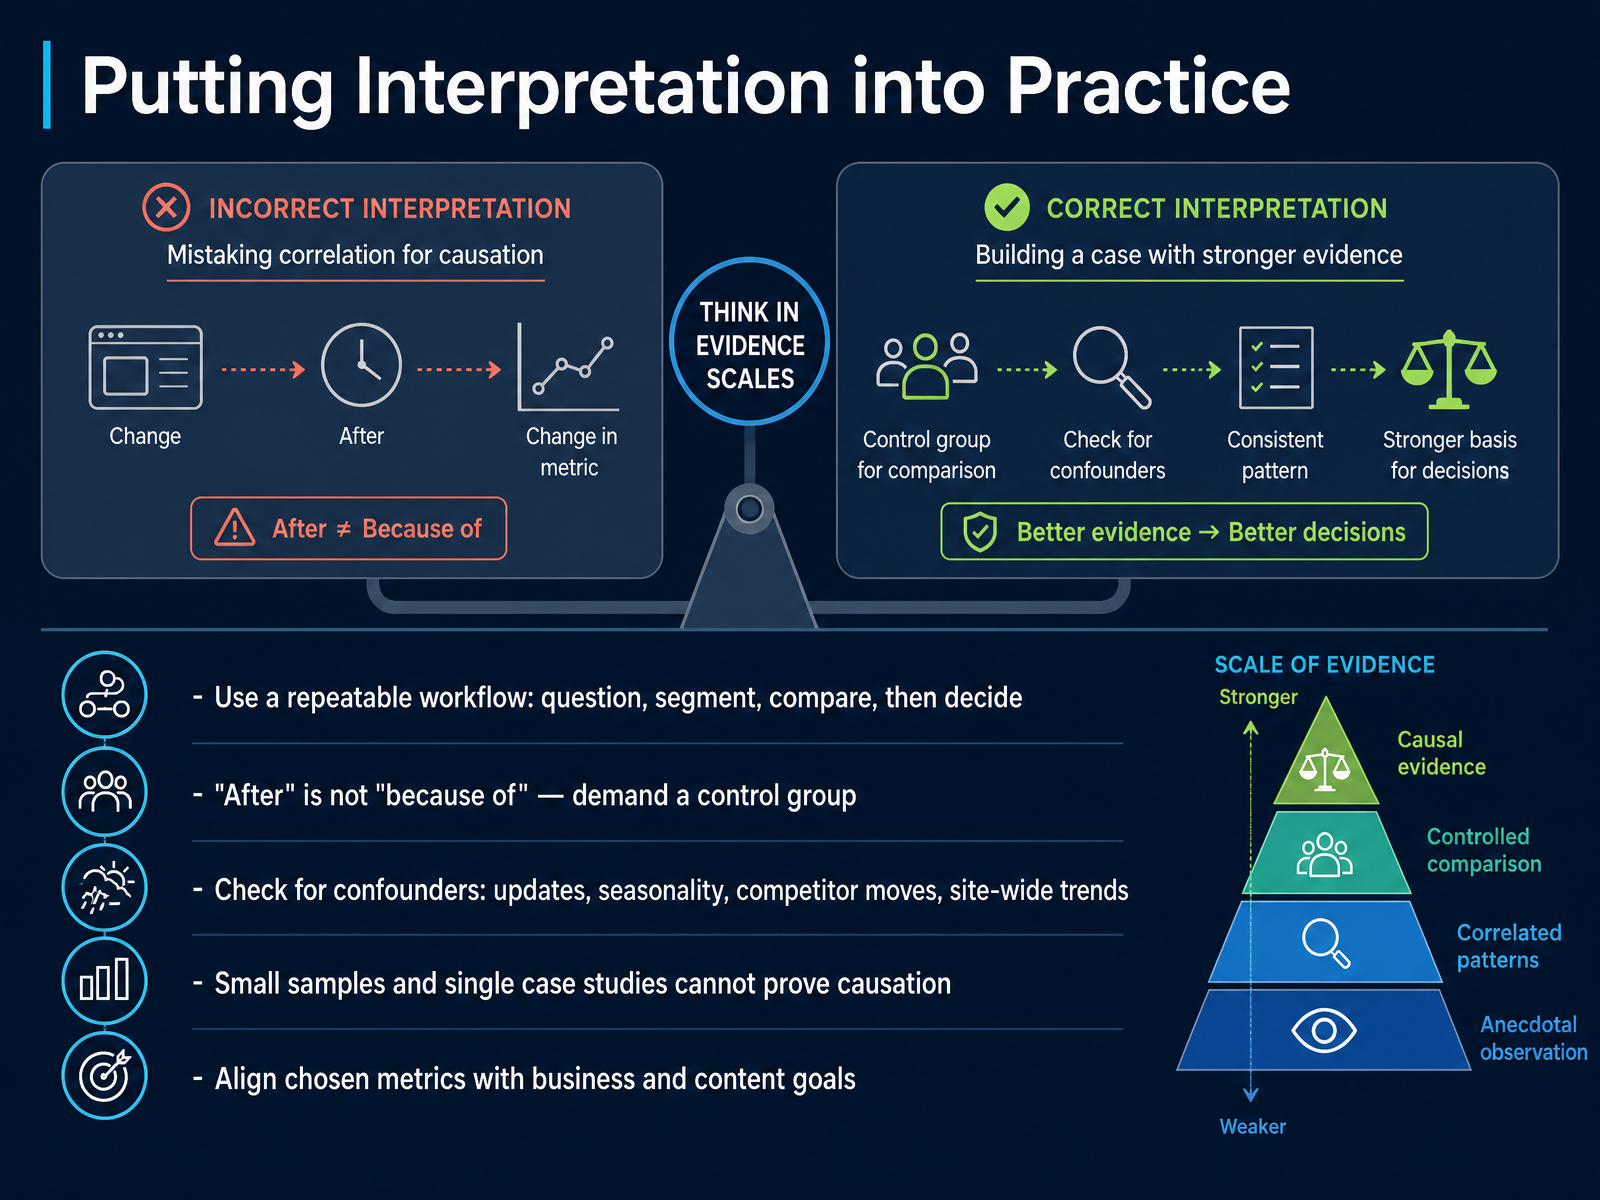
1 min - 12Putting Interpretation into PracticeLet's turn everything we have covered into a workflow you can actually use. Every analysis should start with a question, not a dashboard. Segment the data, compare it against a meaningful baseline, and only then make a decision. The most important discipline here is this: after is not because of. If you changed a headline and traffic went up, you cannot claim credit unless you have a control group or a counterfactual to compare against. Always check for confounders. A core algorithm update, a seasonal spike, a competitor's outage, or a site-wide redesign can all move your numbers independently of your change. And remember, a single case study or a small sample size cannot prove anything. One blog post moving from rank eight to rank three is an anecdote, not evidence. Finally, align your metrics with your actual business and content goals. A traffic increase that brings in low-intent visitors is not automatically a win. By applying this repeatable, disciplined process, you move from guessing with extra steps to making decisions you can actually defend. Thank you for joining this course, and good luck with your next analysis.
 2 min
2 min
Take the deck with you
Download this course as a file — free, no sign-up needed.
- PDF handoutEvery slide page, ready to print or share.13 pages · 2.9 MBDownload
- Narrated PowerPointThe deck that presents itself — every slide carries the digital human's narration video.13 pages · 13.7 MBDownload
- PowerPoint slidesThe full deck as a .pptx — open it in PowerPoint, Keynote, or Google Slides.13 pages · 2.8 MBDownload
Free to use in your own training — please keep the PersonWise credit page at the end.
Have your own deck? Turn it into a course
Sources consulted
Web sources consulted while building this course.
- How to Track SEO: Metrics, Tools and Cadence — keygrow.co
- KPI in SEO: The Metrics That Actually Matter in 2026 — blog.hubspot.com
- SEO KPIs Guide 2026: 31 Metrics to Track and Report — rankai.ai
- 12 SEO KPIs to Track in 2026 (+ How to Measure Them) — bridgewaydigital.com
- SEO Dashboard Metrics: The Complete 2026 Guide — quickseo.ai
- What are impressions, position, and clicks? - Search Console Help — support.google.com
- Using Search Console and Google Analytics Data for SEO — developers.google.com
- GA4 vs Search Console for SEO: What Each Measures (and Misses) | Search Roost — searchroost.com
- [UA] Search Console reports — support.google.com
- Ask an SEO: Why's GA4 Reporting Higher Traffic Than GSC? — searchenginejournal.com
- SEO KPIs in 2026: A Working Taxonomy of Leading, Lagging, and Citation Metrics - Stridec — stridec.com
- 11 Actionable SEO KPIs to Track for Real Growth | ScreamingCAT — screamingcat.net
- SEO KPIs: The Metrics That Actually Tell You If SEO Is Working — awilix.ai
- How to Measure SEO Success in 2025 — thestarrconspiracy.com
- How To Prove (And Improve) SEO Performance At An Enterprise Level — semrush.com
- What Is Average Position and When It Misleads You - Search Engine Rank Tracker — searchengineranktracker.com
- Is It Time To Remove Focus From Average Position In GSC? — searchenginejournal.com
- Google Search Console metrics explained · QueryScope — queryscope.dev
- Average Position in GSC: How to Prioritize SEO Work — seo-brain.net
- How to Read Average Position in Google Search Console - Screpy — screpy.com