Business Intelligence Analyst Role Overview
Begin
14 pages · ~28 min
Business Intelligence Analyst Role Overview
This training explains the role and responsibilities of a Business Intelligence Analyst, ideal for aspiring analysts and professionals exploring BI careers.
What you’ll learn
- 01What Does a Business Intelligence Analyst Do: Role Overview and ScopeWelcome. If you're exploring a career in business intelligence, or you already work with a BI team, this course is for you. Over the next fourteen slides, we'll cover what a business intelligence analyst actually does, the skills that matter, and how the role creates value.
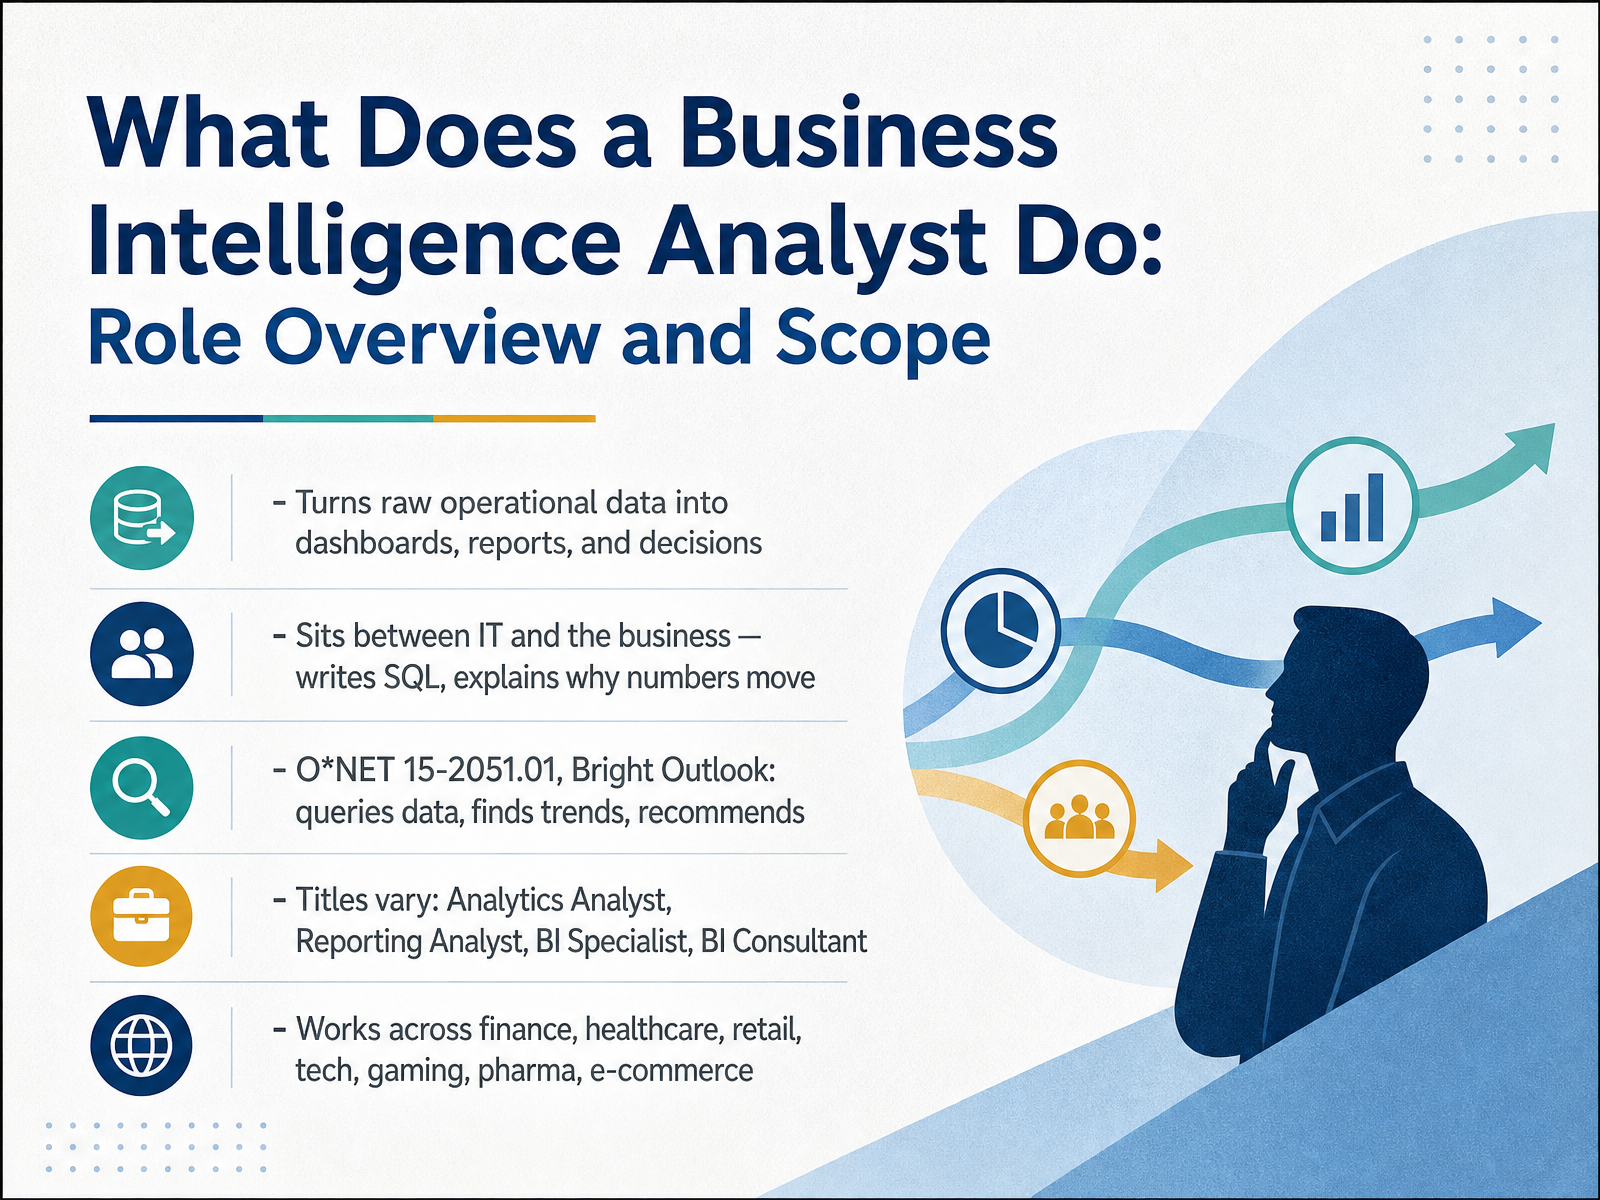
Let's start with the big picture. A BI analyst turns raw operational data into dashboards, reports, and decisions. You sit between IT and the business. That means you write SQL to pull and shape data, but you also explain why a number moved and what it means.
The official O*NET code for this role is 15-2051.01, and it carries a Bright Outlook designation. The core work: query data repositories, find trends, and recommend action.
Titles vary. You might see Analytics Analyst, Reporting Analyst, BI Specialist, or BI Consultant. The label changes, but the job stays similar.
Industries are wide open too. Finance, healthcare, retail, tech, gaming, pharma, and e-commerce all hire BI analysts.
So keep one idea in mind: your job is to make numbers make sense to the people who act on them. Next, we'll dig into the core purpose: turning data into defensible decisions.indeed.comcareeronestop.orgresources.rework.com+22 min
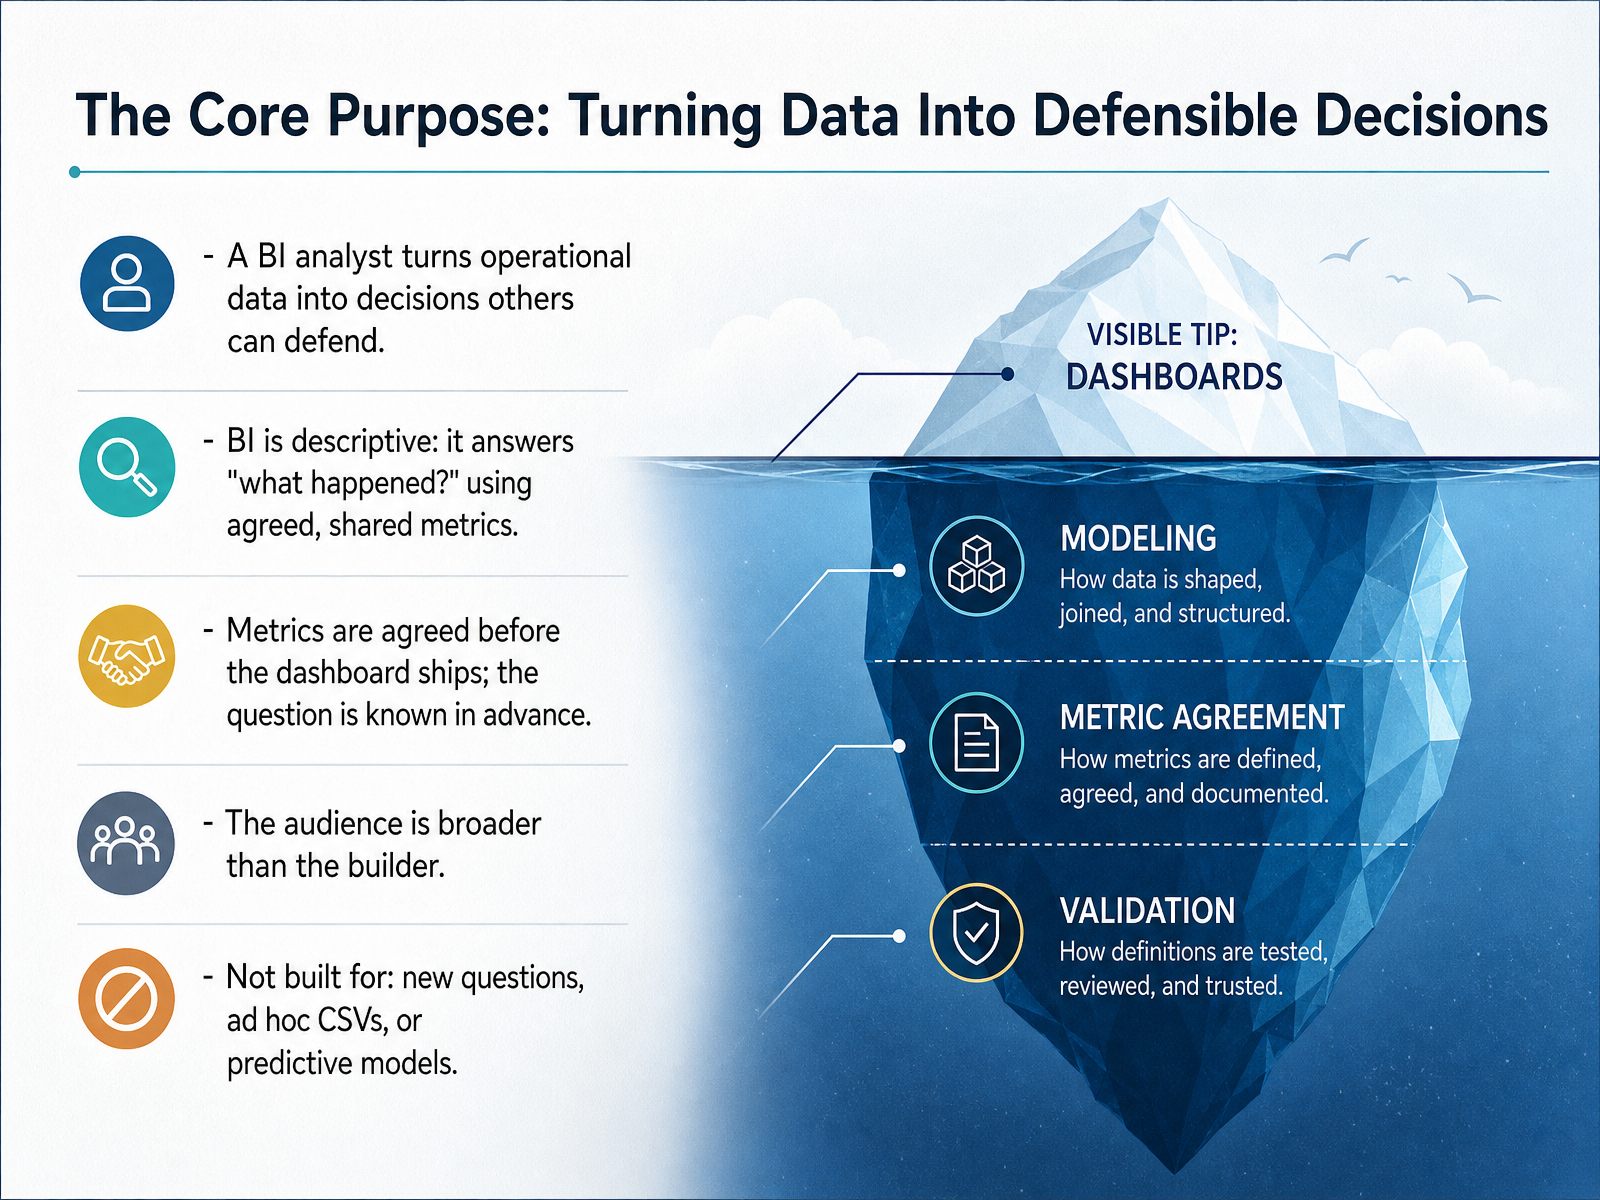
- 02The Core Purpose: Turning Data Into Defensible DecisionsSo let's get to the heart of it: the core purpose of a BI analyst is turning data into decisions other people can defend. That word matters. Defensible means the numbers hold up when someone challenges them in a meeting. BI is descriptive. It answers one question: what happened? And it answers it using agreed, shared metrics. Here's the key discipline. Metrics get agreed before the dashboard ships, not after. The question is known in advance. You already decided that weekly revenue by segment is worth watching. Also remember, the audience is broader than the builder. Executives, operators, and account managers all read the same chart without writing any SQL. But BI is not built for everything. It's not for brand new questions that arrived this morning. It's not for joining a spreadsheet someone emailed you last night. And it's not for predictive models about next quarter. Those are real needs, just different work. What BI gives you is a trusted, repeatable number that a whole team can act on. Coming up next, we'll compare this role to adjacent data roles: BI Analyst versus Adjacent Data Roles.
 techcults.comskopx.compost.edu+22 min
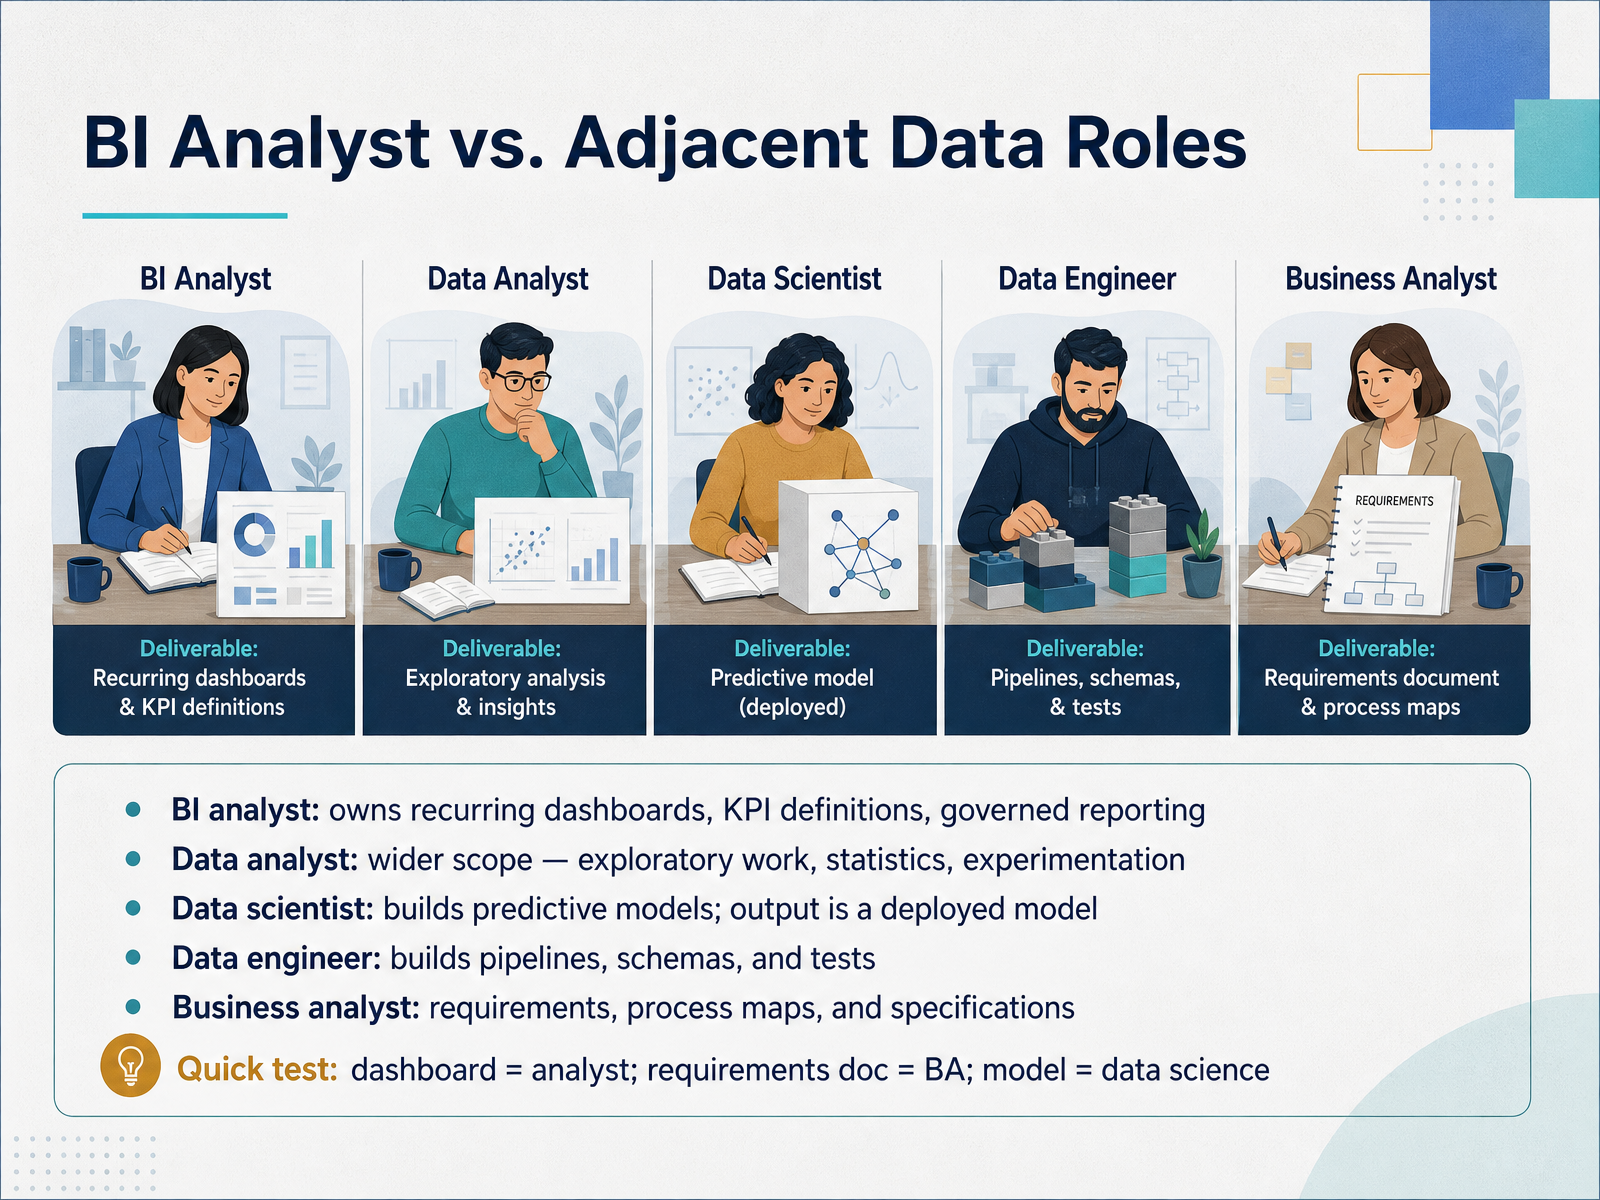
 - 03BI Analyst vs. Adjacent Data RolesNow let's clear up a common source of confusion: how the BI analyst role differs from the data jobs around it. The BI analyst owns recurring dashboards, KPI definitions, and governed reporting. If a number appears in the same executive view every Monday, that is usually BI territory. A data analyst has a wider scope, covering exploratory work, statistics, and experimentation. A data scientist builds predictive models, and the output is a deployed model, like a churn predictor. A data engineer builds the pipelines, schemas, and tests that keep the data flowing and reliable. And a business analyst handles requirements, process maps, and specifications. Here is a quick test for you. If the deliverable is a dashboard, think analyst. If it is a requirements document, think business analyst. If it is a model, think data science. These boundaries overlap in real teams, but knowing the center of gravity helps you read any job description. Next, we will look at the honest weekly shape of the job.
 techietory.comsoftenant.comdatatheta.com+21 min
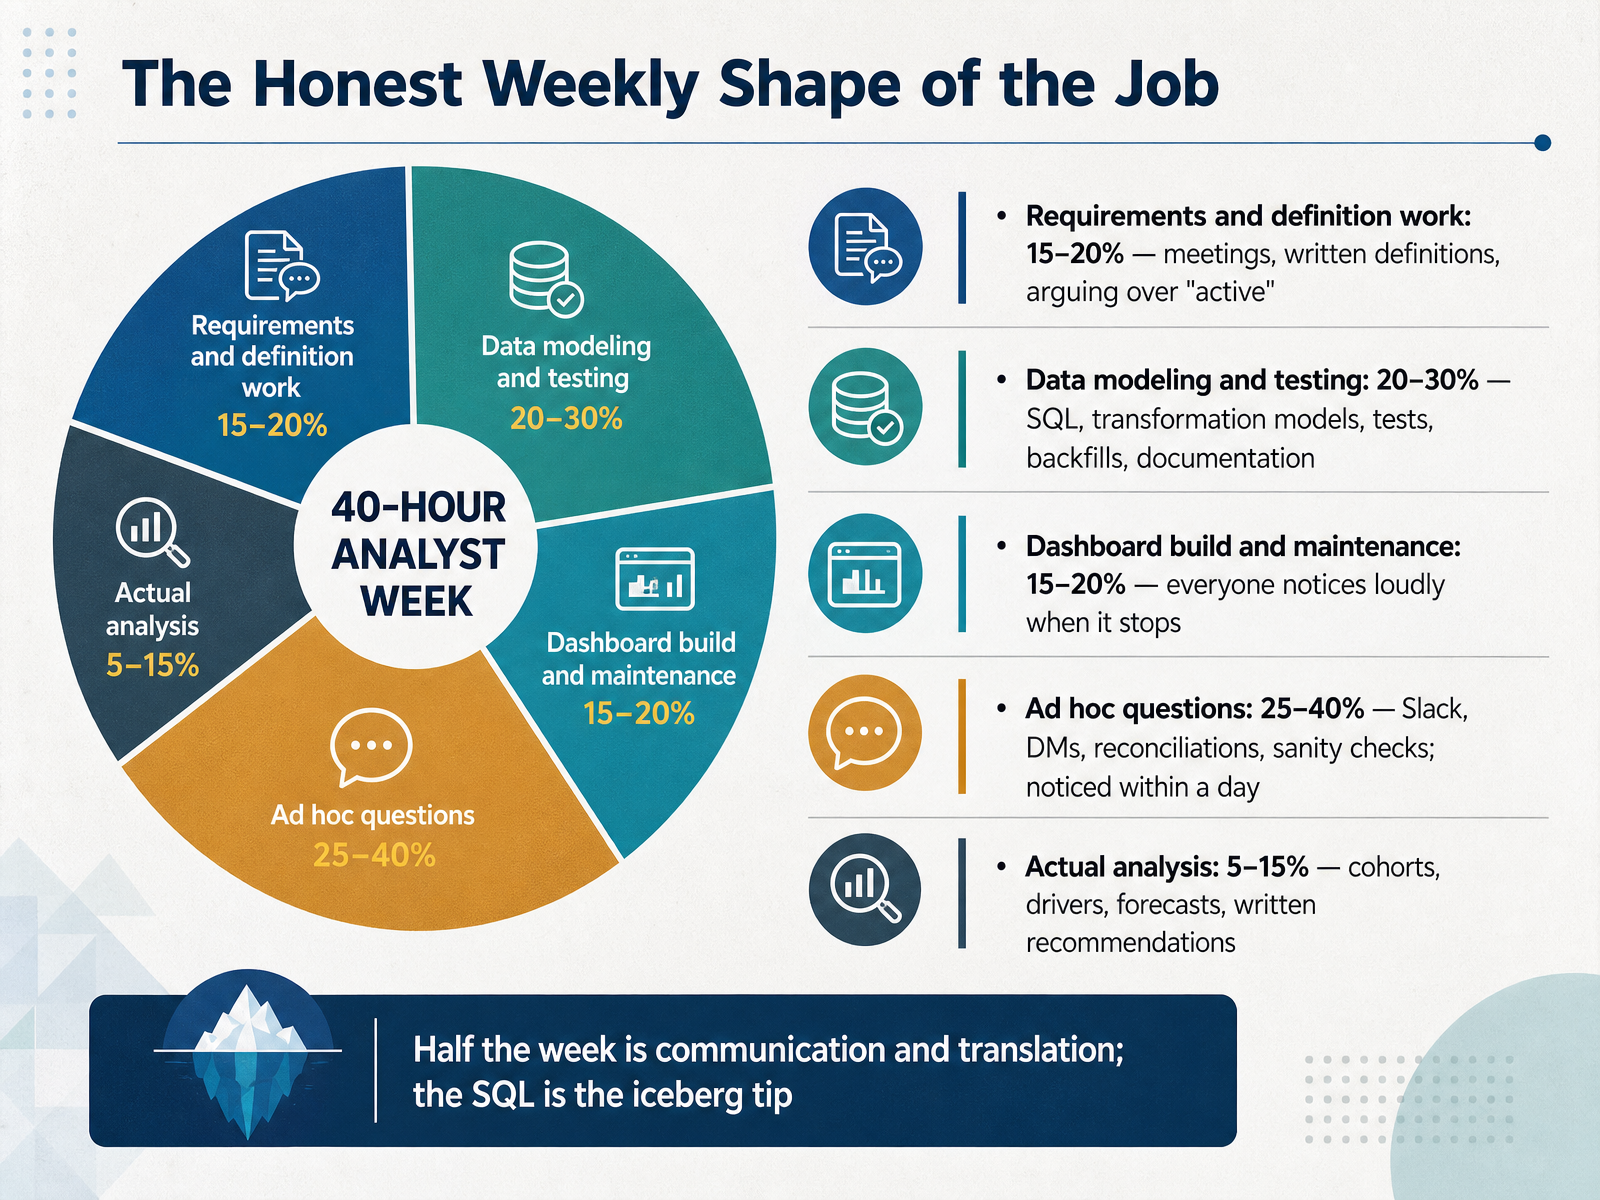
 - 04The Honest Weekly Shape of the JobNow let's look honestly at how a BI analyst's week is actually shaped. It is not all modeling and deep analysis. Requirements and definition work takes fifteen to twenty percent. That means meetings, written definitions, and yes, arguing over what active means. Data modeling and testing takes twenty to thirty percent. That is SQL, transformation models, tests, backfills, and documentation. Dashboard build and maintenance takes fifteen to twenty percent, and everyone notices loudly when a dashboard stops working. Ad hoc questions take the largest share, twenty five to forty percent. Slack messages, direct messages, reconciliations, and sanity checks, often noticed within a day. Actual analysis is only five to fifteen percent. Cohort work, driver analysis, forecasts, and written recommendations. Here is the honest takeaway. Roughly half your week is communication and translation, not query writing. The SQL is the iceberg tip. Everything else is the job, and it is what builds trust. Next, we will walk through the BI analyst workflow from question to decision: A Day in the Life: The BI Analyst Workflow.
 techcults.comskopx.compost.edu+22 min
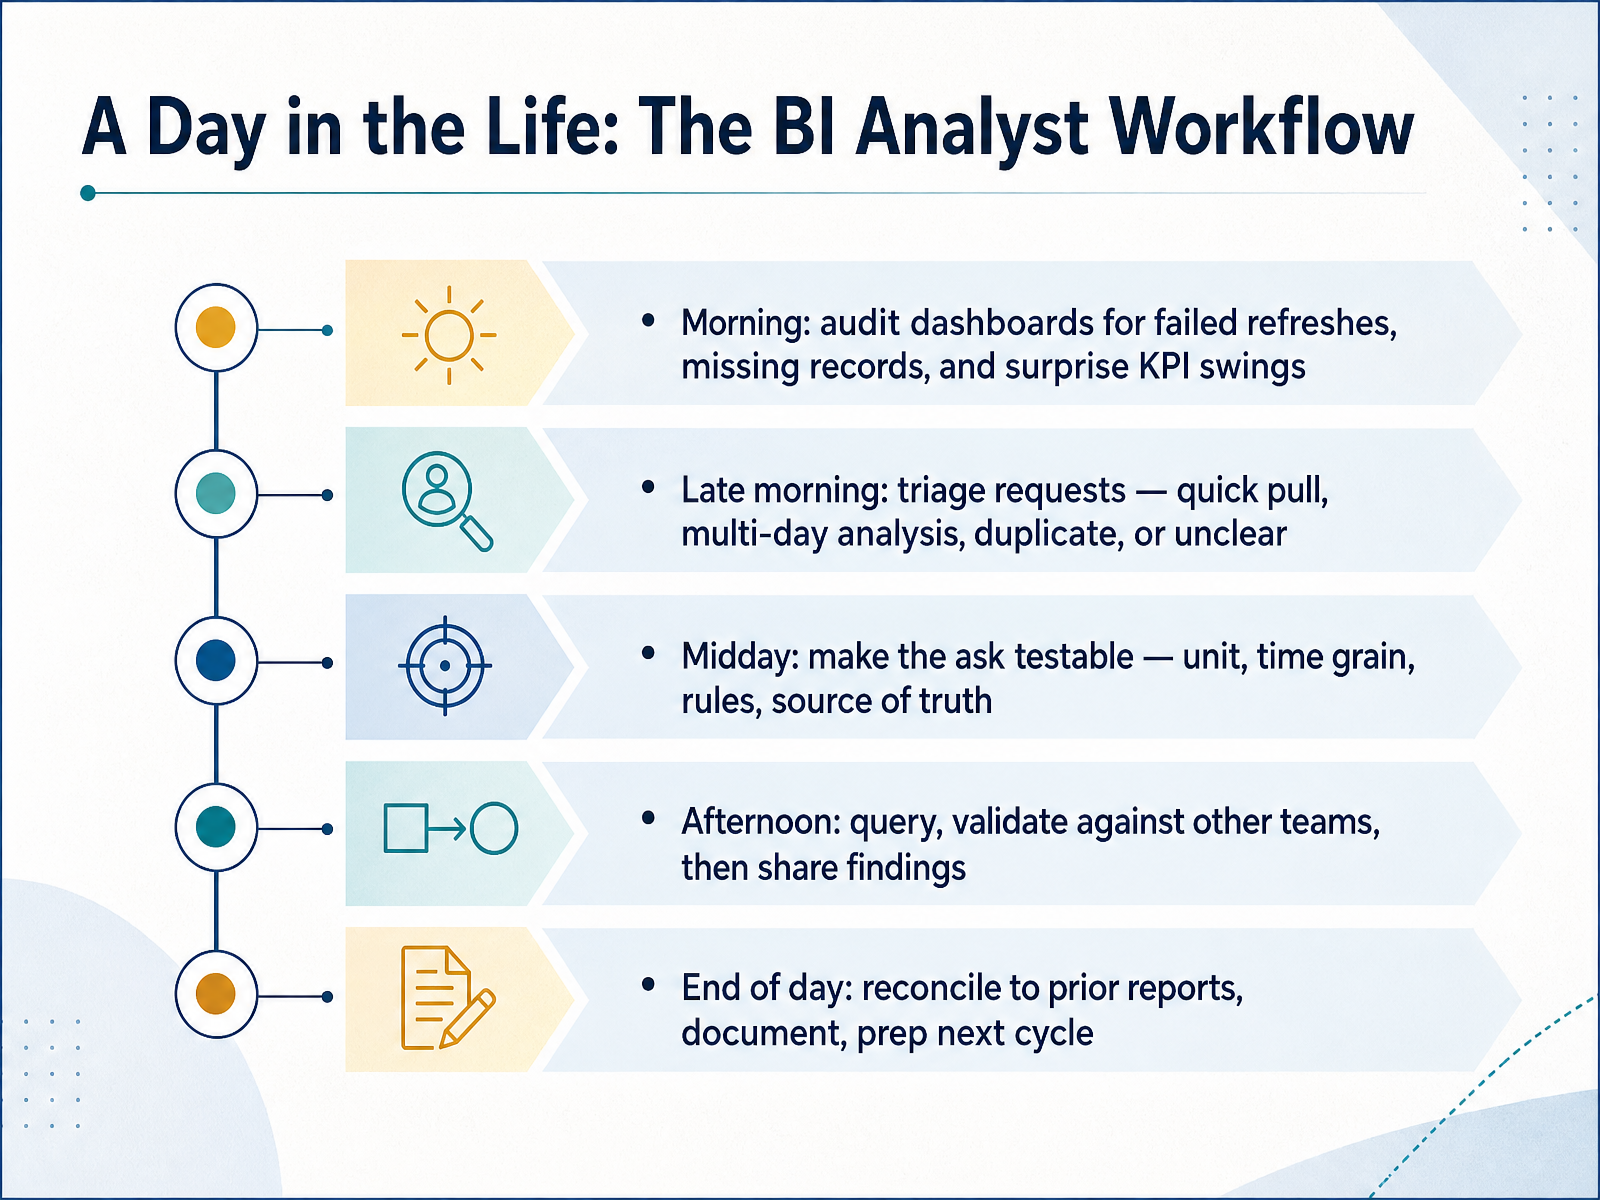
 - 05A Day in the Life: The BI Analyst WorkflowLet's walk through what a BI analyst's day actually looks like. It usually starts with a morning audit. Before anyone asks, you check your key dashboards for failed refreshes, missing records, and surprise K P I swings. If revenue suddenly jumps four times overnight, you want to know that before an executive does. Late morning is triage. Requests come in as quick pulls, multi-day analyses, duplicates, or unclear asks. Sorting them, not solving them, is the skill. By midday, you make the ask testable. That means pinning down the unit, the time grain, the business rules, and the source of truth, so the number is defined before you write any S Q L. The afternoon is for querying, validating your results against other teams like finance, and sharing findings with context. At the end of the day, you reconcile against prior reports, document what you changed, and prep for the next cycle. The pattern to remember is simple, check, triage, define, validate, document. Tomorrow, we'll follow how a business question becomes a decision.
 techcults.comskopx.compost.edu+22 min
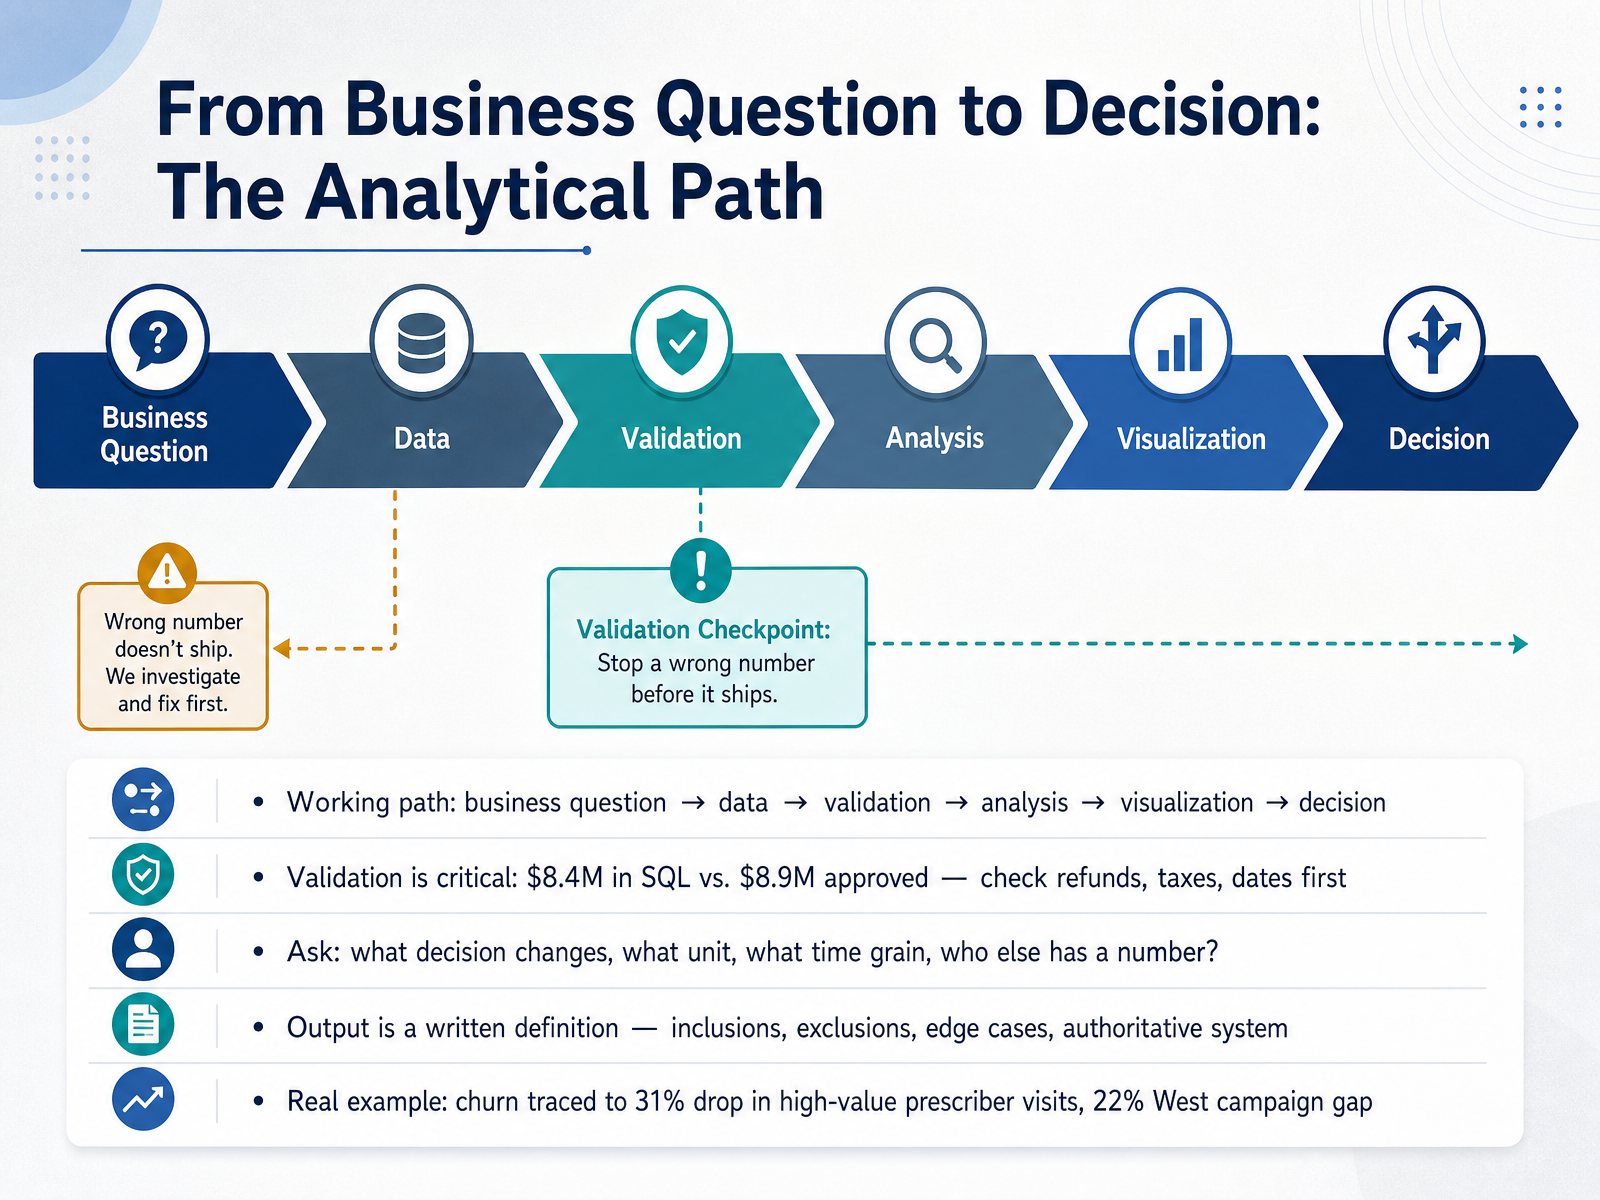
 - 06From Business Question to Decision: The Analytical PathLet's walk through how a business question becomes a decision. The working path is simple: business question, then data, then validation, then analysis, then visualization, then decision. Validation is where careers are made. Imagine your query shows eight point four million dollars in revenue, but Finance approved eight point nine million. Before you panic, check refunds, taxes, and reporting dates. Then ask the questions that define the work: what decision changes, what unit, what time grain, and who else has a number? Your output should be a written definition covering inclusions, exclusions, edge cases, and the authoritative system. For example, churn analysis traced a thirty one percent drop in high value prescriber visits and a twenty two percent campaign gap in the West. That is analysis moving to action. Next, we'll look at the essential tools and technologies that make this work possible.
 techcults.comskopx.compost.edu+22 min
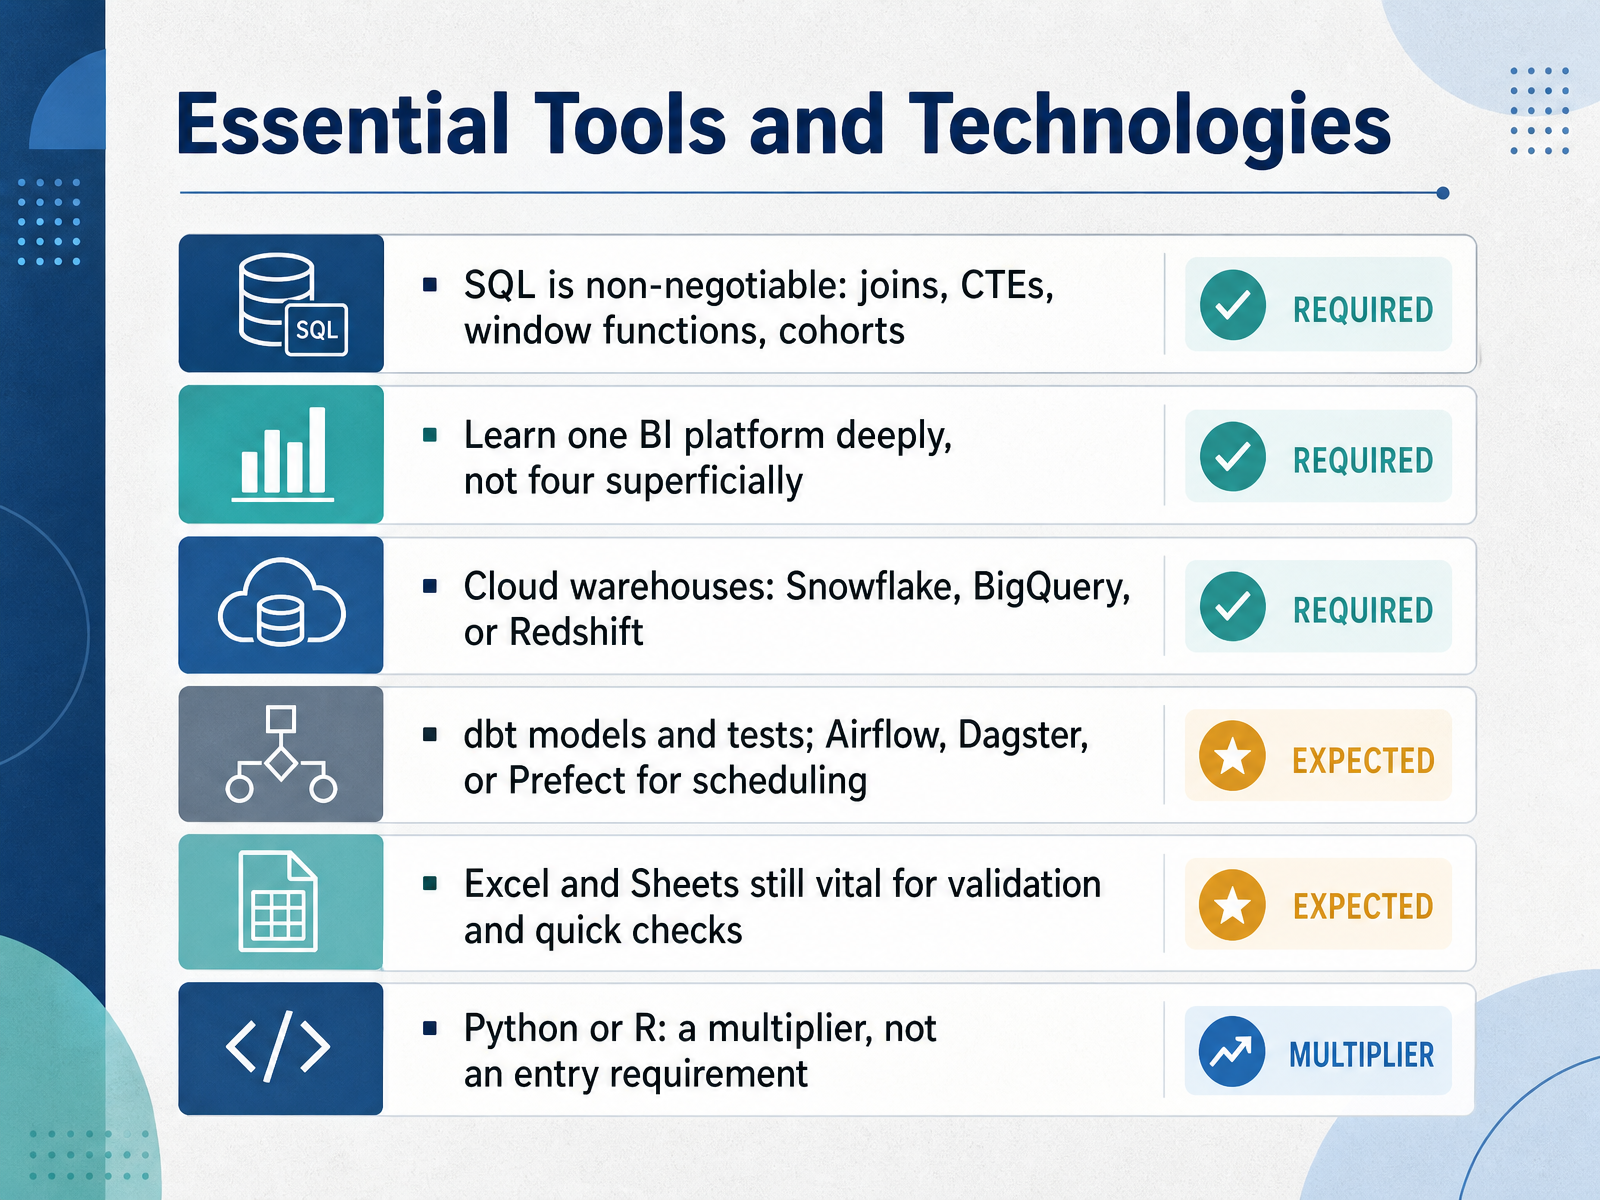
 - 07Essential Tools and TechnologiesNow let's look at the tools that turn analysis into daily work. Start with SQL. It is non-negotiable. You need joins, common table expressions, window functions, and cohort logic. Next, learn one BI platform deeply, not four superficially. Pick Power BI, Tableau, or Looker and commit. Know your cloud warehouse too, whether that is Snowflake, BigQuery, or Redshift. For transformation and scheduling, become familiar with dbt models and tests, plus a scheduler like Airflow, Dagster, or Prefect. Do not dismiss Excel and Sheets. They remain vital for quick validation and sanity checks. Finally, Python or R is a multiplier, not an entry requirement. It widens what you can do, but SQL and one strong BI tool get you hired first.
 techietory.comsoftenant.comdatatheta.com+22 min
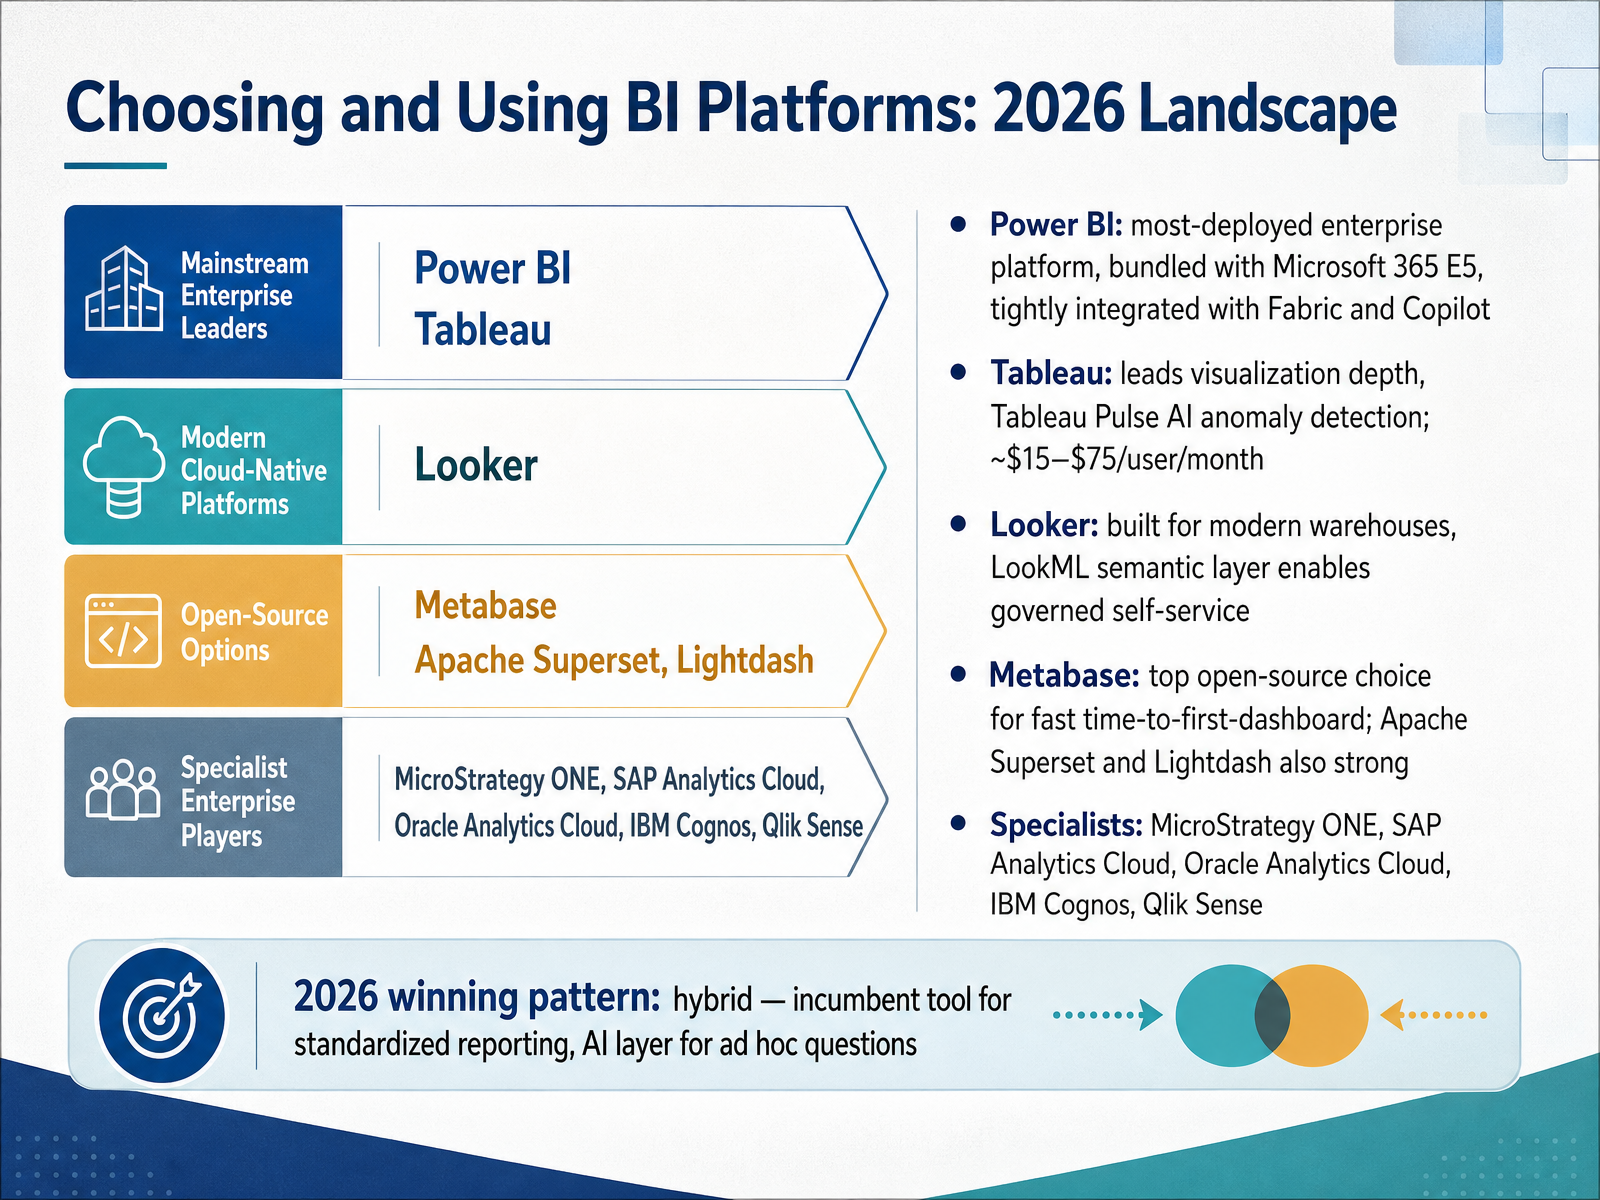
 - 08Choosing and Using BI Platforms: 2026 LandscapeLet's look at how you choose a business intelligence platform, and what the 2026 landscape actually looks like. Think of the platform as your workbench, not your identity. Power BI is the most widely deployed enterprise tool. It's bundled with Microsoft 365 E5, and it connects tightly with Fabric and Copilot. Tableau leads on visualization depth, with Tableau Pulse adding AI anomaly detection, at roughly fifteen to seventy-five dollars per user per month. Looker was built for modern warehouses, and its LookML semantic layer enables governed self-service. For open source, Metabase is the top choice for fast time to first dashboard, with Apache Superset and Lightdash also strong. Specialists include MicroStrategy ONE, SAP Analytics Cloud, Oracle Analytics Cloud, IBM Cognos, and Qlik Sense. The 2026 winning pattern is hybrid. Keep an incumbent tool for standardized reporting, then add an AI layer for ad hoc questions. The practical takeaway: match the platform to your warehouse, your team's skills, and your budget. Tools change, but sound judgment carries you further. Next, we move to skills beyond tools, communication and business acumen.
 propicked.comtechvendorindex.comblazesql.com+21 min
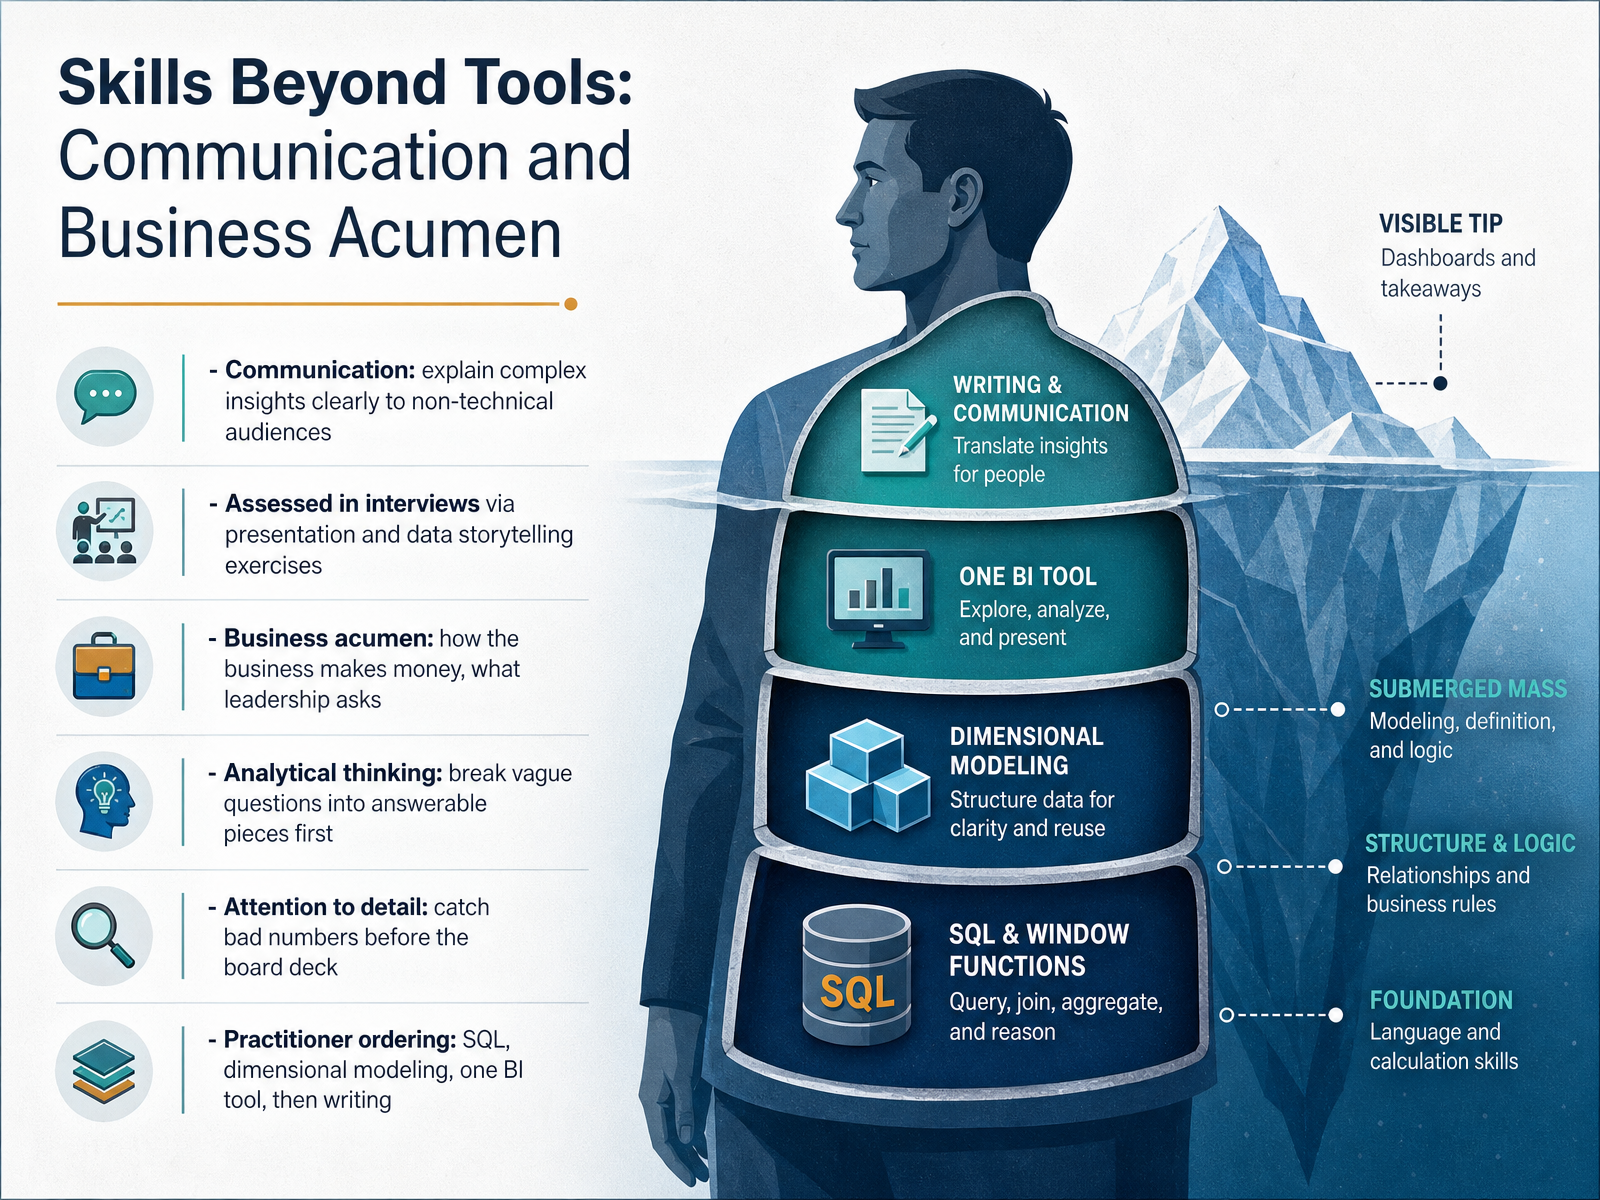
 - 09Skills Beyond Tools: Communication and Business AcumenNow let's talk about the skills that go beyond tools: communication and business acumen. Communication means explaining complex insights clearly to non-technical audiences. Employers often assess this in interviews through presentation and data storytelling exercises, so practice turning numbers into a short, plain-language story with a recommendation. Business acumen is understanding how the business makes money and what leadership actually asks. If you know revenue drivers and key metrics, your analysis becomes far more relevant. Analytical thinking matters too: break vague questions like why are sales falling into answerable pieces before you touch the data. And attention to detail helps you catch bad numbers before the board deck, not after. For learning order, most practitioners suggest SQL first, then dimensional modeling, then one BI tool such as Power BI or Tableau, and finally writing. That sequence builds depth without spreading you too thin. Next, we'll look at how BI work creates business value, with case evidence.
 2 min
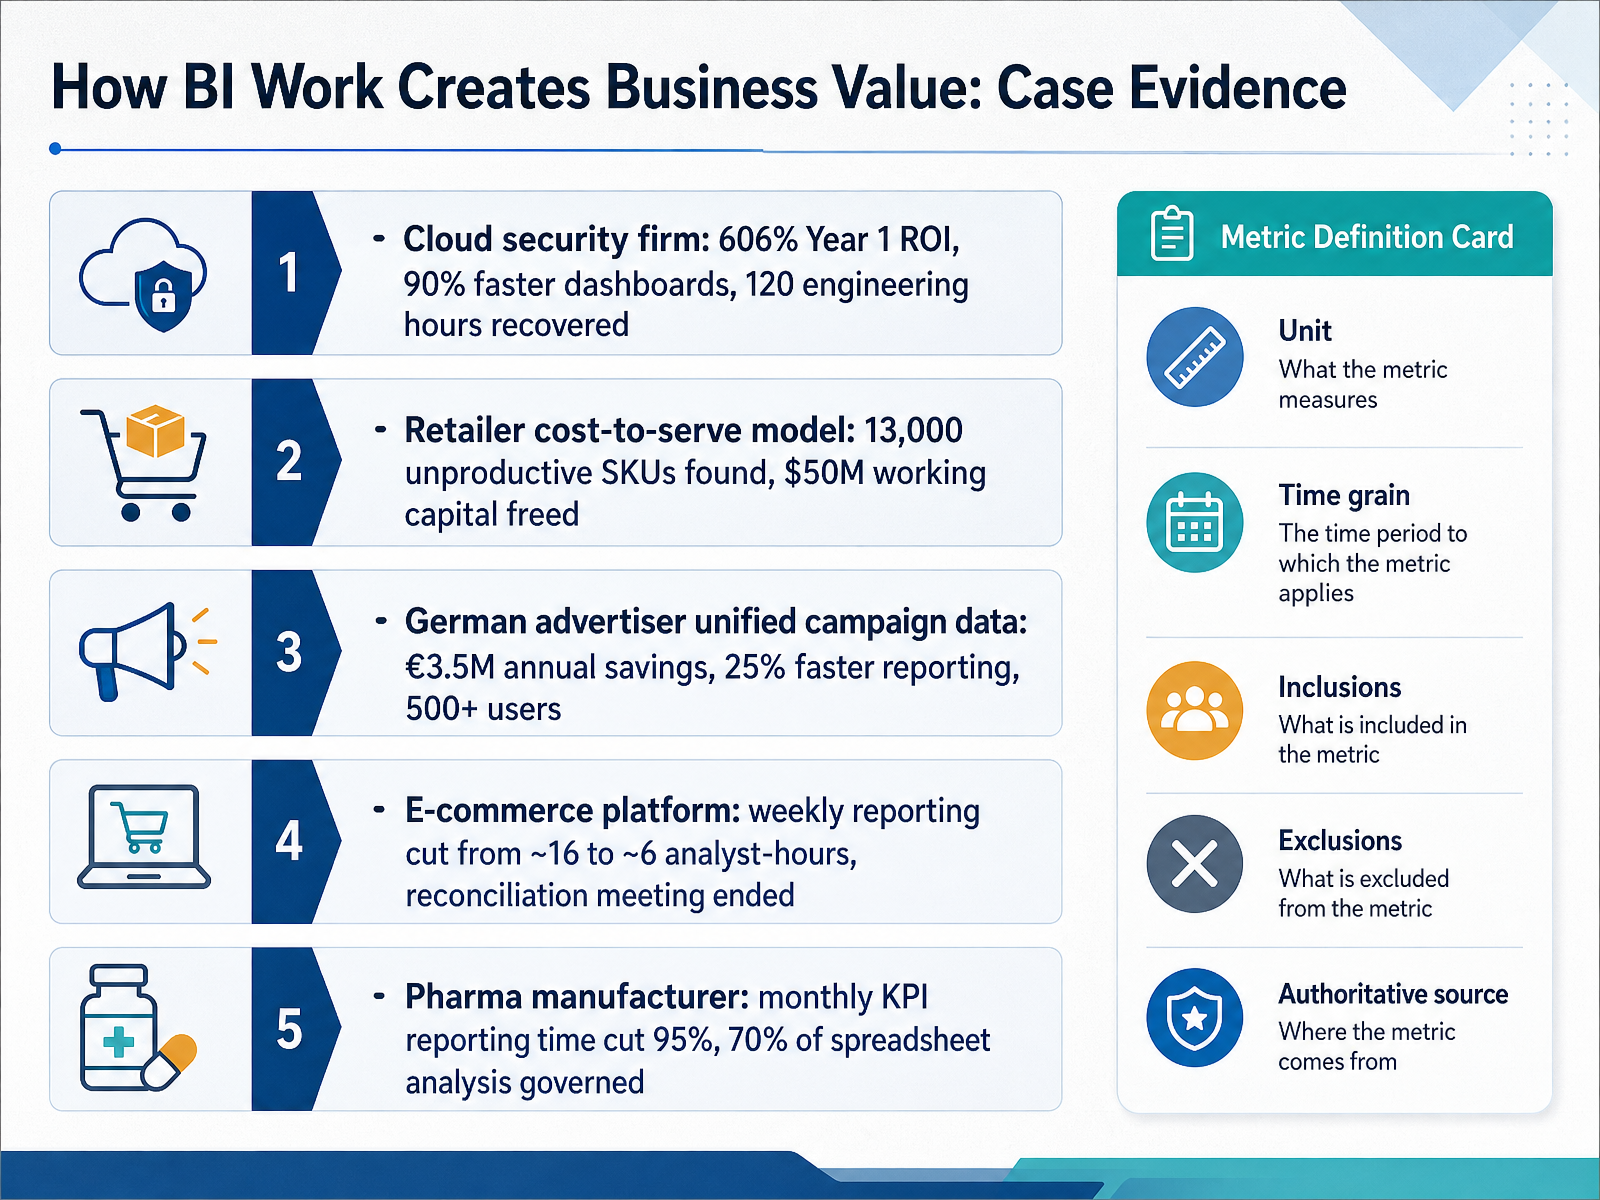
2 min - 10How BI Work Creates Business Value: Case EvidenceNow let's connect BI work to real business value, using five documented cases. First, a cloud security firm that moved to a modern analytics stack. It saw a six hundred six percent return on investment in year one. Dashboards loaded about ninety percent faster, and roughly one hundred twenty engineering hours were recovered, because finance could update pricing data on their own. Second, a retailer built a cost-to-serve model. It uncovered thirteen thousand unproductive products and freed fifty million dollars in working capital. Third, a German advertiser unified fragmented campaign data. That delivered three point five million euros in annual savings, twenty five percent faster reporting, and over five hundred users on one trusted dataset. Fourth, an e-commerce platform cut weekly reporting from about sixteen analyst hours to six, and ended its Monday reconciliation meeting. Fifth, a pharmaceutical manufacturer reduced monthly KPI reporting time by ninety five percent, while putting seventy percent of spreadsheet analysis under governance. Notice the pattern. Faster answers, hours returned, and millions saved. Next, we'll look at common misconceptions and role boundaries.
 skopx.com2 min
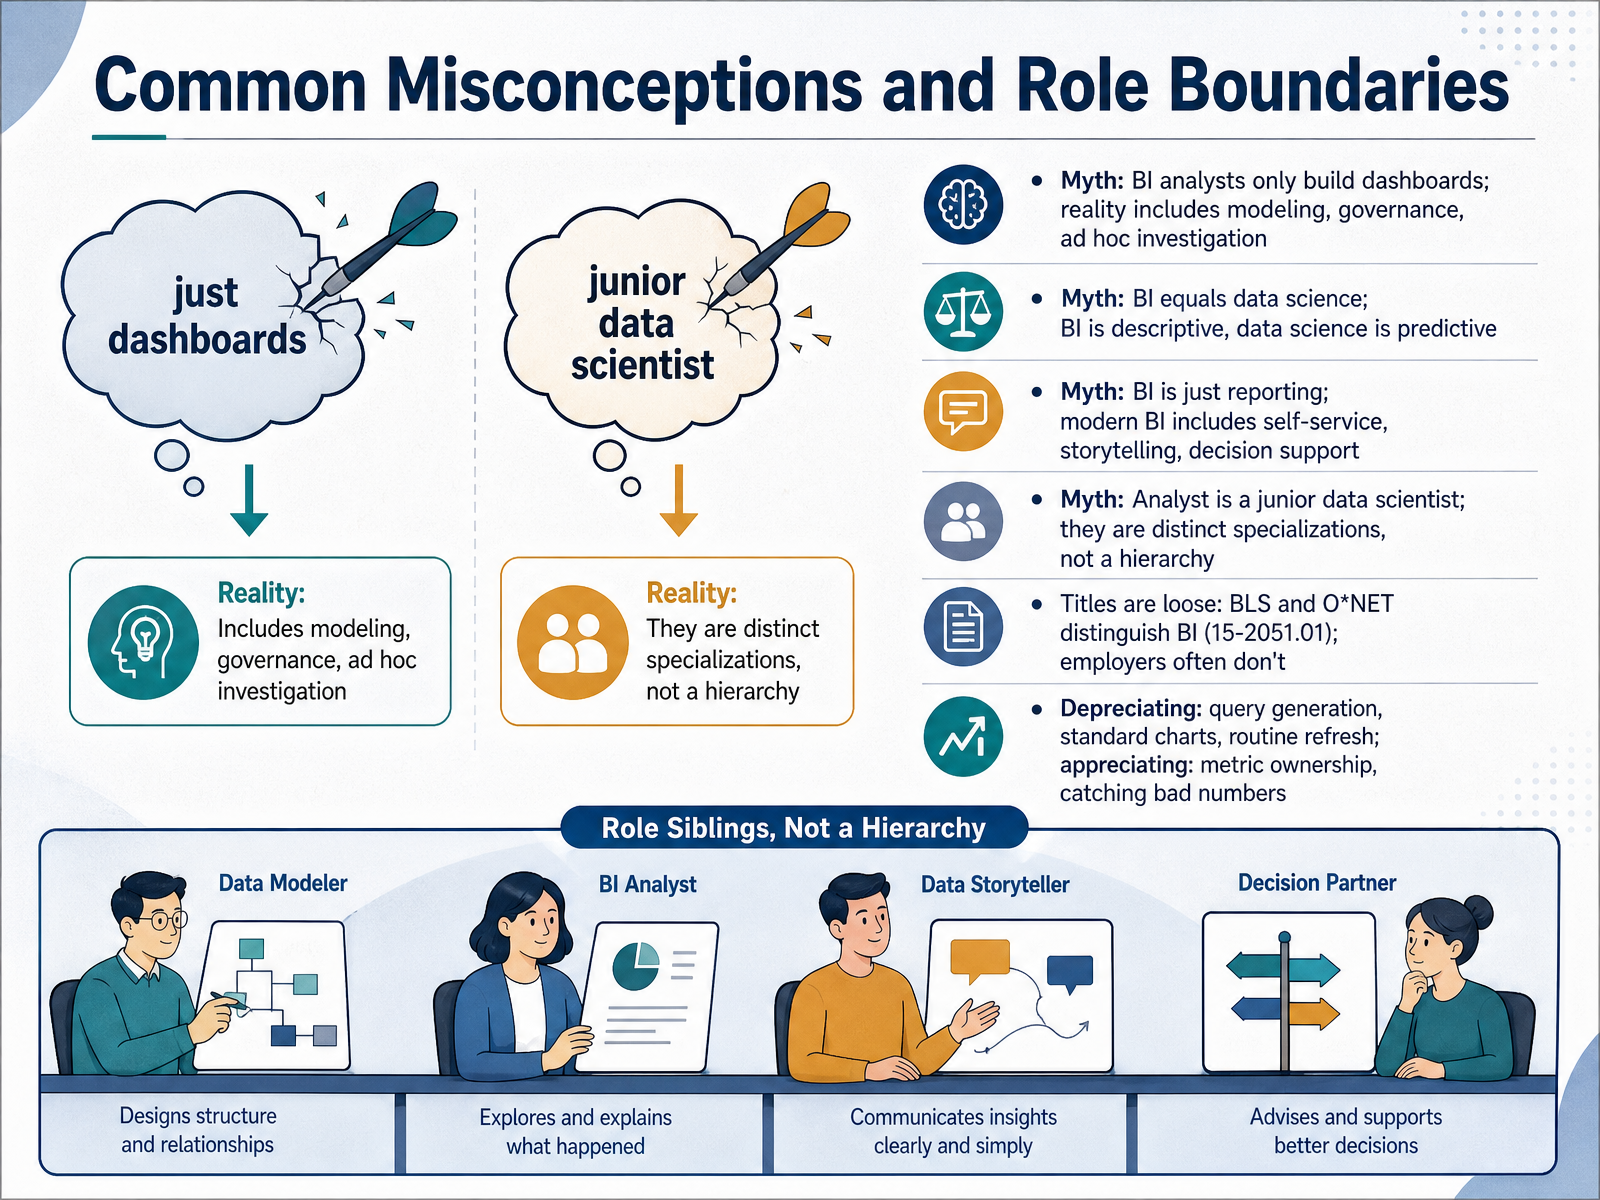
 - 11Common Misconceptions and Role BoundariesLet's clear up some common misconceptions about this role. First, BI analysts do more than build dashboards. The job also includes data modeling, governance, and ad hoc investigations. Second, BI is not the same as data science. BI is descriptive, it explains what already happened, while data science is predictive, it forecasts what might happen next. Third, BI is not just reporting. Modern BI includes self-service tools, data storytelling, and decision support. Fourth, a BI analyst is not a junior data scientist. They are distinct specializations, not a hierarchy, and both paths can grow in different directions. Titles are often loose. The Bureau of Labor Statistics and O*NET recognize business intelligence analysts under code 15-2051.01, but many employers use the labels interchangeably, so ask what the work actually involves. Finally, some skills are becoming less valuable, like writing simple queries or refreshing routine reports. Others are becoming more valuable, like owning metric definitions and catching bad numbers before they reach decision makers. The takeaway is to focus on judgment, context, and trust, because those are hardest to automate. Next, we will look at career paths, the job market, and compensation.
 softenant.comtechietory.comskopx.com+22 min
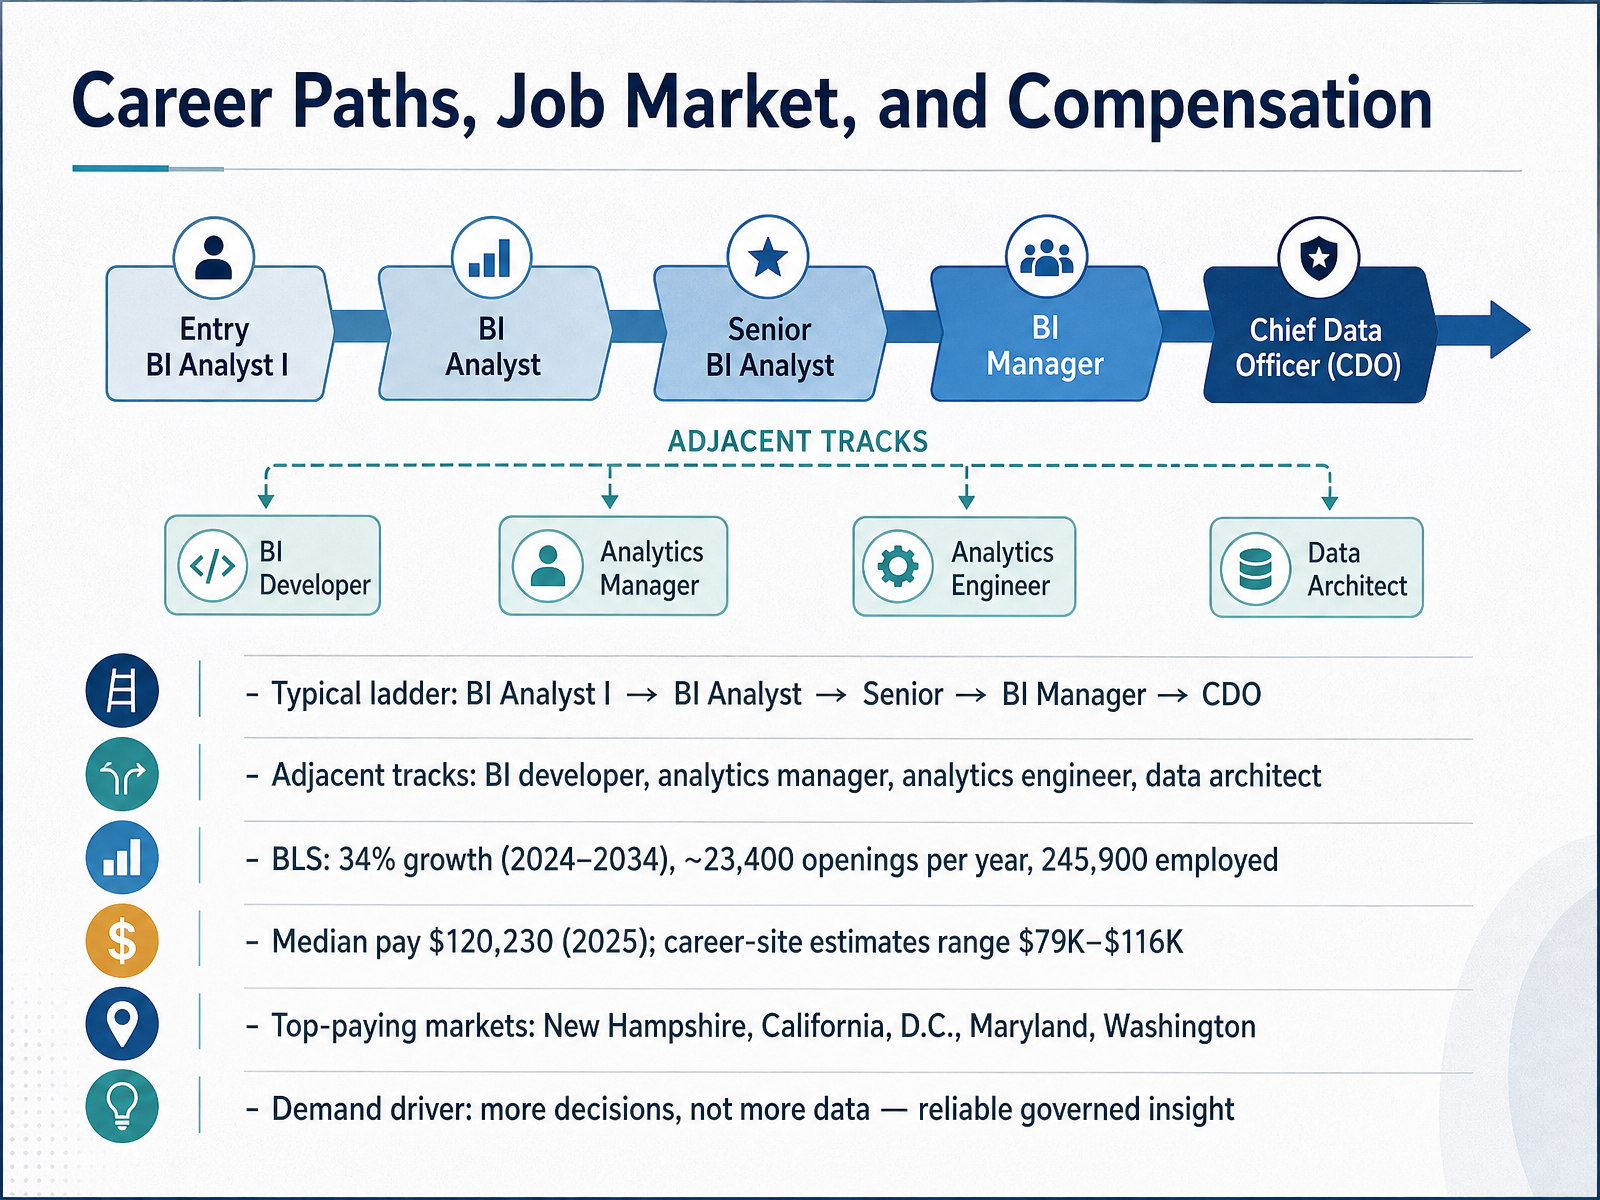
 - 12Career Paths, Job Market, and CompensationNow let's talk about where this career can take you. The typical ladder starts as a Business Intelligence Analyst One, then analyst, then senior analyst, then BI manager, and eventually Chief Data Officer. You can also move sideways into adjacent roles like BI developer, analytics manager, analytics engineer, or data architect. The job market is strong. The Bureau of Labor Statistics projects thirty-four percent growth from 2024 to 2034, with about twenty-three thousand four hundred openings each year and roughly two hundred forty-five thousand nine hundred people already employed. Median pay is one hundred twenty thousand two hundred thirty dollars, based on 2025 data, while career sites estimate a wider range of about seventy-nine thousand to one hundred sixteen thousand dollars. The top-paying markets include New Hampshire, California, D.C., Maryland, and Washington. And the real demand driver is not more data. It is more decisions that need reliable, governed insight. So keep building that combination of business sense and trustworthy analysis. Next, we will look at getting started with education, your portfolio, and your job search.
 careeronestop.orgindeed.comresources.rework.com+22 min
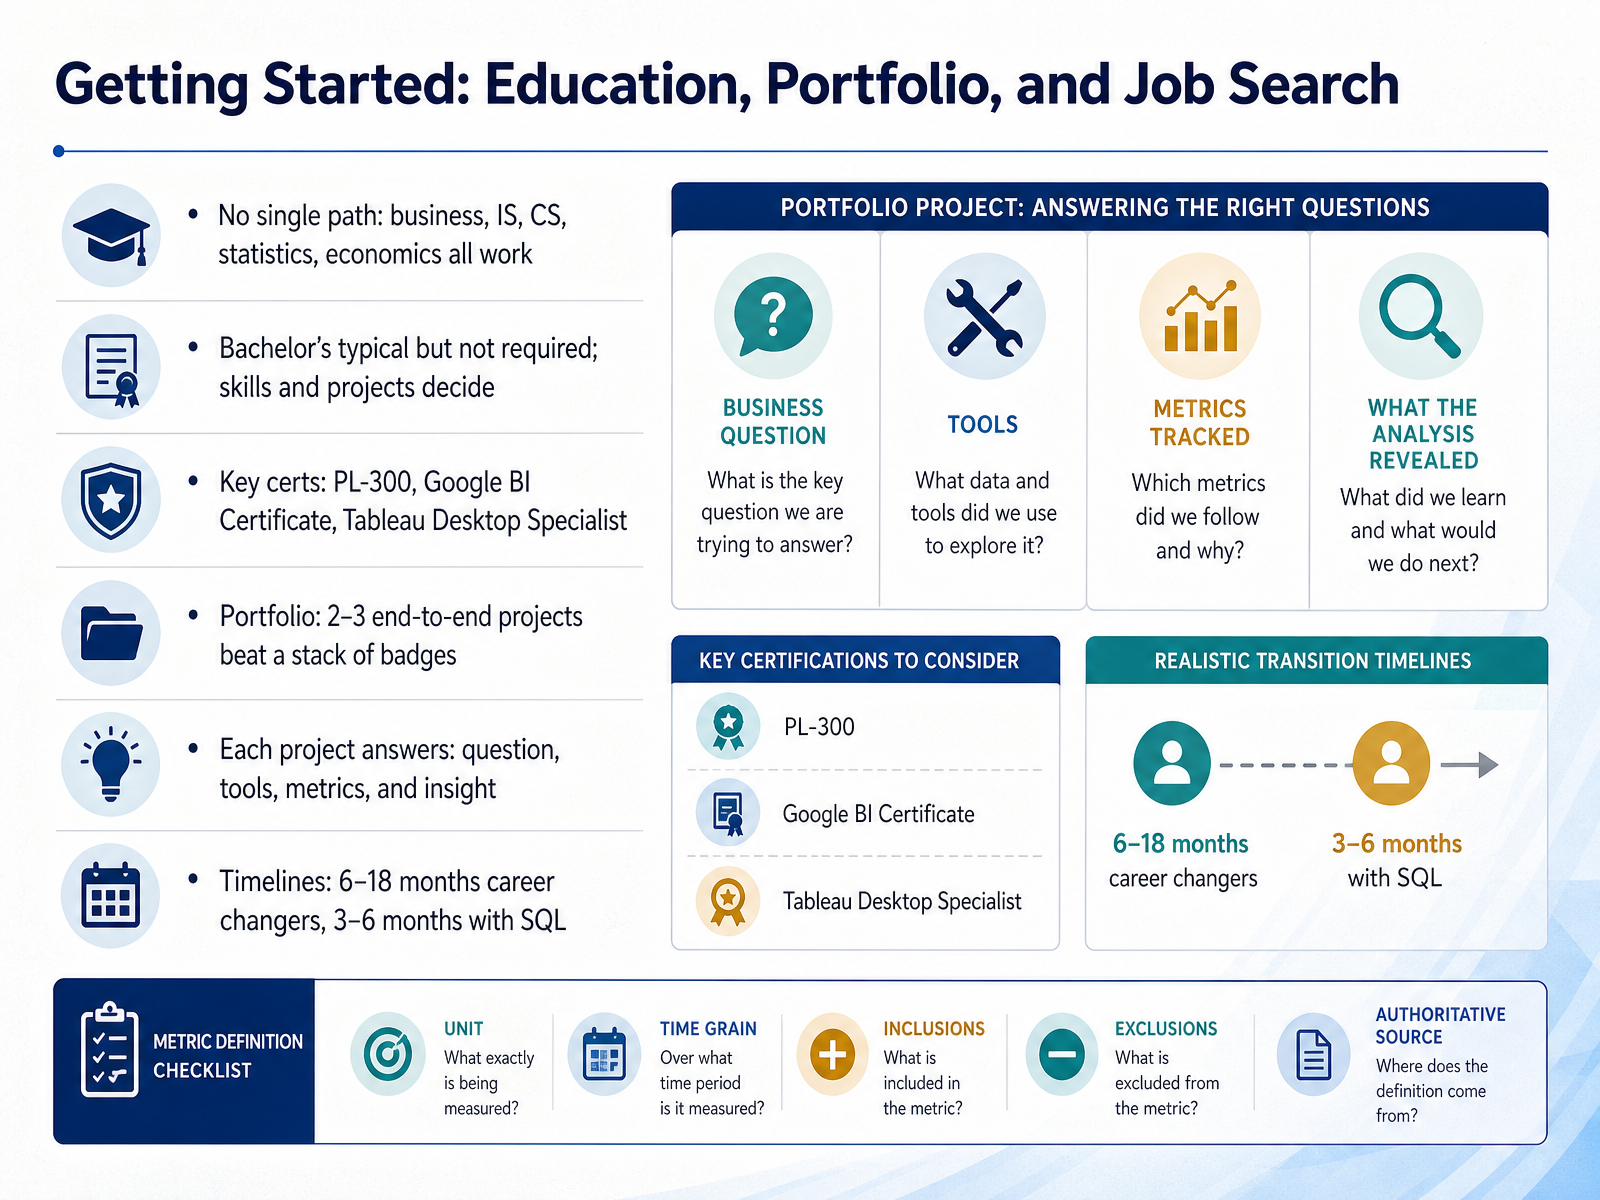
 - 13Getting Started: Education, Portfolio, and Job SearchNow let's talk about getting started with education, portfolio, and job search. Here's the encouraging part. There is no single path into business intelligence. Business, information systems, computer science, statistics, and economics all work. A bachelor's degree is typical, but not required. Your skills and projects decide. Certifications can help too. The three worth considering are PL-300 for Power BI, the Google Business Intelligence Certificate, and the Tableau Desktop Specialist. But when it comes to your portfolio, two or three end-to-end projects beat a stack of badges. Each project should clearly answer four things. What question were you solving? What tools did you use? What metrics did you track? And what insight did you find? Timelines vary. Career changers often need six to eighteen months. But if you already have SQL skills, you could be ready in three to six months. So build real projects, not just certificates. Next, we'll look at working effectively with BI teams. This is a guide for stakeholders.
 1 min
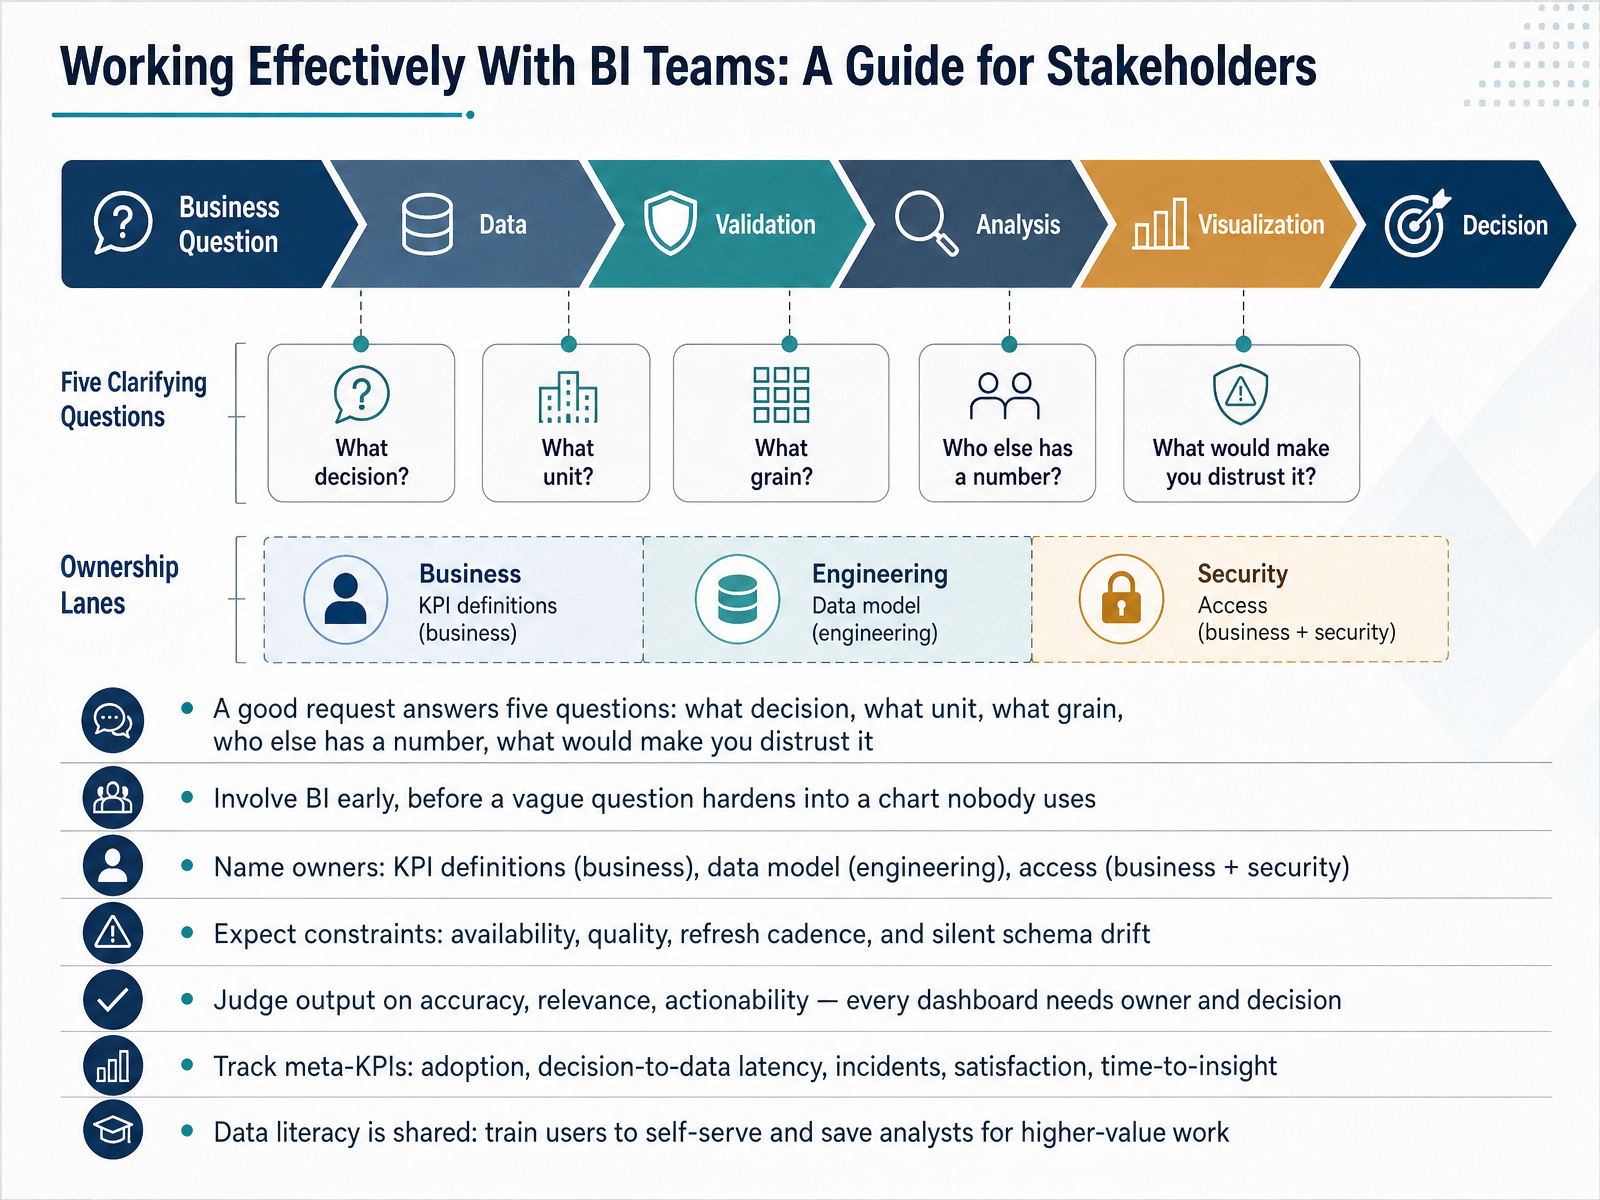
1 min - 14Working Effectively With BI Teams: A Guide for StakeholdersLet's close with how to work effectively with BI teams. A good request answers five questions: what decision will change, what unit, what time grain, who else already has a number, and what would make you distrust the result. Involve BI early, before a vague question hardens into a chart nobody uses. Name the owners too. Business owns KPI definitions, engineering owns the data model, and access is a shared business and security call. Expect constraints around availability, quality, refresh cadence, and silent schema drift, where a source changes quietly and a dashboard keeps rendering, just wrong. Judge output on accuracy, relevance, and actionability. Every dashboard needs a named owner and a decision it supports. Track meta-KPIs like adoption, decision-to-data latency, incidents, satisfaction, and time-to-insight. Finally, remember data literacy is shared. Train users to self-serve so analysts are freed for higher-value work. Thank you for joining this course. You now have a clear picture of what a BI analyst does, and I encourage you to keep asking better questions. You are ready to take the next step.
 skopx.compropicked.comtechvendorindex.com+22 min
Take the deck with you
Download this course as a file — free, no sign-up needed.
- PDF handoutEvery slide page, ready to print or share.15 pages · 4.6 MBDownload
- Narrated PowerPointThe deck that presents itself — every slide carries the digital human's narration video.15 pages · 16.0 MBDownload
- PowerPoint slidesThe full deck as a .pptx — open it in PowerPoint, Keynote, or Google Slides.15 pages · 4.5 MBDownload
Free to use in your own training — please keep the PersonWise credit page at the end.
Have your own deck? Turn it into a course
Sources consulted
Web sources consulted while building this course.
- Business Intelligence Analyst Job Description: Top Duties and Qualifications — indeed.com
- Occupation Profile for Business Intelligence Analysts | CareerOneStop — careeronestop.org
- "Business Intelligence Analyst Job Description Template - 2026 Guide" — resources.rework.com
- 15-2051.01 - Business Intelligence Analysts — onetonline.org
- Business Intelligence (BI) Analyst Job Description | Requirements & Salary | 4 Corner Resources — 4cornerresources.com
- What Does a Business Intelligence Analyst Do Every Day? — techcults.com
- What a Business Intelligence Analyst Actually Does — skopx.com
- A Day in the Life of a Business Intelligence Analyst - Post University — post.edu
- Day in the Life of a Business Intelligence Analyst: Daily Responsibilities and Tools | Zorgle — zorgle.co.uk
- Business Intelligence Analyst: $115K Career with 11% Growth [VIDEO] — coursera.org
- Data Science vs Data Analytics vs Business Intelligence: Key Differences Explained — techietory.com
- Difference Between Data Analytics, Data Science, and Business Intelligence - Softenant Technologies — softenant.com
- Data Analyst vs Business Analyst vs Data Scientist Explained (2026) — datatheta.com
- Refonte Learning : Business Intelligence Analyst vs Data Analyst: What’s the Real Difference in 2026? — refontelearning.com
- Data Science vs Data Analytics: Compare Careers, Skills, and Degrees | Databricks Blog — databricks.com
- Best Business Intelligence Tools 2026 | ProPicked — propicked.com
- Best BI for Enterprise 2026 — Top 8 Platforms Ranked — techvendorindex.com
- BI Tool Comparison 2026: 18 Tools Ranked by Real Users — blazesql.com
- The 25 best & most popular BI tools of 2026 — passionned.com
- Best BI Tools of 2026: The Decision-Layer Test | Cube — cube.dev