Begin
14 pages · ~28 min
Measurement Uncertainty & Significant Figures
This training teaches learners to evaluate measurement uncertainty and apply significant figures correctly, building practical skills for accurate data reporting in scientific and technical work.
A digital instructor presents all 14 pages. Hold “Ask” at any point and ask out loud — the answer comes from this course. No sign-up needed.
What you’ll learn
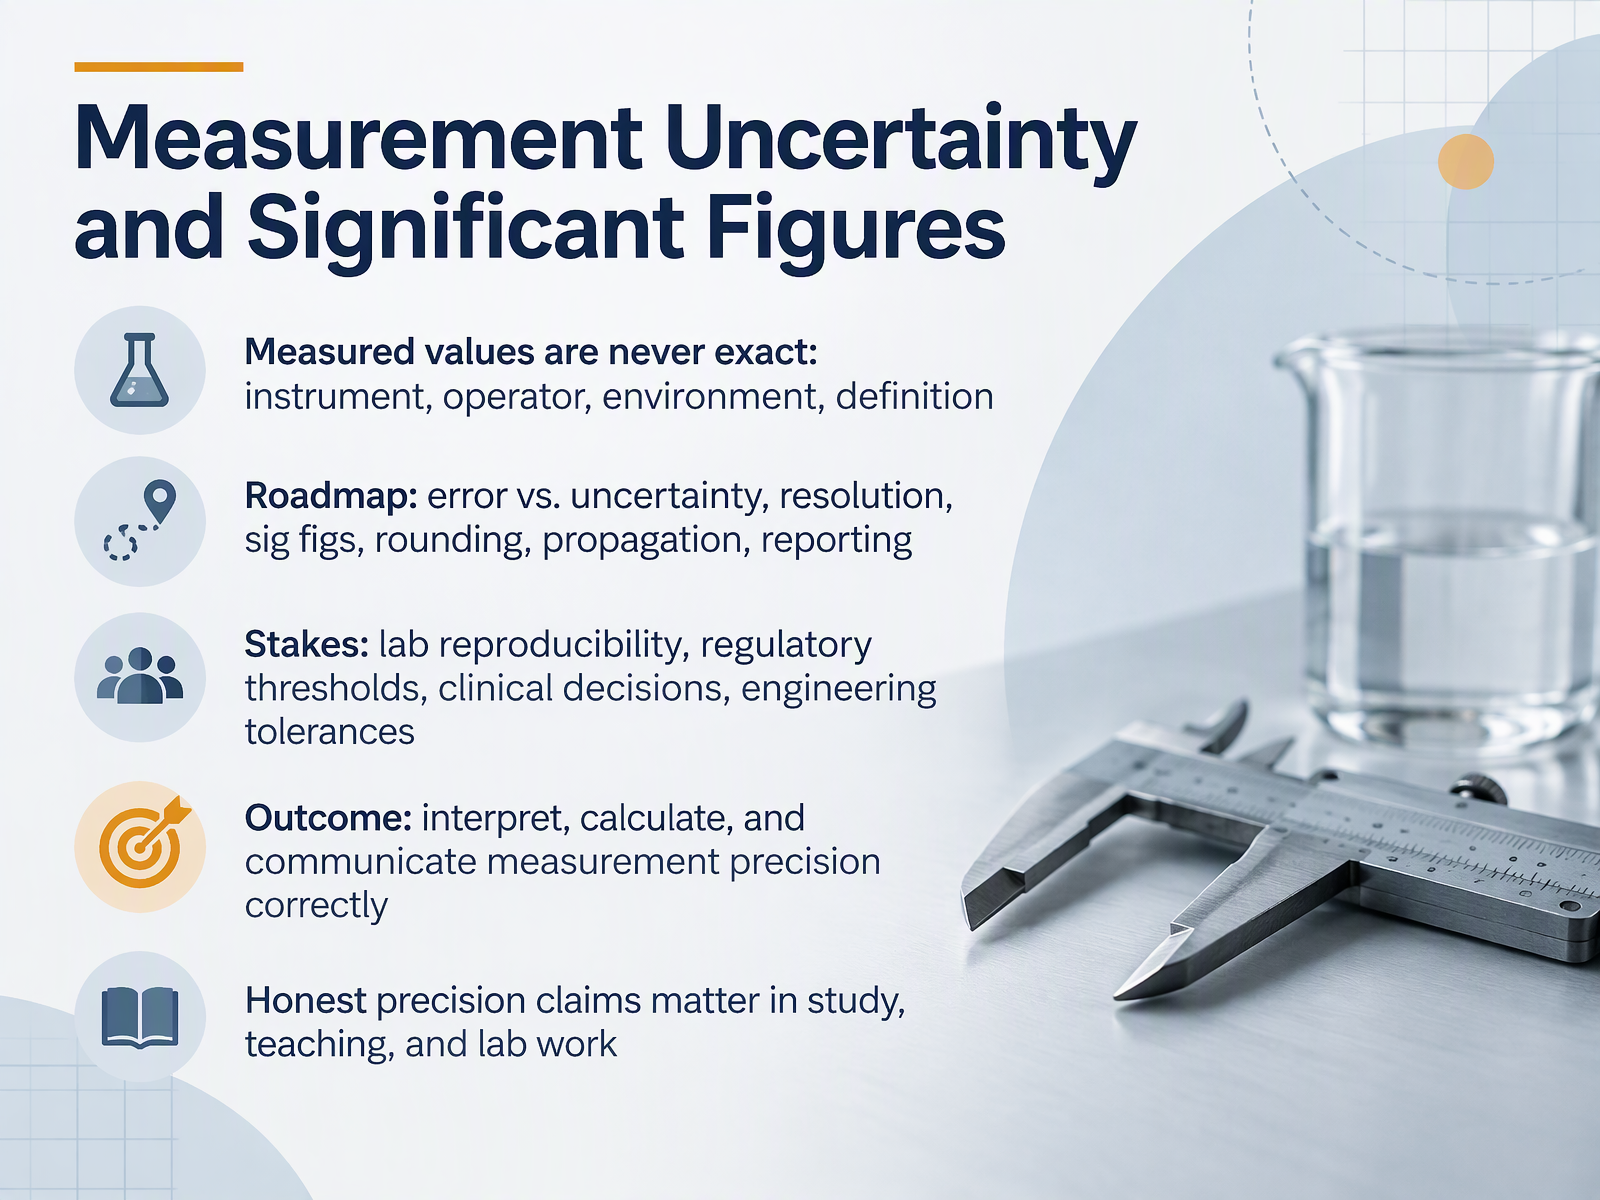
- 01Measurement Uncertainty and Significant FiguresWelcome. In this course, we're going to talk about something every measurement shares: it is never perfectly exact. Whether you're a student in a lab course, a teacher explaining results, or a researcher writing up data, the question is the same. How precise is this number, and how honestly should I report it? Here's why it matters. No measurement can escape its limits: the instrument itself, the person operating it, the surrounding environment, and even the definition of the quantity being measured all introduce small deviations. Over the next slides, we'll build a clear roadmap. We'll separate error from uncertainty, look at instrument resolution, work through significant figures and rounding, then cover propagation and proper reporting. And this isn't just bookkeeping. Reproducible lab work, regulatory thresholds, clinical decisions, and engineering tolerances all depend on stating precision honestly. By the end, you should be able to interpret, calculate, and communicate measurement precision correctly. Let's begin with the course roadmap and learning targets.bipm.orgbipm.orgdoi.org+22 min
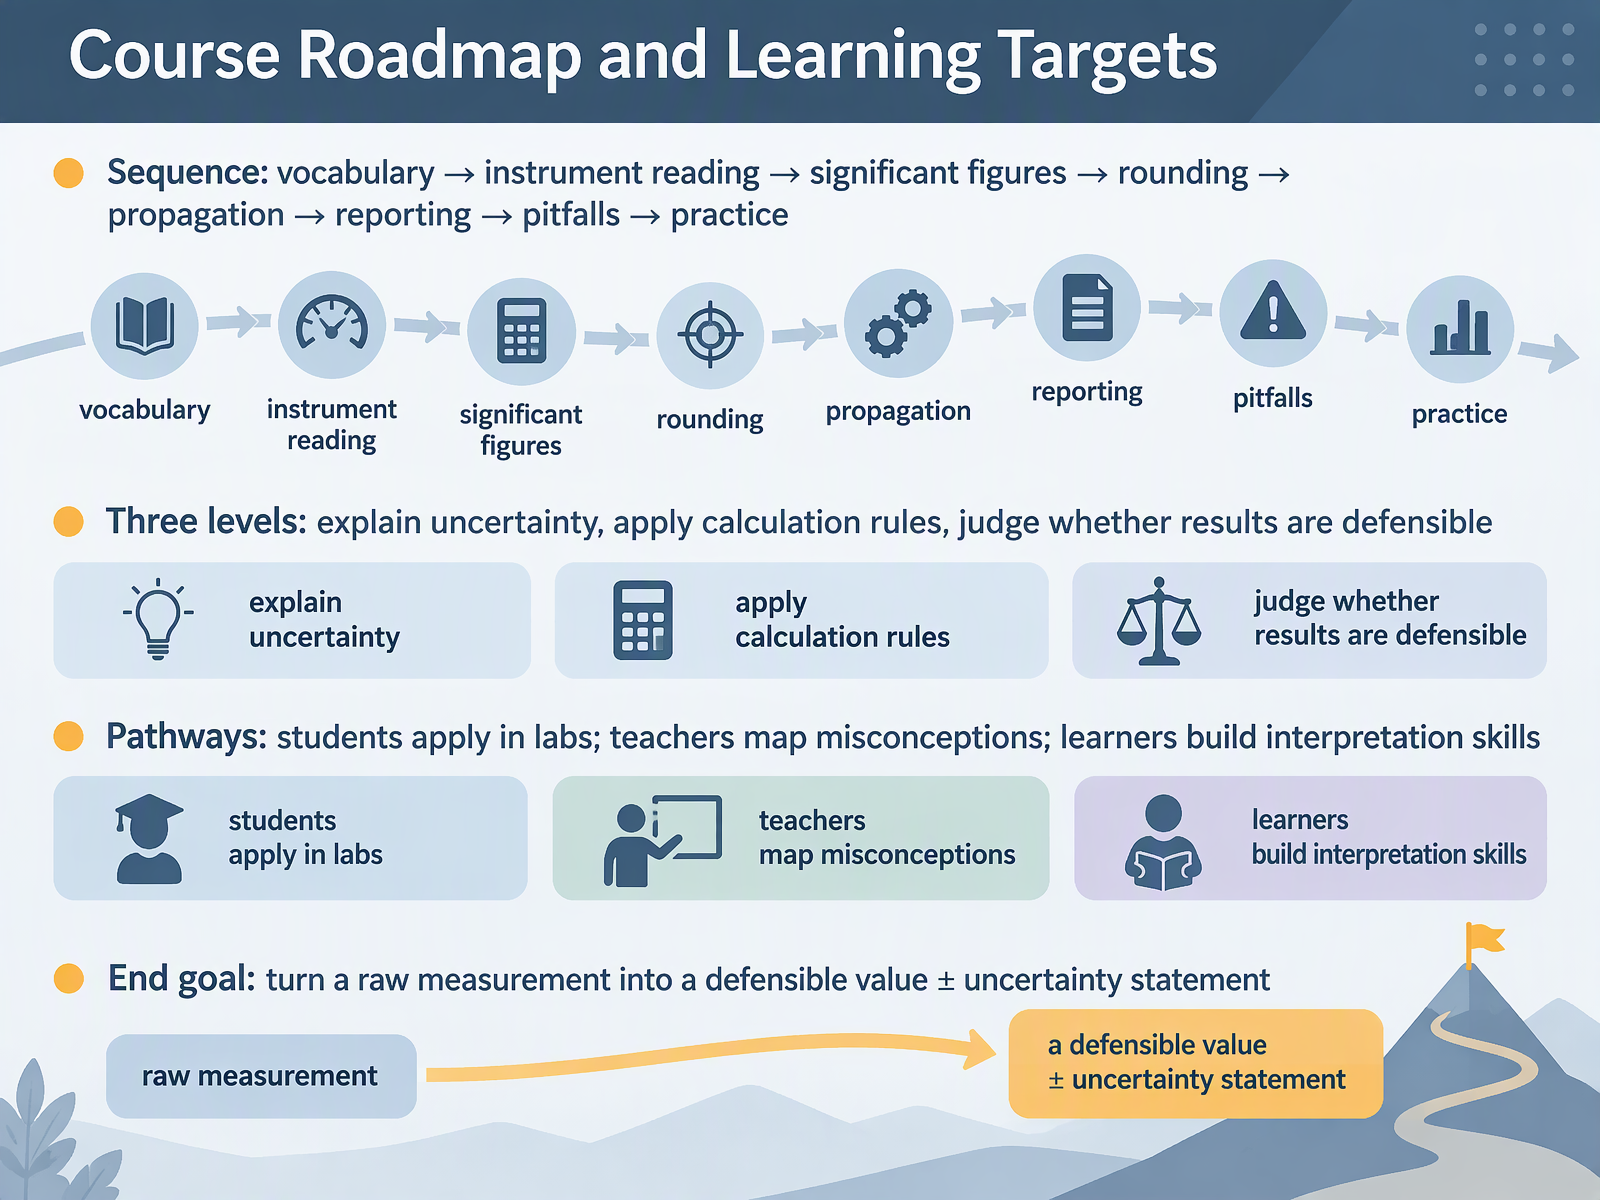
- 02Course Roadmap and Learning TargetsHere is the roadmap for where we are heading. The sequence is deliberate: vocabulary first, then instrument reading, significant figures, rounding, propagation, reporting, common pitfalls, and finally practice. Along the way, you are working toward three levels: explain what uncertainty means, apply the calculation rules, and judge whether a result is defensible. Students can apply these skills directly in labs, teachers can map common misconceptions, and independent learners can build solid interpretation skills. Your end goal is simple but powerful: turn a raw measurement into a defensible value plus or minus an uncertainty statement. Keep that goal in mind as a check for understanding, because every step on this roadmap brings you closer to it. Next, we begin with error, accuracy, and precision, and clearing up the vocabulary.
 doi.orgpubs.aip.orgserc.carleton.edu+21 min
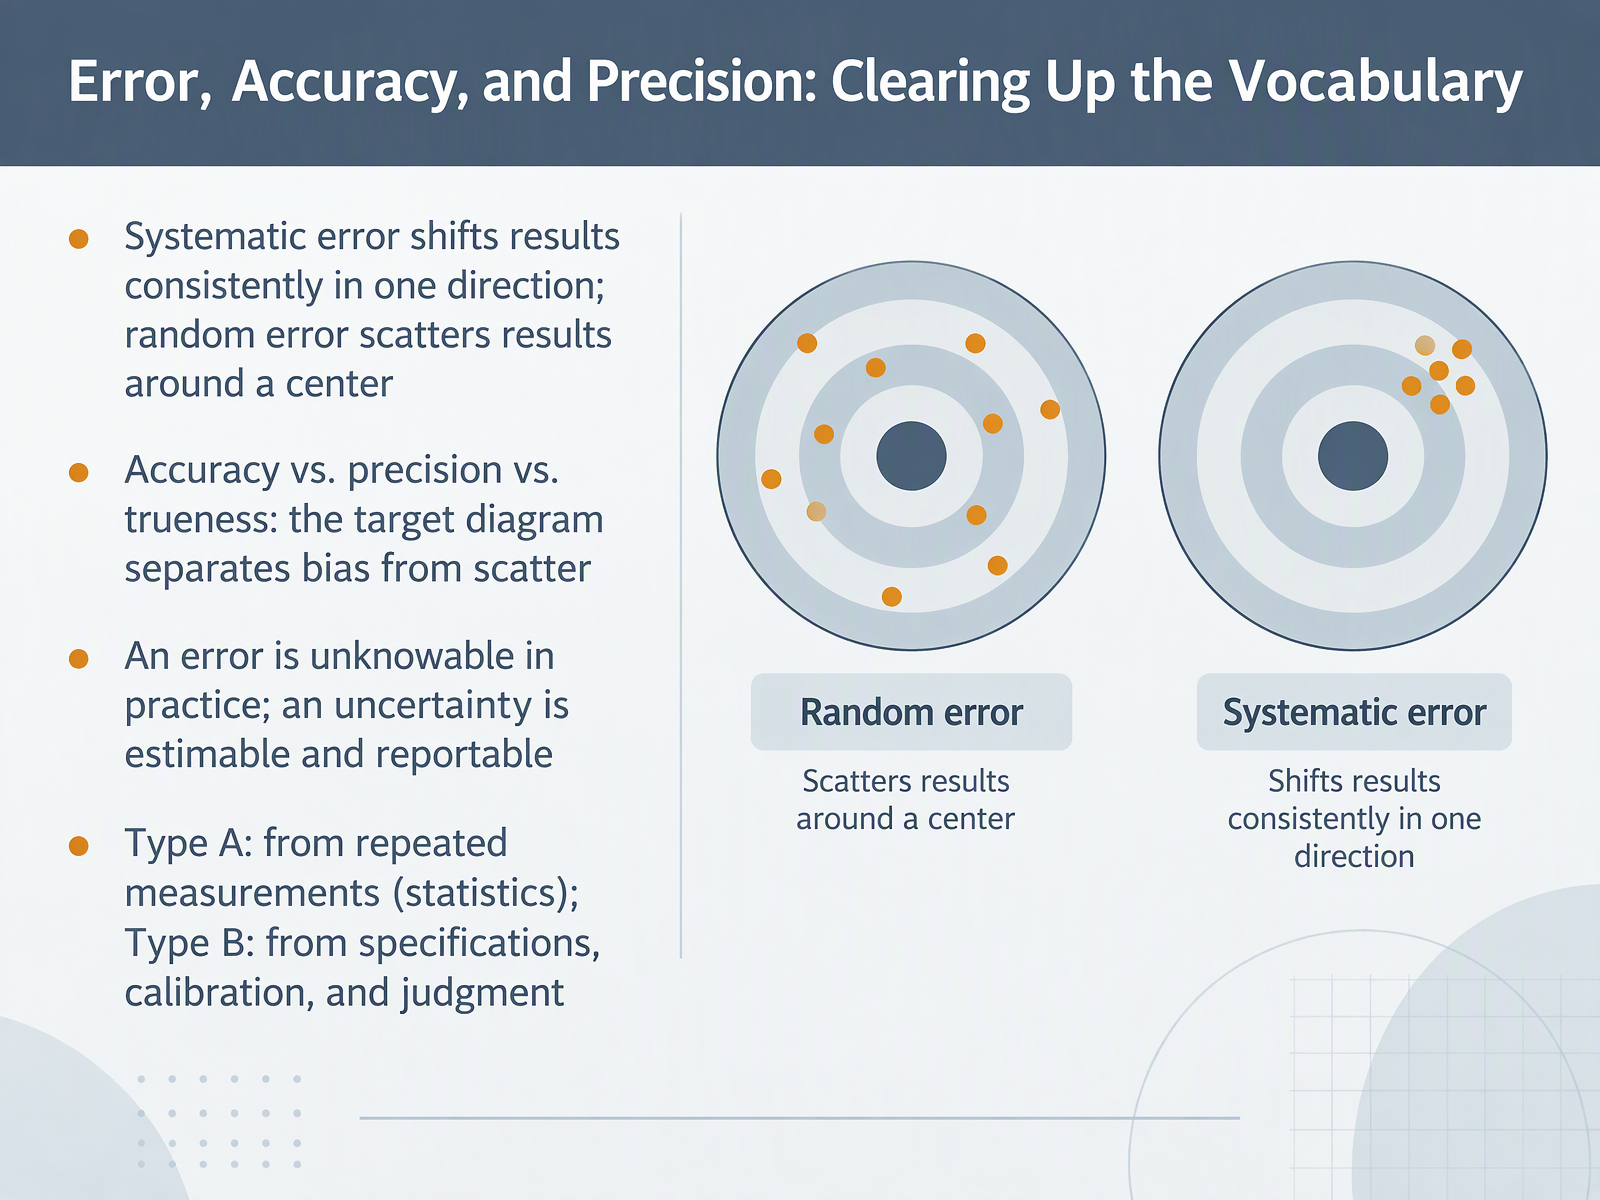
- 03Error, Accuracy, and Precision: Clearing Up the VocabularyLet's clear up the vocabulary, because these terms get mixed up all the time. Systematic error shifts results consistently in one direction, like a scale that always reads slightly high. Random error scatters results around a center, like small variations when you time a pendulum by hand. Accuracy, precision, and trueness are best pictured with a target diagram. Trueness is how close the average lands to the bullseye. Precision is how tightly the points cluster together. Accuracy combines both. Here is a distinction students find genuinely useful. An error is unknowable in practice, but an uncertainty is estimable and reportable. Finally, we sort uncertainty into two types. Type A comes from repeated measurements and statistics, such as the spread across several trials. Type B comes from specifications, calibration certificates, and informed judgment. When you report a result, combine both types. Now let's look at why more decimals does not mean more accurate.
 tandfonline.comdoi.orgpubs.acs.org+22 min
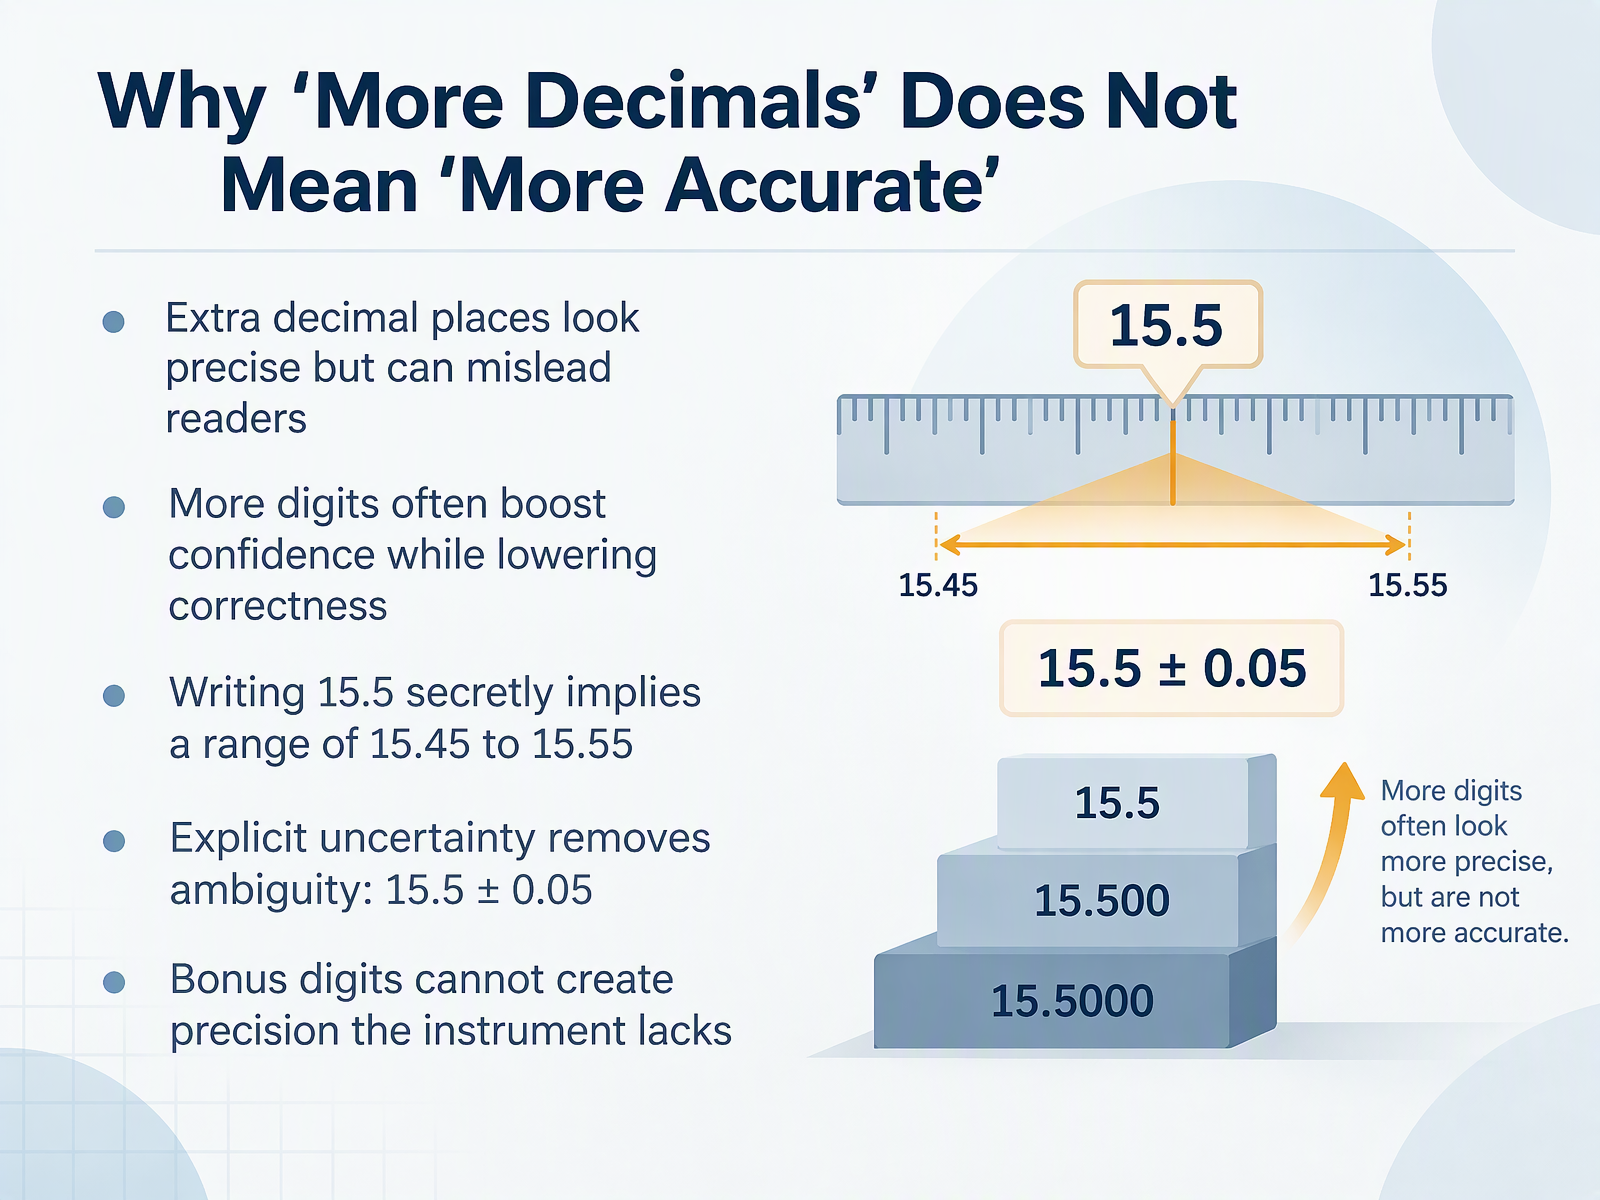
- 04Why 'More Decimals' Does Not Mean 'More Accurate'Now let's look at a common misconception. Why does more decimals not mean more accurate? Extra decimal places can look precise, but they can mislead your readers. More digits often boost confidence while lowering correctness. For example, writing fifteen point five secretly implies a range of fifteen point four five to fifteen point five five. That may not be what you intend. Explicit uncertainty removes that ambiguity. You can write fifteen point five plus or minus zero point zero five. This tells readers exactly how much variation to expect. And remember, bonus digits cannot create precision the instrument lacks. If your balance reads to one decimal place, adding extra zeros does not make it more exact. So before you report a value, ask yourself: does my uncertainty match my digits? Next, we will explore instrument resolution and reading uncertainty.
 1 min
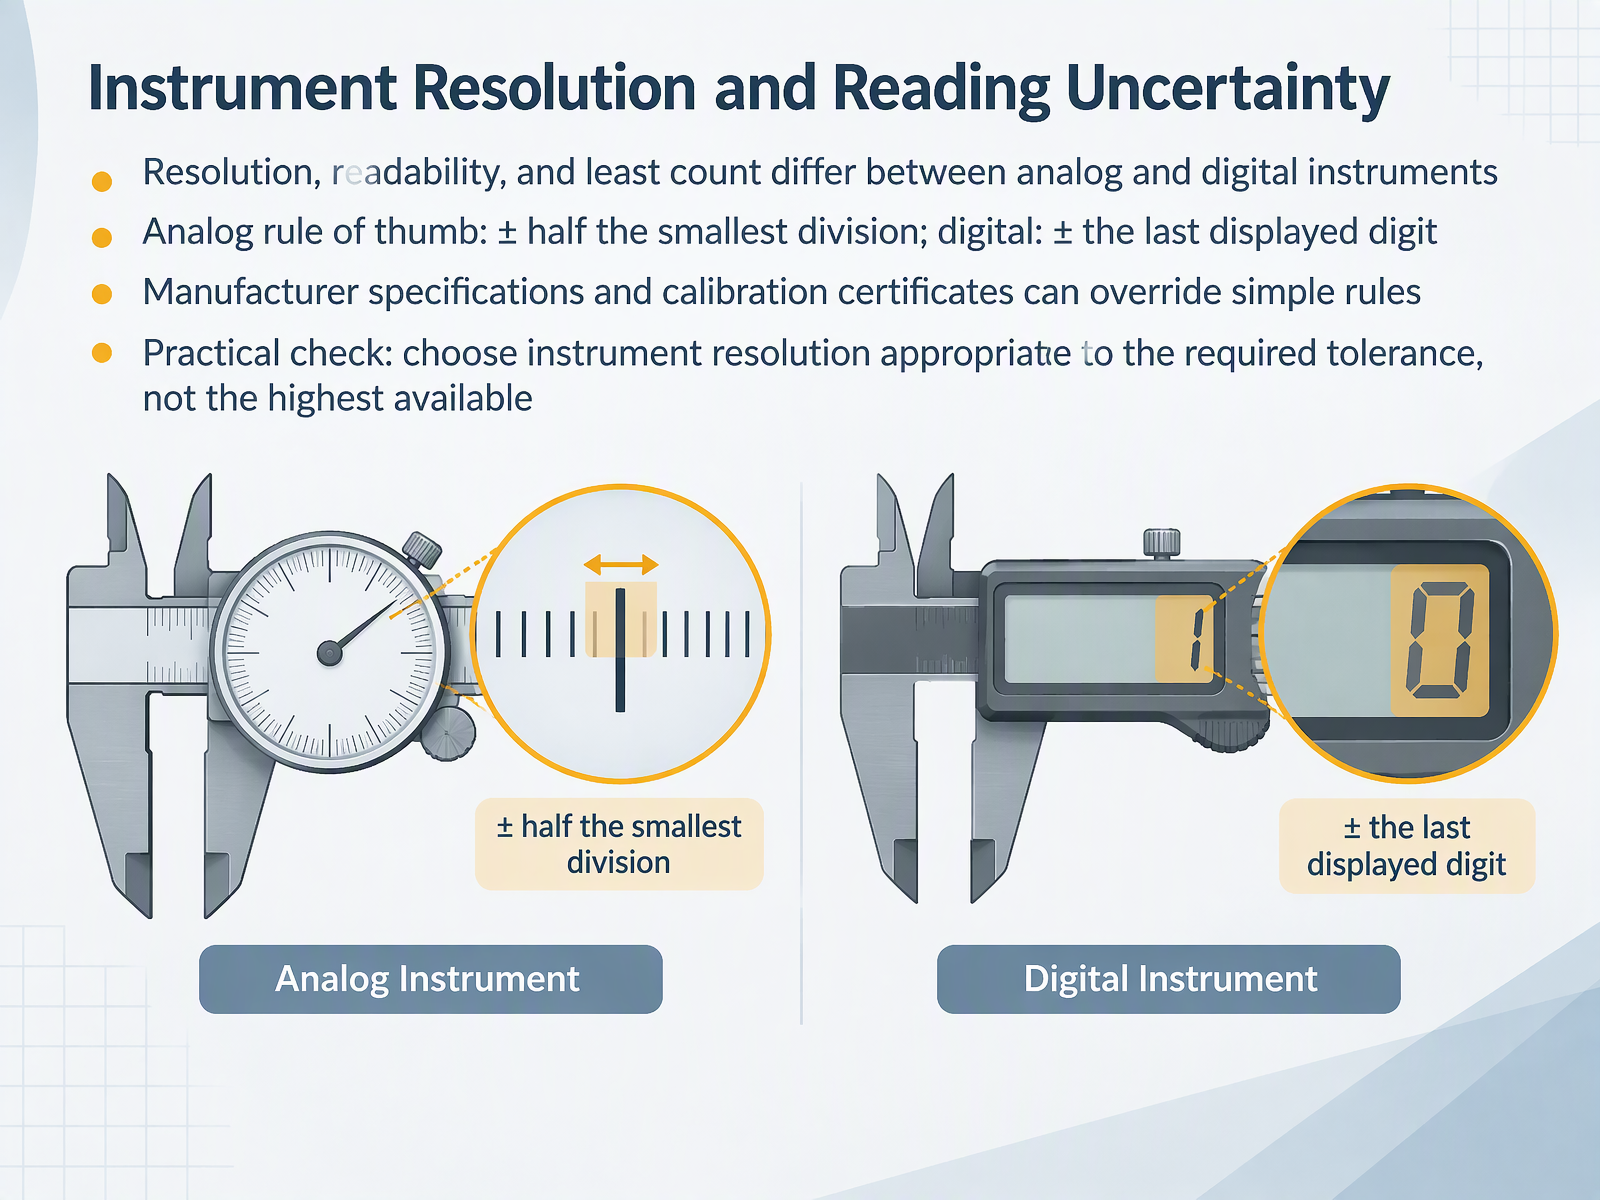
- 05Instrument Resolution and Reading UncertaintyNow let's talk about instrument resolution and reading uncertainty. Resolution, readability, and least count differ between analog and digital instruments. For an analog scale, a common rule of thumb is plus or minus half the smallest division. If your ruler has one millimeter marks, you'd estimate about half a millimeter of reading uncertainty. For a digital display, the simple rule is plus or minus the last displayed digit. But here's a check: manufacturer specifications and calibration certificates can override these simple rules, so always verify them. And when choosing an instrument, match its resolution to the tolerance you actually need, not the highest resolution available. A scale that reads to a thousandth of a gram is wasted effort if your method only requires a hundredth. Let's look next at how these ideas connect to significant figures in your reported results.
 doi.orgpubs.aip.orgserc.carleton.edu+21 min
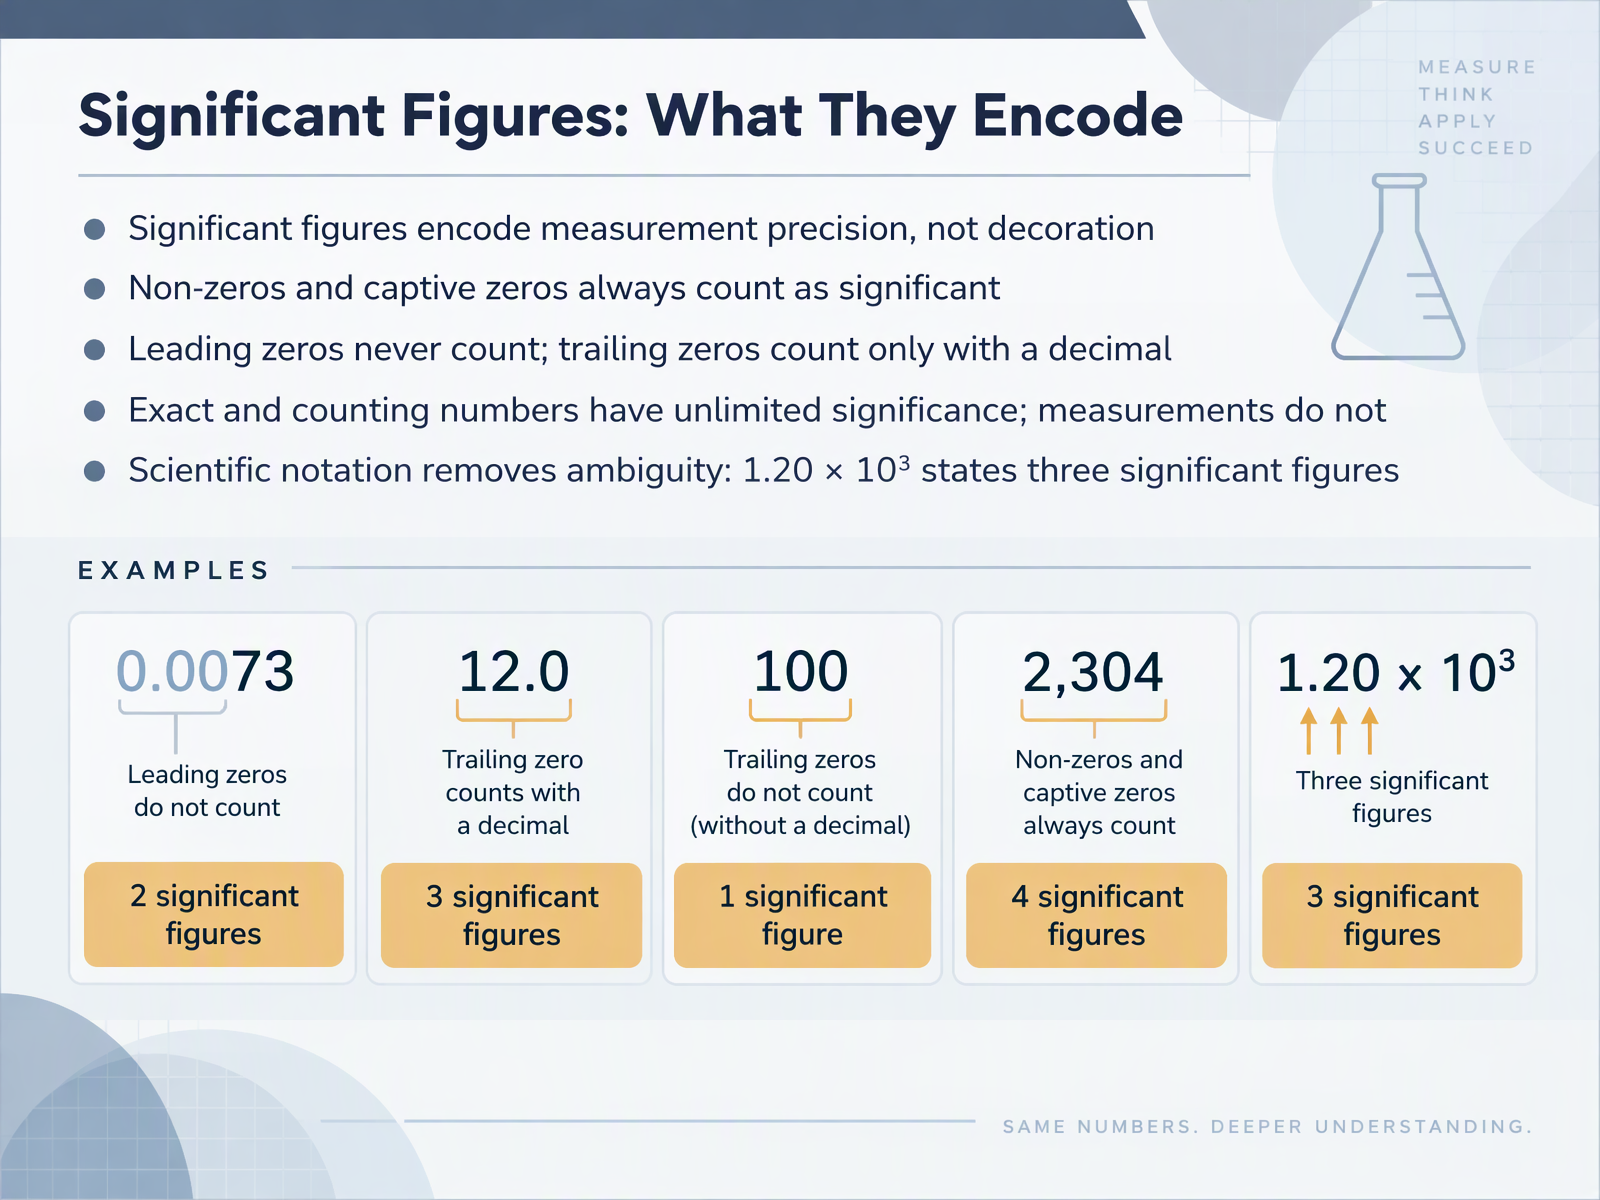
- 06Significant Figures: What They EncodeLet's turn to what significant figures actually encode. They are not decoration. Significant figures communicate the precision of a measurement. So how do we count them? Non-zero digits always count, and captive zeros, the zeros between non-zeros, always count too. For example, four point zero seven has three significant figures. Leading zeros never count. Zero point zero zero four, two has just two. Trailing zeros count only when a decimal point is present. One hundred twenty with no decimal is ambiguous, but one hundred twenty point with a decimal states three. Exact and counting numbers, like twelve students, have unlimited significance. Measurements do not. Scientific notation removes the ambiguity entirely. One point two zero times ten to the third states three significant figures clearly. As you read your own data, check each number this way before you round or report it. Next, we'll look at a meaning-first approach to teaching significant figures.
 2 min
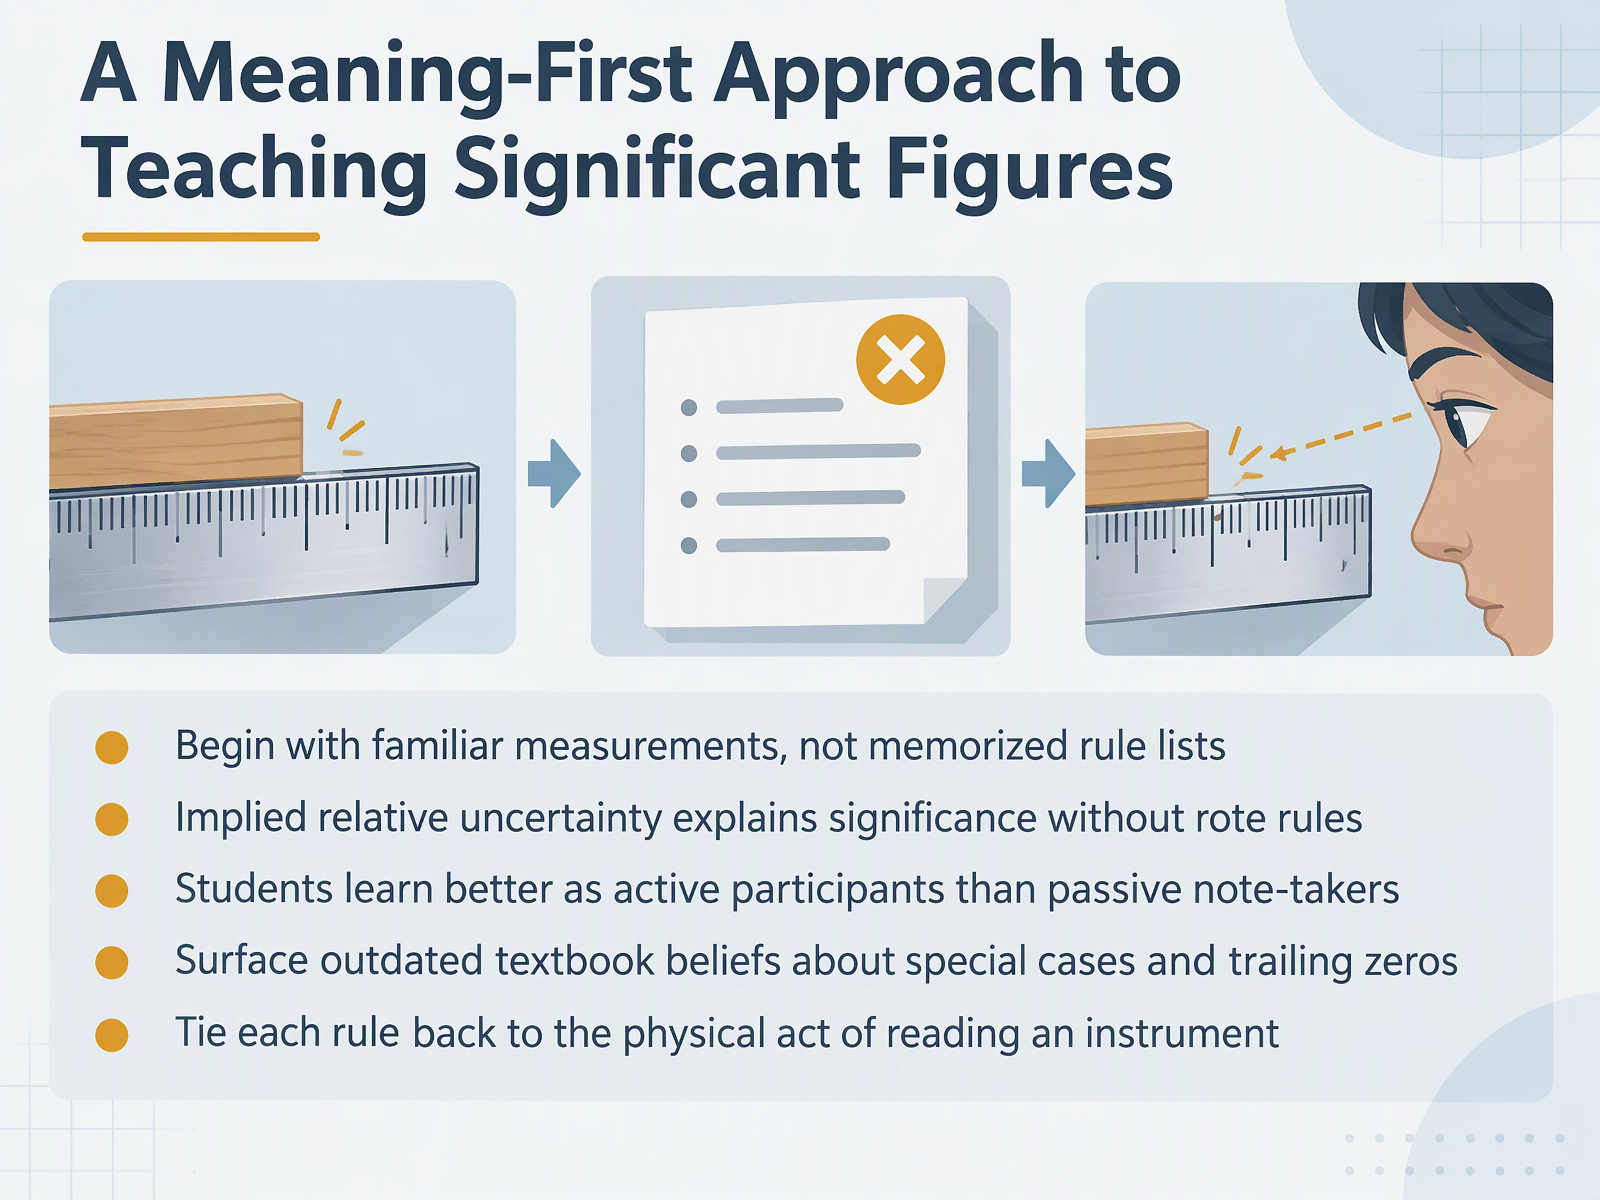
- 07A Meaning-First Approach to Teaching Significant FiguresNow let's talk about a meaning-first approach to teaching significant figures. Instead of handing students a memorized list of rules, start with measurements they already know, like reading a ruler or a beaker. The idea of implied relative uncertainty explains significance naturally, because each digit tells you how precisely the instrument was read. Students also learn better as active participants, measuring and discussing, rather than as passive note-takers copying rules. Along the way, surface outdated textbook beliefs about special cases and trailing zeros, and question them together. Then tie every rule back to the physical act of reading an instrument, so the rule has a reason. So before we move on, notice how each rule becomes a story about the measurement itself. Next, we'll look at rounding and arithmetic with significant figures.
 doi.orgpubs.aip.orgserc.carleton.edu+21 min
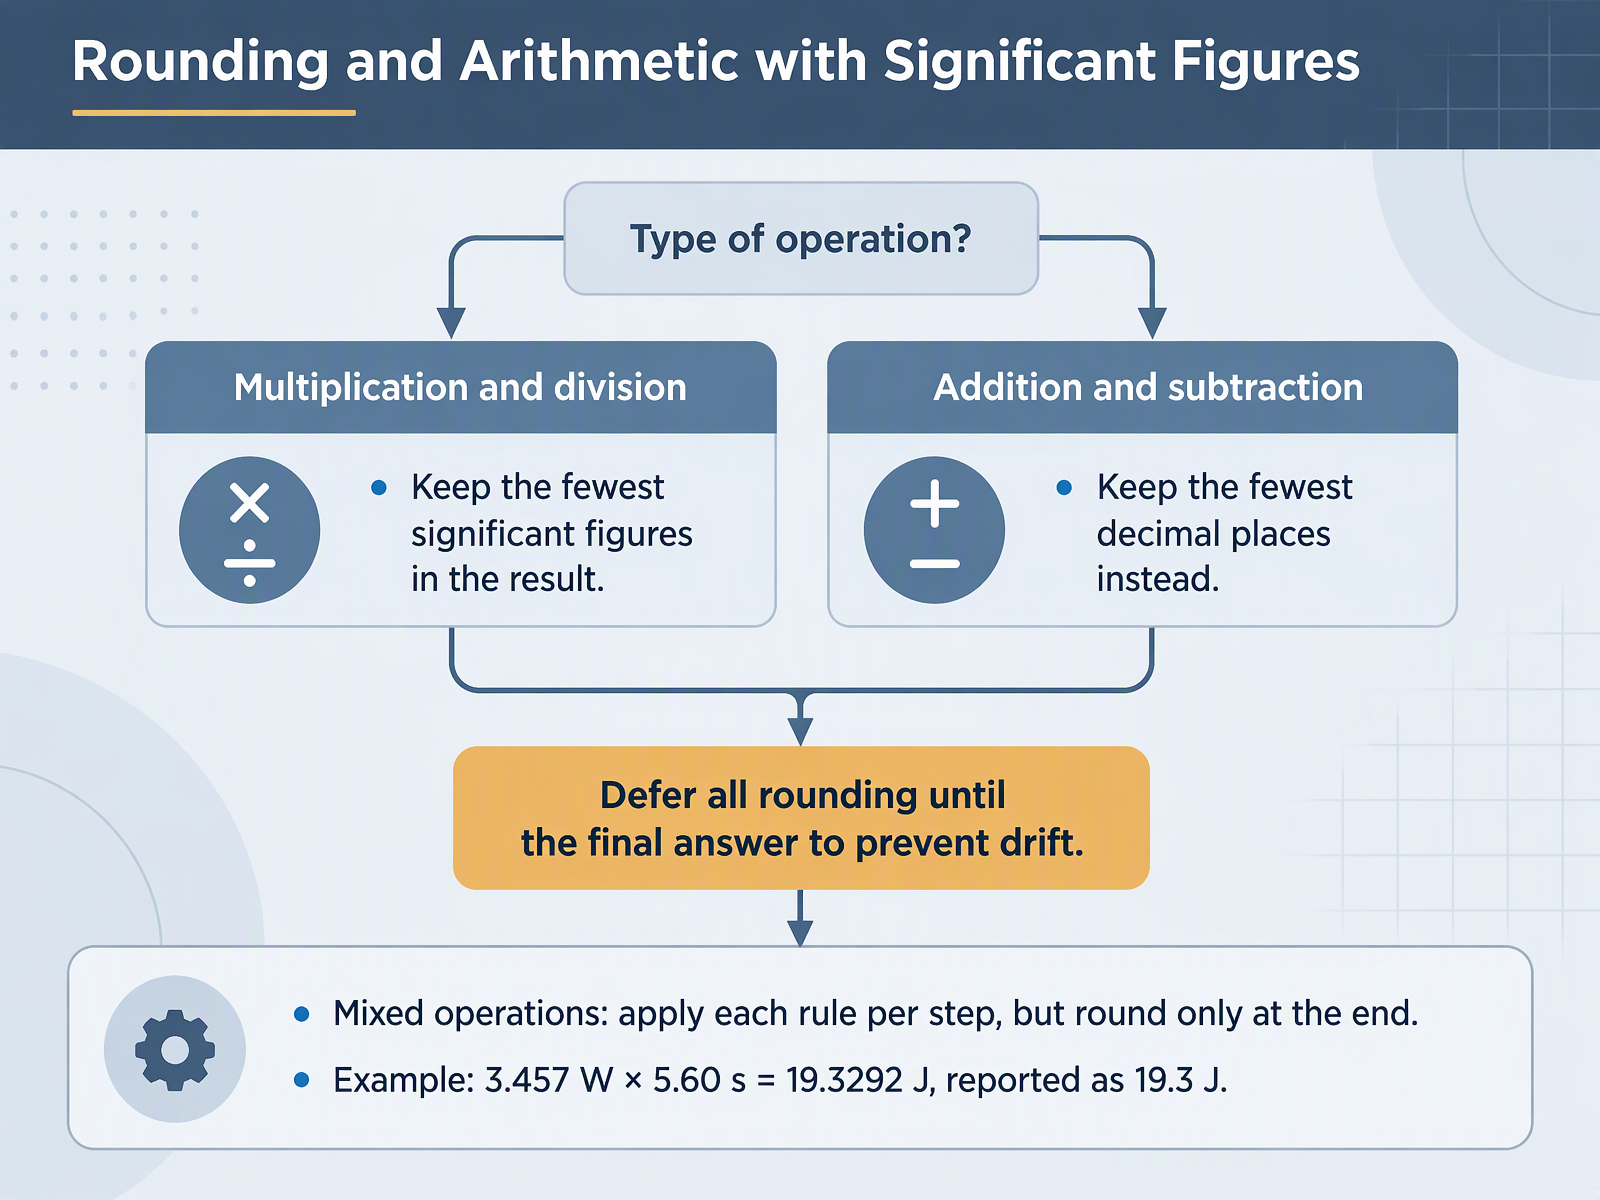
- 08Rounding and Arithmetic with Significant FiguresNow let's look at rounding and arithmetic with significant figures. For multiplication and division, keep the fewest significant figures found in your inputs. For addition and subtraction, keep the fewest decimal places instead. Here is the key habit. Defer all rounding until the final answer, so small rounding errors do not drift and build up. With mixed operations, apply each rule step by step, but round only at the end. For example, three point four five seven watts times five point six zero seconds equals nineteen point three two nine two joules. Since the fewest significant figures is three, report nineteen point three joules. Notice you do not round after the multiplication step and again later. One final round, one clean result. Next, we will see how uncertainty moves through calculations in Propagating Uncertainty Through Calculations.
 doi.orgpubs.aip.orgserc.carleton.edu+21 min
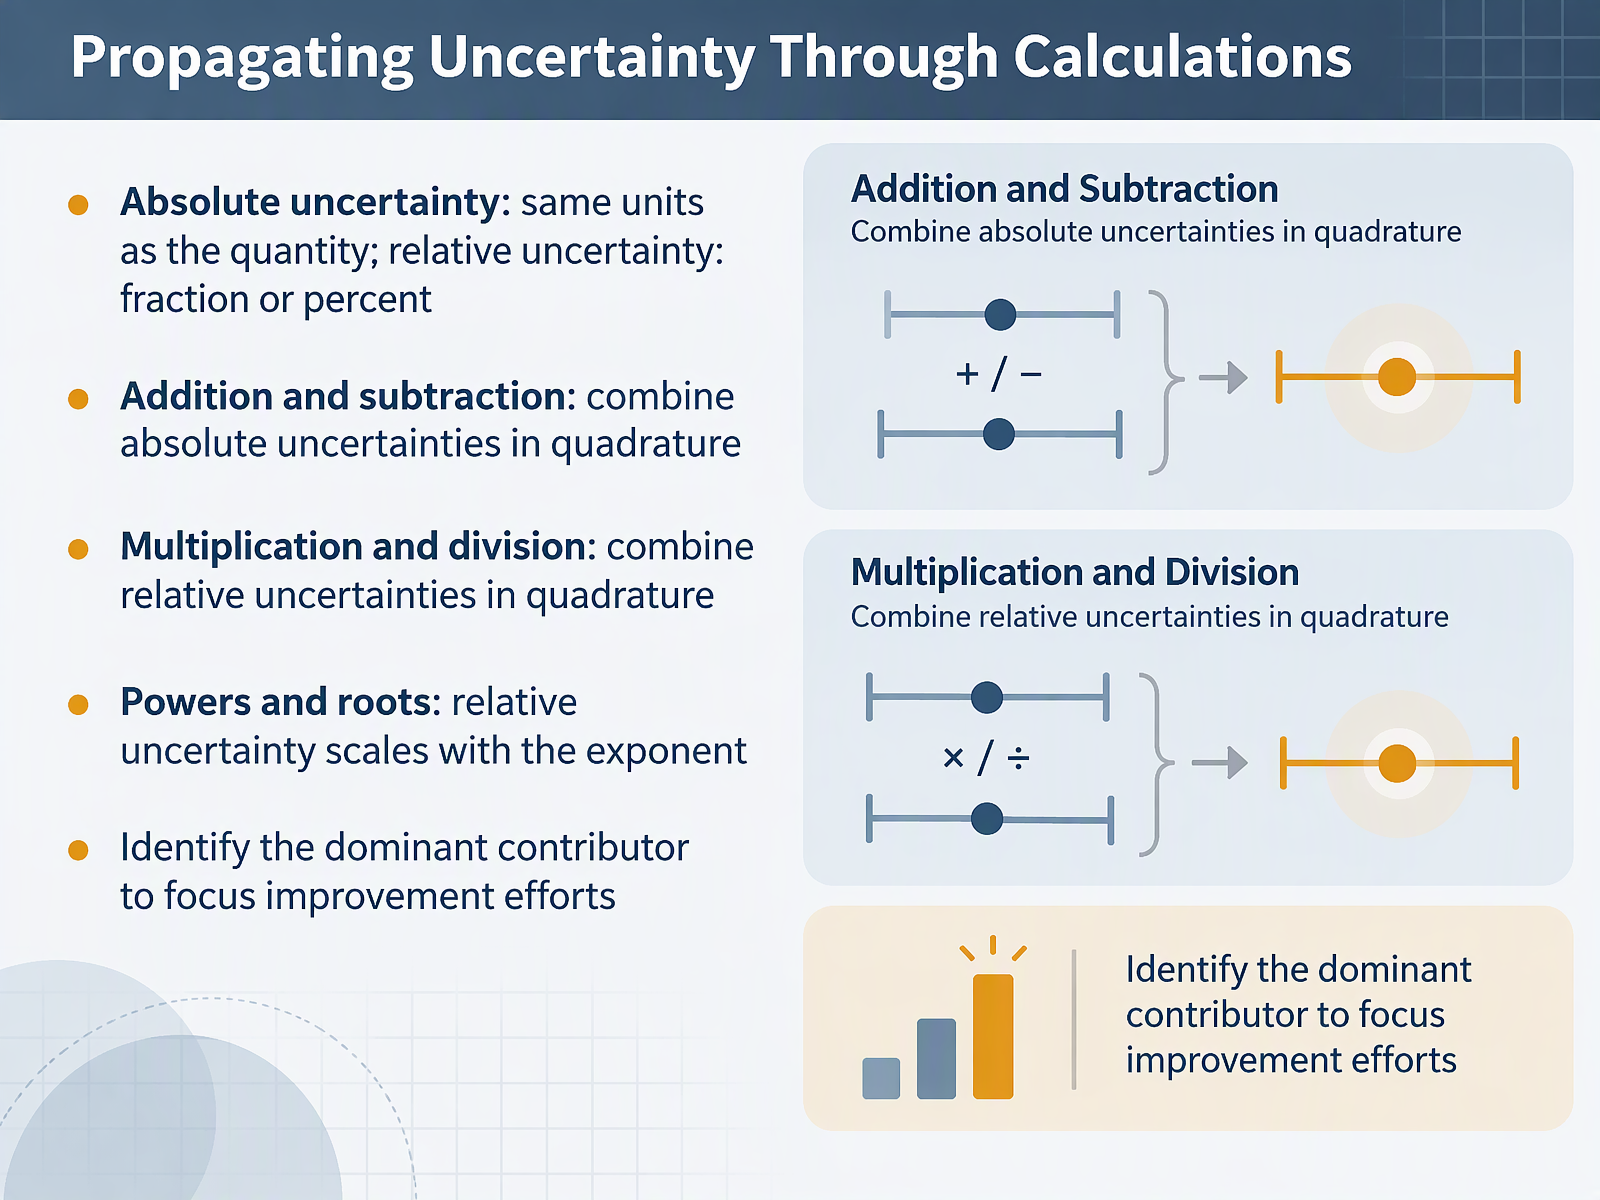
- 09Propagating Uncertainty Through CalculationsNow let's look at how uncertainty propagates through calculations. First, distinguish two kinds of uncertainty. Absolute uncertainty carries the same units as the quantity, like plus or minus 0.5 centimeters. Relative uncertainty expresses that as a fraction or a percent, which makes it easy to compare contributions of different sizes. When you add or subtract quantities, combine their absolute uncertainties in quadrature, meaning square each one, add them, and take the square root. When you multiply or divide, do the same thing with the relative uncertainties. For powers and roots, the relative uncertainty scales with the exponent. For example, if you square a value, its relative uncertainty roughly doubles. Finally, identify the dominant contributor, the largest uncertainty term, because that is where improvement pays off most. Next, we'll look at reporting results that communicate precision.
 tandfonline.comdoi.orgpubs.acs.org+21 min
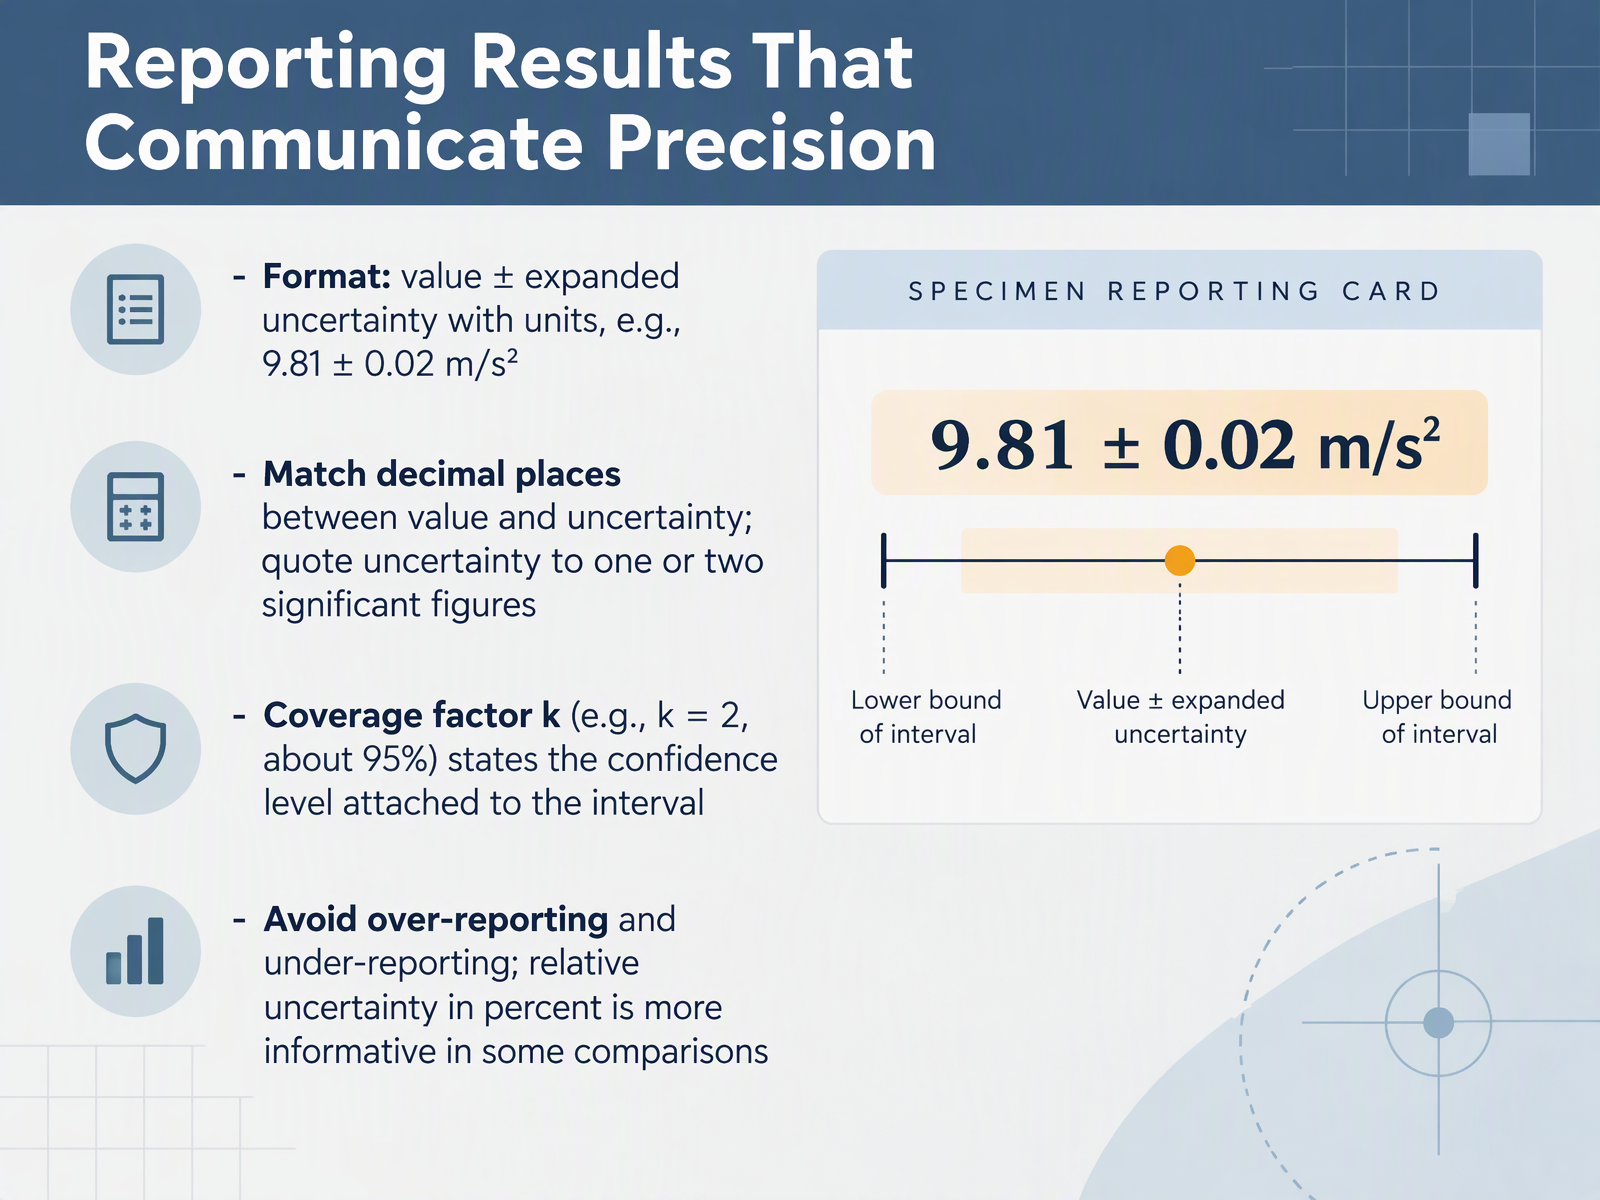
- 10Reporting Results That Communicate PrecisionNow let's put all of this together into a clear way to report your results. The standard format is the measured value, plus or minus the expanded uncertainty, with units included. For example, 9.81 plus or minus 0.02 meters per second squared. Here's the key rule: match the decimal places between the value and the uncertainty. And quote the uncertainty to one or two significant figures, not more. You'll also often see a coverage factor, k. When k equals 2, the interval corresponds to roughly a ninety-five percent level of confidence. That tells your reader what the uncertainty statement actually means. Finally, avoid both over-reporting and under-reporting. Give just enough digits to communicate the precision honestly. In some comparisons, relative uncertainty as a percentage is more informative. Pause here and check: does your reported value and uncertainty share the same last decimal place? Let's move on to common pitfalls and misconceptions.
 doi.orgpubs.aip.orgserc.carleton.edu+21 min
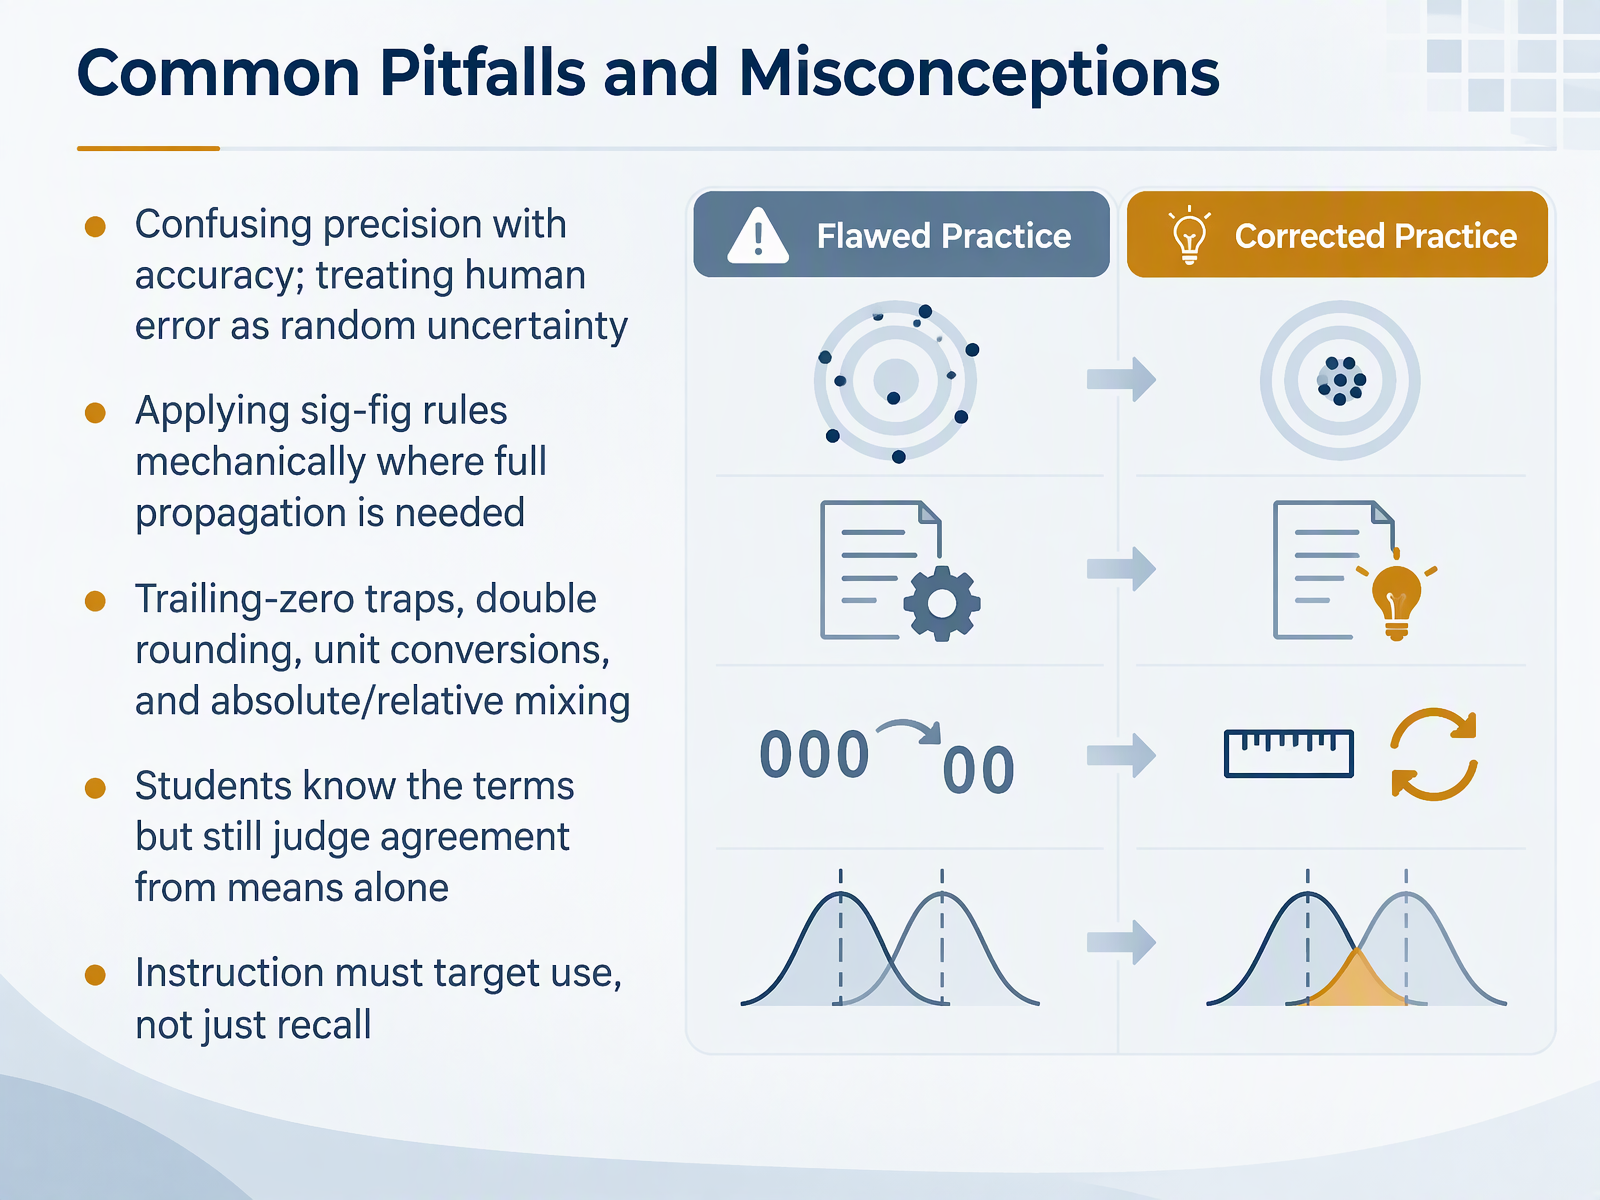
- 11Common Pitfalls and MisconceptionsLet's turn to the common pitfalls that trip students up, because knowing the terms is not the same as using them well. First, students often confuse precision with accuracy, and they treat human error as if it were random uncertainty. In a lab, a misread scale or a forgotten zero is a mistake, not the natural spread you measure by repeating trials. Second, some apply significant figure rules mechanically when a full uncertainty propagation is actually needed. Third, watch for trailing zero traps, double rounding, unit conversions, and mixing absolute with relative uncertainty. Here is the big one from the research. Many students recognize that uncertainty matters, yet when two results differ, they still judge agreement from the means alone. Instruction has to target use, not just recall. So pause and ask yourself, on your next data set, will you compare intervals, or just the averages? Next, we will put these ideas into practice with worked examples and mini exercises.
 tandfonline.comdoi.orgpubs.acs.org+22 min
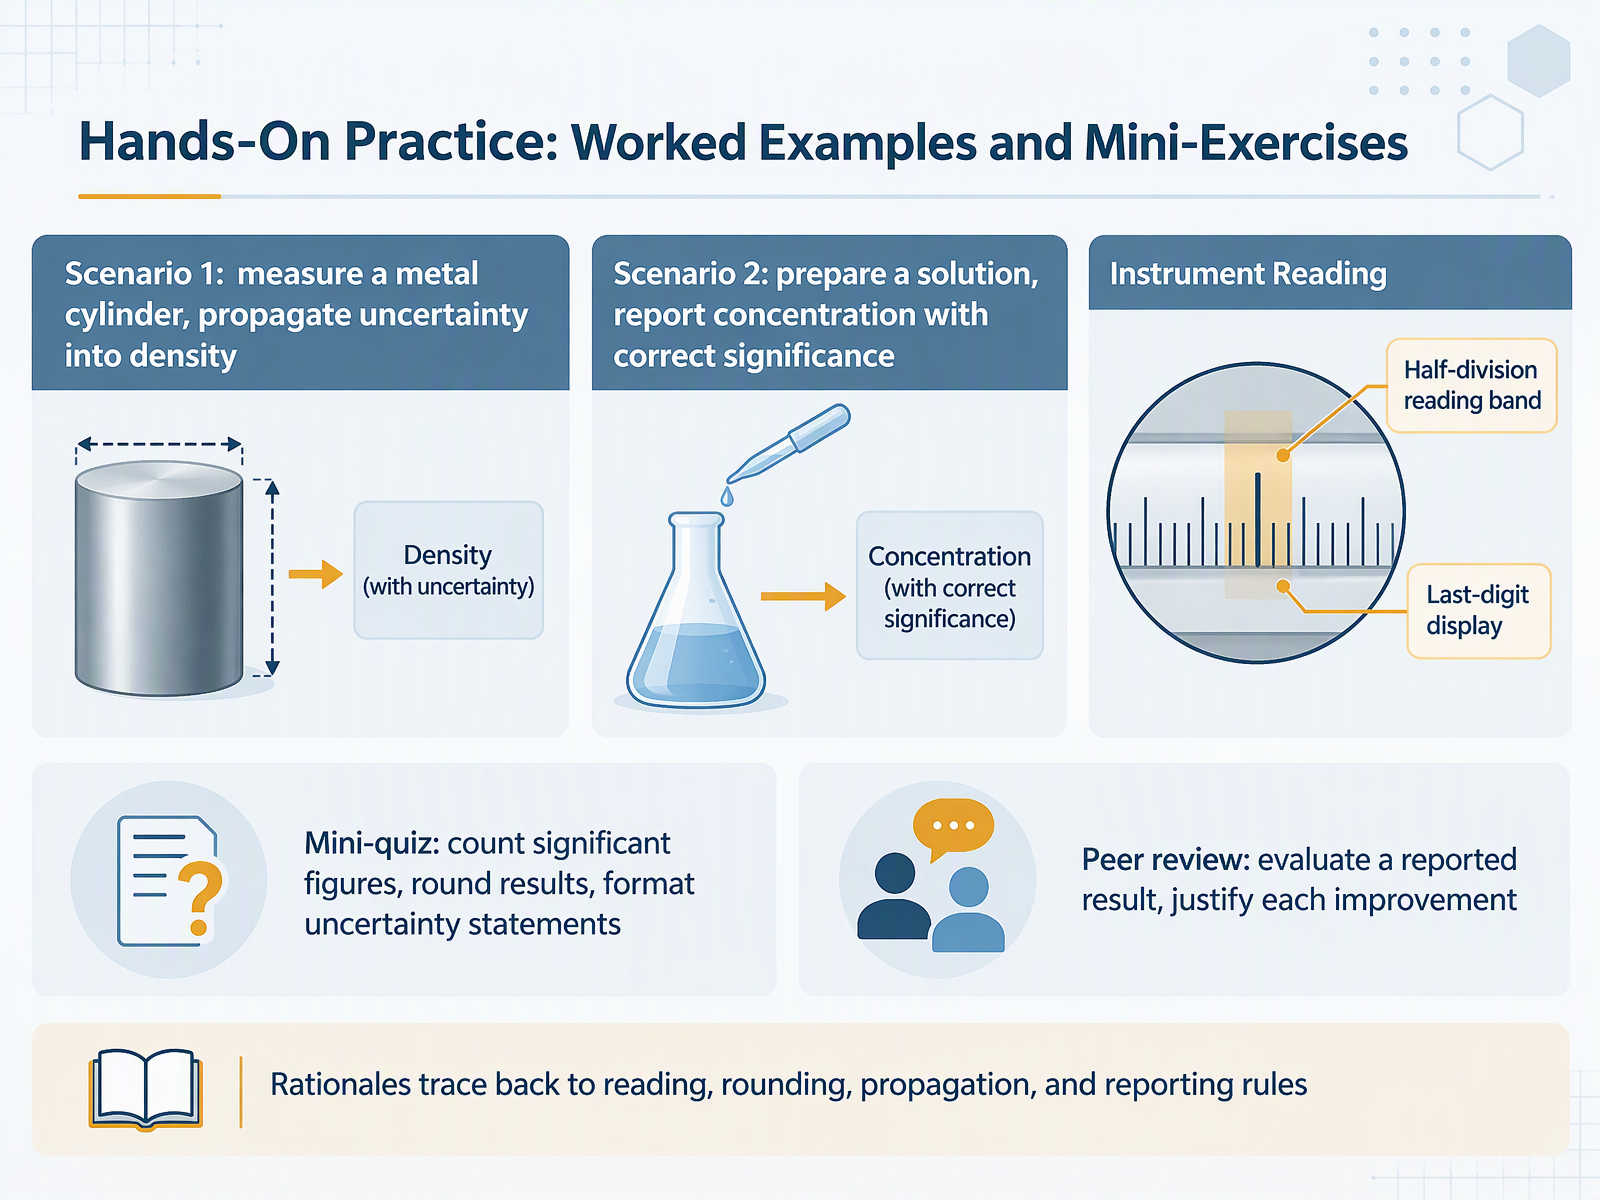
- 12Hands-On Practice: Worked Examples and Mini-ExercisesNow let's put these rules into practice. In our first worked scenario, you measure a metal cylinder's diameter, length, and mass, then propagate each uncertainty into the calculated density. Watch how the diameter uncertainty has the largest effect, since it appears cubed in the volume formula. Pause and check your own propagation before moving on. In scenario two, you prepare a solution and report its concentration with the correct number of significant figures, driven by the least precise measurement. For the mini quiz, count significant figures, round each result, and format uncertainty statements so the measured value and the uncertainty match in decimal place. Examples like nine point six one plus or minus zero point zero three show the pattern. Finally, in peer review, evaluate a reported result and justify every improvement you suggest. For each change, trace the rationale back to one of four rules: reading the instrument, rounding, propagation, or reporting. Ask yourself whether the number of significant figures in the uncertainty justifies the digits you kept. That habit keeps your work honest and repeatable. Next, we look at Designing Uncertainty-Aware Lab Activities.
 doi.orgpubs.aip.orgserc.carleton.edu+22 min
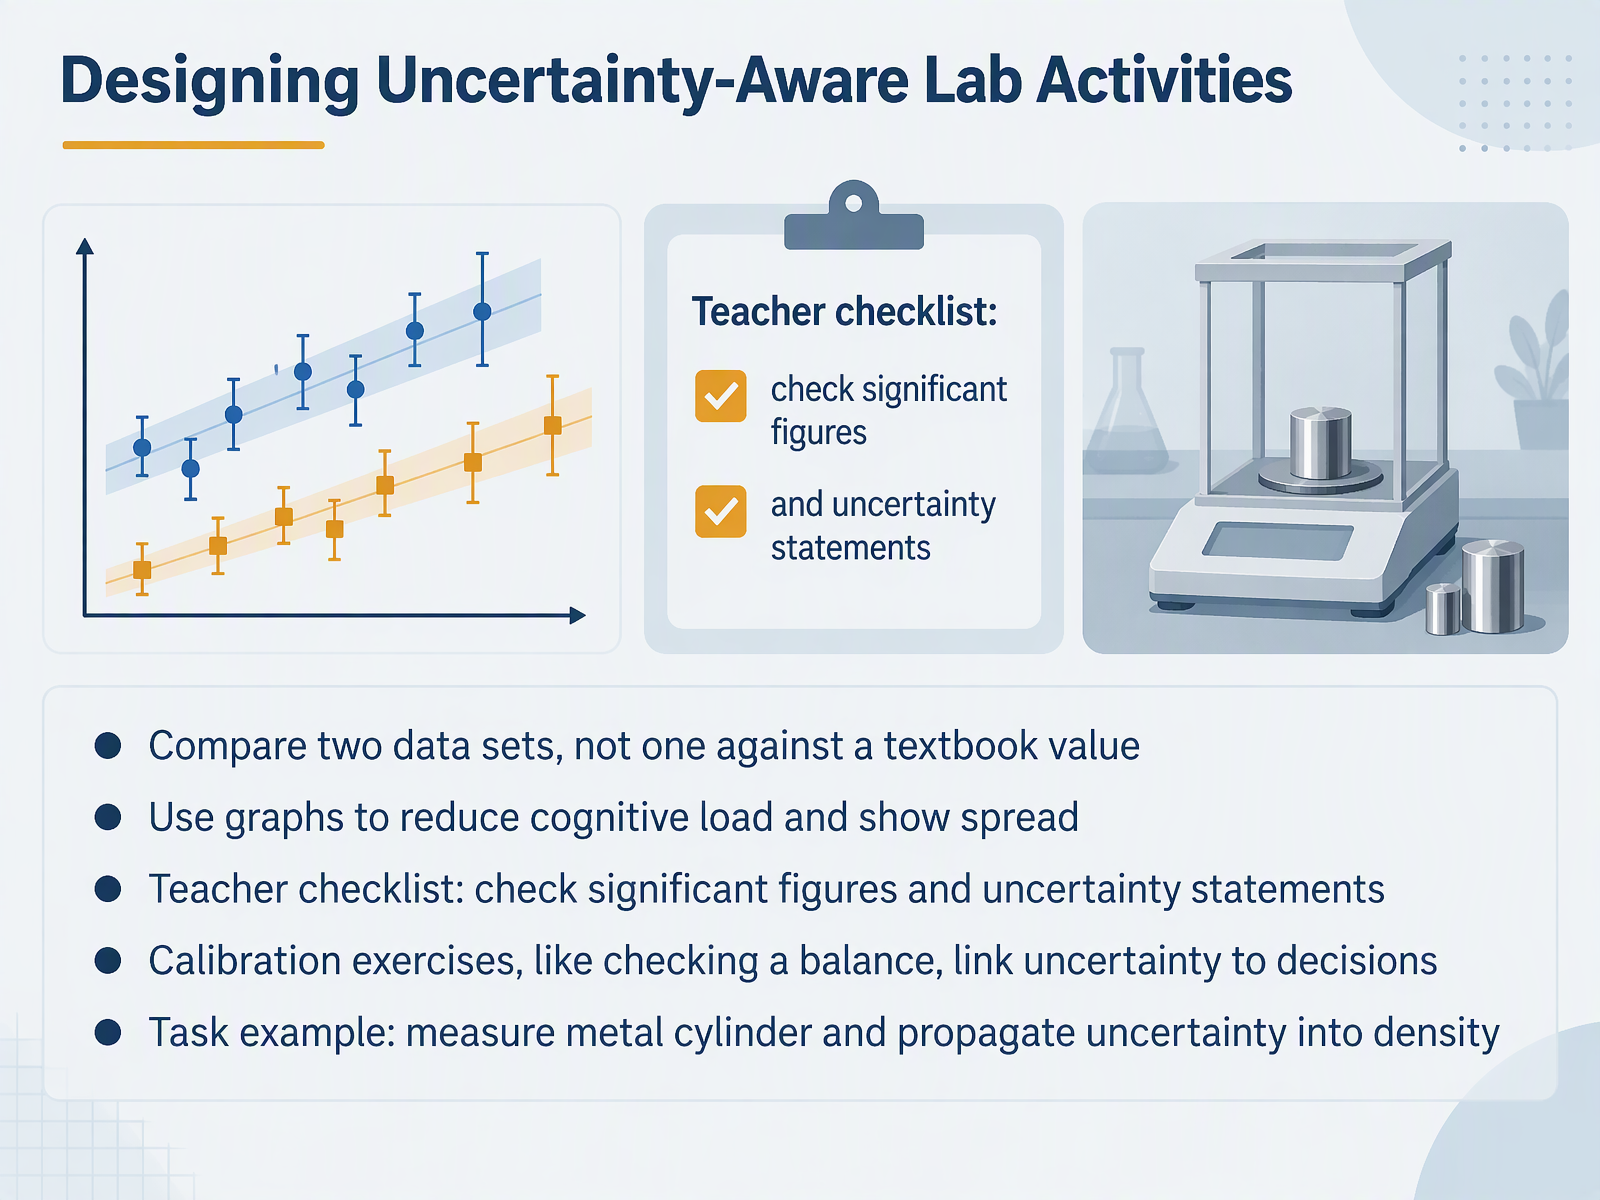
- 13Designing Uncertainty-Aware Lab ActivitiesNow let's put this into practice by designing uncertainty-aware lab activities. First, have students compare two data sets with each other, rather than comparing one measurement against a textbook value. That makes uncertainty meaningful. Next, use graphs to reduce cognitive load and show the spread of results visually. As a teacher, keep a simple checklist: verify significant figures and require an explicit uncertainty statement in every report. Calibration exercises, like checking a balance with known weights, connect uncertainty to real decisions. For a concrete task, have students measure a metal cylinder and propagate the uncertainty into a calculated density. Pause and ask yourself: does my activity make students reason about confidence, not just compute a number? Next, we'll look at standards, takeaways, and further reading.
 doi.orgpubs.aip.orgserc.carleton.edu+21 min
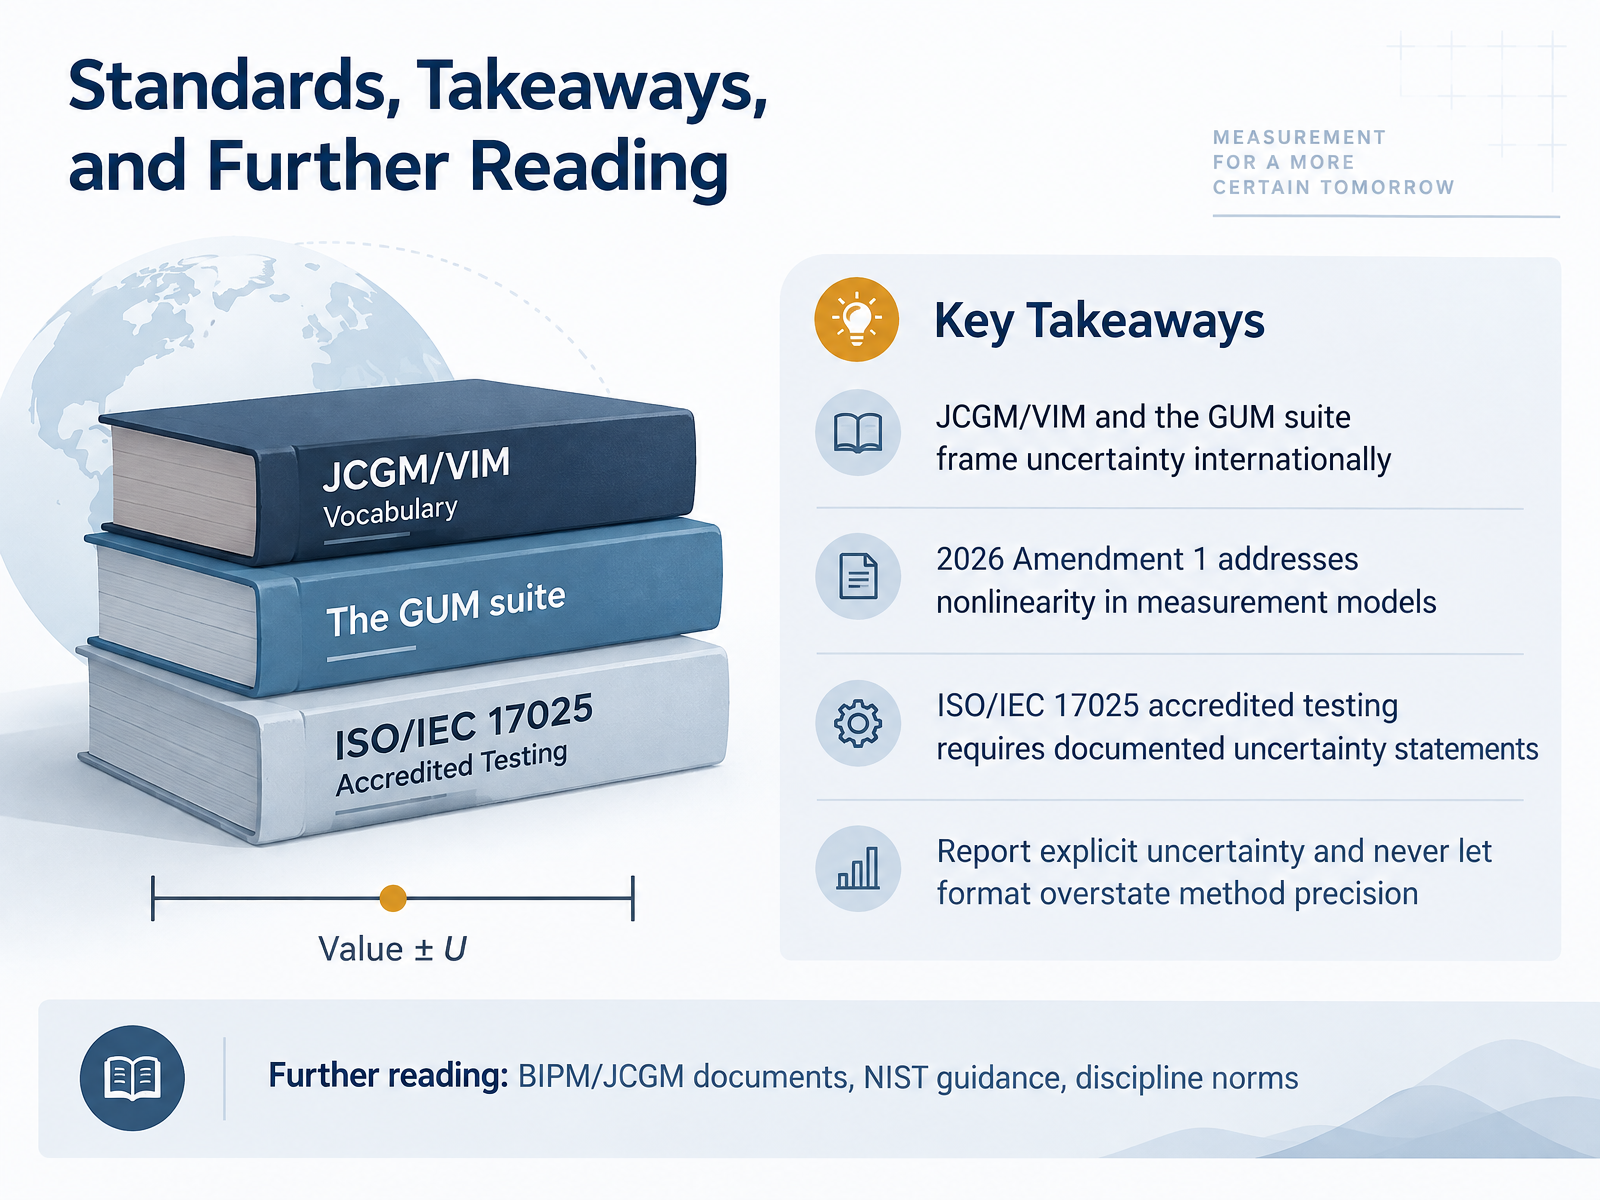
- 14Standards, Takeaways, and Further ReadingLet's close by placing your work inside the wider standards. Internationally, the Vocabulary in Metrology, or VIM, and the GUM suite from the Joint Committee for Guides in Metrology frame how uncertainty is defined and expressed. One recent update matters for nonlinear models. Amendment one to JCGM 100, published in 2026, addresses nonlinearity, and it tells you to include higher order terms or use a Monte Carlo method when a simple linear approximation is not enough. In accredited testing under ISO and IEC 17025, documented uncertainty statements are mandatory, so what you practiced here has a real regulatory weight. Two habits carry forward. Report uncertainty explicitly, and never let formatting overstate the precision of your method. If you write a value as fifteen point five plus or minus zero point one, let those digits match what the method supports. For further reading, start with the BIPM and JCGM documents, then NIST guidance, then the norms of your own discipline. Thank you for working through this with me. Keep reporting honestly, and trust that clear uncertainty makes your results stronger, not weaker.
 bipm.orgbipm.orgdoi.org+22 min
Take the deck with you
Download this course as a file — free, no sign-up needed.
- PDF handoutEvery slide page, ready to print or share.15 pages · 3.2 MBDownload
- Narrated PowerPointThe deck that presents itself — every slide carries the digital human's narration video.15 pages · 13.1 MBDownload
- PowerPoint slidesThe full deck as a .pptx — open it in PowerPoint, Keynote, or Google Slides.15 pages · 3.1 MBDownload
Free to use in your own training — please keep the PersonWise credit page at the end.
Have your own deck? Turn it into a course
Sources consulted
Web sources consulted while building this course.
- publications - BIPM — bipm.org
- Evaluation of measurement data — Guide to the expression of uncertainty in measurement. AMENDMENT 1: Nonlinearity in measurement models — bipm.org
- Evaluation of measurement data — Guide to the expression of uncertainty in measurement. AMENDMENT 1: Nonlinearity in measurement models — doi.org
- ISO/IEC Guide 98-3:2008/Amd 1:2026 - Uncertainty of measurement — Part 3: Guide to the expression of uncertainty in measurement (GUM:1995) — Amendment 1: Nonlinearity in measurement models — iso.org
- JCGM Working Group on the Expression of Uncertainty in Measurement - BIPM — bipm.org
- Teaching measurement uncertainty in physics: aligning classroom practice with the modern GUM framework — doi.org
- Significant Figures in Measurements with Uncertainty: A Working Criterion | The Physics Teacher | AIP Publishing — pubs.aip.org
- Why Teach Measurement and Uncertainty? — serc.carleton.edu
- How Can an Instructor Best Introduce the Topic of Significant Figures to Students Unfamiliar with the Concept? | Journal of Chemical Education — pubs.acs.org
- Teacher’s Handbook Measurement Uncertainties — lernen.physik.hu-berlin.de
- Full article: Investigating student reasoning about measurement uncertainty and ability to draw conclusions from measurement data in inquiry-based university physics labs — tandfonline.com
- Using a research-based assessment instrument to explore undergraduate students’ proficiencies around measurement uncertainty in physics lab contexts — doi.org
- Introductory Physics Students' Treatment of Measurement Uncertainty — isobudgets.com
- Graphical representations of data improve student understanding of measurement and uncertainty: An eye-tracking study — doi.org