Business Intelligence Engineer Role
Begin
13 pages · ~26 min
Business Intelligence Engineer Role
This training explains the Business Intelligence Engineer role, covering core responsibilities, key skills, and how BI engineers turn data into insights. Ideal for aspiring BI professionals.
What you’ll learn
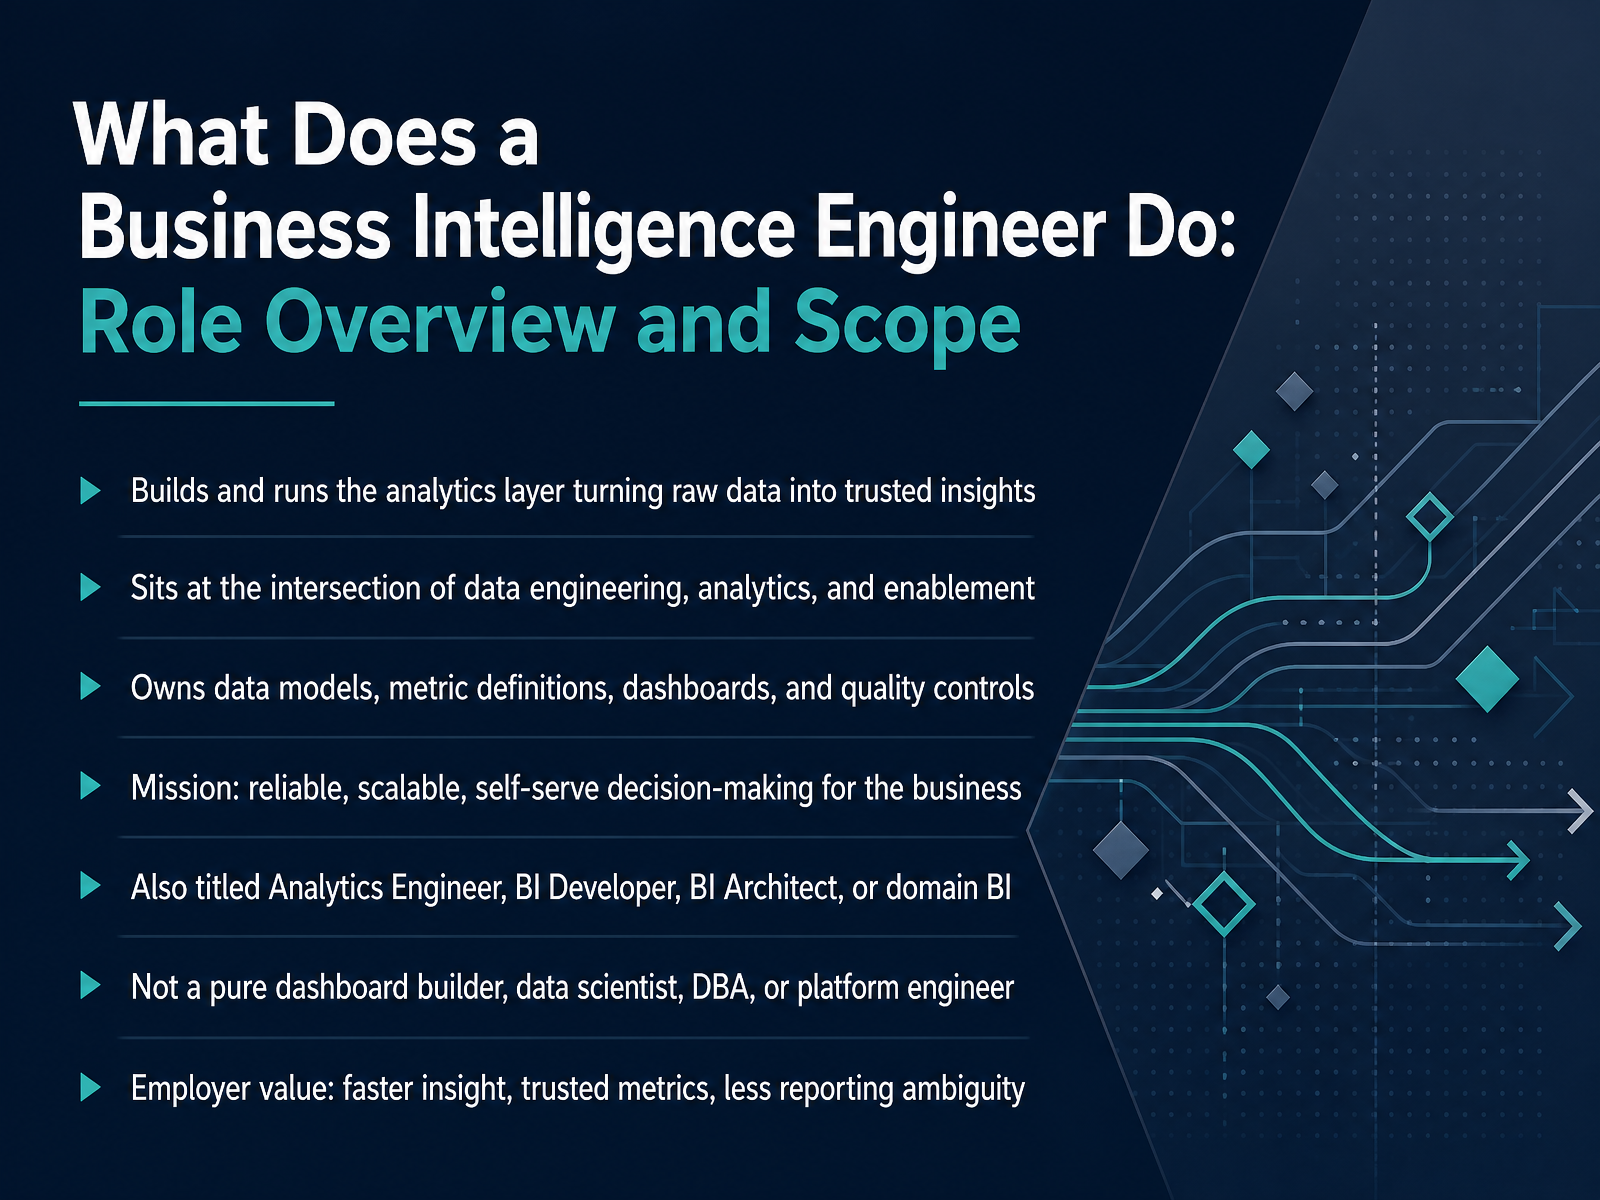
- 01What Does a Business Intelligence Engineer Do: Role Overview and ScopeWelcome. If you are exploring a career in data and analytics, or hiring for it, this course will clarify what a Business Intelligence Engineer actually does. Here is the big picture. A BI Engineer builds and runs the analytics layer that turns raw data into trusted insights. The role sits at the intersection of data engineering, analytics, and enablement. You own data models, metric definitions, dashboards, and quality controls. Your mission is reliable, scalable, self serve decision making for the business. You may see this role titled Analytics Engineer, BI Developer, BI Architect, or domain BI. But you are not a pure dashboard builder, a data scientist, a database administrator, or a platform engineer. Employers value you because you deliver faster insight, trusted metrics, and less reporting ambiguity. In short, you make data usable and dependable for decisions. Next, let us look at how the role evolved and why it matters now.1 min
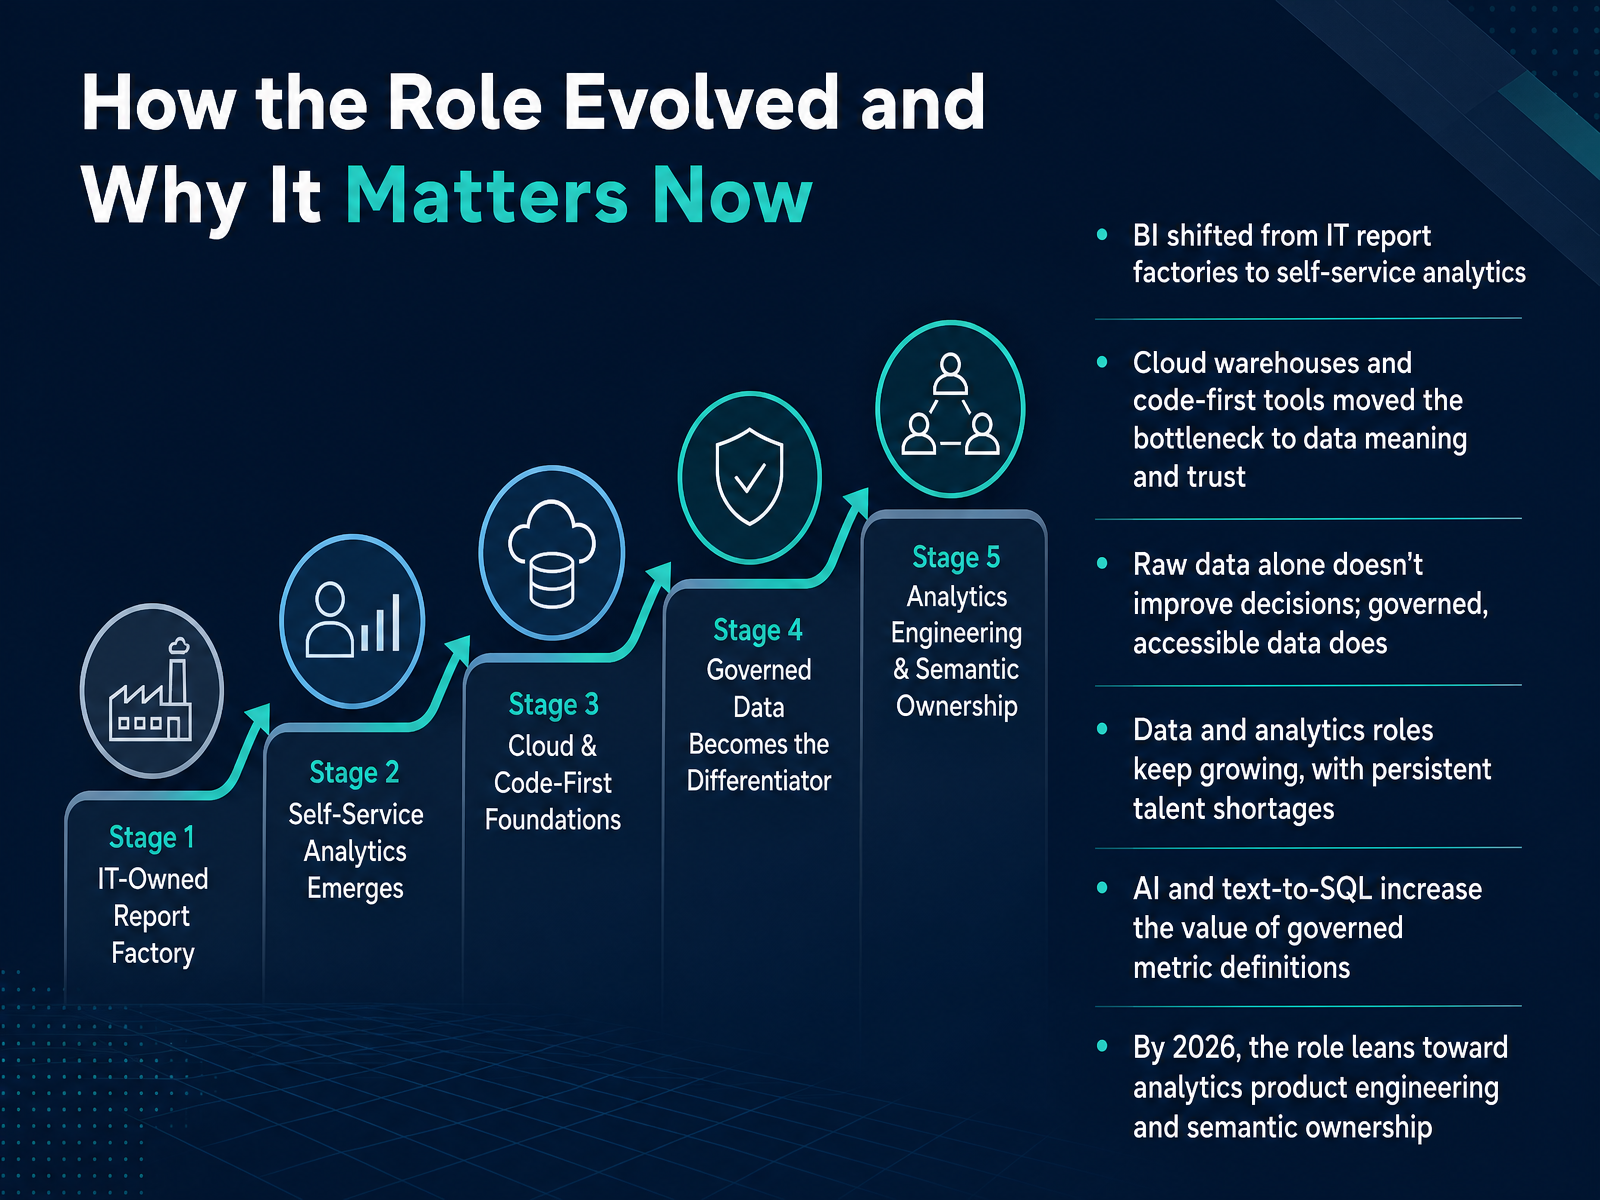
- 02How the Role Evolved and Why It Matters NowLet's look at how the role evolved and why it matters right now. Business intelligence used to run like an IT report factory. Analysts waited in a queue, and requests came back as static reports. Today, the shift is toward self-service analytics, where business users explore data on their own. Cloud warehouses and code-first tools changed the game. Pipelines became easier to build, and the real bottleneck moved to something harder: data meaning and trust. Here's the key point. Raw data alone doesn't improve decisions. Governed, accessible data does. That's where BI engineers add value. They define metrics, document logic, and make trustworthy data easy to find. Demand keeps growing too. Data and analytics roles remain in high demand, with persistent talent shortages. And as AI and text-to-SQL tools spread, well-governed metric definitions become even more valuable, because those systems need reliable semantics to work. Looking ahead to around twenty twenty-six, the role leans toward analytics product engineering and semantic ownership. So the takeaway is this: the job is less about cranking out reports and more about building trusted data products. Next, let's walk through core responsibilities and day-to-day work.
 2 min
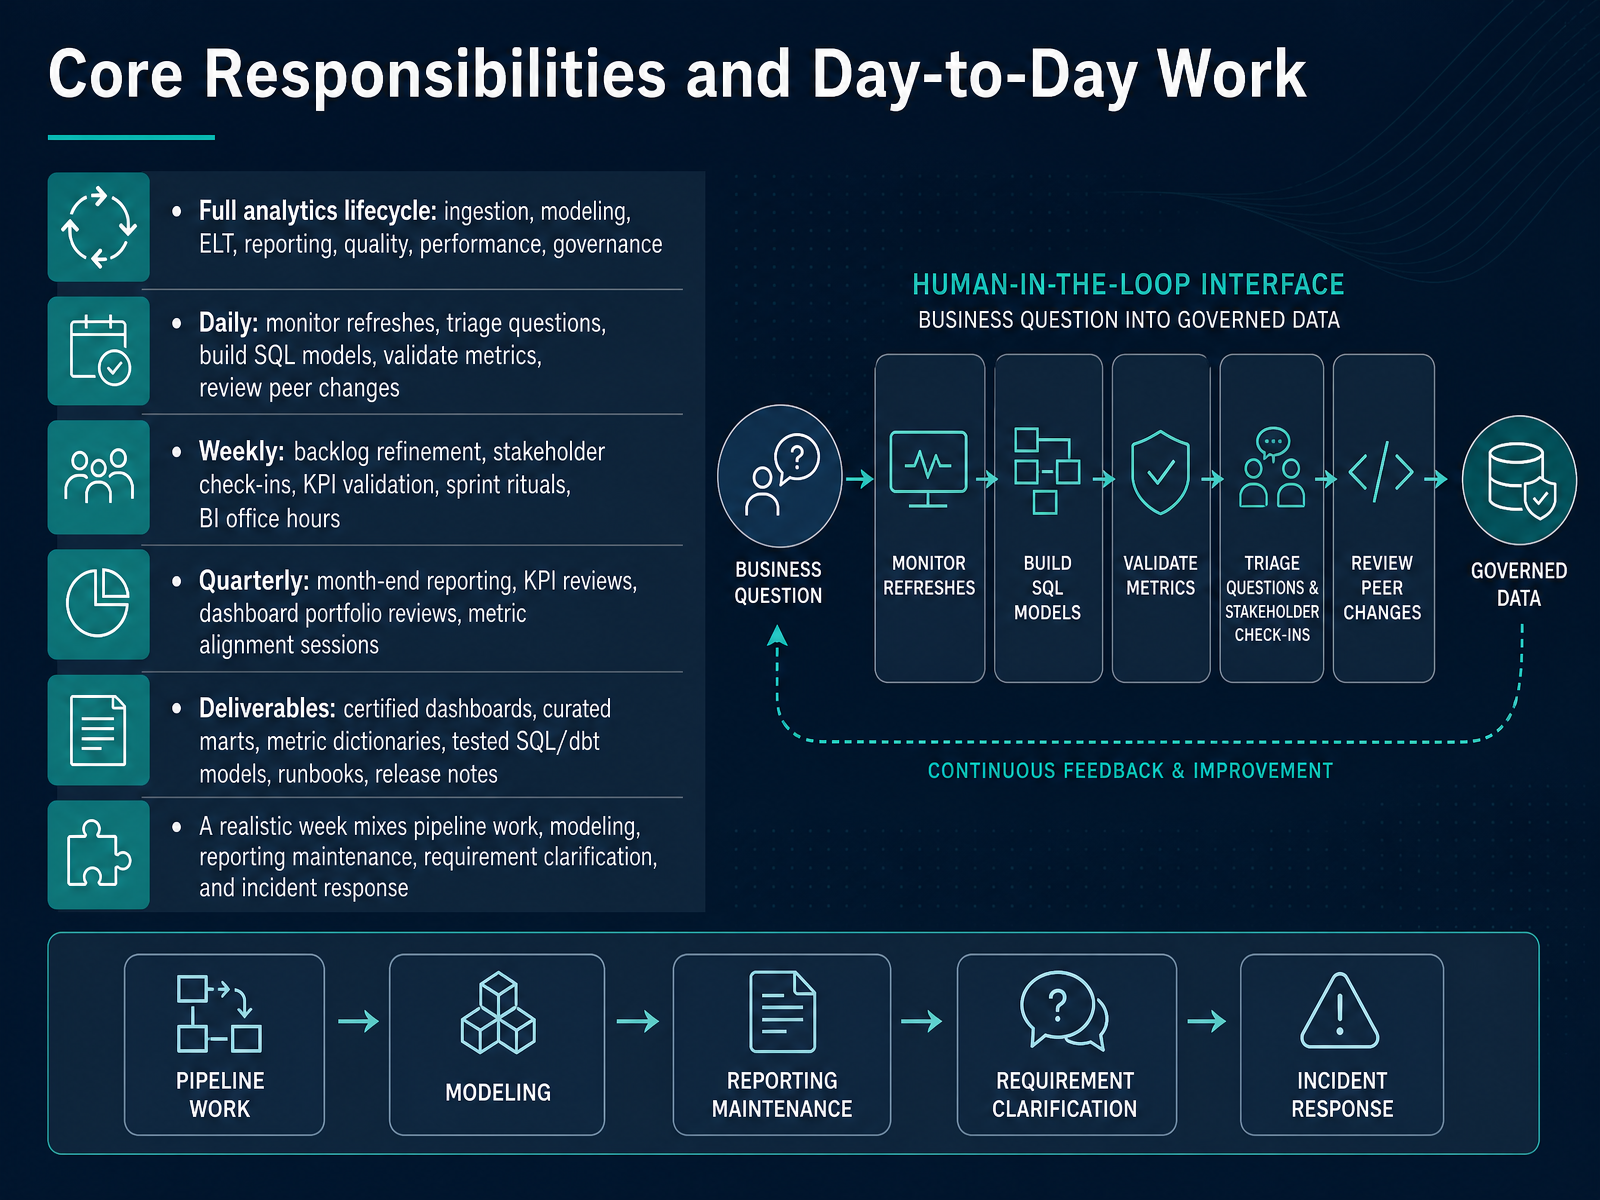
2 min - 03Core Responsibilities and Day-to-Day WorkLet's break down what the job actually looks like day to day. A BI engineer owns the full analytics lifecycle: ingestion brings raw data in, modeling shapes it, extract, load, and transform moves and preps it, reporting delivers it, and quality, performance, and governance keep it trustworthy. On a typical day, you monitor refreshes, triage stakeholder questions, build SQL models, validate metrics, and review peer changes before they ship. Each week brings backlog refinement, stakeholder check-ins, KPI validation, sprint rituals, and BI office hours. Quarterly, expect month-end reporting, KPI reviews, dashboard portfolio reviews, and metric alignment sessions. Your deliverables are concrete: certified dashboards, curated data marts, metric dictionaries, tested SQL and dbt models, runbooks, and release notes. A realistic week mixes pipeline work, modeling, reporting maintenance, requirement clarification, and incident response. So think of this role as part builder, part steward, keeping data reliable and decisions well supported. Next, let's look at the Essential Technical Toolkit.
 2 min
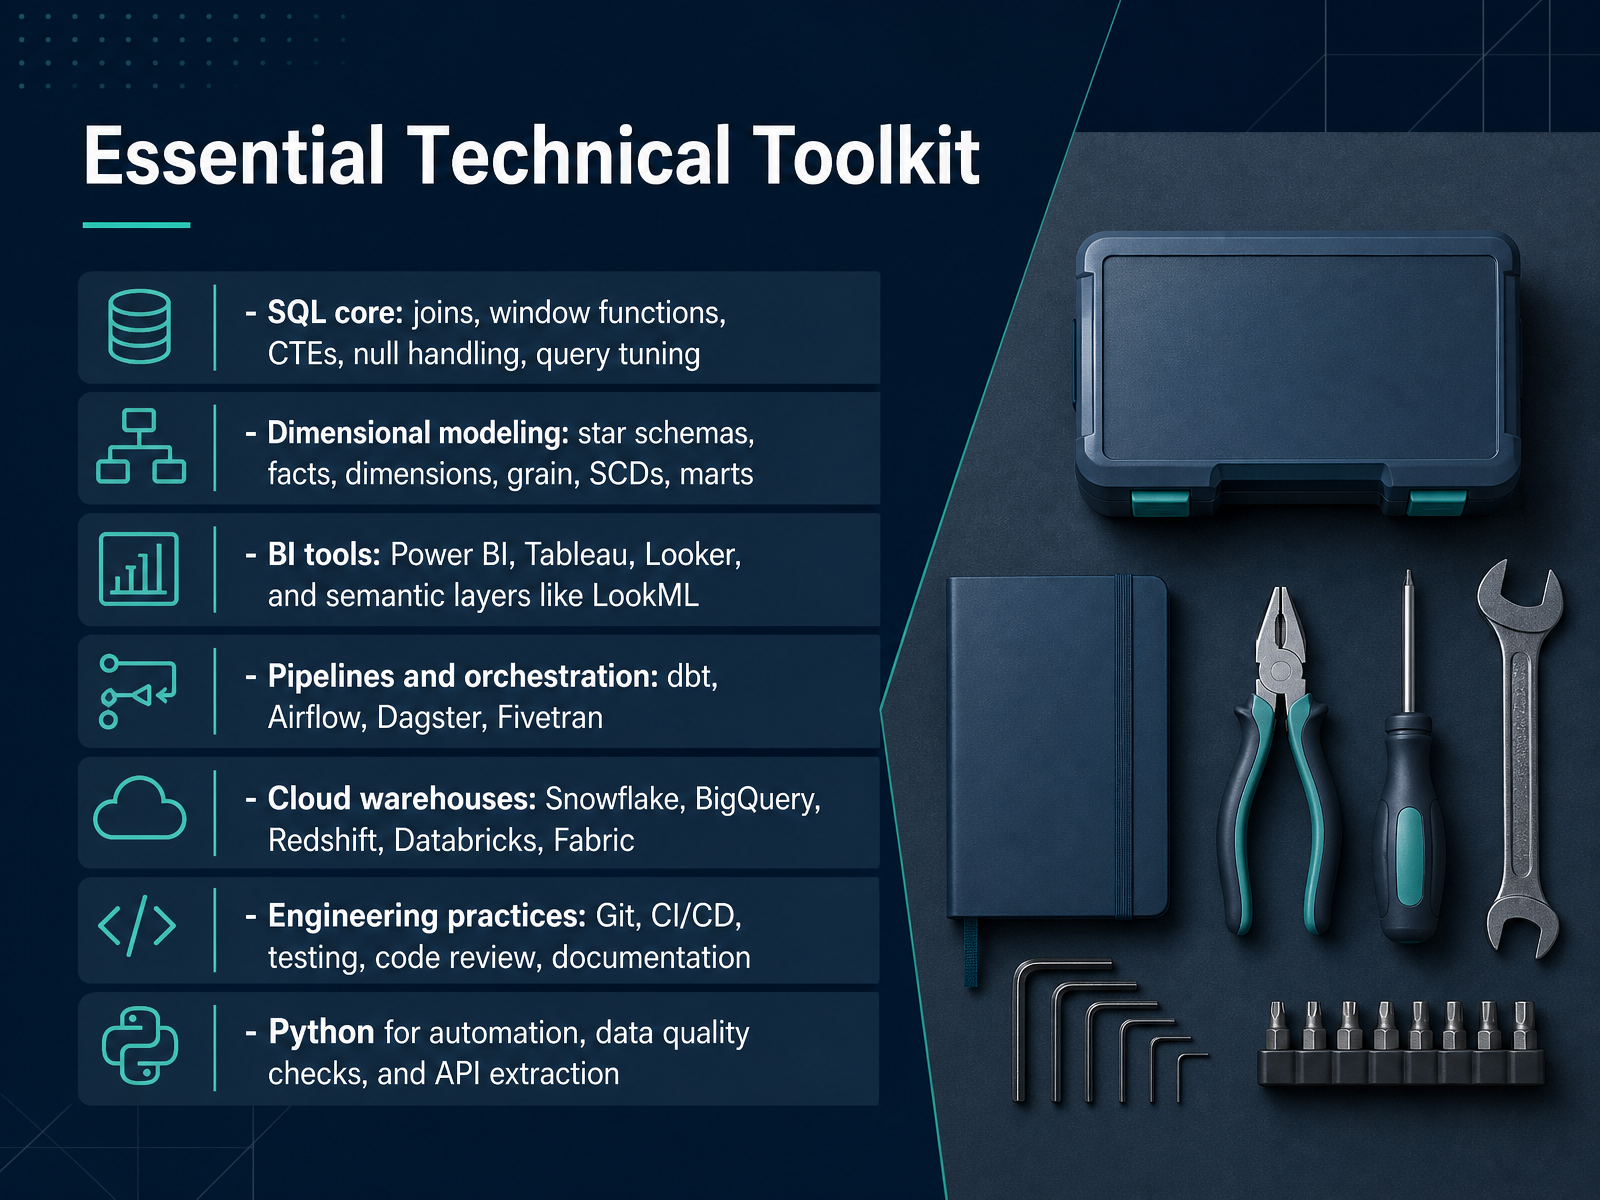
2 min - 04Essential Technical ToolkitLet's unpack the technical toolkit you'll rely on as a business intelligence engineer. Start with SQL, your daily language. You'll write joins to combine tables, window functions to rank or compare rows, common table expressions to organize complex logic, and careful null handling so totals stay trustworthy. You'll also tune queries when dashboards slow down under heavy data. Next is dimensional modeling. You design star schemas with facts and dimensions, define the grain of each table, and choose slowly changing dimension strategies so history stays accurate. BI tools like Power BI, Tableau, and Looker bring those models to stakeholders, while semantic layers such as LookML define metrics once so everyone sees the same numbers. Pipelines and orchestration come next. Tools like dbt, Airflow, Dagster, and Fivetran move and transform data reliably. Cloud warehouses including Snowflake, BigQuery, Redshift, Databricks, and Microsoft Fabric store and process it at scale. Finally, engineering practices matter. Git, continuous integration, testing, code review, and documentation keep your work stable, and Python helps with automation, data quality checks, and API extraction. Together, these skills turn raw data into dependable decision support. Now let's look at skills beyond code: business acumen, metric governance, and communication.
 2 min
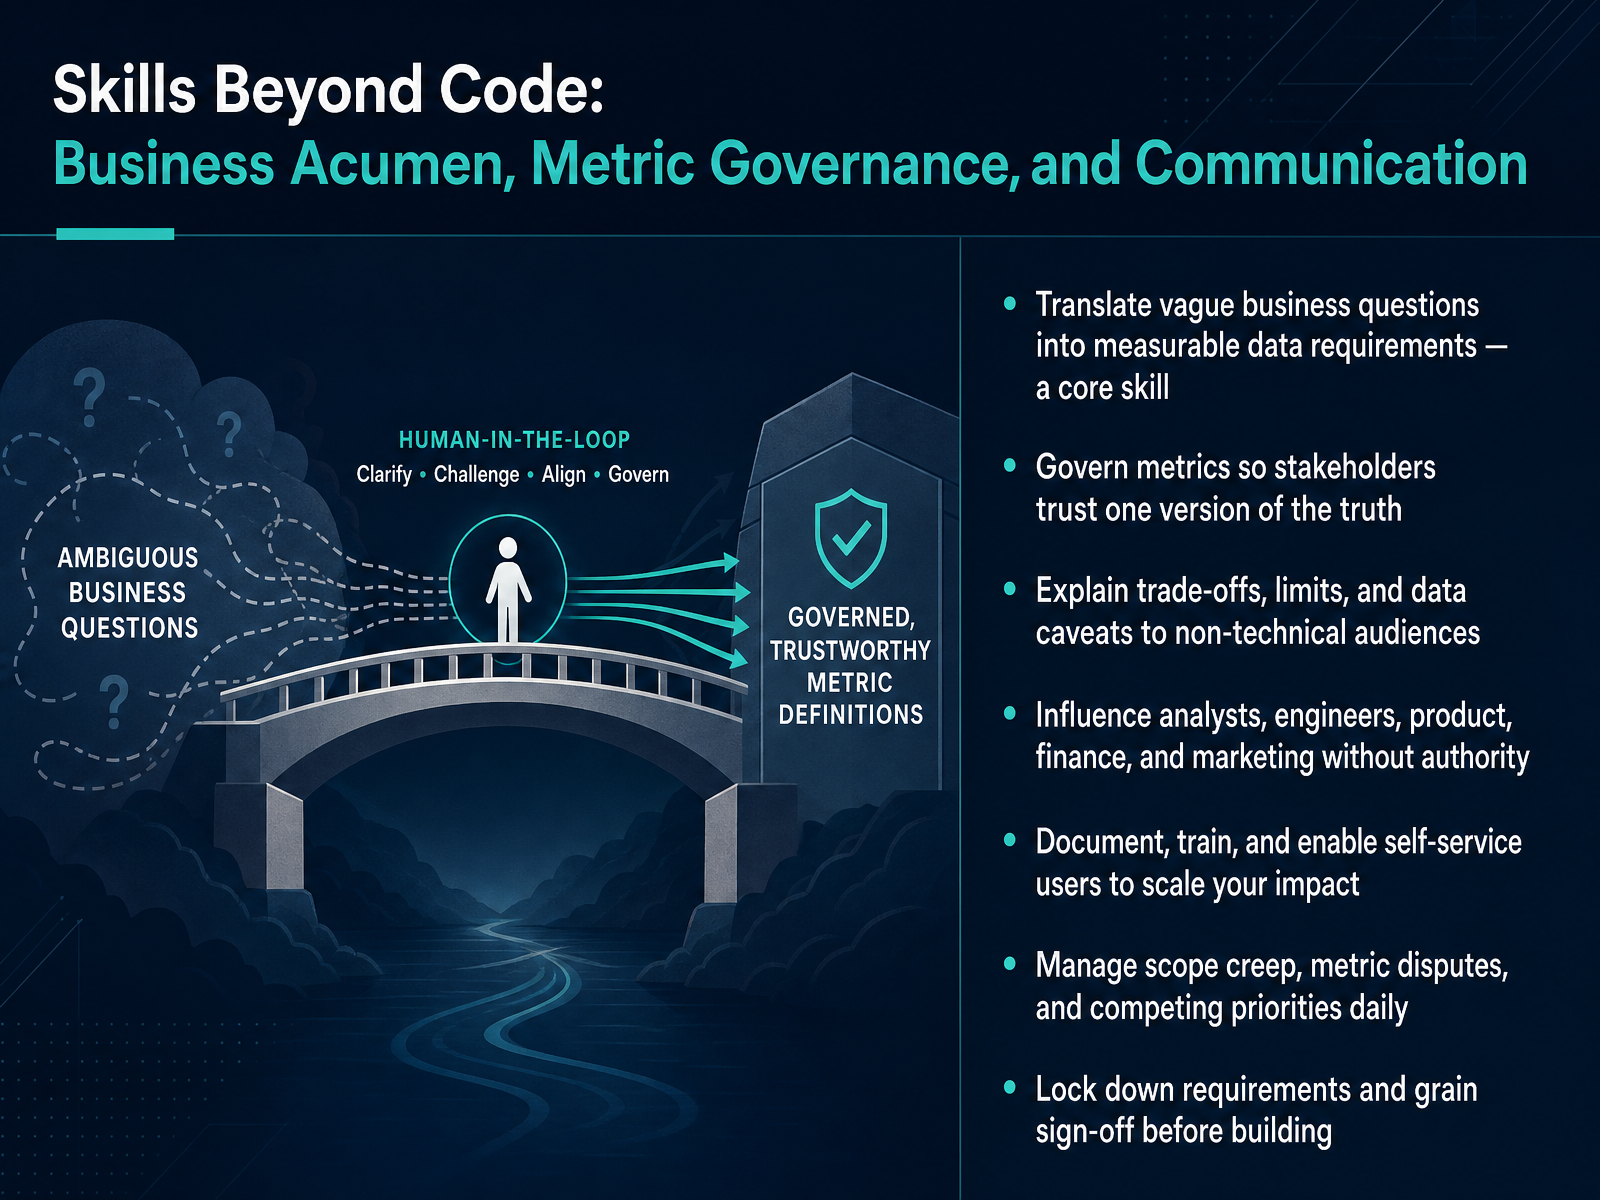
2 min - 05Skills Beyond Code: Business Acumen, Metric Governance, and CommunicationLet's talk about the skills that go beyond code. Yes, you need SQL and Python, but the real leverage comes from business acumen, metric governance, and communication. Your core skill is translating vague business questions into measurable data requirements. When a stakeholder says, we need better reporting, your job is to ask: which decision, which audience, which time grain, and which definition? Then you govern metrics so everyone trusts one version of the truth. That means agreeing on definitions, documenting them, and defending them when disputes arise. You also need to explain trade-offs, limits, and data caveats to non-technical audiences, clearly and without jargon. Influence matters too. You will work with analysts, engineers, product, finance, and marketing, often without formal authority. Document, train, and enable self-service users so your impact scales beyond your own hands. Expect to manage scope creep, metric disputes, and competing priorities daily. One practical habit: lock down requirements and grain sign-off before you build. That single step prevents most rework. Next, we will look at typical career paths, levels, and compensation.
 2 min
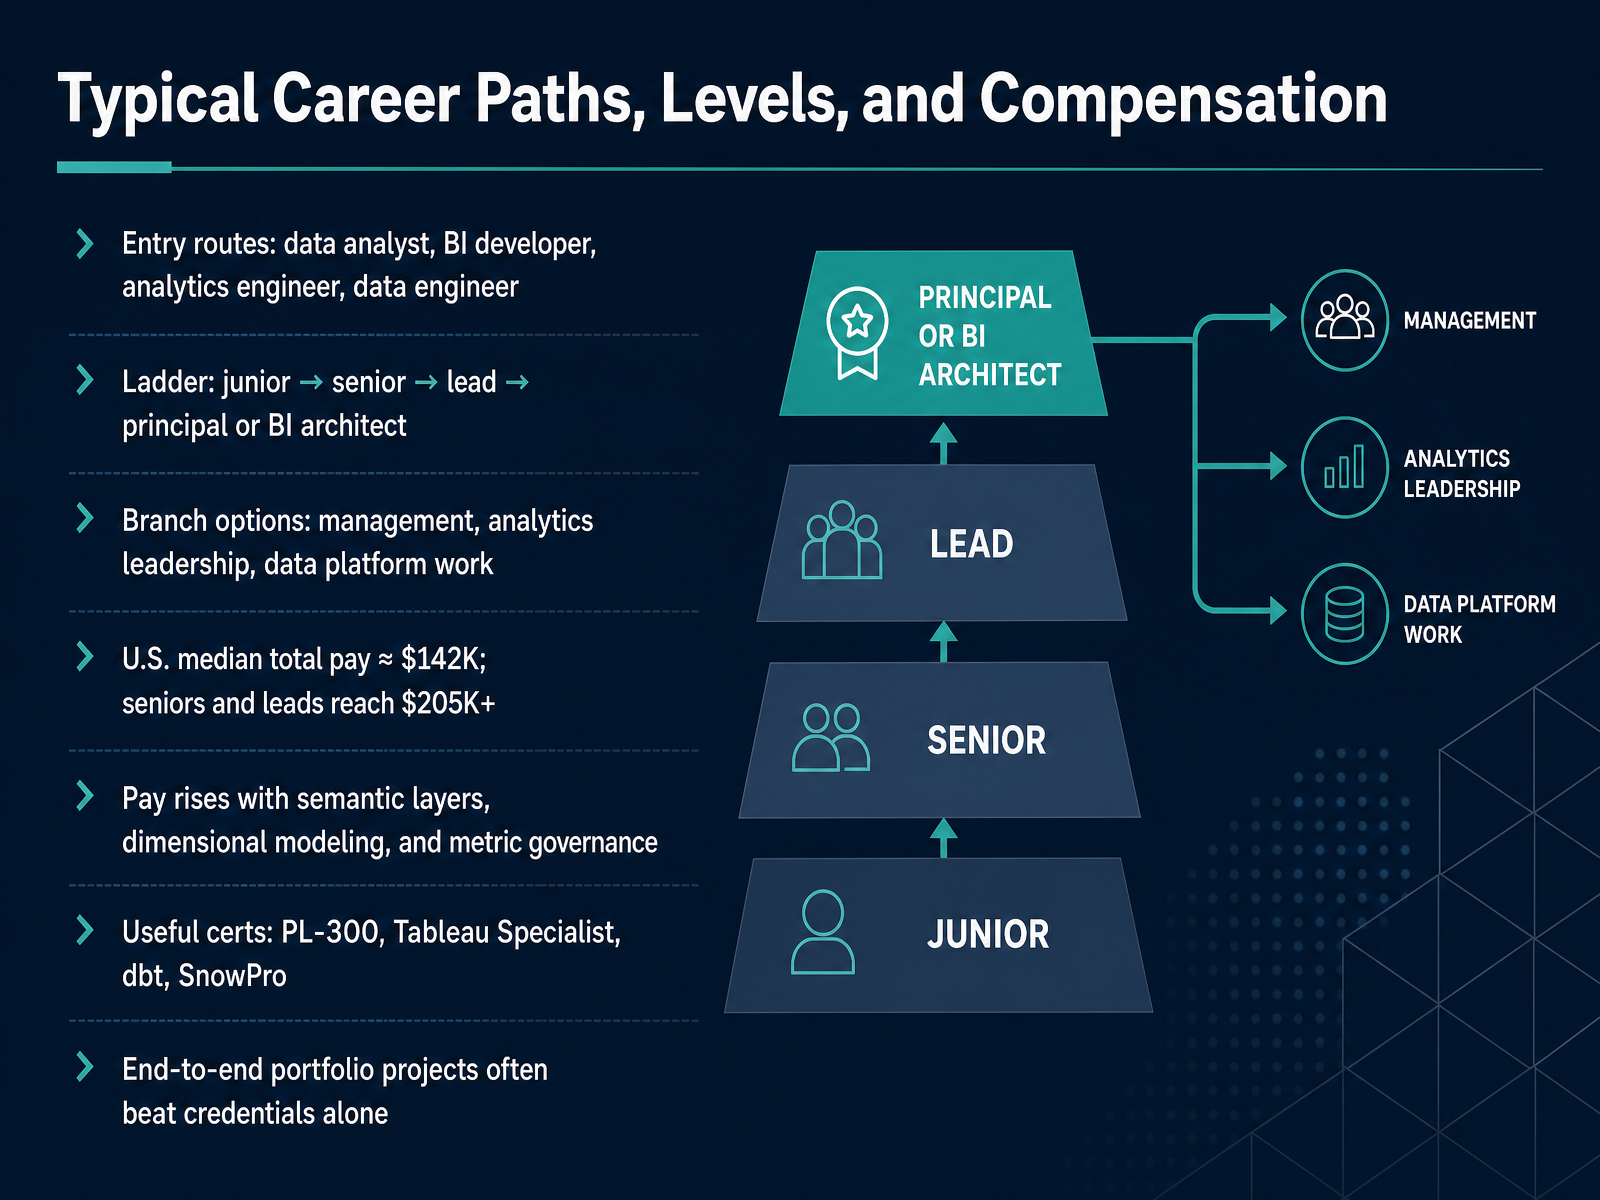
2 min - 06Typical Career Paths, Levels, and CompensationNow let's talk about career paths, levels, and compensation. People enter business intelligence engineering from several directions: as data analysts, BI developers, analytics engineers, or data engineers. From there, the ladder usually runs junior, senior, lead, then principal or BI architect. You can also branch into management, analytics leadership, or deeper data platform work. In the United States, median total pay is approximately one hundred forty two thousand dollars, and seniors and leads often reach two hundred five thousand dollars or more. Pay tends to rise when you get strong at semantic layers, dimensional modeling, and metric governance, because those skills directly improve trust in decisions. Certifications can help, like PL three hundred, Tableau Specialist, dbt, and SnowPro, but an end to end portfolio project often carries more weight than credentials alone. Next, we will look at how to evaluate the role, including hiring, fit, and team context.
 1 min
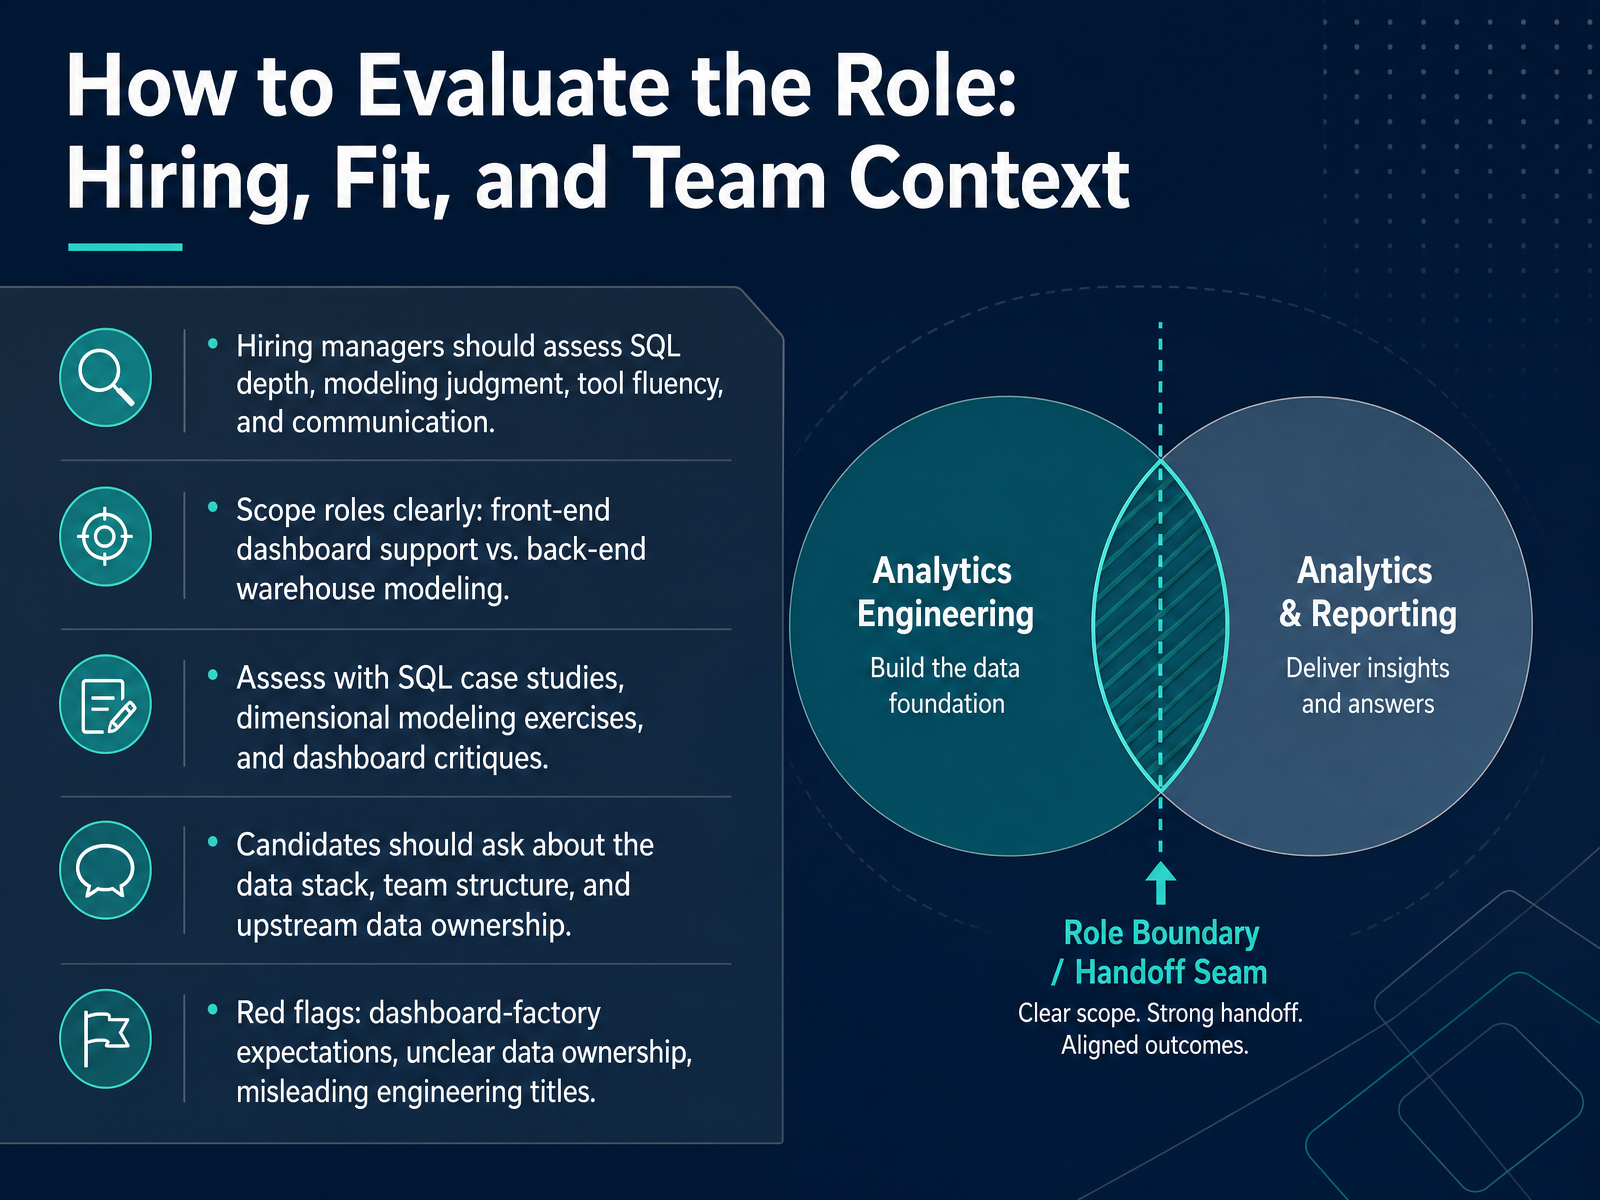
1 min - 07How to Evaluate the Role: Hiring, Fit, and Team ContextLet's talk about how to evaluate this role, whether you're hiring or deciding if it fits you. For hiring managers, look for four things: depth in SQL, judgment in data modeling, fluency with the tools, and clear communication. You can test these with a SQL case study, a dimensional modeling exercise, and a dashboard critique. Just as important, define the scope up front. Is this a front-end role focused on dashboard support, or a back-end role centered on warehouse modeling? Those are very different jobs. Candidates, ask about the data stack, the team structure, and who owns the upstream data. And watch for red flags: expectations of a dashboard factory, unclear data ownership, or engineering titles that don't match the actual work. The takeaway is simple: clarity on scope and skills prevents mismatches on both sides. Next, let's look at common misconceptions and role boundaries.
 2 min
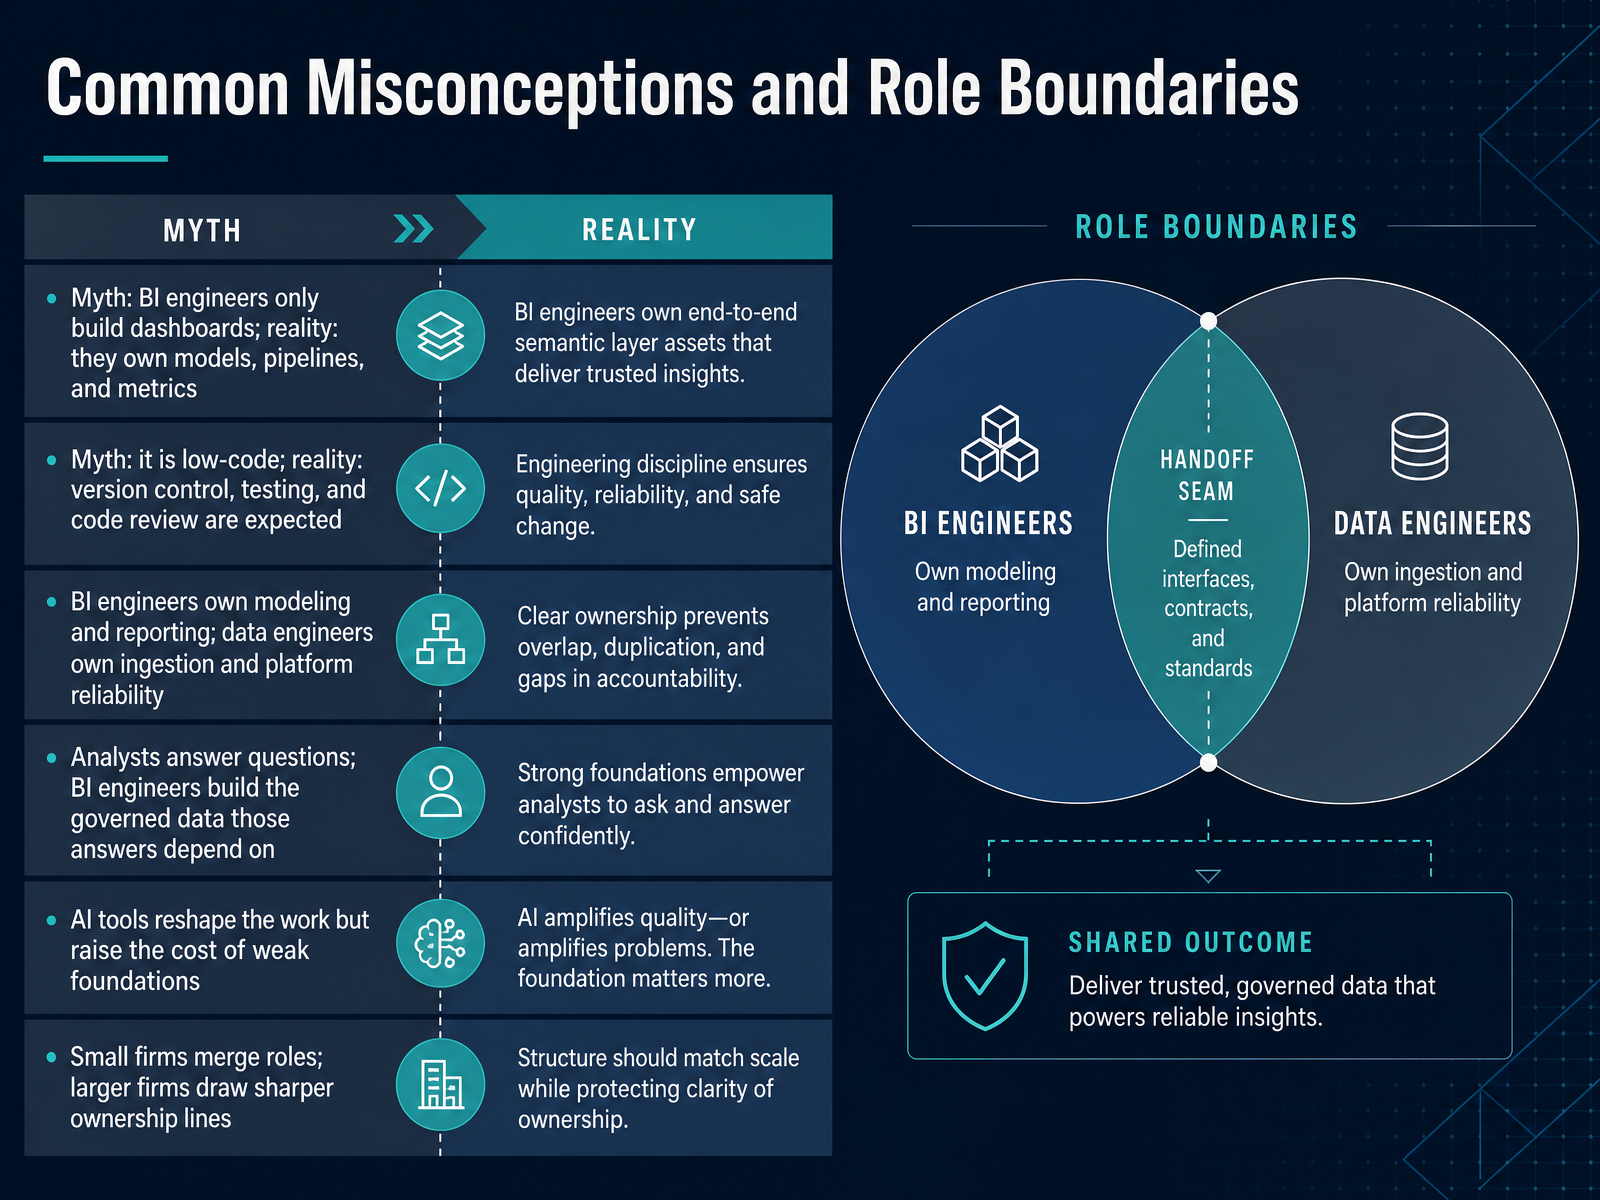
2 min - 08Common Misconceptions and Role BoundariesLet's clear up some common misconceptions and draw the role boundaries. First, a myth: BI engineers only build dashboards. In reality, they own the semantic models, the pipelines that feed them, and the metric definitions everyone relies on. Another myth: this is low-code work. Not really. Version control, automated testing, and code review are everyday expectations. Now, boundaries. BI engineers own modeling and reporting. Data engineers own ingestion and platform reliability. Analysts answer specific questions. BI engineers build the governed data those answers depend on. Think of it this way. An analyst asks, why did revenue dip last month? The BI engineer ensures the revenue metric is defined once, tested, and consistent across every dashboard. AI tools are reshaping this work, but they raise the cost of weak foundations, because automation amplifies bad data. Finally, company size matters. Small firms often merge roles. Larger firms draw sharper ownership lines. Remember, your value is not just charts. It is trusted, governed data that drives decisions. Next, we will look at getting started with a learning plan and practical next steps.
 1 min
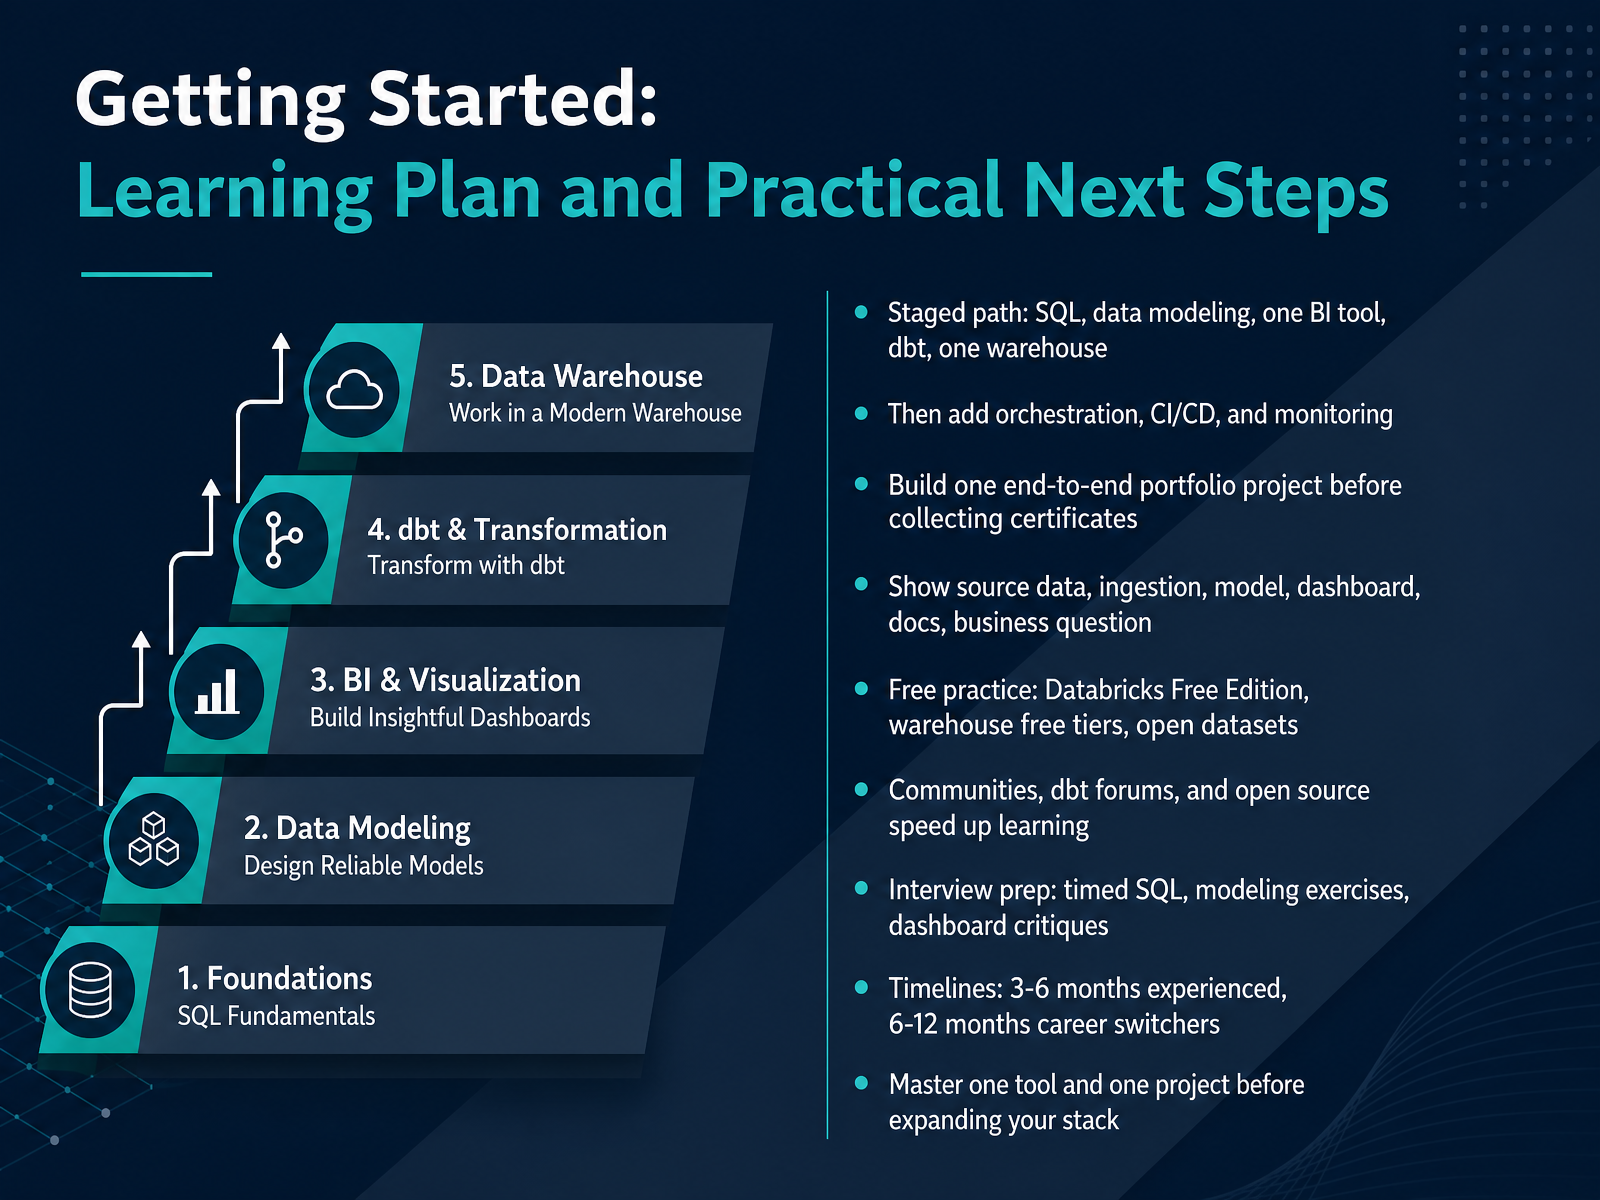
1 min - 09Getting Started: Learning Plan and Practical Next StepsSo how do you actually get started? Think of it as a staged path. First, learn SQL, then data modeling, then one BI tool, then dbt, and one cloud warehouse. Once that foundation feels solid, add orchestration, continuous integration, and monitoring. Here is the key move. Build one end-to-end portfolio project before you collect certificates. Show the source data, the ingestion, the model, a dashboard, documentation, and the business question you answered. For practice, use free options like Databricks Free Edition, warehouse free tiers, and open datasets. Communities, dbt forums, and open source projects will speed up your learning. For interviews, practice timed SQL, modeling exercises, and dashboard critiques. A realistic timeline is three to six months if you are already experienced, and six to twelve months for career switchers. Master one tool and one project before expanding your stack. Next, let's bring it together with Key Takeaways and Role Comparison Summary.
 2 min
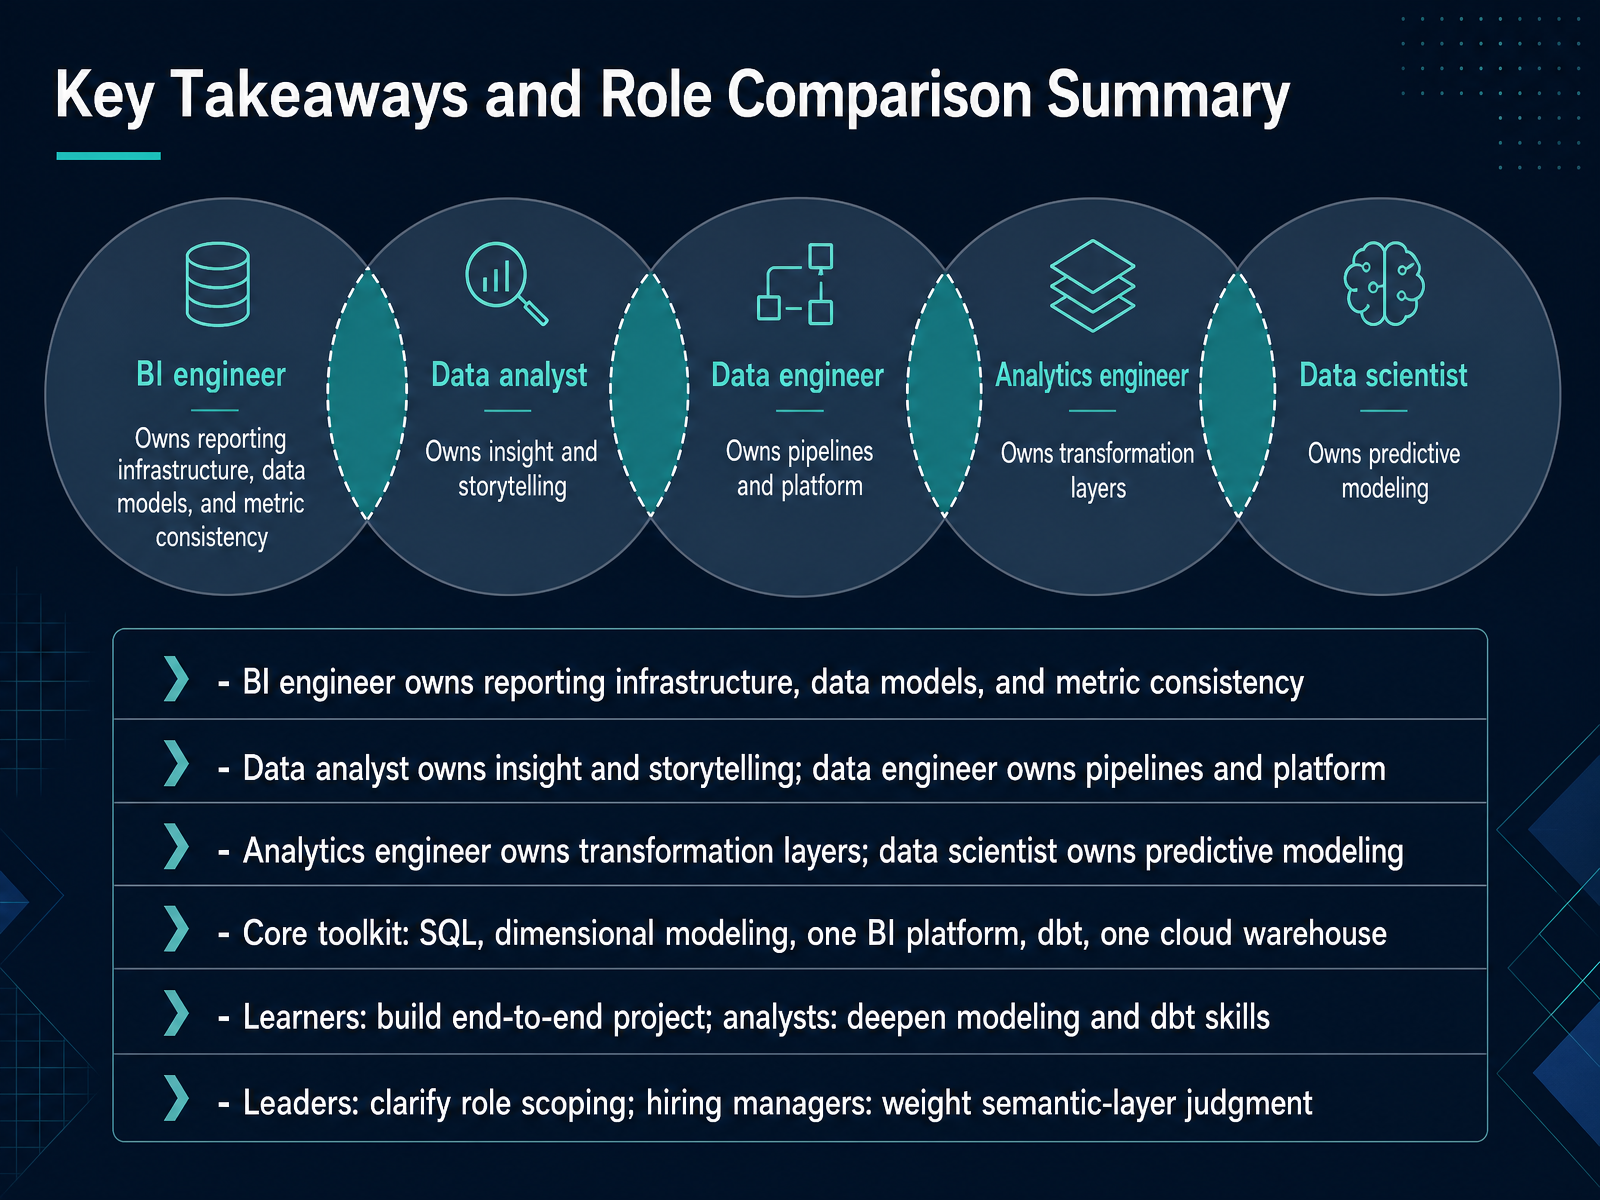
2 min - 10Key Takeaways and Role Comparison SummaryLet's pull this together with the key takeaways and a quick role comparison. The BI engineer owns reporting infrastructure, the data models behind it, and metric consistency. If two teams see different revenue numbers, that is your problem to solve. The data analyst owns insight and storytelling. The data engineer owns pipelines and the platform underneath. The analytics engineer owns the transformation layer, shaping raw data into clean, documented tables. The data scientist owns predictive modeling. Your core toolkit is SQL, dimensional modeling, one BI platform, dbt, and one cloud warehouse. If you are learning, build an end-to-end project. If you are an analyst, deepen your modeling and dbt skills. Leaders should clarify role scoping, and hiring managers should weight semantic-layer judgment, meaning how well someone designs reusable, trusted metrics. Next, we will look at the modern BI stack, tools, platforms, and architecture patterns.
 1 min
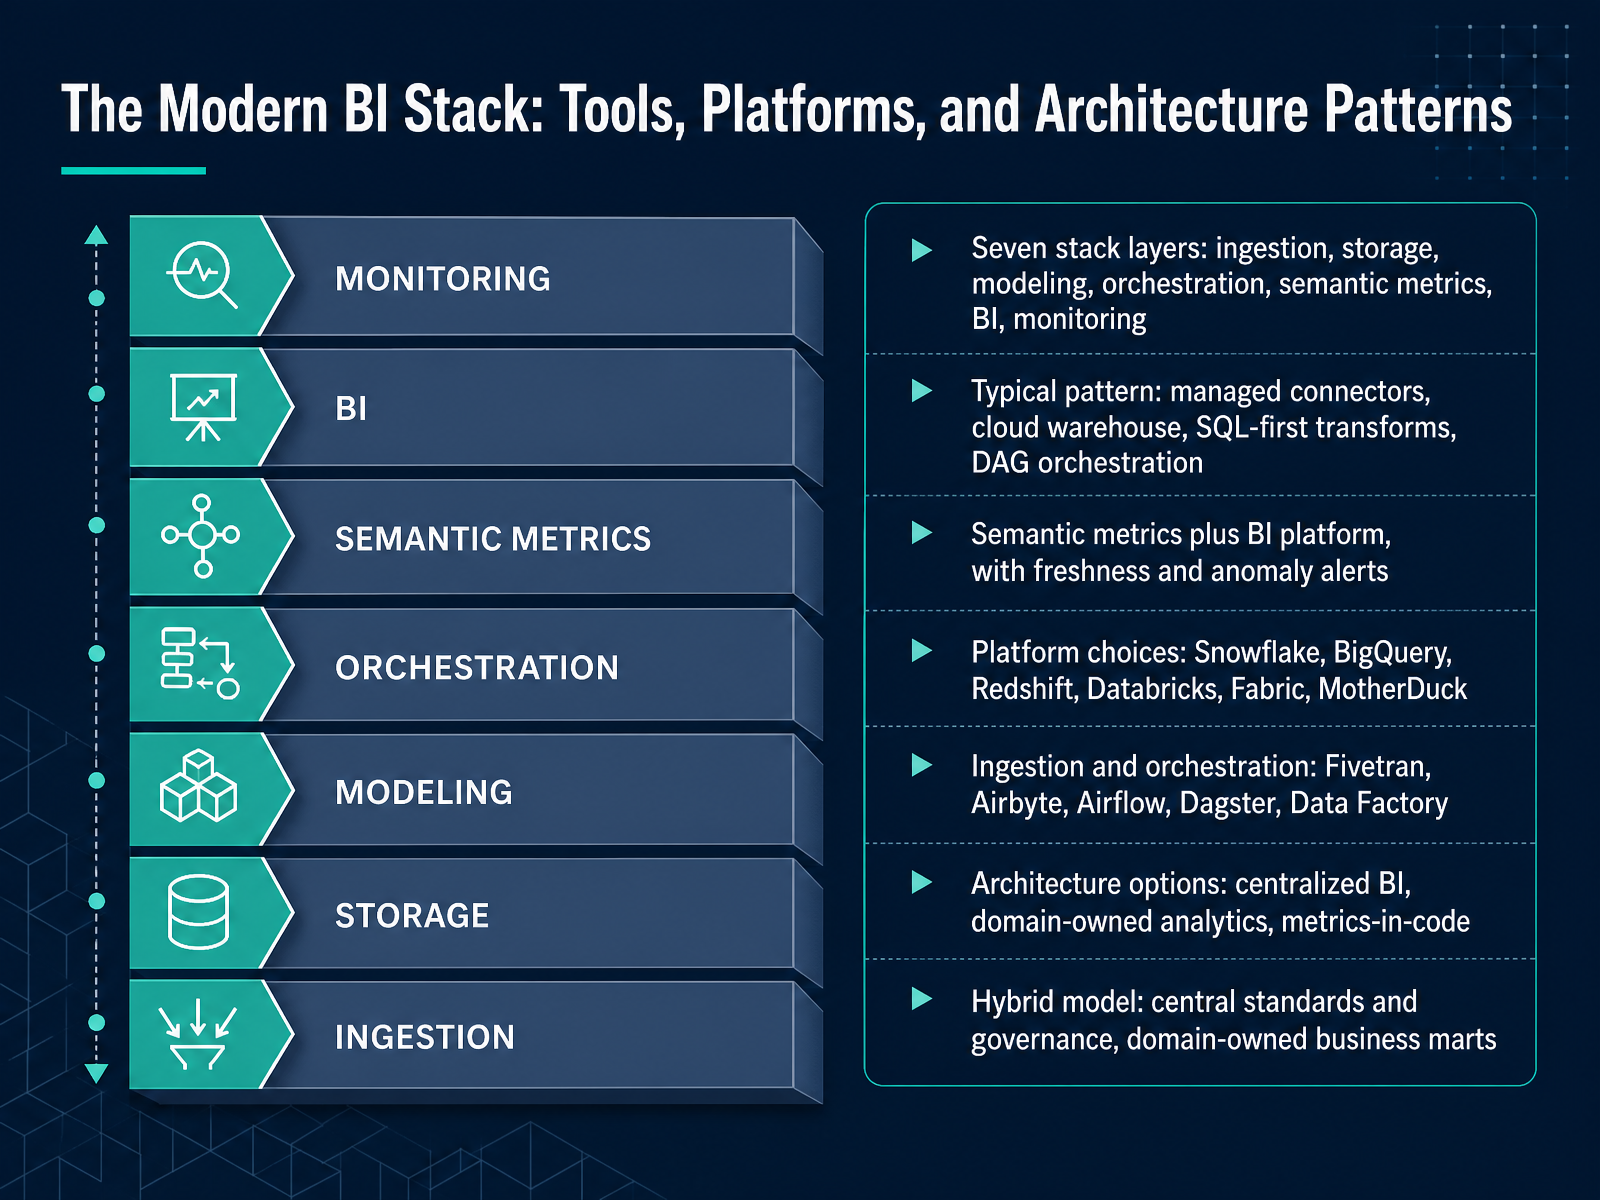
1 min - 11The Modern BI Stack: Tools, Platforms, and Architecture PatternsNow let's look at the modern BI stack, meaning the tools and architecture patterns that turn raw data into trusted decisions. Think in seven layers. Ingestion brings data in. Storage keeps it. Modeling shapes it. Orchestration schedules it. Semantic metrics define it. The BI platform presents it. And monitoring keeps it reliable. A typical pattern uses managed connectors into a cloud warehouse, SQL-first transformations, and DAG orchestration for scheduled pipelines. Common platform choices include Snowflake, BigQuery, Redshift, Databricks, Fabric, and MotherDuck. For ingestion and orchestration, you will often see Fivetran, Airbyte, Airflow, Dagster, or Data Factory. Architecturally, teams choose centralized BI, domain-owned analytics, or metrics-in-code. Many land on a hybrid: central standards and governance, with domain-owned business marts. Next, we will explore AI, Semantic Layers, and the Future of BI Engineering.
 2 min
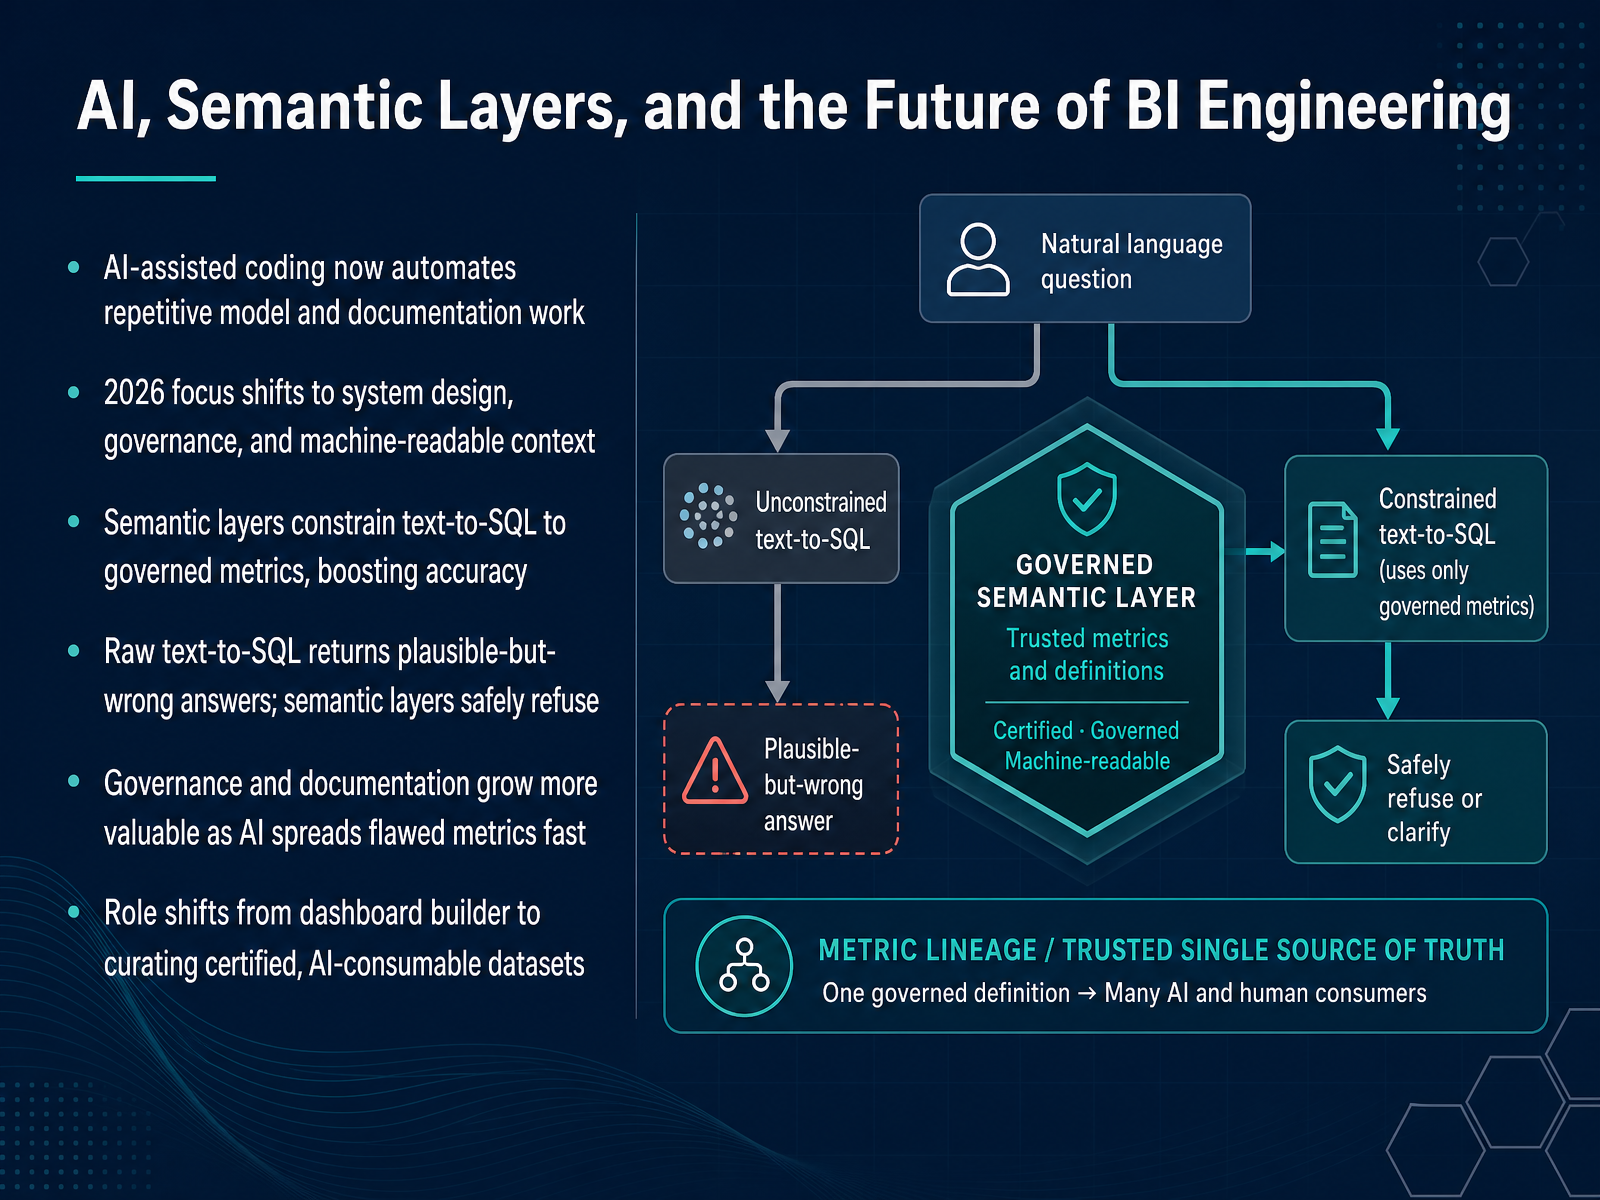
2 min - 12AI, Semantic Layers, and the Future of BI EngineeringLet's talk about how AI, semantic layers, and governance are reshaping this role. AI-assisted coding already automates a lot of the repetitive work, like generating data models and drafting documentation. So the focus for twenty twenty-six shifts toward system design, governance, and machine-readable context. Here's a concrete contrast. Raw text-to-SQL often returns plausible but wrong answers, because the model guesses at definitions. A semantic layer constrains text-to-SQL to governed metrics, so accuracy goes up, and when a question can't be answered safely, it refuses instead of inventing a number. That matters more as AI spreads flawed metrics fast. Governance and documentation become more valuable, not less. The role itself is shifting from dashboard builder to curating certified, AI-consumable datasets. Next, we'll look at how to judge whether this role fits you, in Evaluating Fit: Self-Assessment and Role Clarity.
 1 min
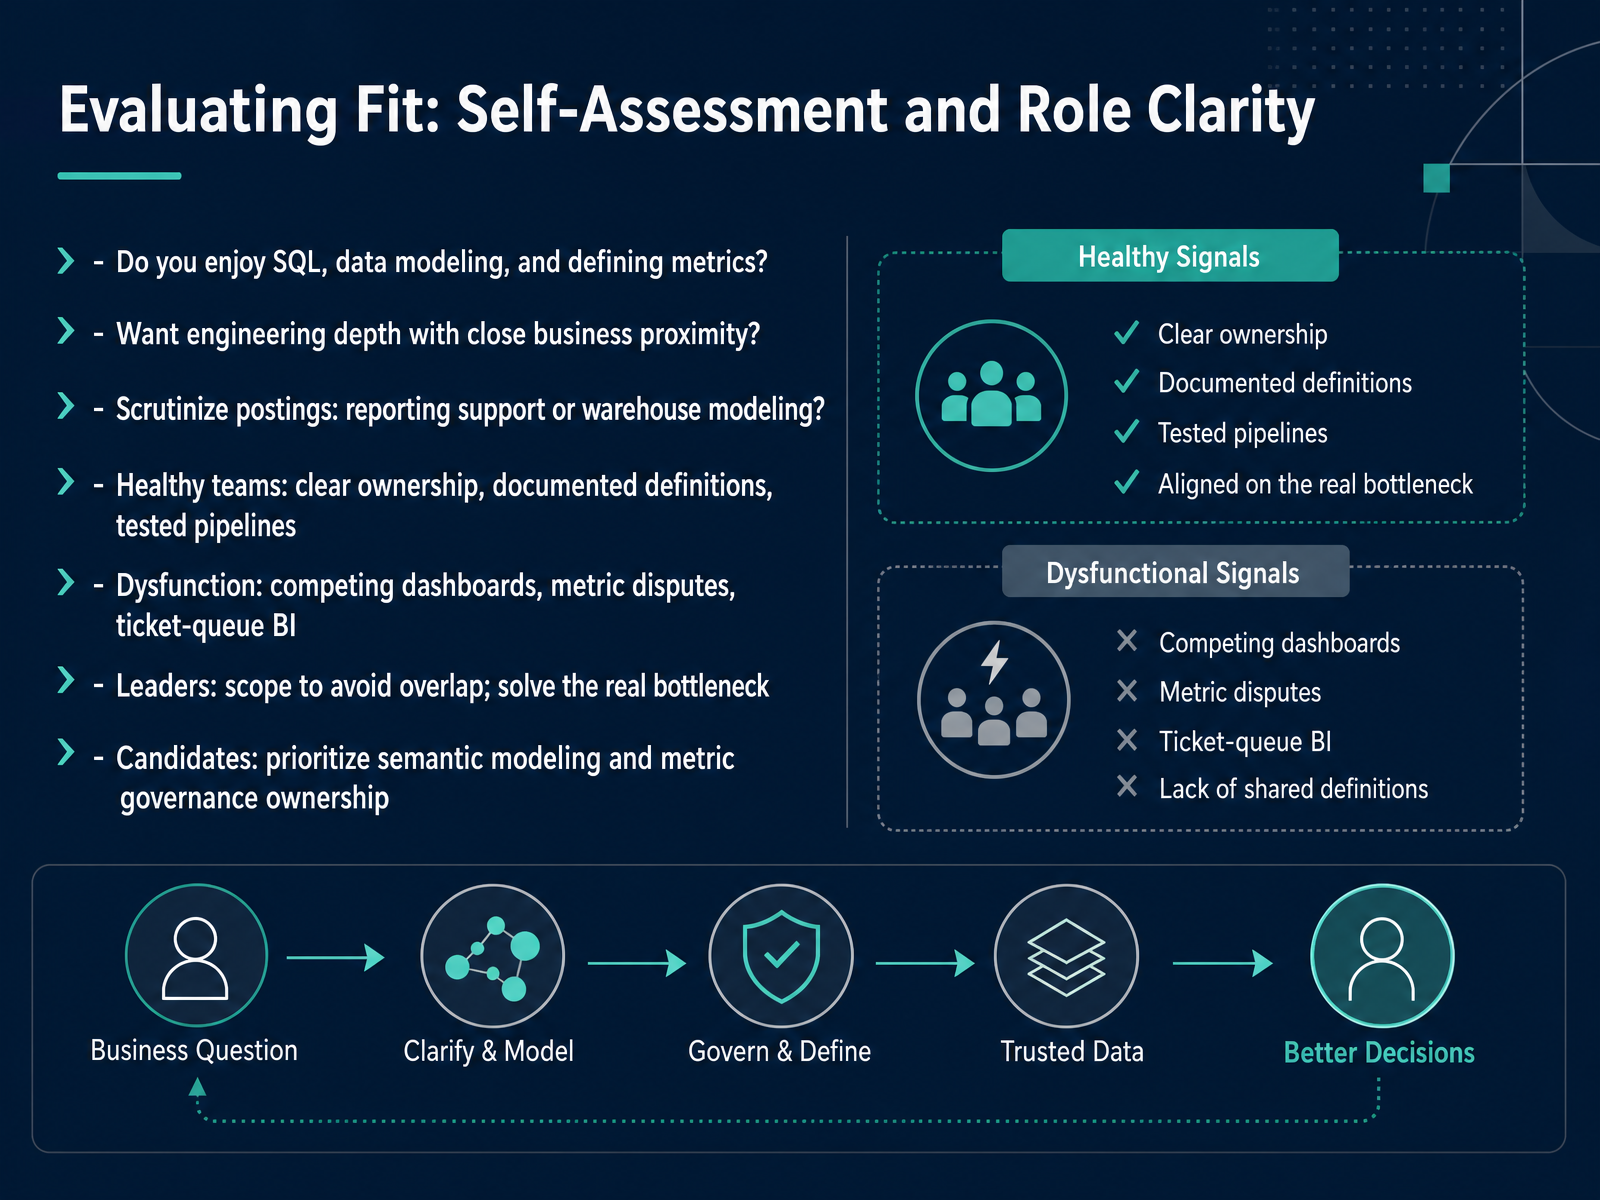
1 min - 13Evaluating Fit: Self-Assessment and Role ClaritySo, as we close this course, let's bring it back to you. Ask yourself: do you genuinely enjoy SQL, data modeling, and defining metrics? If yes, that's a strong signal. BI engineering rewards people who like engineering depth but want close proximity to the business. Next, read job postings carefully. Are they asking for reporting support, or true warehouse modeling? A healthy team has clear ownership, documented metric definitions, and tested pipelines. Dysfunction looks like competing dashboards, endless metric disputes, and ticket-queue BI. If you lead a team, scope roles to avoid overlap, and solve the real bottleneck. As a candidate, prioritize roles that give you semantic modeling and metric governance ownership. Keep building those skills. You are closer than you think. Thanks for learning with me, and good luck.
 2 min
2 min
Take the deck with you
Download this course as a file — free, no sign-up needed.
- PDF handoutEvery slide page, ready to print or share.14 pages · 3.5 MBDownload
- Narrated PowerPointThe deck that presents itself — every slide carries the digital human's narration video.14 pages · 13.3 MBDownload
- PowerPoint slidesThe full deck as a .pptx — open it in PowerPoint, Keynote, or Google Slides.14 pages · 3.4 MBDownload
Free to use in your own training — please keep the PersonWise credit page at the end.
Have your own deck? Turn it into a course