Begin
14 pages · ~28 min
Avoiding Common Data Visualization Mistakes
This training helps analysts and data professionals identify common data visualization mistakes and apply practical techniques to create accurate, clear, and effective charts.
A digital instructor presents all 14 pages. Hold “Ask” at any point and ask out loud — the answer comes from this course. No sign-up needed.
What you’ll learn
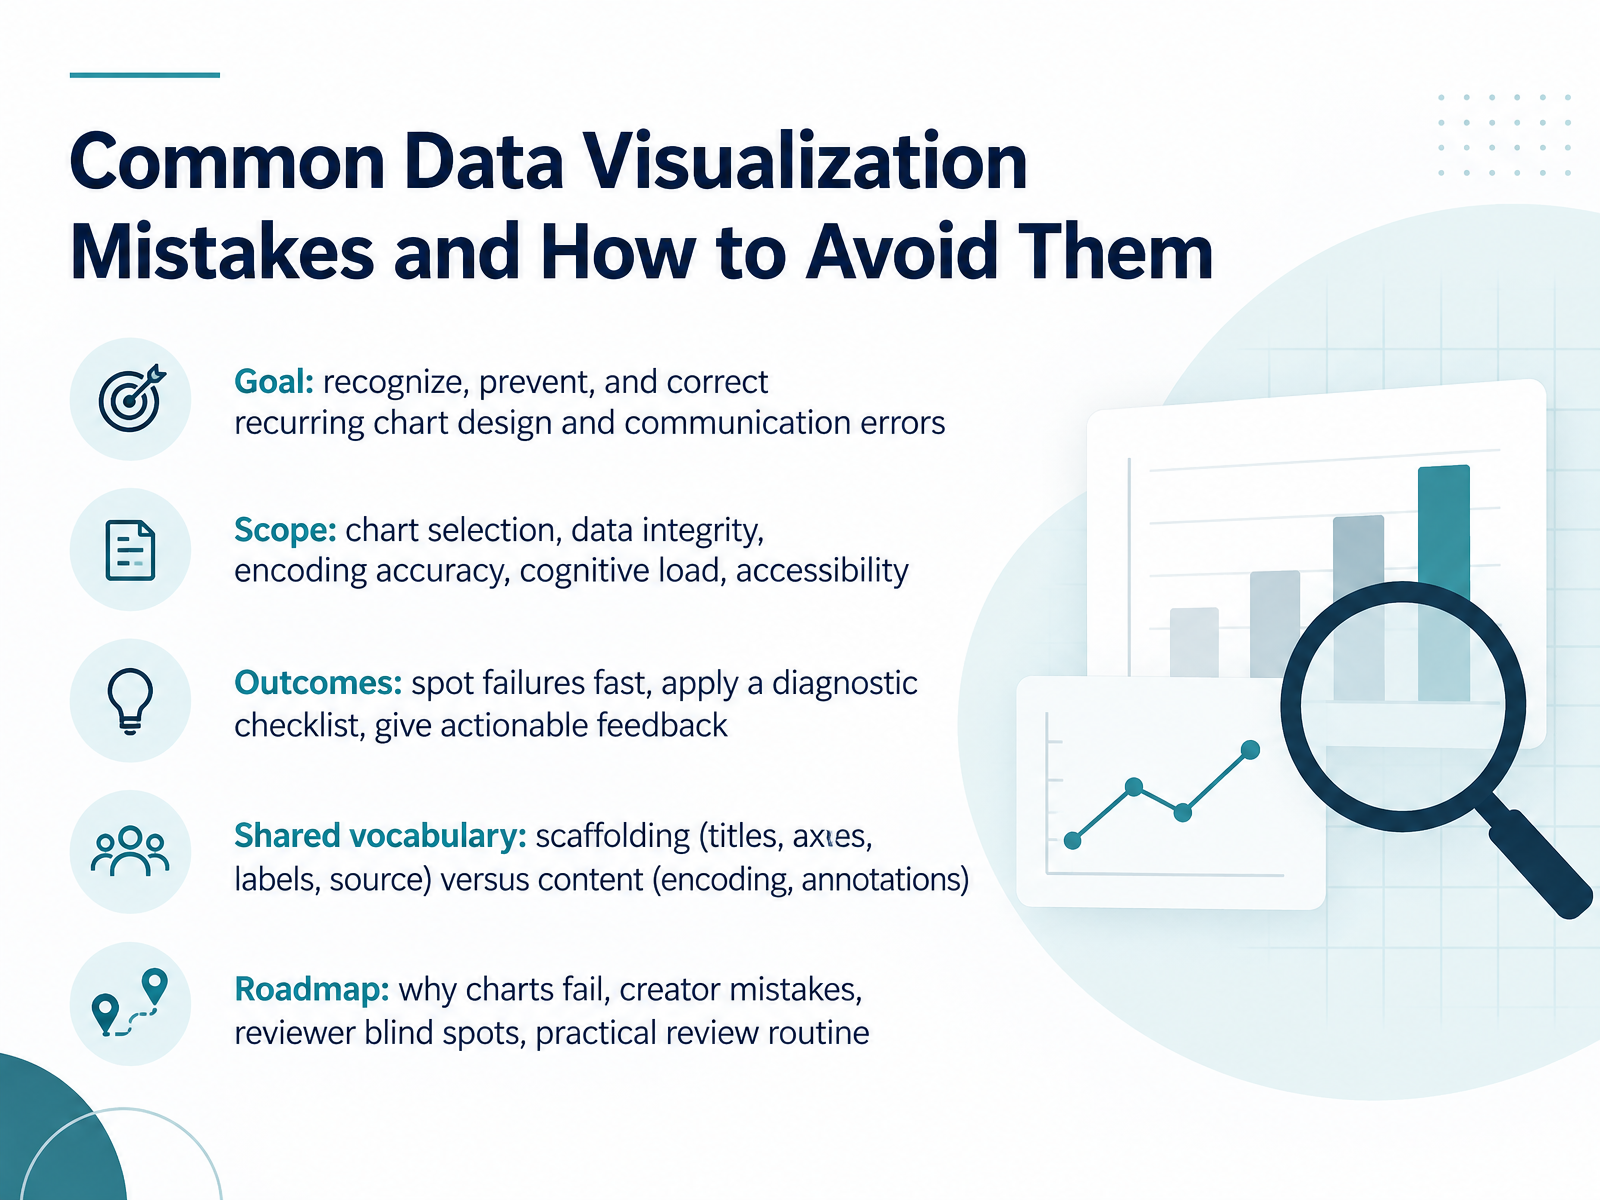
- 01Common Data Visualization Mistakes and How to Avoid ThemWelcome. Today we're going to look at common data visualization mistakes and how to avoid them. This is for analysts, report authors, teachers, and anyone who reviews charts before they go out. Our goal is simple. Recognize recurring chart design and communication errors, prevent them, and correct them when they slip through. We'll cover chart selection, data integrity, encoding accuracy, cognitive load, and accessibility. By the end, you'll be able to spot failures quickly, apply a diagnostic checklist, and give feedback that people can act on. One shared vocabulary will help. Think of scaffolding as titles, axes, labels, and source. Content is the encoding and annotations. We'll move through why charts fail, creator mistakes, reviewer blind spots, and a practical review routine you can use in your next sign-off. Before we go further, try one quick check on a chart you reviewed recently. If you removed the surrounding text, could a colleague still tell what it says? Keep that in mind as we begin. Next, we'll look at why chart errors cost time, trust, and decisions.datastorycoach.aidevelopers.google.comdatabricks.com+22 min
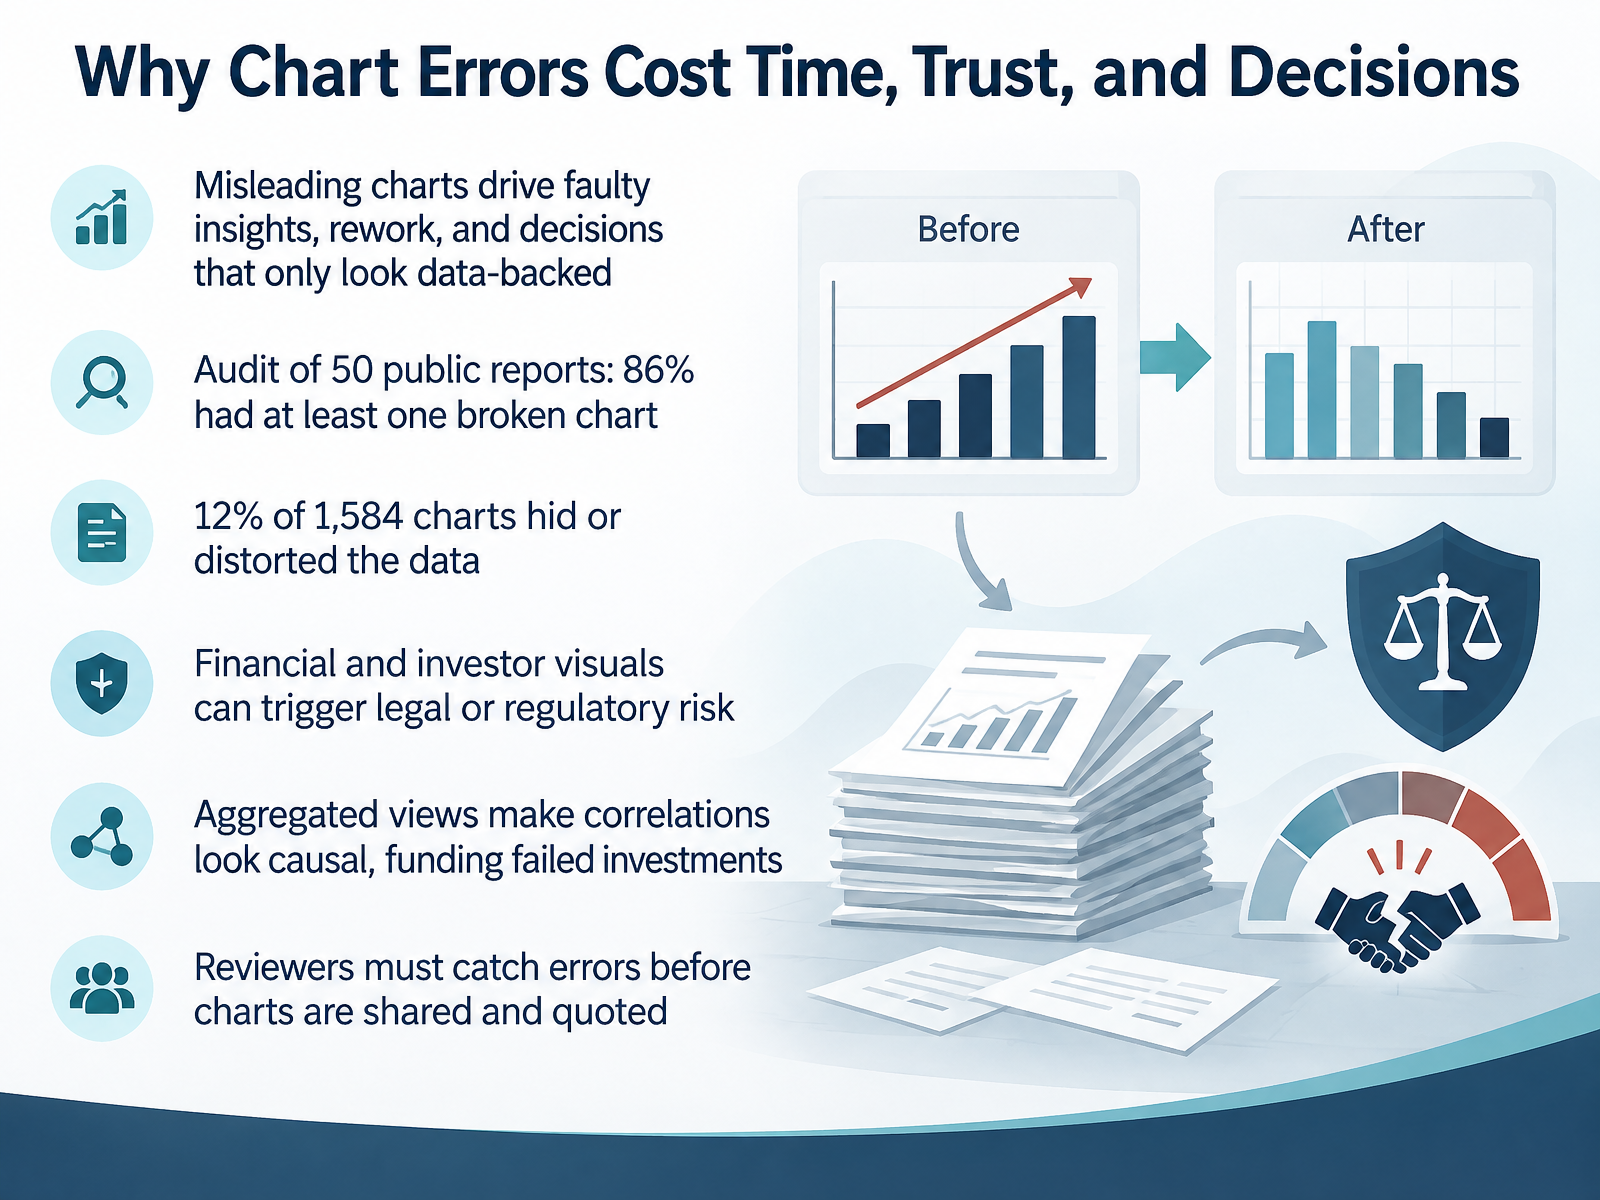
- 02Why Chart Errors Cost Time, Trust, and DecisionsLet's start with why this matters. Chart errors are not cosmetic. A misleading chart produces faulty insights, rework, and decisions that only look data-backed. In an audit of fifty public company reports, eighty-six percent contained at least one broken chart. Of one thousand five hundred eighty-four charts analyzed, twelve percent hid or distorted the data. Financial and investor visuals can trigger legal or regulatory risk, because investors may act on them. And when charts aggregate data into a few buckets, correlations start to look causal. Teams then fund investments that quietly fail. Before any chart is shared or quoted, you are the check. So here is a quick action: pick one chart in your next report and ask whether a colleague could reach the wrong conclusion from it. Next, let's look at how to match the chart to the question.
 online.hbs.eduinsight.kellogg.northwestern.eduthoughtspot.com+22 min
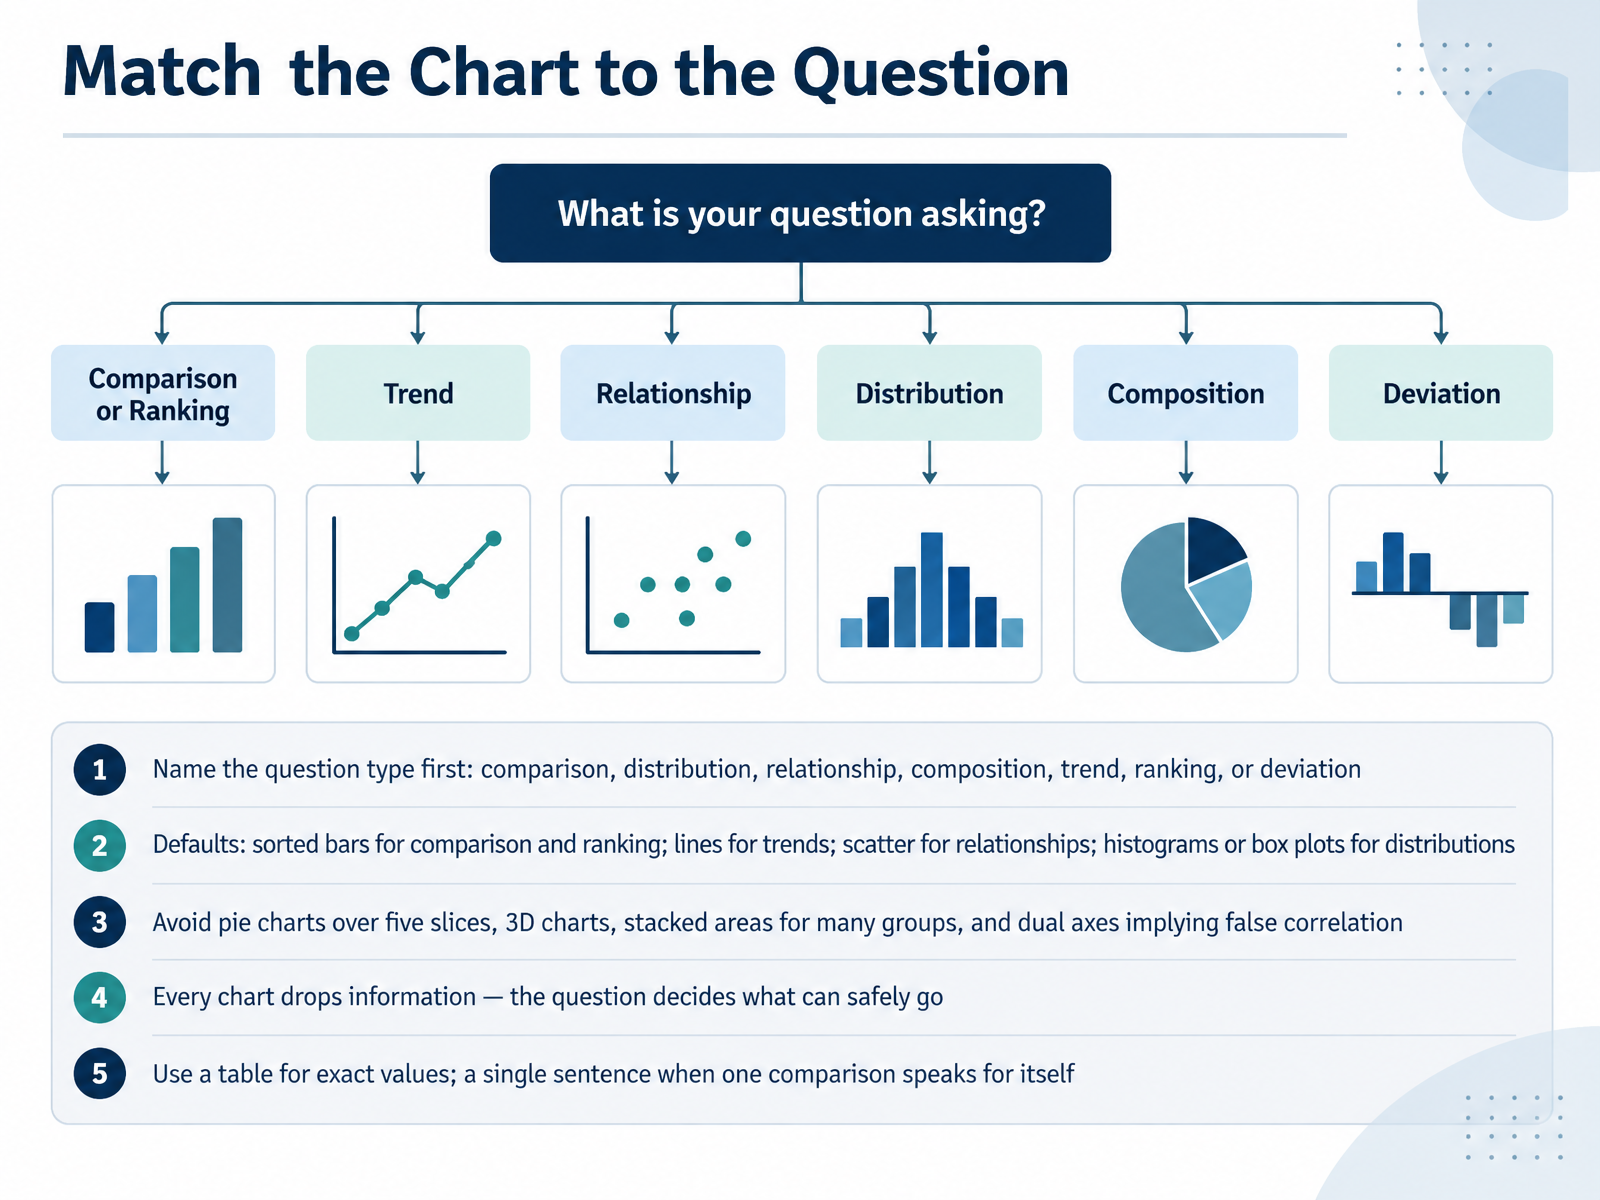
- 03Match the Chart to the QuestionLet's talk about matching the chart to the question. Before you open any chart menu, name the question type first. Is it a comparison, a distribution, a relationship, a composition, a trend, a ranking, or a deviation? Once you name it, the chart mostly follows. For comparison and ranking, default to sorted bars. For trends over time, use lines. For relationships between two variables, use a scatter plot. For distributions, reach for a histogram or a box plot. A few things to steer away from. Avoid pie charts with more than five slices. Skip 3D charts. Be careful with stacked areas when there are many groups, and avoid dual axes that imply a correlation that may not exist. Remember, every chart drops information. The question decides what can safely go. If readers need exact values, use a table. If one comparison speaks for itself, write a single sentence instead. Here is a check for your next review. Say the question type out loud before you judge the chart. If the chart type does not match, that is your first fix. Next, we will look at data integrity mistakes around axes, ranges, and aggregation.
 datainterview.comctopendata.github.ioatlassian.com+22 min
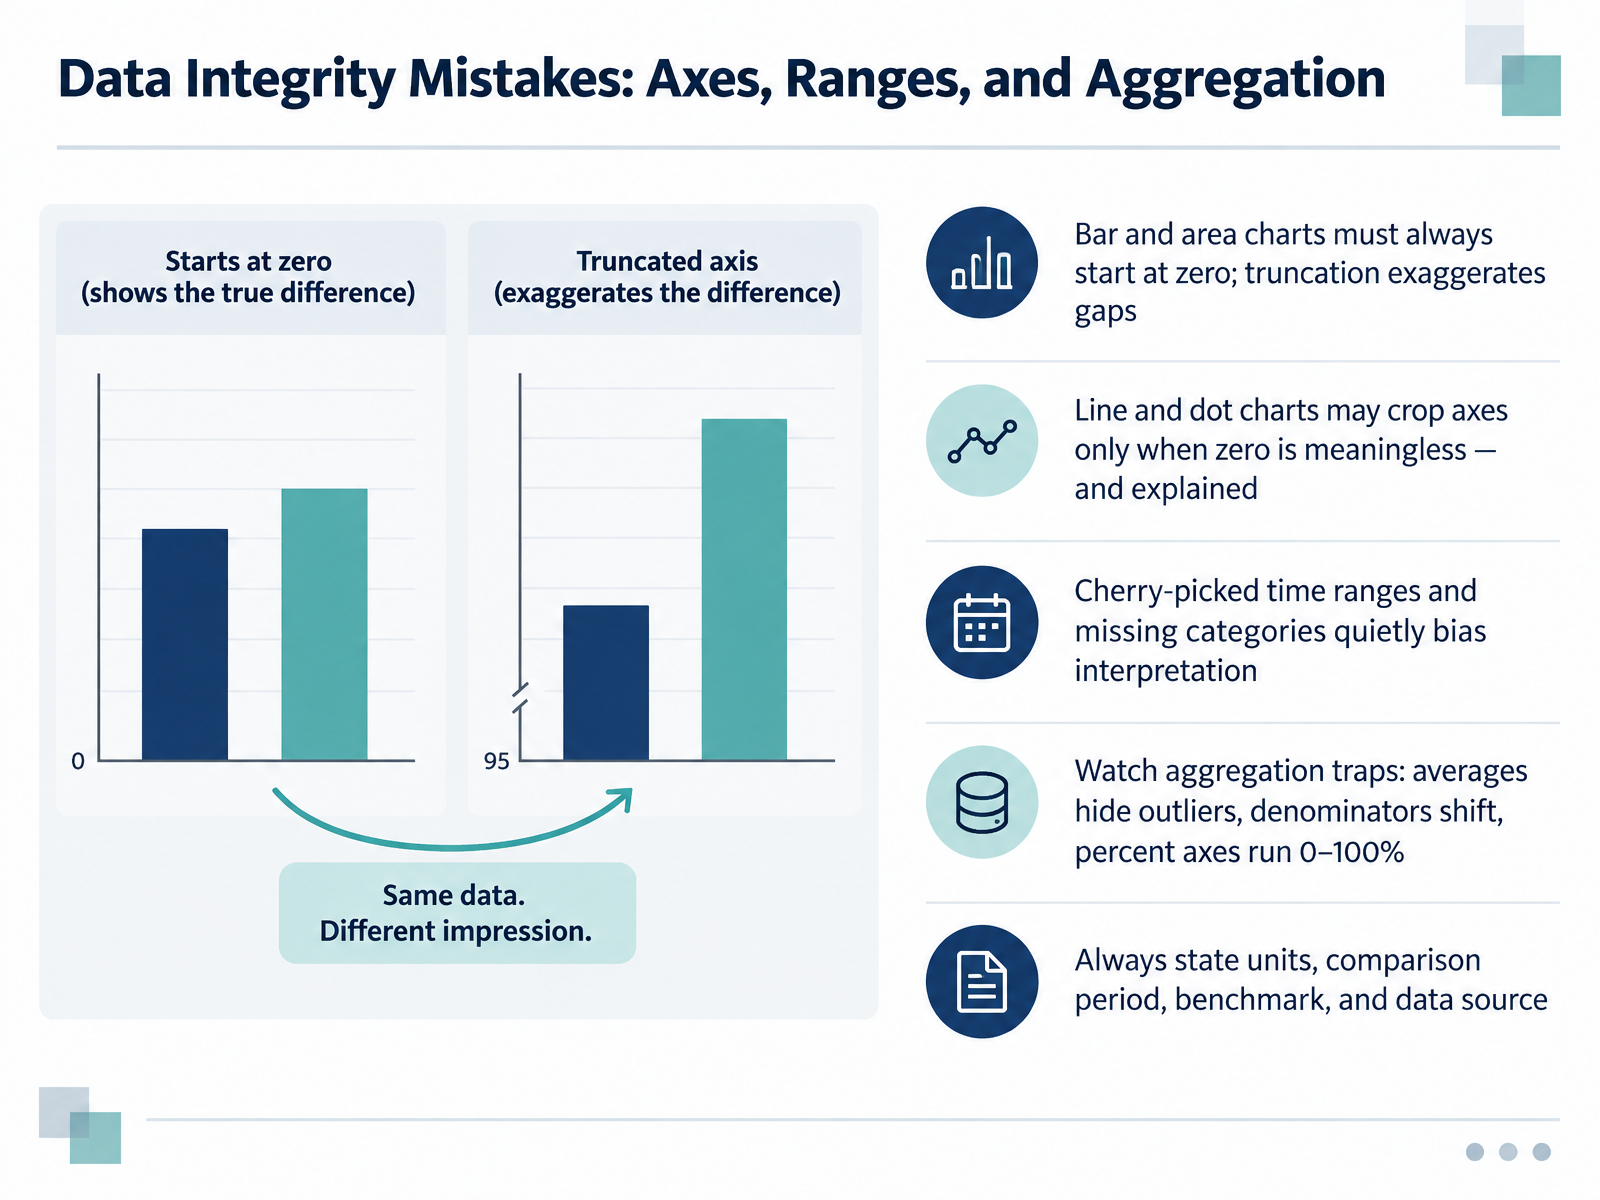
- 04Data Integrity Mistakes: Axes, Ranges, and AggregationLet's look at data integrity mistakes, starting with axes and ranges. Bar and area charts should always start at zero, because even a small truncation exaggerates the gaps between values. Line and dot charts are different. You can crop the axis when zero is not meaningful, such as with body temperature, but label and explain the choice. Also watch the quieter problems. A cherry-picked time range or a missing category can bias interpretation without anyone noticing. Then check aggregation. Averages hide outliers, denominators shift between periods, and percentage axes should run from zero to one hundred percent. Before sign-off, state the units, the comparison period, the benchmark, and the data source. Here is your check: open your next chart and confirm the axis start matches the chart type, then verify that units, period, benchmark, and source all appear in the labels. That one check catches most of these issues. Next, we move on to encoding and perceptual mistakes, covering color, scale, and visual weight.
 service-manual.ons.gov.ukdoi.orgdata.europa.eu+22 min
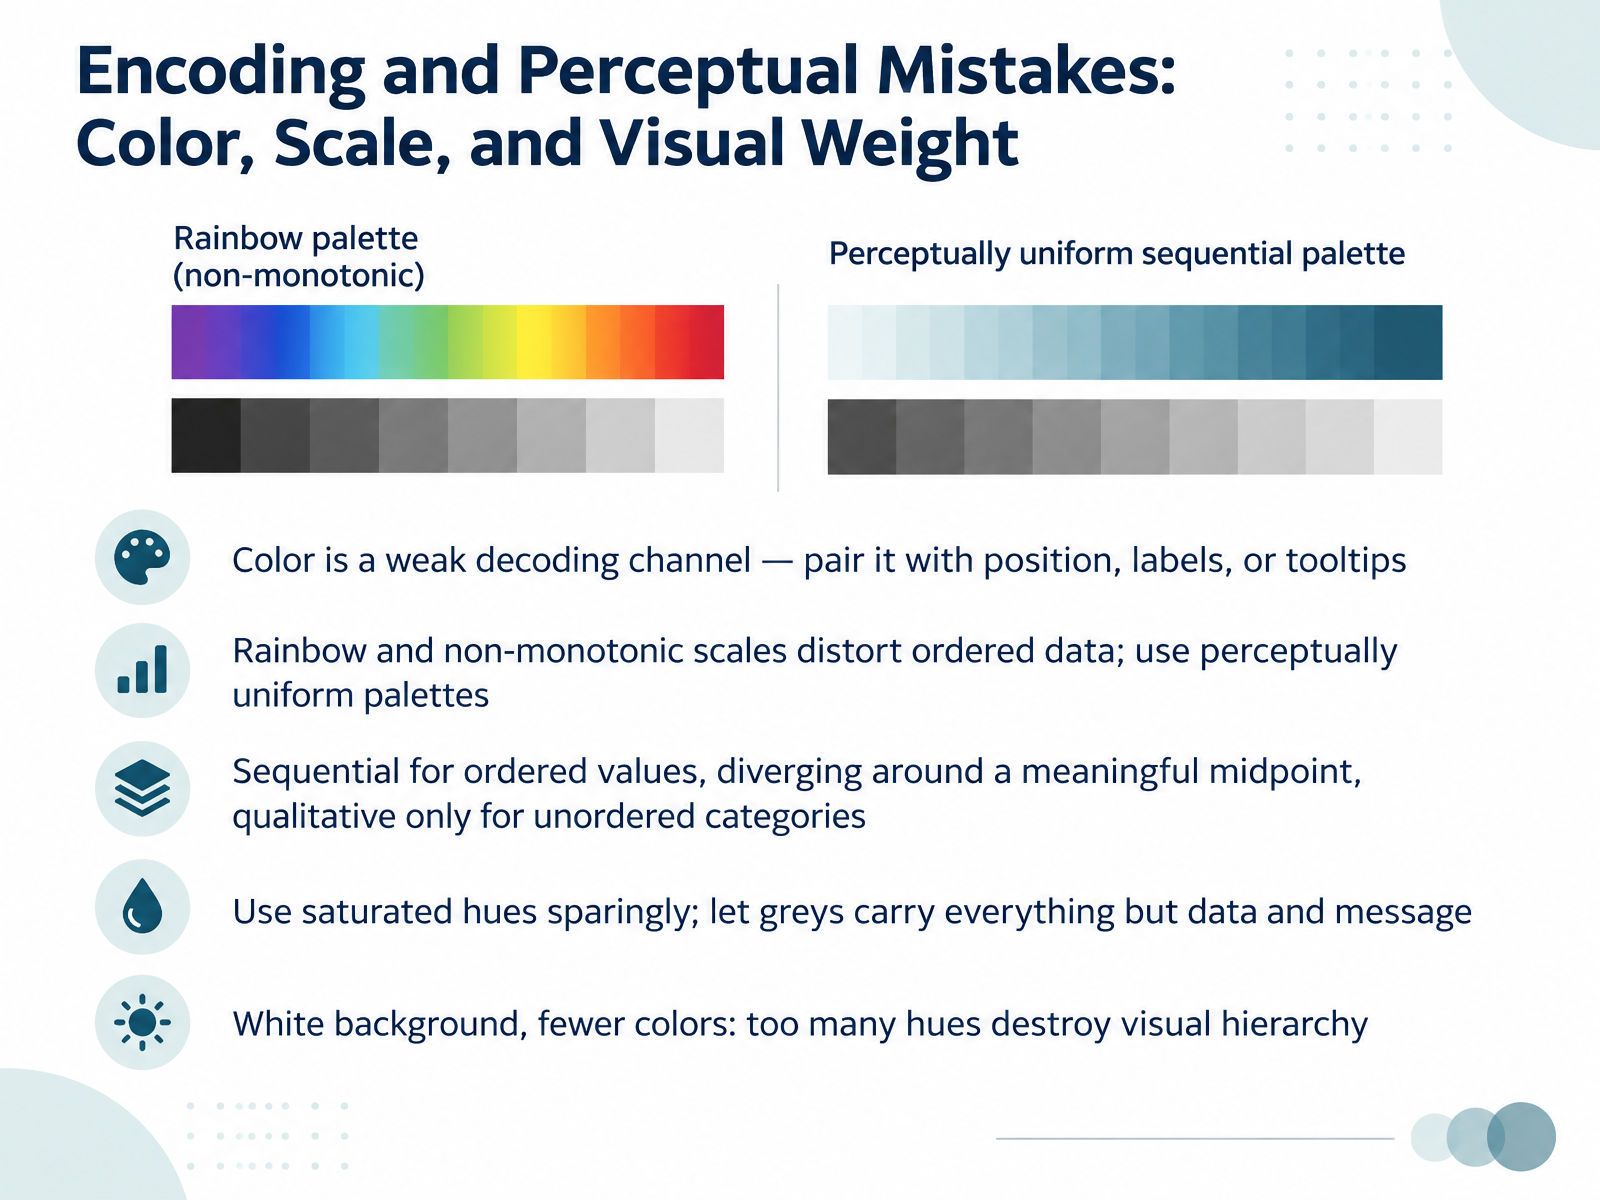
- 05Encoding and Perceptual Mistakes: Color, Scale, and Visual WeightLet's turn to encoding and perceptual mistakes, where color, scale, and visual weight quietly mislead readers. First, color is a weak decoding channel. Pair it with position, labels, or tooltips, so a value can be read without judging a hue. Second, rainbow and non-monotonic scales distort ordered data. Use perceptually uniform palettes instead. Third, match the scale to the data: sequential for ordered values, diverging only around a meaningful midpoint, and qualitative hues only for unordered categories. Fourth, use saturated hues sparingly. Let greys carry everything except your data and your message. Fifth, keep a white background and fewer colors, because too many hues destroy visual hierarchy. Here is your check for the next chart review: count your colors, and confirm every one earns its place. Next, we look at clutter, chartjunk, and cognitive overload.
 data.europa.eu1 min
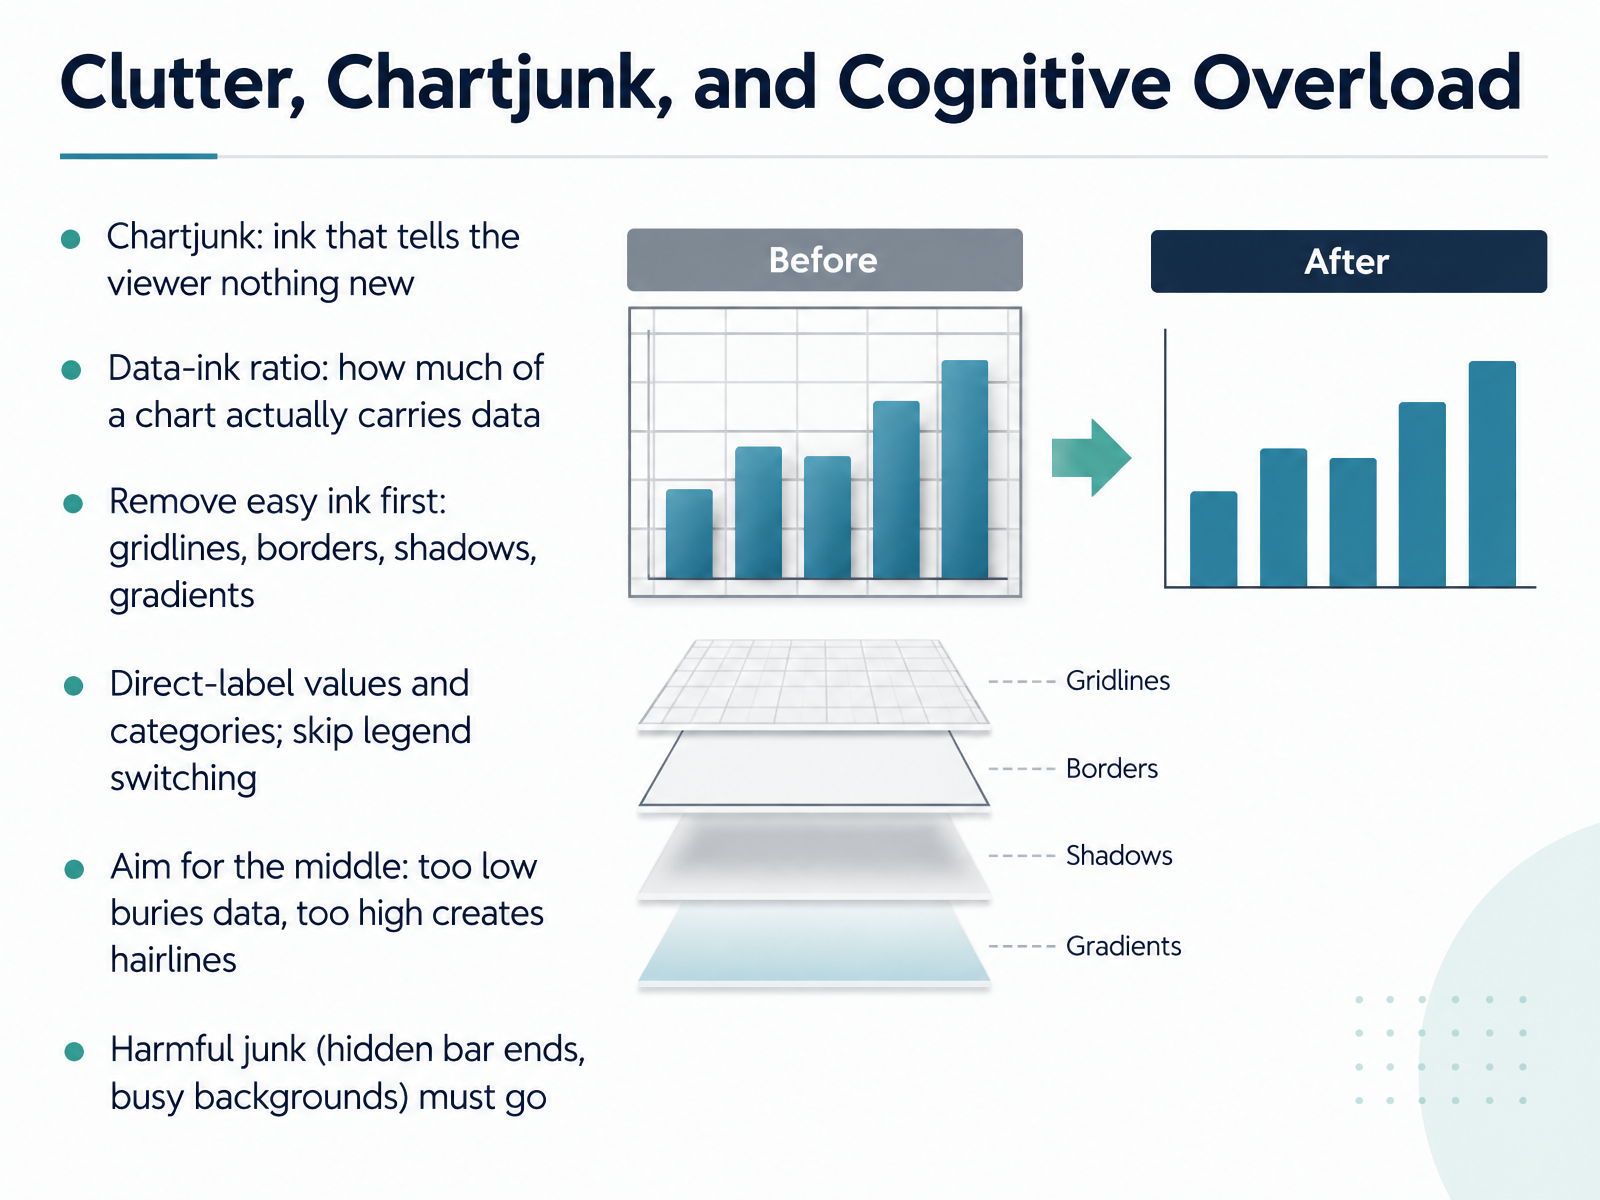
- 06Clutter, Chartjunk, and Cognitive OverloadNow let's look at clutter. Chartjunk is any ink that tells the viewer nothing new. The data ink ratio asks how much of a chart actually carries data. Start with the easy ink. Remove gridlines, borders, shadows, and gradients first. For example, a default report chart often repeats each value with gridlines, axis labels, and data labels. Keep one or two. Next, label values and categories directly on the chart. That stops your reader from switching focus between a legend and the bars. Aim for the middle. Too much ink buries the data. Too little turns bars into hairlines and makes comparison hard. And harmful junk must go, including bars that hide their true ends and busy background images. Here is your check before sign-off. Cover the gridlines and borders with your hand. If the chart still reads clearly, erase them.
 2 min
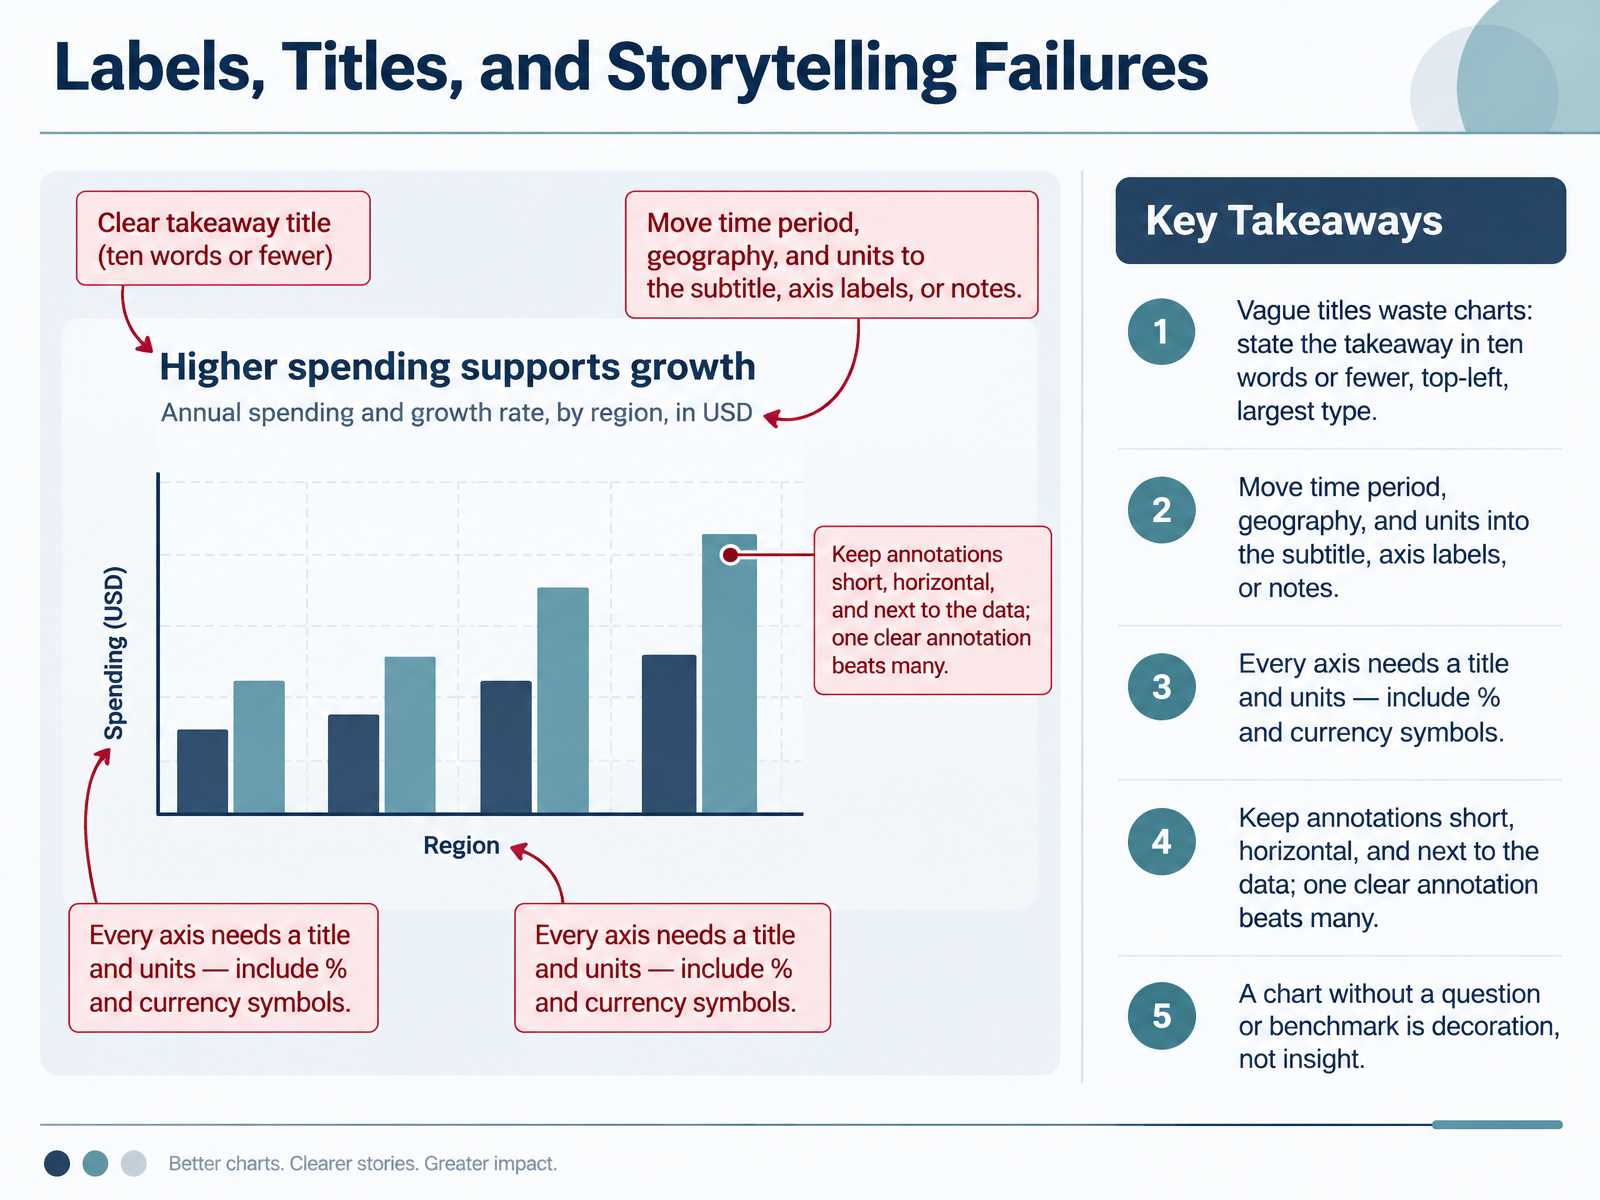
- 07Labels, Titles, and Storytelling FailuresNow let's look at labels, titles, and storytelling failures. A vague title wastes the chart. State your takeaway in ten words or fewer, in the top left, in the largest type. Instead of "Monthly Sales," try "Sales Recovered to Pre-Holiday Levels." Move the time period, geography, and units into the subtitle, axis labels, or notes. Every axis needs a title and units, so include percent and currency symbols. Keep annotations short, horizontal, and next to the data. One clear annotation beats many. And remember, a chart without a question or benchmark is decoration, not insight. Before you sign off your next report, try this check. Read only the title aloud. If it doesn't tell a colleague what to conclude, rewrite it. Next, we'll cover accessibility and inclusivity errors.
 datastorycoach.aidevelopers.google.comdatabricks.com+22 min
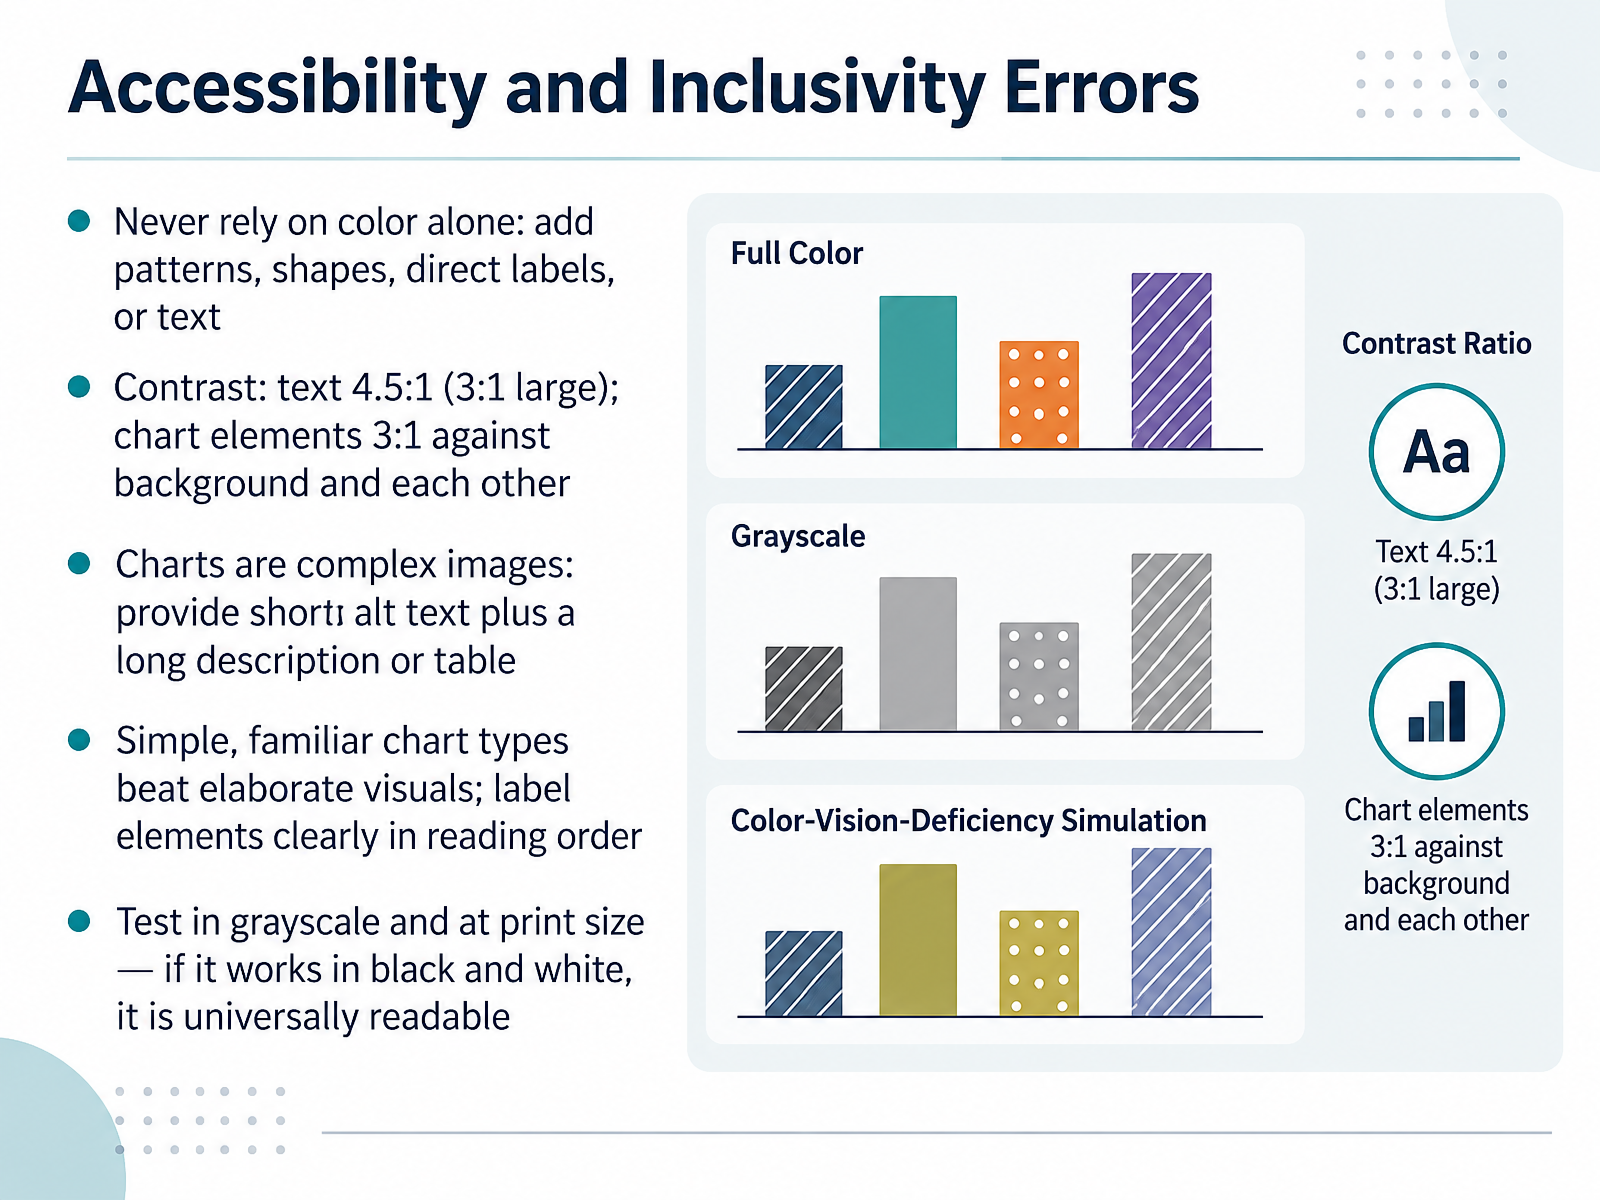
- 08Accessibility and Inclusivity ErrorsNow let's look at accessibility and inclusivity errors. First, never rely on color alone. Add patterns, shapes, direct labels, or text. Check your legend: does each category have a second cue besides hue? Second, contrast. Text should reach four point five to one, large text three to one, and chart elements three to one against the background and each other. Use a contrast checker during sign-off. Third, charts are complex images. Provide short alt text summarizing the takeaway, plus a long description or data table. A quick check: does your alt text name the chart type, the data, and the trend? Fourth, simple, familiar chart types beat elaborate visuals, with elements labeled clearly in reading order. When reviewing, ask whether a colleague could follow it without explanation. Fifth, test in grayscale and at print size. If it works in black and white, it is universally readable. Your immediate check: convert your current chart to grayscale and read it cold. Next, we will walk through a five-minute review checklist for chart reviewers.
 data.europa.eu2 min
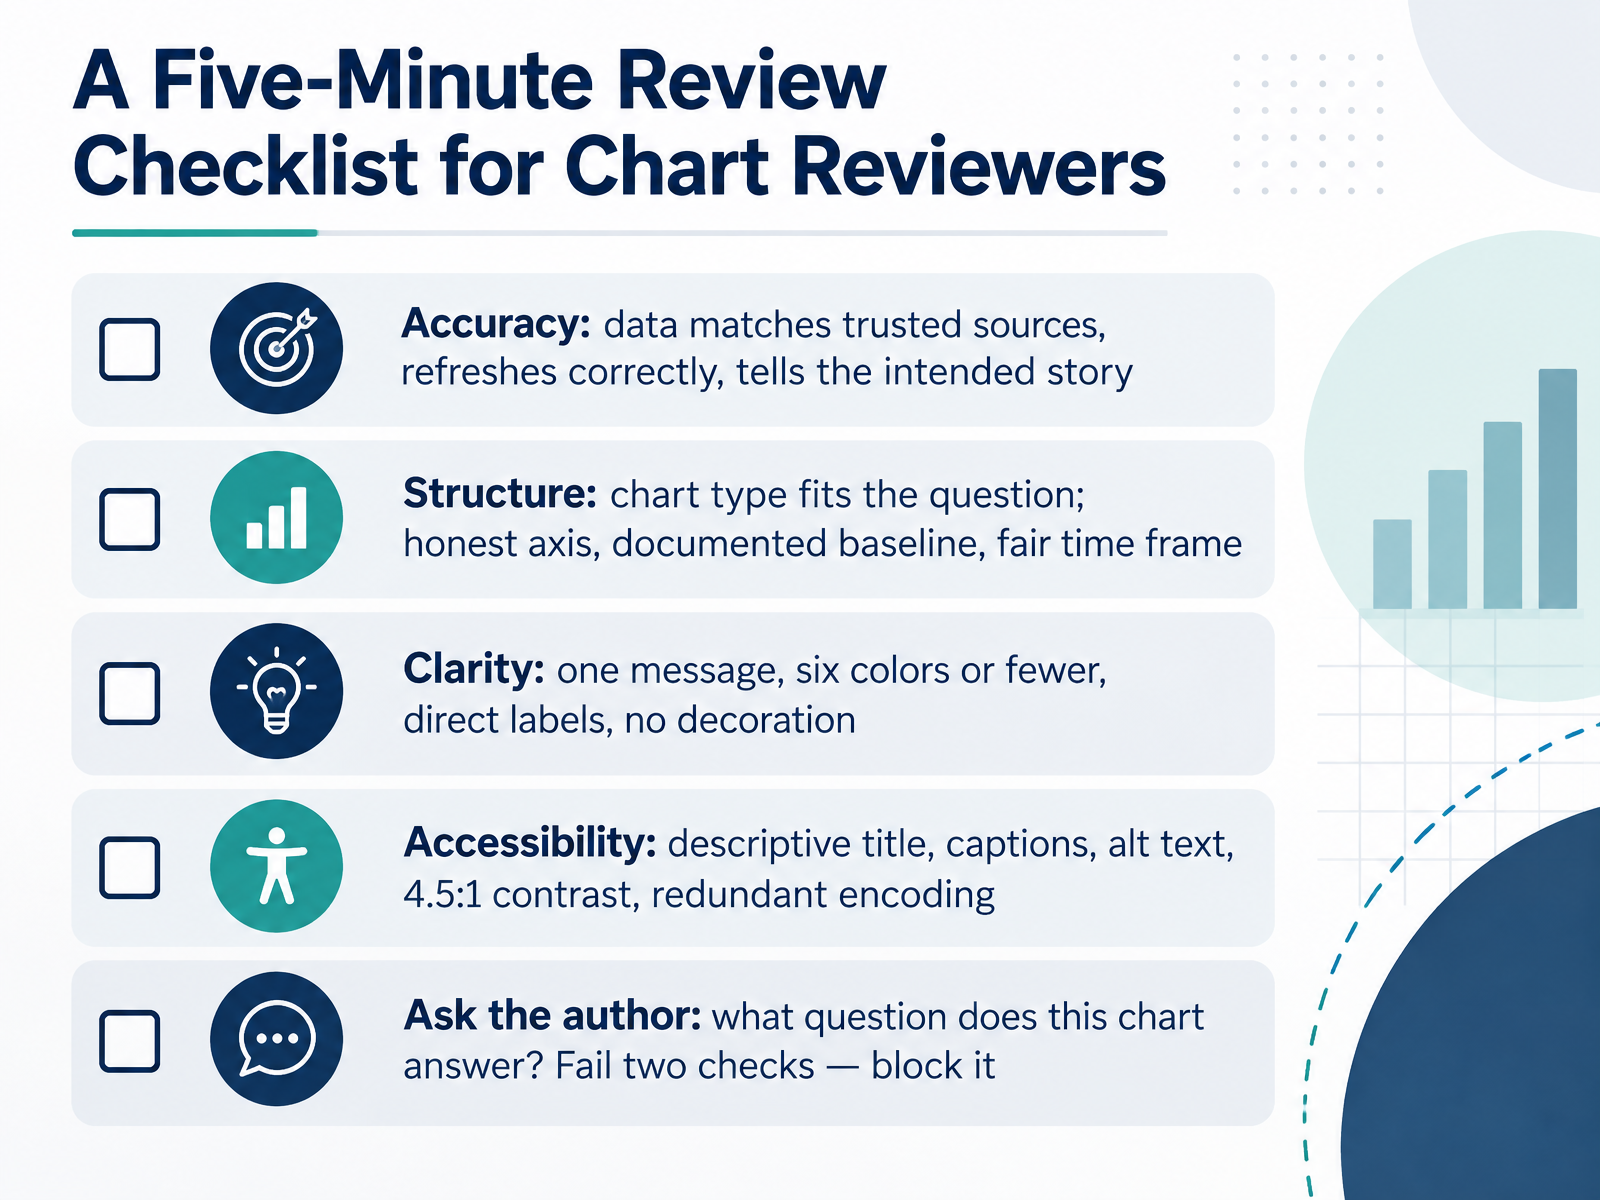
- 09A Five-Minute Review Checklist for Chart ReviewersNow let's put this together as a five-minute review checklist you can run before any chart is signed off. Start with accuracy. Do the numbers match a trusted source, did the refresh run, and does the chart tell the story you intended? For example, compare one key total against the source system. Next, structure. Does the chart type fit the question, and is the axis honest, with a documented baseline and a fair time frame? Then clarity. One message, six colors or fewer, direct labels, and no decoration. Moving to accessibility, check for a descriptive title, captions, alt text, four point five to one text contrast, and redundant encoding so meaning never rests on color alone. Finally, ask the author one question: what question does this chart answer? If you cannot hear a clear answer, pause the review. A practical rule: if a chart fails two or more checks, block it until it is fixed. Here is your immediate action. Save these five checks as a short form, and run one chart through it today. That keeps report sign-off, classroom materials, and stakeholder review consistent, without slowing good work down. Let's look next at giving specific, constructive feedback on charts.
 datastorycoach.aidevelopers.google.comdatabricks.com+22 min
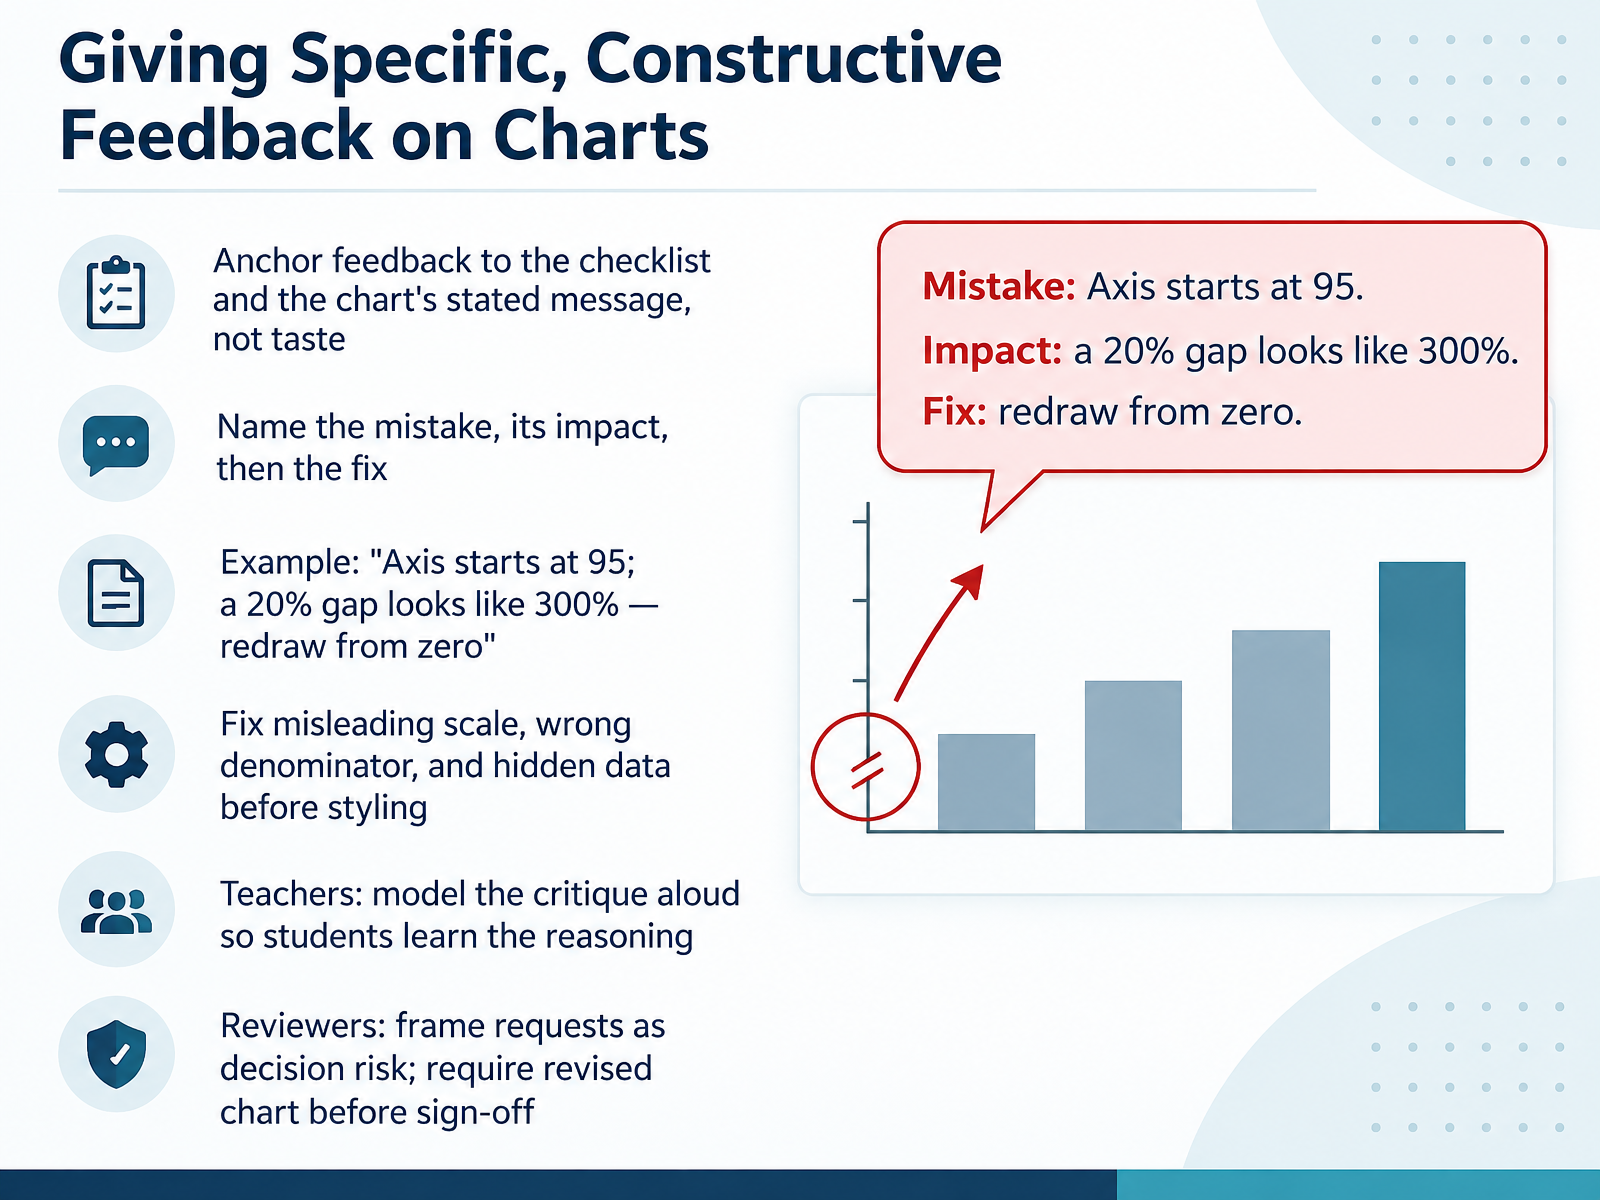
- 10Giving Specific, Constructive Feedback on ChartsNext, let's look at how you give feedback that is specific and constructive. Anchor your comments to the checklist and the chart's stated message, not personal taste. A useful pattern is to name the mistake, its impact, then the fix. For example: the axis starts at ninety five, so a twenty percent gap looks like three hundred percent, so redraw it from zero. Fix misleading scale, wrong denominator, and hidden data before you discuss styling. Teachers, model the critique aloud so students hear the reasoning. Reviewers, frame requests as decision risk, and ask for a revised chart before sign off. One check you can run now: take your last review comment and rewrite it in that mistake, impact, fix order. That moves the conversation toward decisions, which carries into our next topic, Common Dashboard and Reporting Mistakes.
 datastorycoach.aidevelopers.google.comdatabricks.com+21 min
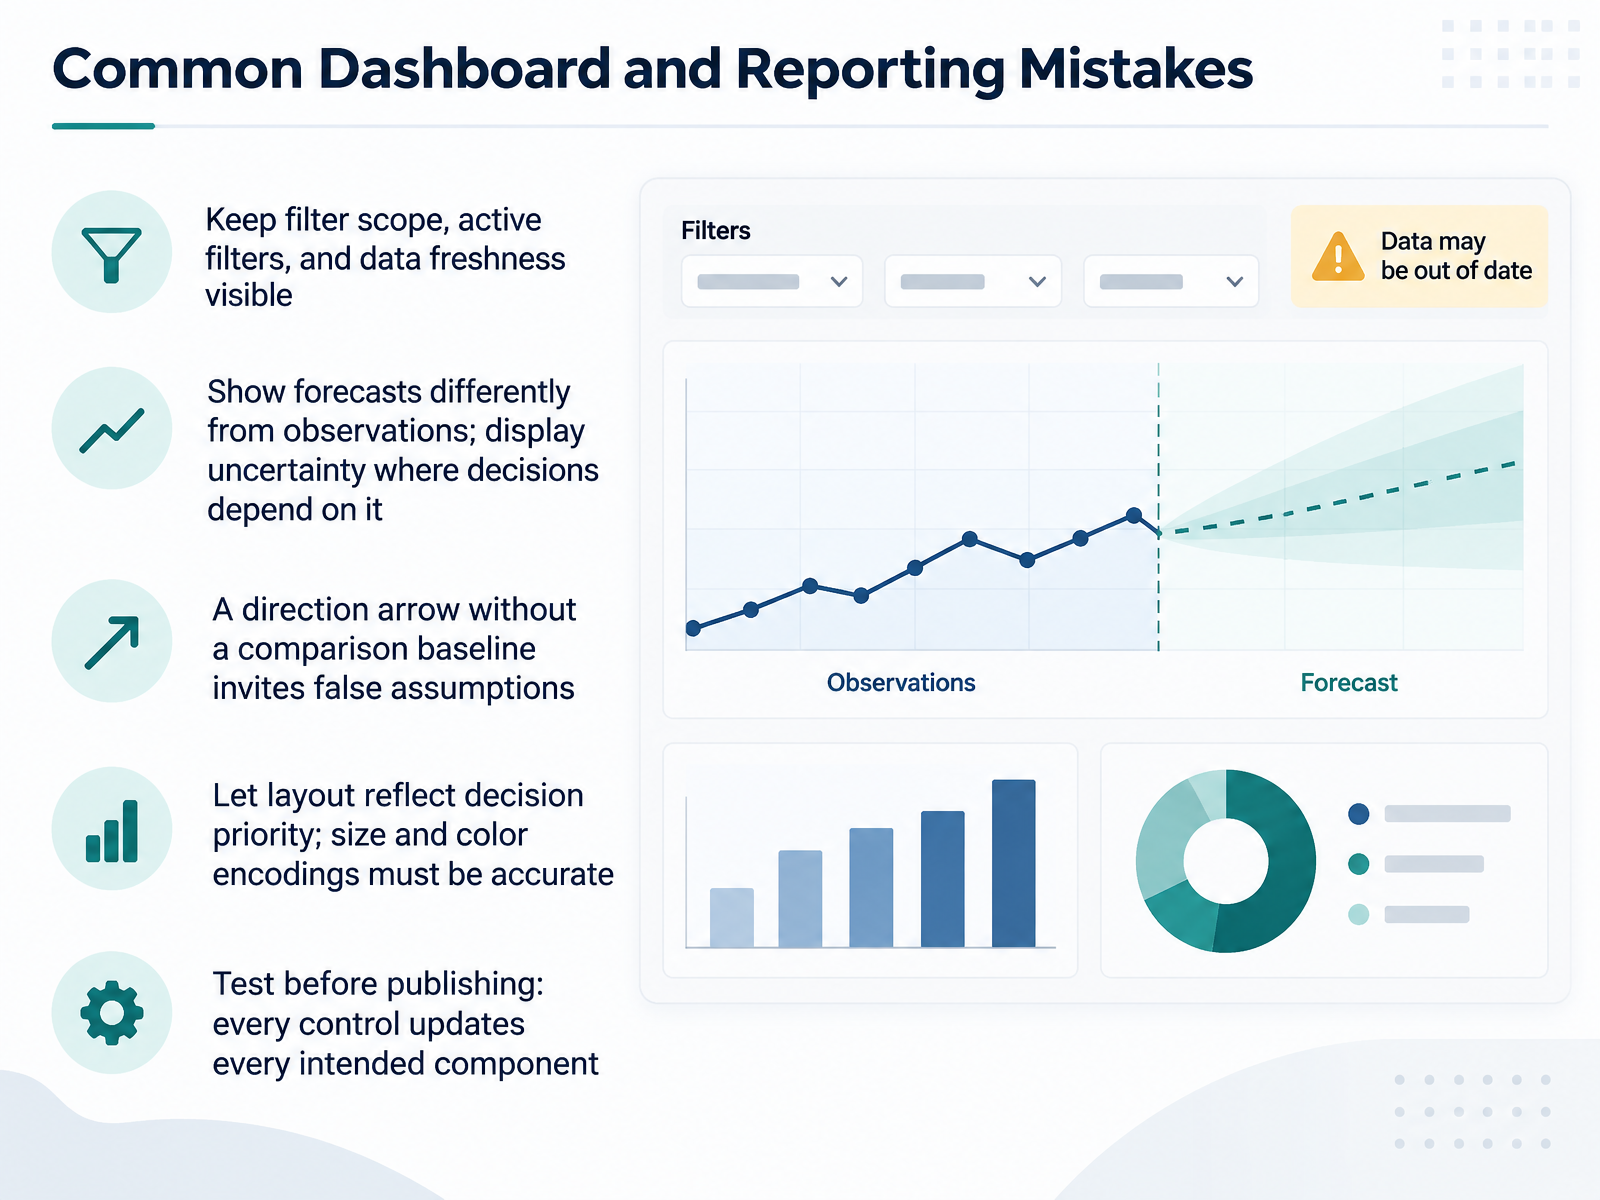
- 11Common Dashboard and Reporting MistakesNext, let's look at common dashboard and reporting mistakes. First, keep filter scope, active filters, and data freshness visible. If a region filter is applied, every viewer should see it, and know whether each chart is filtered or intentionally global. Second, show forecasts differently from observations, and display uncertainty where decisions depend on it. Third, a direction arrow without a comparison baseline invites false assumptions. Always name the comparison, such as last month or target. Fourth, let layout reflect decision priority, and make sure size and color encodings are accurate. Before publishing, test every control. Confirm that every intended component updates, and that failures surface visibly rather than showing stale values. One quick check for your next review: select a filter, then verify that each chart updates or is clearly labeled as unfiltered. Next, we'll look at AI-generated and self-service charts, and the new review risks they bring.
 datastorycoach.aidevelopers.google.comdatabricks.com+21 min
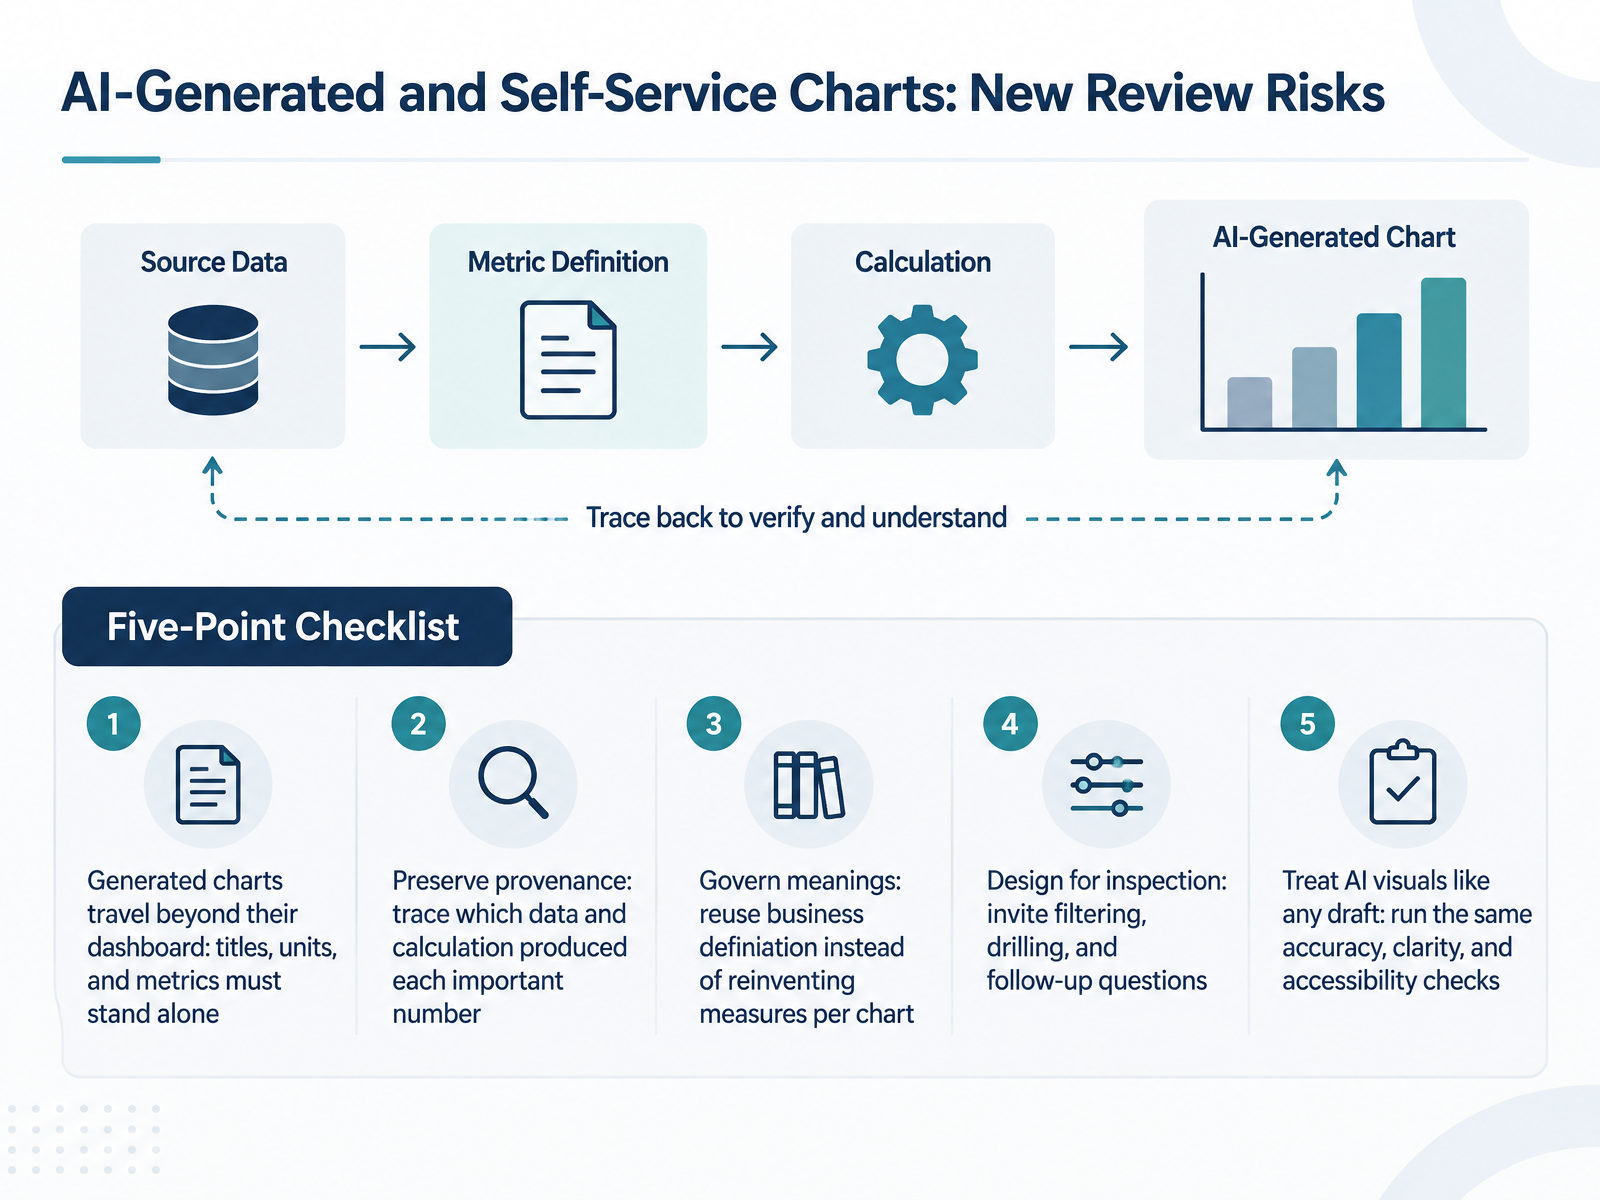
- 12AI-Generated and Self-Service Charts: New Review RisksNow let's look at newer risks, starting with AI-generated and self-service charts. A generated chart often travels beyond its dashboard, so its title, units, and metric names must stand alone. Here's your check: would a reader understand it without you in the room? Next, preserve provenance. Trace which data and calculation produced each important number. For a sign-off, confirm you can name the source table behind the headline figure. Third, govern meanings. Reuse approved business definitions instead of reinventing a measure per chart. Ask whether the revenue definition matches the one in your reporting standards. Fourth, design for inspection. Invite filtering, drilling, and follow-up questions instead of presenting an unexplained answer as fact. Finally, treat AI visuals like any draft. Run the same accuracy, clarity, and accessibility checks you would apply to a colleague's chart. One quick test today: open the most important AI-made chart in your last report, and see whether its title, units, and source all make sense on their own. Next, we put these checks into practice.
 datastorycoach.aidevelopers.google.comdatabricks.com+22 min
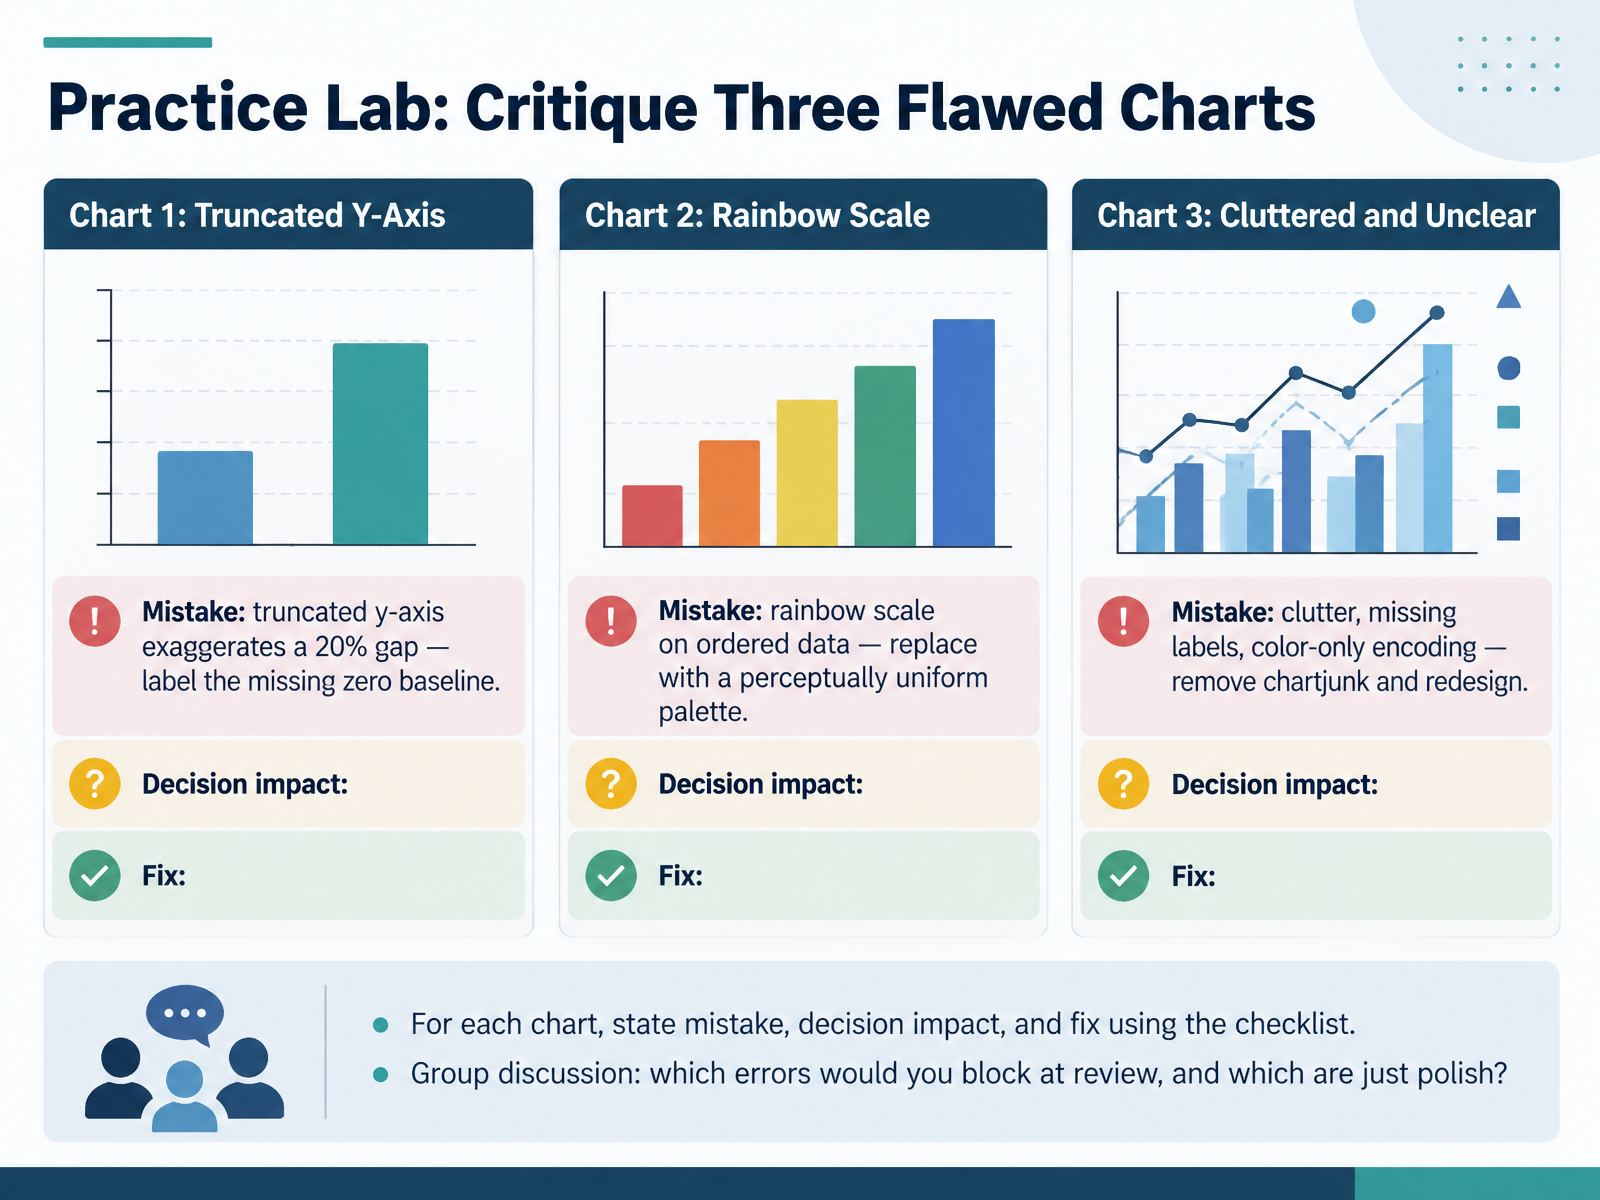
- 13Practice Lab: Critique Three Flawed ChartsLet's put the checklist to work. Here are three flawed charts to critique. For chart one, the y-axis is truncated, so a twenty percent gap looks enormous. The fix is to restore the zero baseline and label it clearly. Quick check: does your bar chart start at zero? For chart two, an ordered variable uses a rainbow scale. Replace it with a perceptually uniform palette, so order reads as order. For chart three, remove the chartjunk, add the missing labels, and stop relying on color alone. Give each chart the same treatment: state the mistake, the decision it could distort, and the fix. Then discuss as a group which errors you would block at review, and which are just polish. Then we'll turn these habits into an action plan.
 online.hbs.eduinsight.kellogg.northwestern.eduthoughtspot.com+21 min
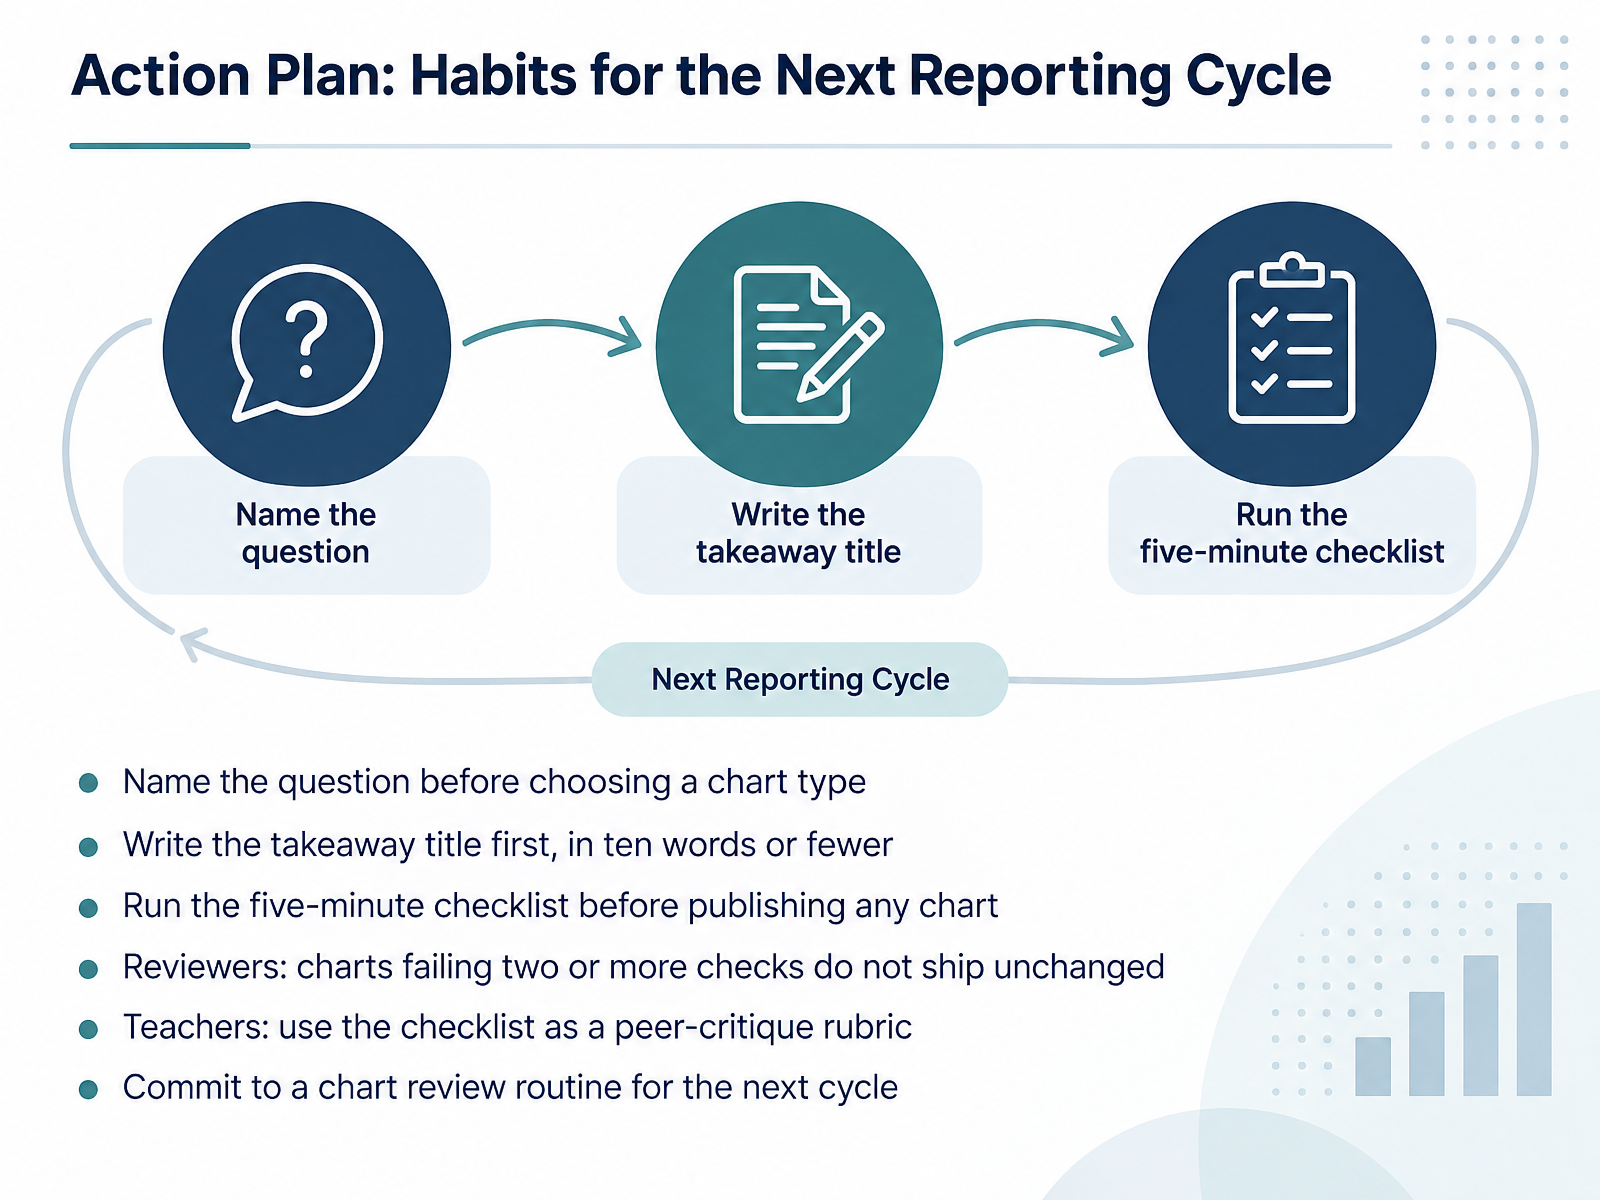
- 14Action Plan: Habits for the Next Reporting CycleLet's close by turning everything we covered into habits for your next reporting cycle. First, name the question before you choose a chart type. If you cannot state the question in one sentence, you are not ready to chart yet. Second, write the takeaway title first, in ten words or fewer. For example, "Website traffic recovered to pre-holiday levels in February" tells your reader what to see. Third, run the five-minute checklist before publishing any chart. It covers chart type, axis baseline, color, context, and whether a non-expert understands it within ten seconds. Reviewers, here is your rule: charts failing two or more checks do not ship unchanged. That strictness protects the deck once it is shared and quoted. Teachers, use the same checklist as a peer-critique rubric. Students rating each other's charts learn the standards faster than from lectures alone. Finally, commit to a chart review routine for the next cycle, whether that is a monthly sign-off or a quick peer pass. Your immediate check: pick one chart you will publish this week and write its question and takeaway title before you open the tool. Thank you for your attention, and I encourage you to start with just one of these habits. Small, consistent checks make your charts clearer, and your decisions stronger.
 datastorycoach.aidevelopers.google.comdatabricks.com+22 min
Take the deck with you
Download this course as a file — free, no sign-up needed.
- PDF handoutEvery slide page, ready to print or share.15 pages · 3.2 MBDownload
- Narrated PowerPointThe deck that presents itself — every slide carries the digital human's narration video.15 pages · 12.8 MBDownload
- PowerPoint slidesThe full deck as a .pptx — open it in PowerPoint, Keynote, or Google Slides.15 pages · 3.1 MBDownload
Free to use in your own training — please keep the PersonWise credit page at the end.
Have your own deck? Turn it into a course
Sources consulted
Web sources consulted while building this course.
- The Biggest Data Visualization Mistakes (and How to Fix Them) | DataStoryCoach — datastorycoach.ai
- Visualization traps | ML Universal Guides | Google for Developers — developers.google.com
- Data visualization best practices: A practical guide to clear, honest, effective charts | Databricks Blog — databricks.com
- 10 Data Visualization Mistakes to Avoid in 2026 | clariBI — claribi.com
- Visualization Audit for Misleading Marketing Reports — analyses.info
- Bad Data Visualization: 5 Examples of Misleading Data — online.hbs.edu
- See an Exciting Trend in That Chart? Proceed with Caution. — insight.kellogg.northwestern.edu
- How to Identify Misleading Graphs and Charts (With Examples) — thoughtspot.com
- How to confuse your shareholders by bad data visualization – paulvanderlaken.com — paulvanderlaken.com
- Figures lie. Liars figure | CIO — cio.com
- How to Choose the Right Chart for Your Data | DataInterview — datainterview.com
- Match your story with a chart type | CT Data Visualization Guidelines — ctopendata.github.io
- How to Choose the Right Data Visualization - Charts — atlassian.com
- Choose the Right Chart Type for Your Data - Tableau — help.tableau.com
- Appendix C: Chart Selection Cheatsheet | Data Viz with Python — datafield.dev
- Chart details: Axes and gridlines – Data visualisation – Service manual – Office for National Statistics — service-manual.ons.gov.uk
- Truncating the Y-Axis: Threat or Menace? — doi.org
- Breaking scales — data.europa.eu
- Choice of y -axis can mislead readers — pmc.ncbi.nlm.nih.gov
- Colour for numerical data: colour scales — data.europa.eu