Missing Data: Absence, Codes, Limits
Begin
13 pages · ~26 min
Missing Data: Absence, Codes, Limits
Learn to identify and interpret missing data, including absence, codes, and limits, for data professionals.
What you’ll learn
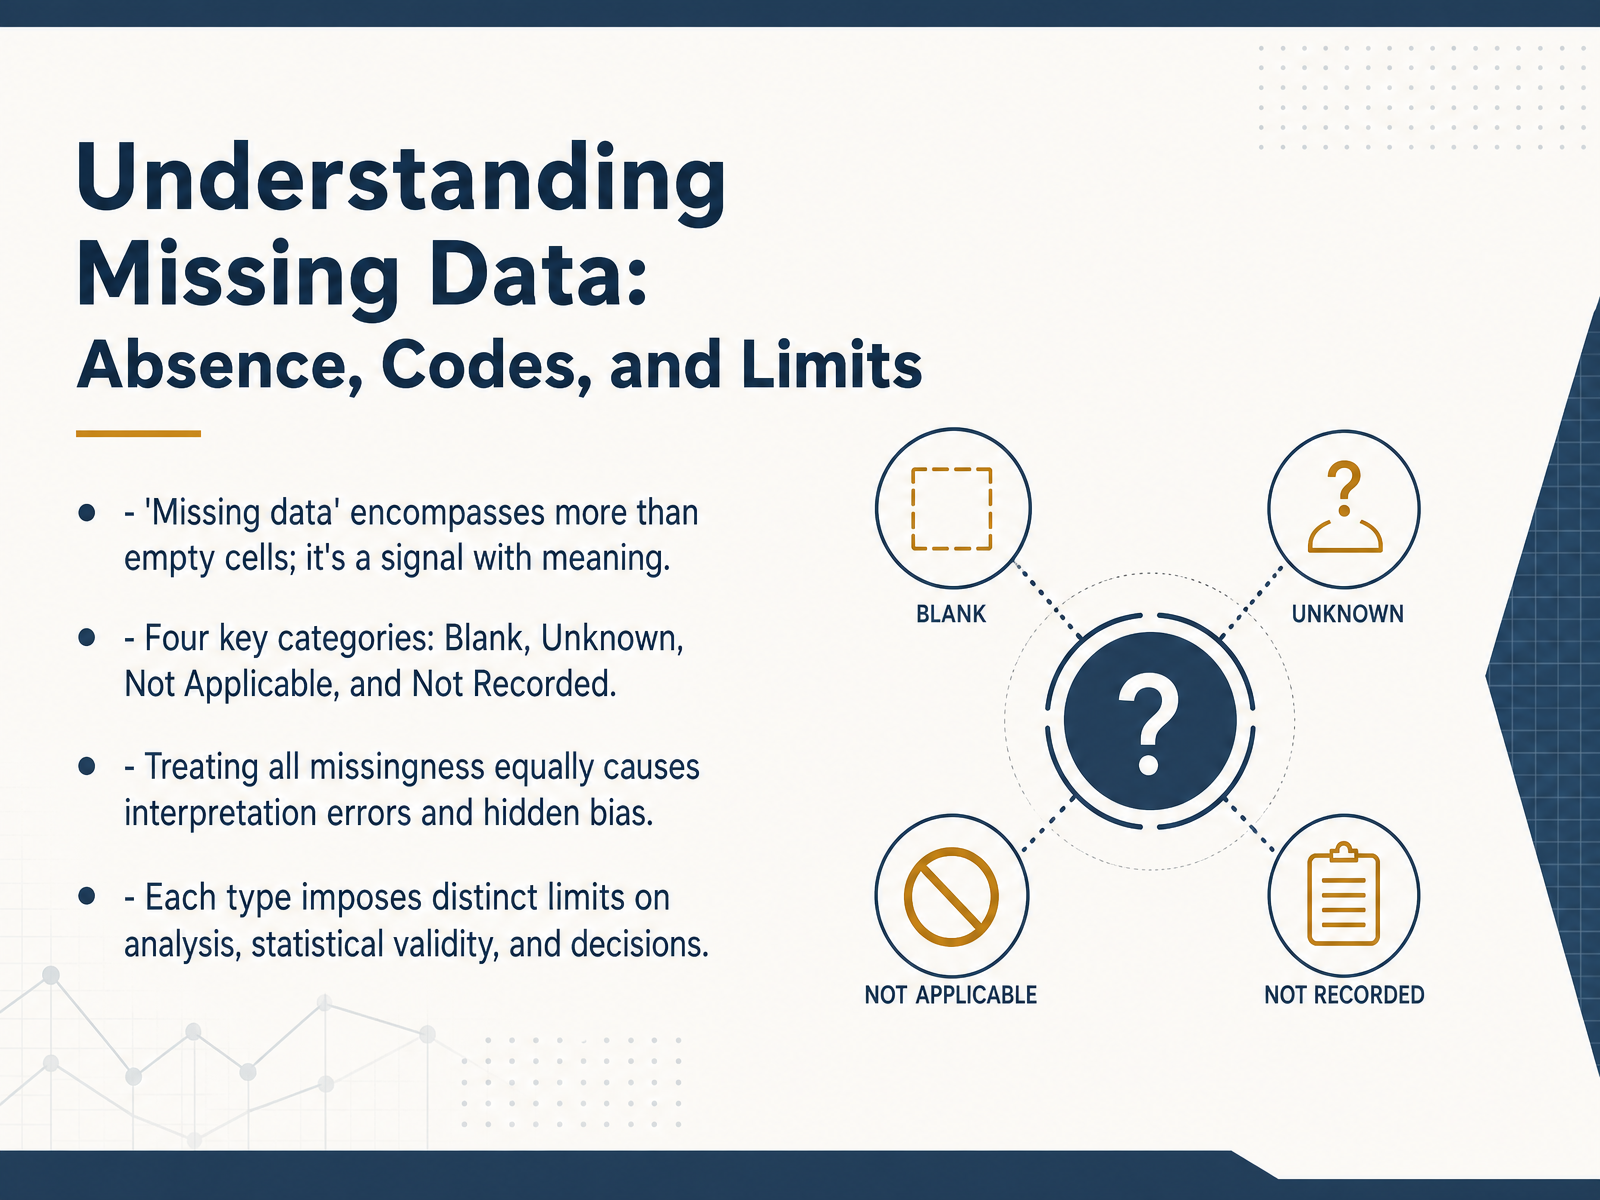
- 01Understanding Missing Data: Absence, Codes, and LimitsWelcome. In this session we will explore a topic that often hides in plain sight: missing data. Missing data is not just an empty cell. It is a signal with a meaning, and that meaning depends on why the data is absent. We will focus on four key categories you will encounter again and again: Blank, Unknown, Not Applicable, and Not Recorded. Each one tells a different story. When we treat all missingness the same, we introduce hidden bias into our analysis and weaken the validity of our decisions. Throughout this course we will see how each type imposes distinct limits on what we can conclude from a dataset. Our goal is to help you read these signals clearly and respond with the right analytic choice. Now let us start with a first practical step: why these differences matter in the real world.stefvanbuuren.namedoi.orgdoi.org+22 min
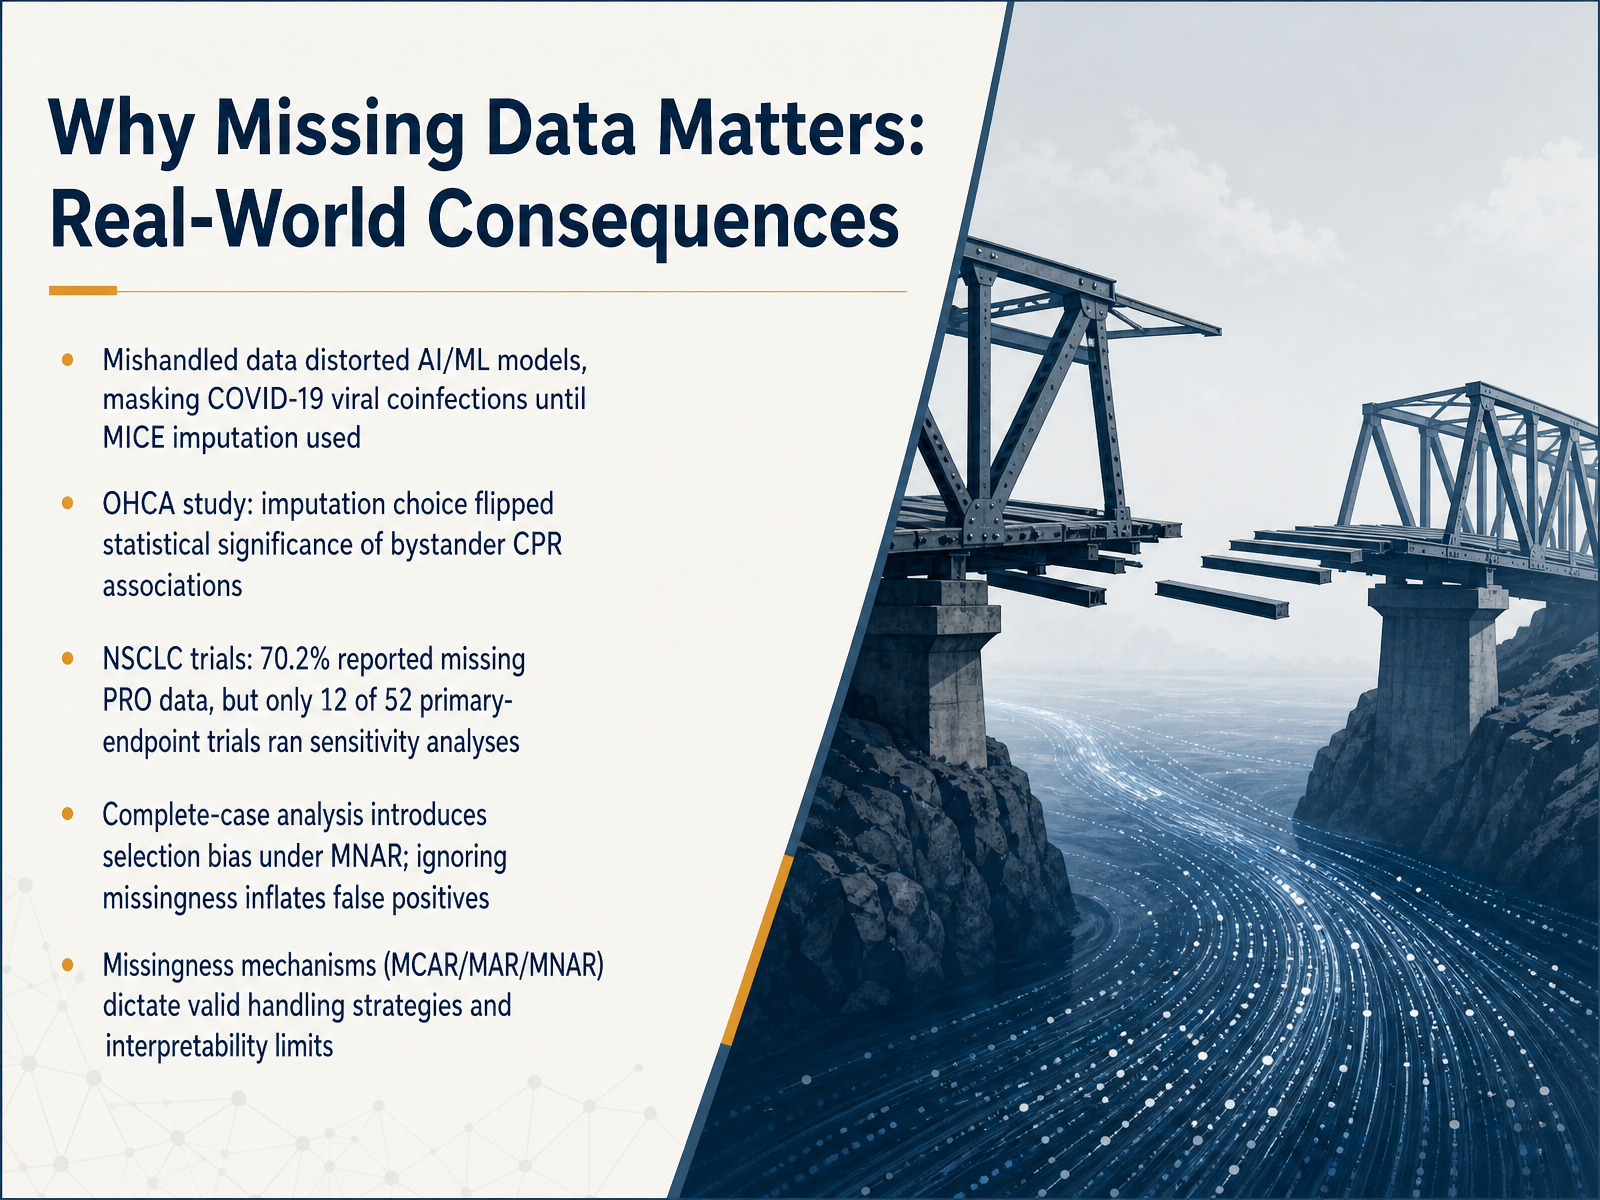
- 02Why Missing Data Matters: Real-World ConsequencesNow let's look at some real-world consequences to understand why getting missing data right is so critical. In one medical study, mishandled data actually masked serious viral coinfections during the COVID-19 pandemic. These hidden patterns only surfaced when researchers used a careful method called multiple imputation. In an out-of-hospital cardiac arrest study, simply switching the imputation technique completely flipped the statistical significance of a key question: whether bystander CPR was associated with better outcomes. We see a similar pattern in cancer clinical trials. Over 70 percent of studies had missing patient-reported data, yet only 12 out of 52 primary trials ran sensitivity analyses to check if their results were robust. When we ignore missing data and just analyze complete cases, we can introduce selection bias, especially when the reason data is missing is tied to the patient's condition. That bias can inflate false positives. The core takeaway is this: the mechanism behind the missingness—whether it's completely random, related to what we observe, or related to what we can't observe—dictates which handling strategy is valid and how trustworthy our conclusions are. Next, we'll build a shared vocabulary by exploring the standard definitions for missingness.
 journals.plos.orglink.springer.comlink.springer.com+22 min
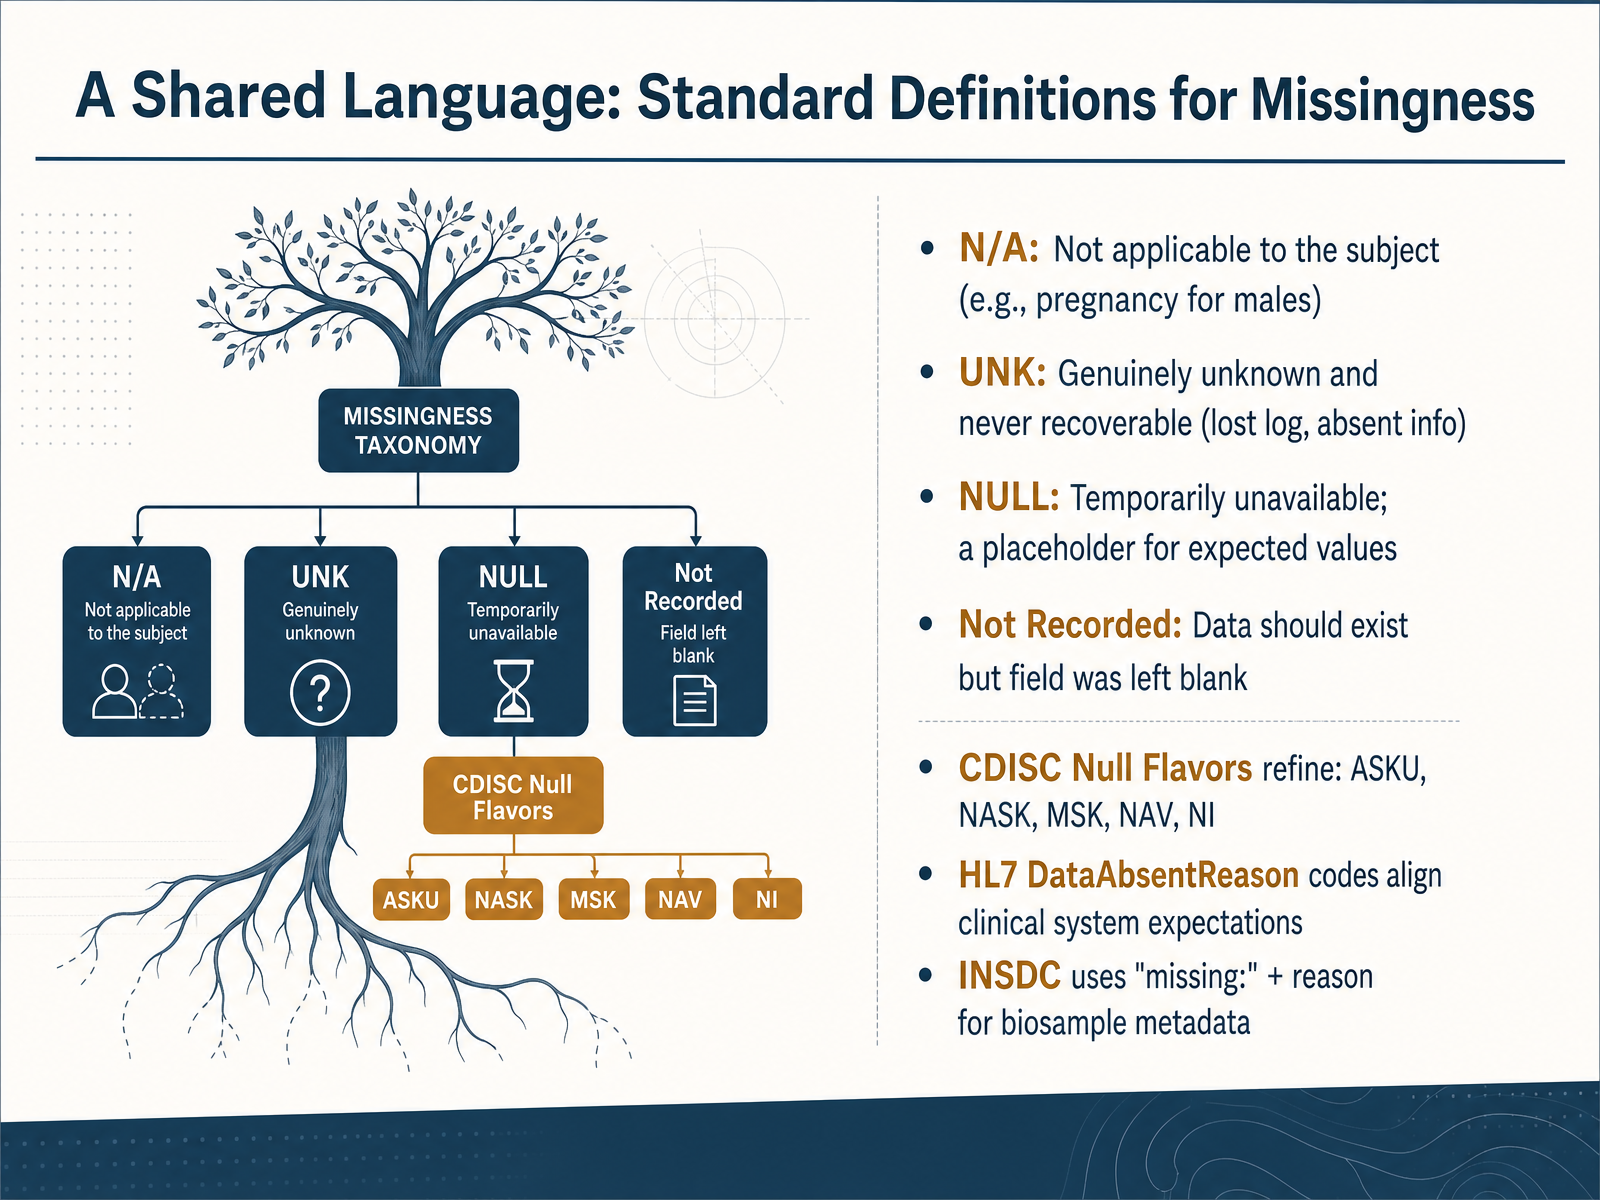
 - 03A Shared Language: Standard Definitions for MissingnessLet's build a shared vocabulary for what we really mean when data is absent. We'll start with four fundamental terms. First, N slash A, or Not Applicable. This means the question simply doesn't make sense for that subject. Think of pregnancy status for a male patient. Second, U N K, or Unknown. This is for information that is genuinely lost and can never be recovered, like a destroyed observation log. Third, NULL. This represents a temporary placeholder. The value is expected to exist later, but it's not available right now. And fourth, Not Recorded. This is the classic blank field where data should have been entered but was simply left empty. These four categories are the building blocks, but major industry standards add even more precision. For example, C D I S C null flavors distinguish between 'asked but unknown' and 'not asked.' The H L Seven Data Absent Reason codes align clinical systems with terms like 'masked' or 'unsupported.' Even biosample metadata in I N S D C uses a structured 'missing colon reason' format. All of these systems share the same goal: replacing a meaningless blank with a clear, actionable reason for the absence. Now that we have a shared language, the next step is understanding why all blanks are definitely not created equal. Let's unpack the four categories in more detail.
 nemsis.orgpds.nasa.govcdisc.org+22 min
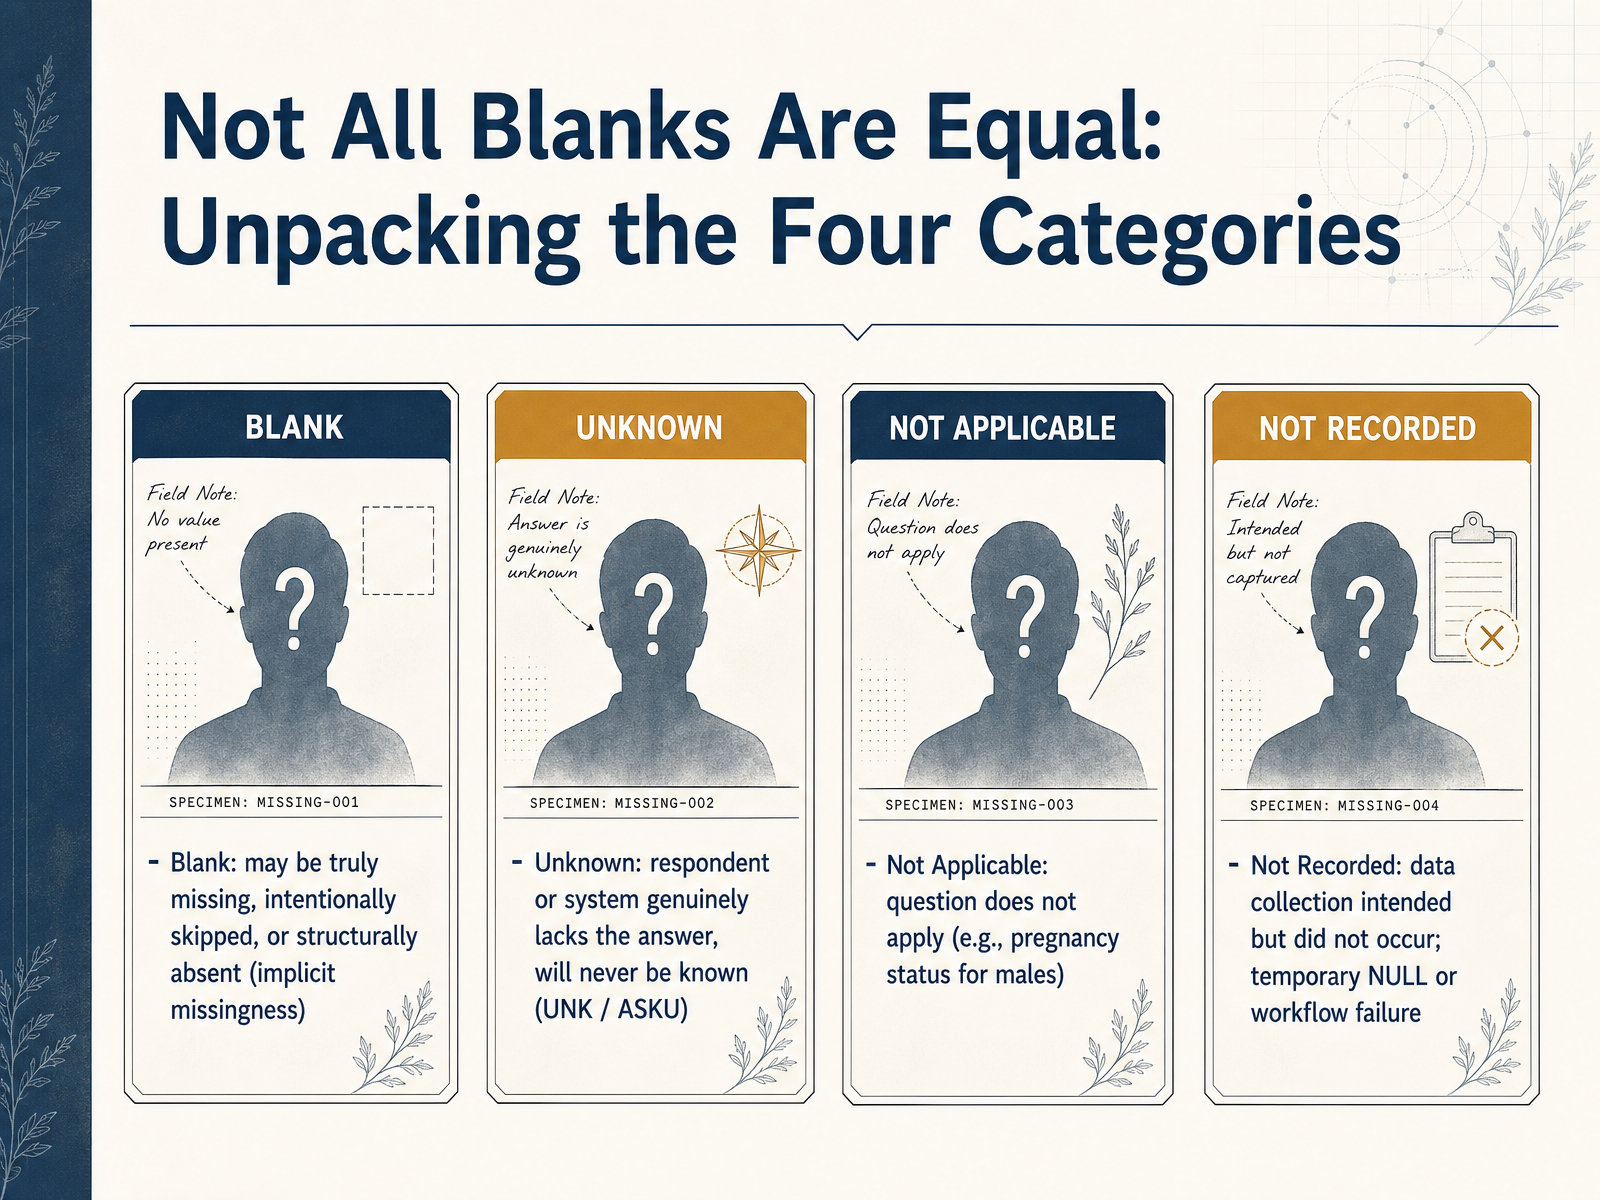
 - 04Not All Blanks Are Equal: Unpacking the Four CategoriesMoving to the practical side, let’s unpack the four main categories of blanks you’ll encounter. They are not all equal. A blank cell might mean the data is truly missing or was intentionally skipped, or it might be structurally absent because the question was never relevant. This is what we call implicit missingness. Then there is Unknown, sometimes coded as UNK or Asked but Unknown. This tells you the respondent or system genuinely does not have the answer, and it will never be recovered. Next is Not Applicable. This is a structural reason for emptiness, like asking for pregnancy status for a male patient. The field simply does not apply. Finally, Not Recorded is different. It means collection was intended but did not happen, maybe due to a workflow failure or a temporary gap, which in some systems is treated as a placeholder that should eventually be filled. Recognizing these categories helps you stop treating every empty cell the same way. Coming up, we’ll look at how structural missingness creates patterns that can mislead your analysis.
 nemsis.orgpds.nasa.govcdisc.org+22 min
 - 05Structural vs. Sporadic Missingness: Patterns That MisleadLet's move on to how missing data can form patterns, which matters because the pattern itself can mislead you if you don't recognize it. We distinguish structural missingness from sporadic missingness. Structural missingness happens when entire rows, variables, or modules are absent by design, like a whole survey section that wasn't administered or a time point that doesn't apply to a subgroup. These gaps often get mistaken for data errors. Sporadic missingness is what we usually picture, scattered gaps within existing rows, like an occasional unanswered question. Implicitly missing rows are combinations you expect to see but don't find at all, like a missing quarterly record for a stock that should be there. Explicitly missing cells show up as NA or NULL right inside the table. When entire variables are systematically missing, for example a biomarker not collected in some studies, combining data becomes risky if you treat that absence as a random glitch. Recognizing these distinctions helps you choose the right handling strategy and avoid analysis traps. We'll go deeper into coding pitfalls next.
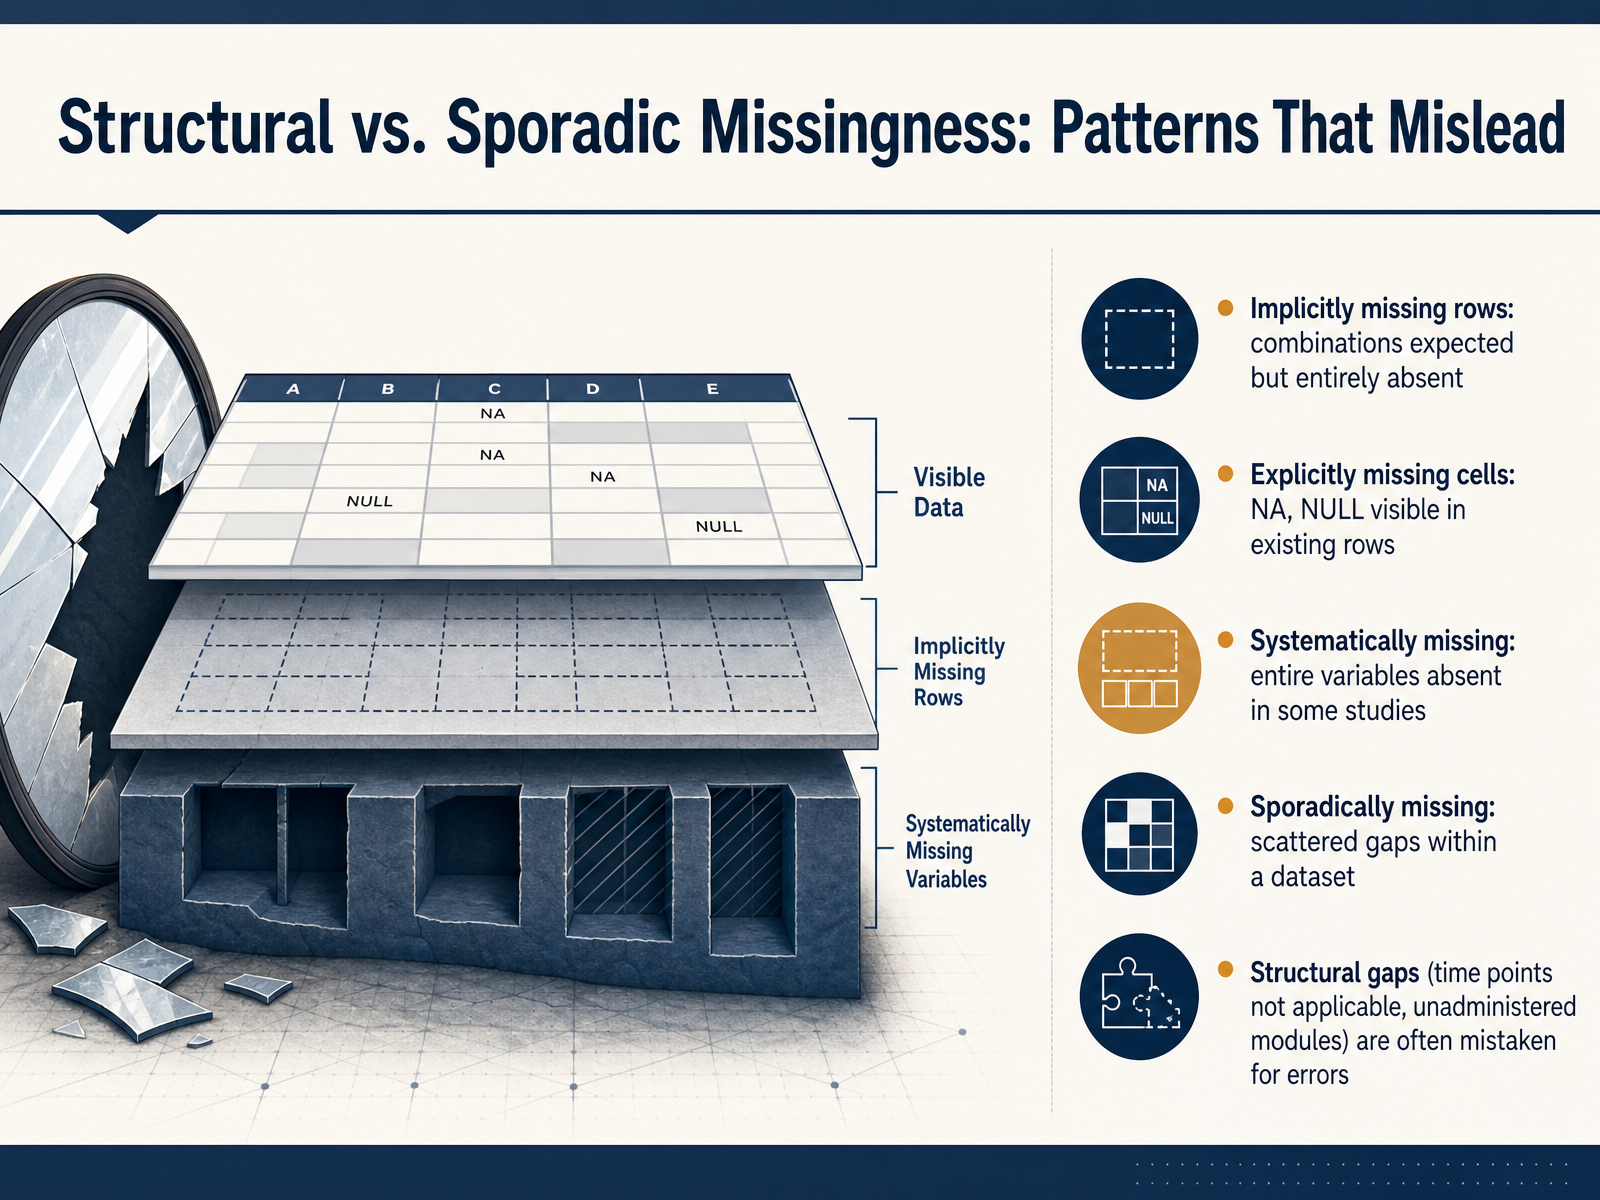 stefvanbuuren.namedoi.orgdoi.org+21 min
 - 06Coding Pitfalls: 0, 99, NULL, and Other Dangerous PlaceholdersNow let's talk about a common but dangerous trap: coding pitfalls. You may see values like zero, negative 99, 999, empty strings, or sentinel dates like January first, 1900. These often mask true missingness. For example, a zero could mean zero sales, or it could mean nobody entered the data yet. A date of 1900 might mean unknown, but your code will treat it as a real date, throwing off averages and breaking longitudinal analysis. Mixing NULL with Not Applicable or Unknown can distort SQL queries, joins, and aggregation logic. The best practice is simple. First, use a separate column to record the reason for missingness. Second, rely on a codebook to document your numeric flags clearly. Third, consistently use NA or NaN in your statistical tools instead of custom magic numbers. These small habits keep your analysis honest and your estimates unbiased. Next, we will explore limits on interpretation and how each category changes the story.
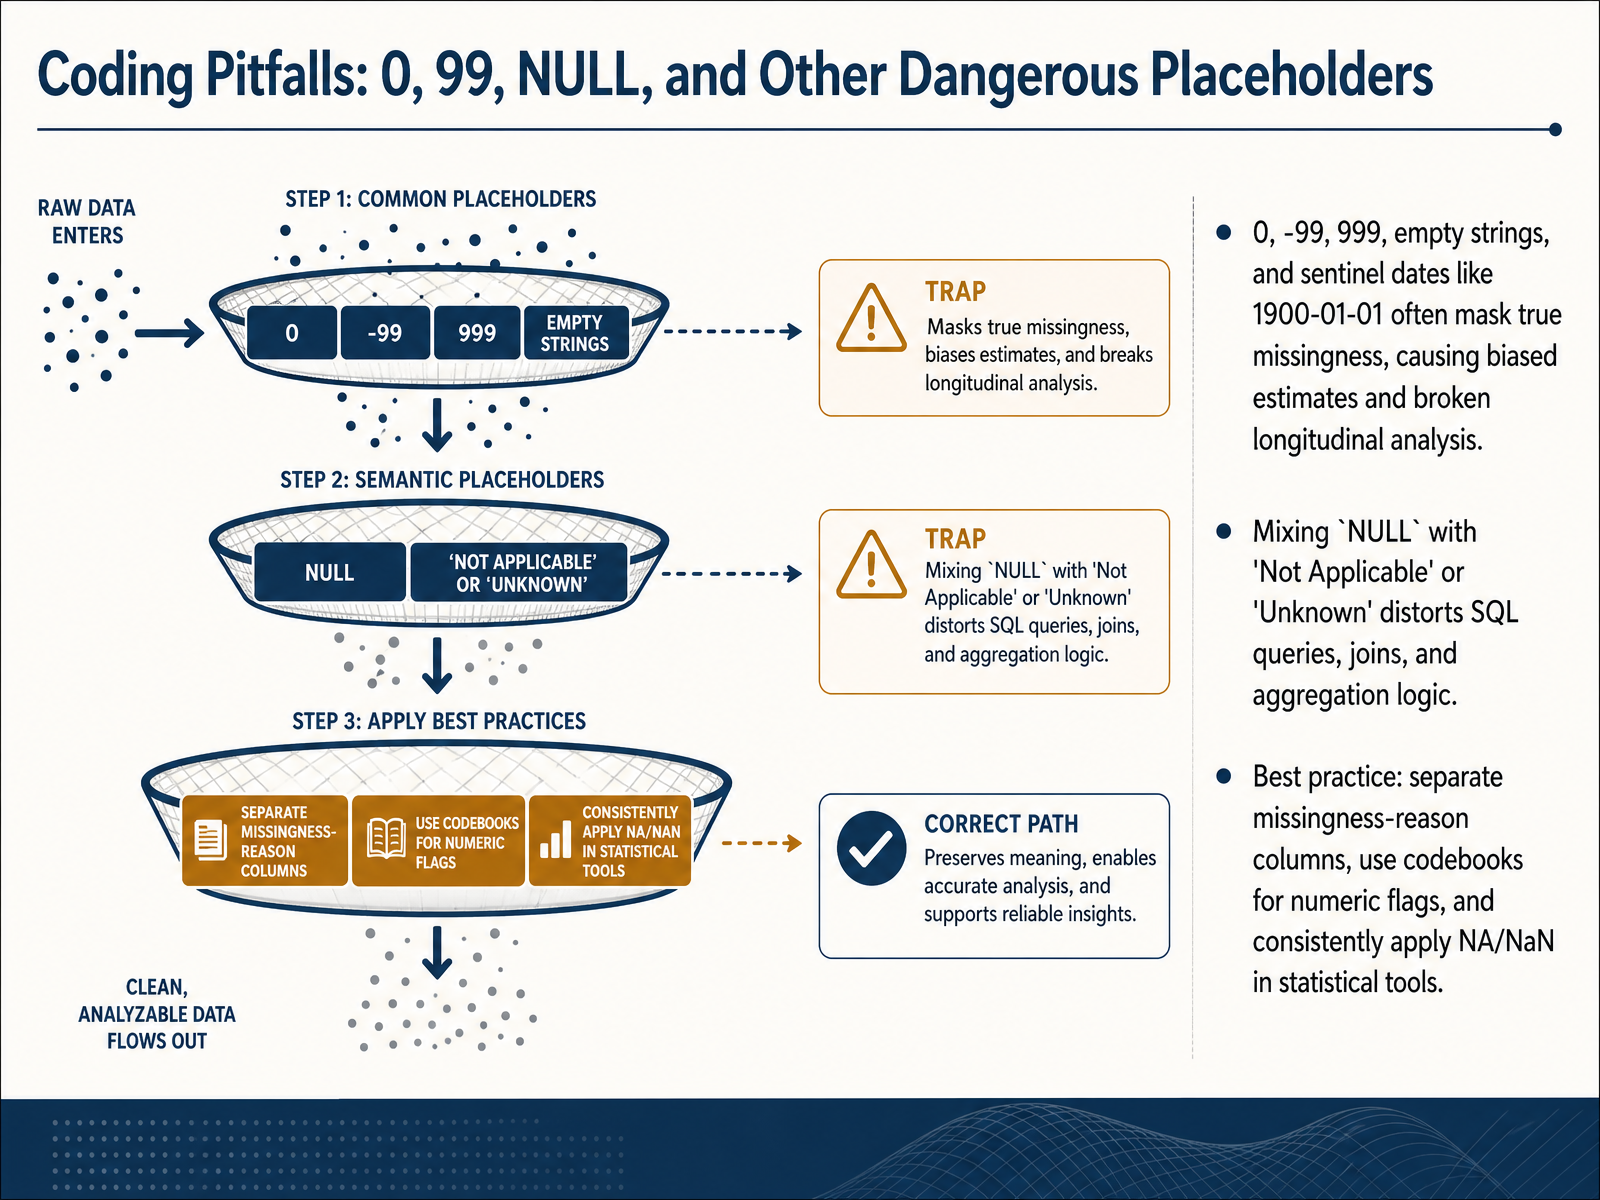 sqlperformance.comr4ds.hadley.nzkgryczan.github.io+22 min
 - 07Limits on Interpretation: How Each Category Changes the StoryNow, let's connect these categories directly to interpretation. Each type of missing data changes the story your analysis tells in a distinct way. Blanks mask your true sample size, which can inflate or deflate the denominators you rely on for rates and percentages. An unknown value introduces irreducible uncertainty because any imputation you perform requires strong, often untestable assumptions. We saw this in the PISA truancy study, where a wording change from skipping to missing school went undetected and completely reversed the post-pandemic trend line. Not applicable shifts your denominators and can invalidate subgroup comparisons entirely. Not recorded hides systematic data collection failures, like a survey form that was never administered. These individual consequences do not stay isolated; they cascade through your averages, your trends, your correlations, and, critically, your model performance. A complete case analysis in a clinical prediction model might look accurate, but it can mask selection bias if the missingness is related to patient severity. When you understand how each category changes the story, you can begin to diagnose the problem before it corrupts your conclusions. Next, we will move into spotting the difference and explore how data profiling helps you detect these issues early.
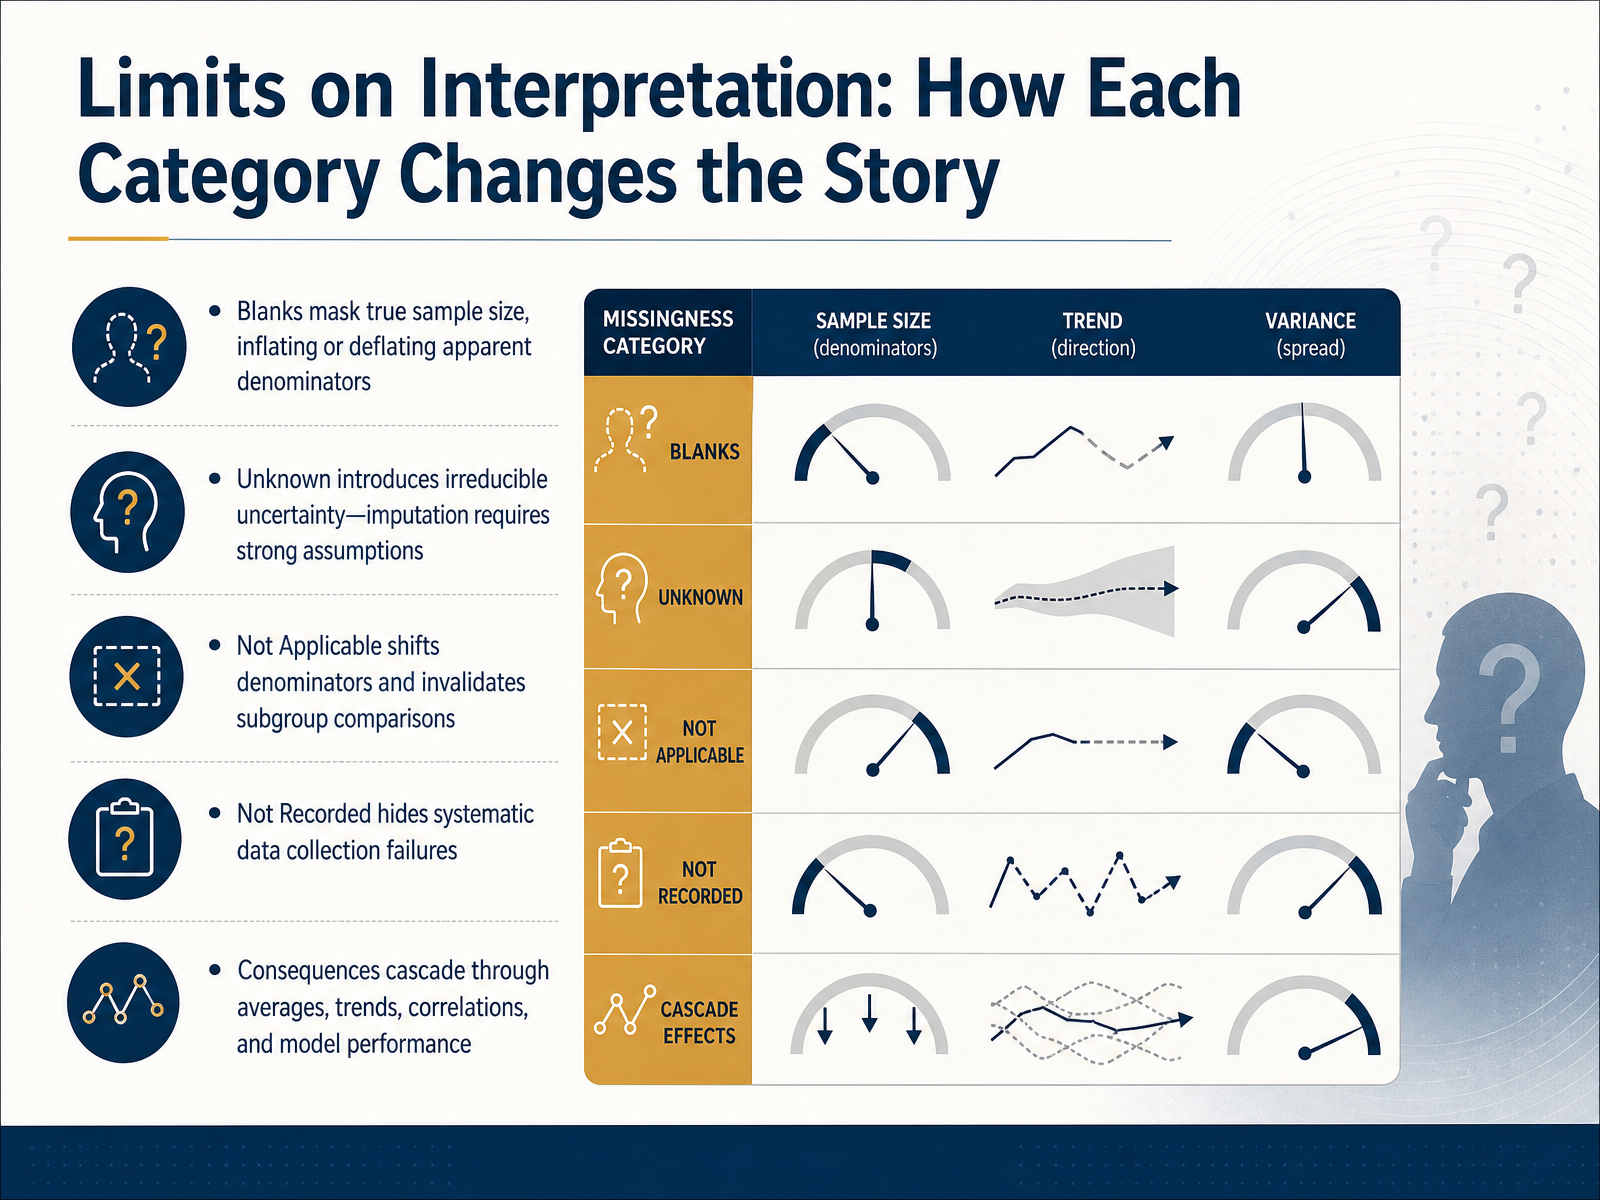 journals.plos.orglink.springer.comlink.springer.com+22 min
 - 08Spotting the Difference: From Data Profiling to DiagnosisNow we get to the detective work. This slide is about moving from a data profile to a real diagnosis. When you explore your dataset, don't just glance at it. Run a checklist and ask yourself, is this gap truly a blank? Is it an unknown value, or maybe it is simply not applicable? You need to catch the red flags early. Look for unexpected blank rates, like thirty percent missing in a required field. That is a sign of a bug or a serious process failure. Also, scan for inconsistent codes and mismatches between the metadata and the actual columns. Next, use your tools. Leverage the data dictionary and the case report form logic, especially skip patterns, to infer why data is absent. It tells you if a blank was intentional. Finally, profile the patterns. Run frequencies, build cross-tabulations, and use gap visualizations to see the structural shape of your missing data. This turns a simple count of nulls into actionable insight and sets us up to fix the root cause. Next, we will learn how to prevent these issues at the source in our section on building better data collection.
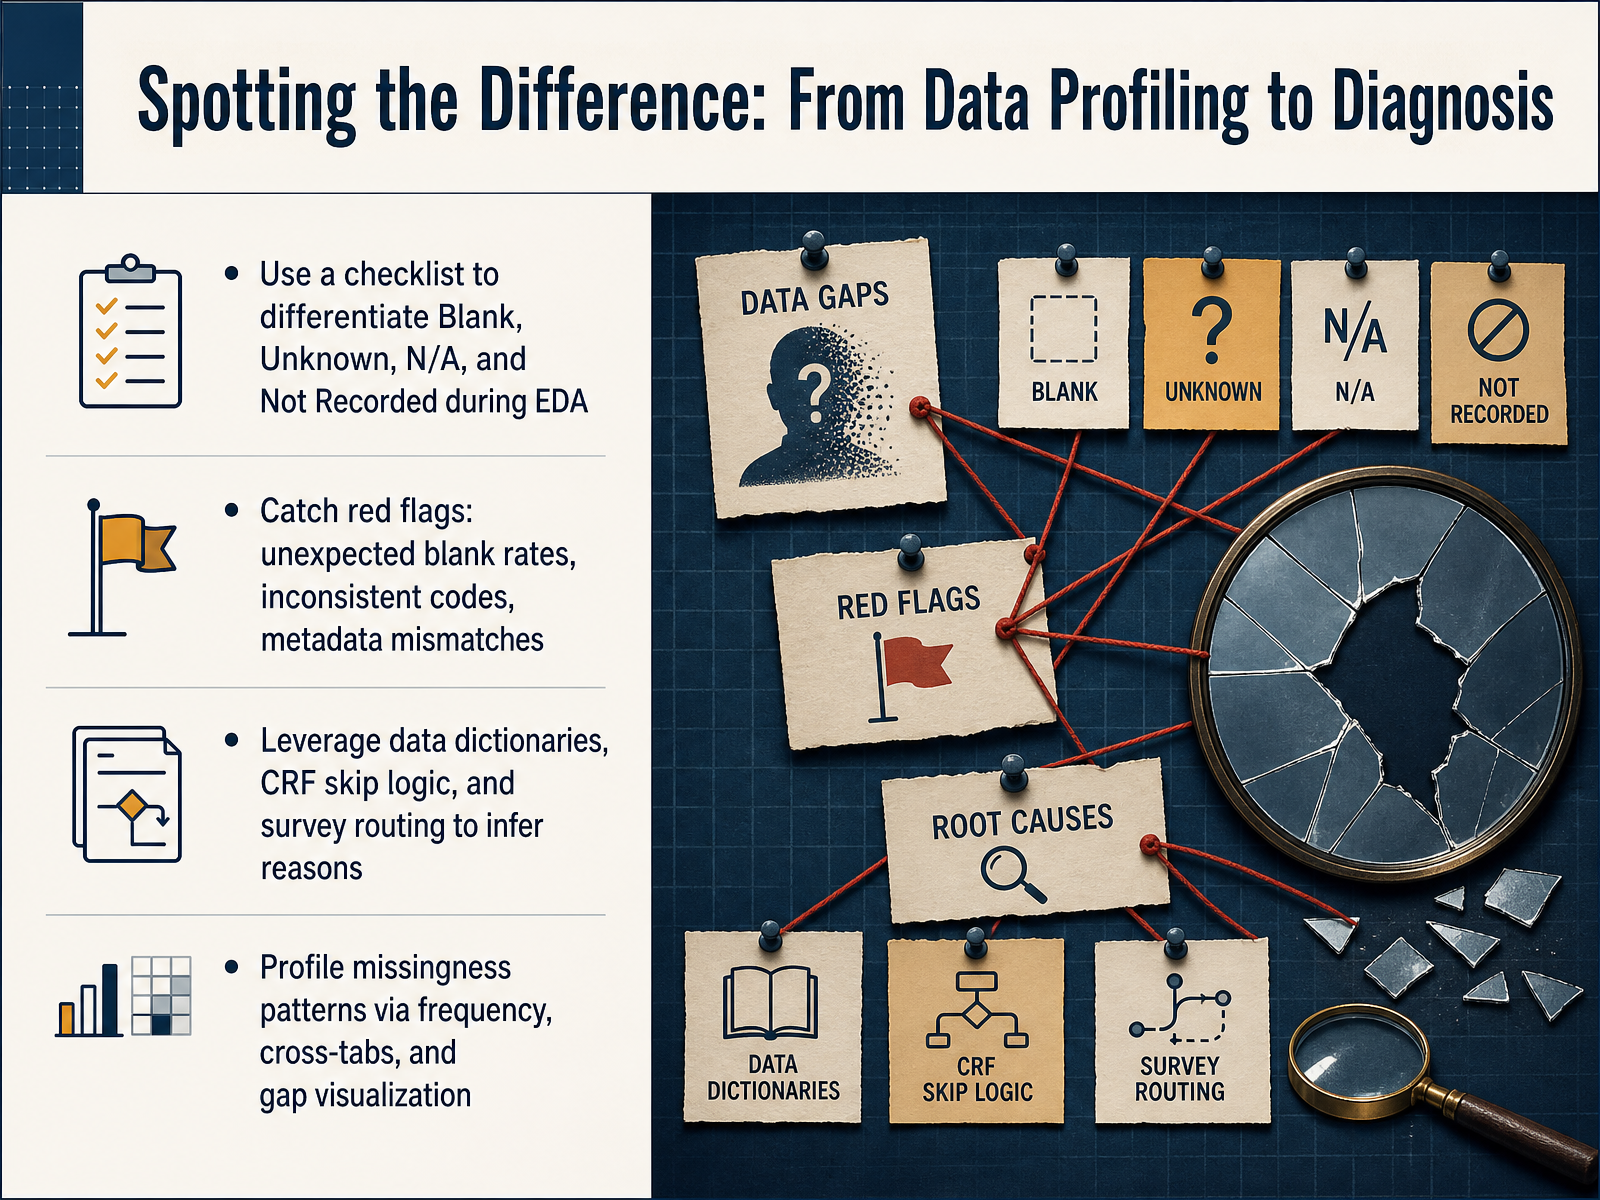 pds.nasa.govsqlperformance.comr4ds.hadley.nz+22 min
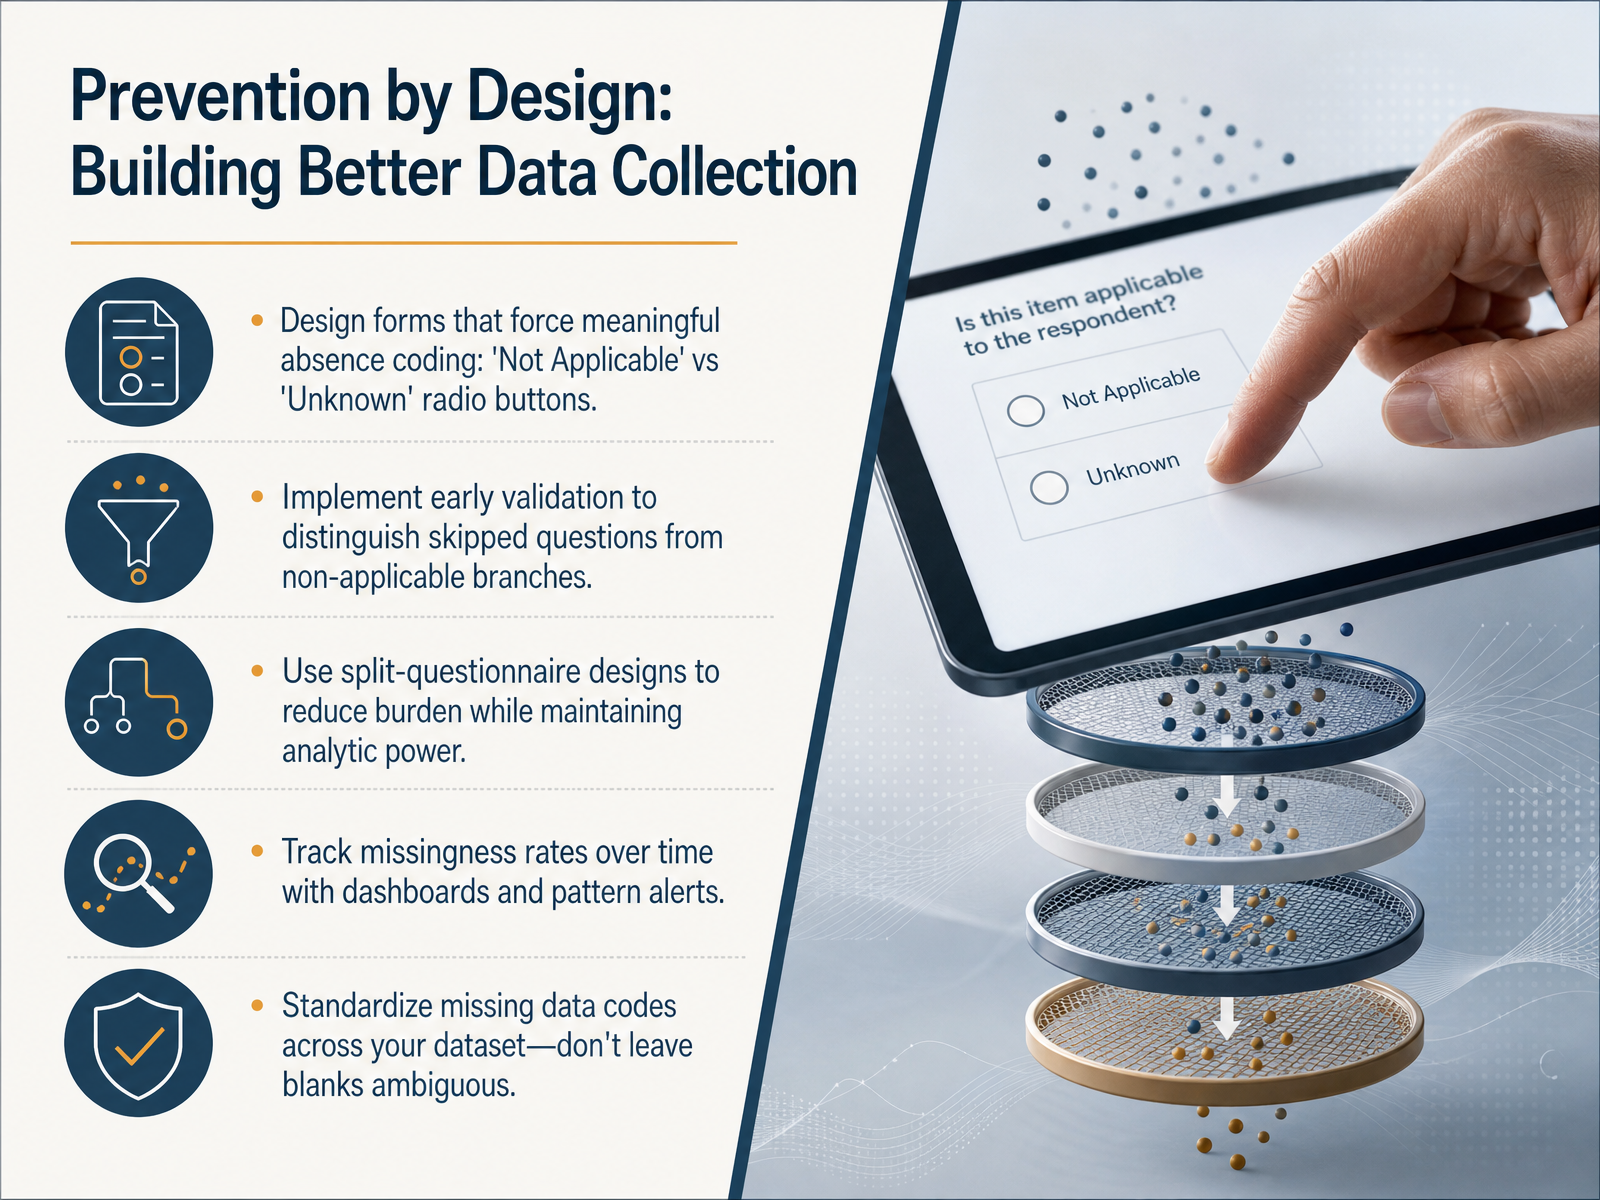
 - 09Prevention by Design: Building Better Data CollectionSo far we have explored how to recognize and diagnose different types of absence. Now let us turn our attention to the most empowering part: designing your data collection to prevent ambiguous missingness before it even starts. This is about building better forms and workflows that respect the crucial distinctions between 'not applicable,' 'unknown,' and 'not recorded.' First, design your input forms to force meaningful coding. Instead of a single optional text field, use distinct radio buttons that clearly separate 'Not Applicable' from 'Unknown.' This small design choice eliminates guesswork for both the respondent and the analyst. Second, implement early validation rules. If a question is skipped but should have been answered, flag it immediately. If a branch of the questionnaire hides a field, automatically code that as 'not applicable' rather than leaving an ambiguous blank. Third, consider using split-questionnaire designs. By giving different sets of questions to different subgroups, you can reduce the burden on any single participant while still capturing the full dataset across your sample. Just ensure you have a strong core module of linked variables to support accurate statistical imputation later. Fourth, track your missingness rates over time with live dashboards and pattern alerts. If a sensor, a question, or a data entry point starts producing more blanks than expected, you want to know right away and fix the root cause. Finally, standardize your missing data codes across the entire dataset. Decide on a single, documented scheme for 'not asked,' 'skipped,' 'not applicable,' and 'unknown,' and use those codes consistently in every table. Never leave blanks ambiguous. Next, we will move from design to communication and explore how to report these limits with transparency.
 sqlperformance.comr4ds.hadley.nzkgryczan.github.io+22 min
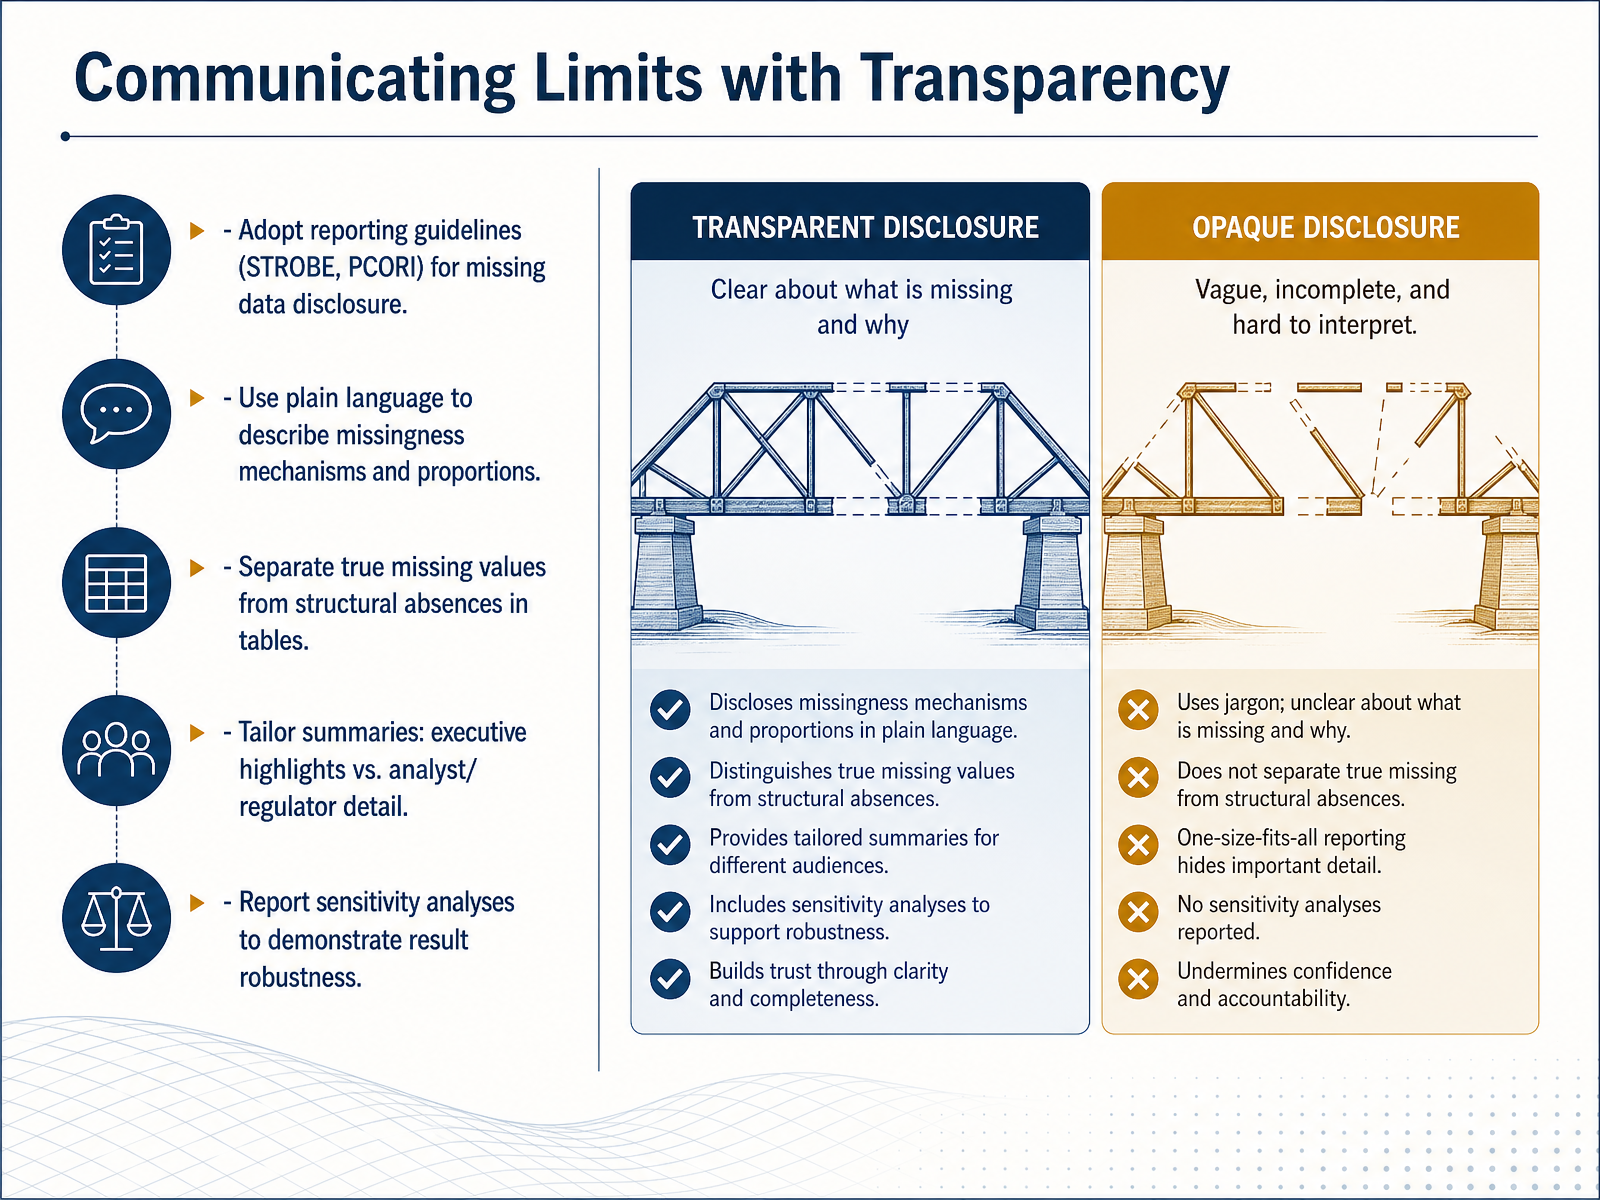
 - 10Communicating Limits with TransparencyLet's move from identifying missing data to communicating it clearly. When we report our findings, transparency is everything. The goal is to show exactly where the gaps are so others can trust and correctly interpret our work. First, we should adopt established reporting guidelines. Frameworks like STROBE for observational studies or the PCORI standards provide checklists to ensure we disclose our missing data handling. Use plain, direct language to describe the amount of missingness and the likely reasons behind it. In our tables and figures, we must visually separate true missing values from structural absences, like a question that was intentionally skipped. When writing up results, tailor the level of detail to your audience. Executives need high-level highlights, while analysts and regulators require the full methodological specifics. Finally, always report your sensitivity analyses. This means showing what happens to your conclusions under different assumptions about the missing data. It proves your findings are robust and not simply an artifact of how you filled in the blanks. Next, we'll look at the practical strategies for actually handling that missing data during analysis.
 journals.plos.orglink.springer.comlink.springer.com+22 min
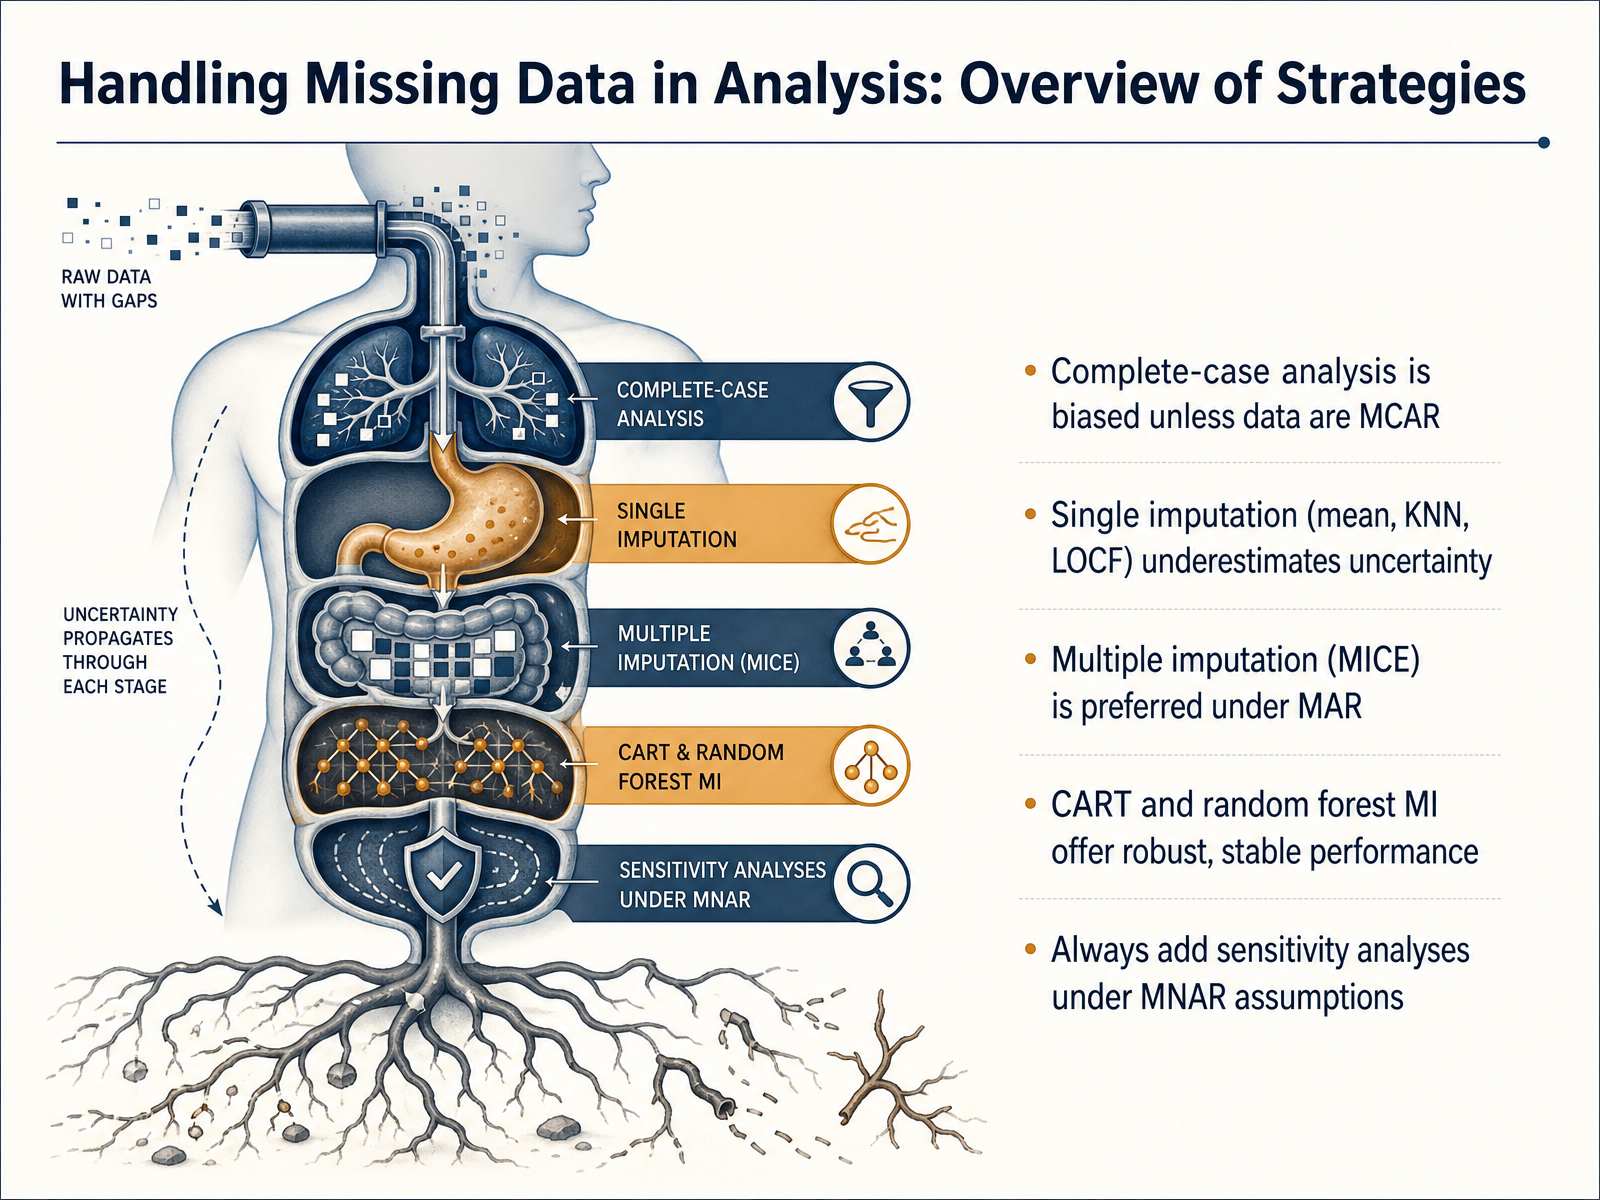
 - 11Handling Missing Data in Analysis: Overview of StrategiesLet’s translate what we have learned into a practical overview of strategies for handling missing data. Not all approaches are equal, and your choice directly shapes your conclusions. Using only complete cases is simple, but it is biased unless the data are missing completely at random. Single imputation methods, like filling with the mean or using last observation carried forward, make the dataset look full but they underestimate uncertainty. Multiple imputation, especially with chained equations, is the preferred approach when data are missing at random, because it properly accounts for variability. For robust and stable performance, tree-based methods like CART and random forest imputation are strong alternatives. A critical best practice is to always add sensitivity analyses under missing-not-at-random assumptions. This means running your models under worst-case or different plausible scenarios to check whether your core findings hold up. Over the years, studies have repeatedly shown that skipping sensitivity checks can lead to overconfident clinical or policy decisions. So, when you report your work, be transparent about how much data was missing, why it was missing, and which method you chose and why. Let’s put these concepts into practice with an exercise where you will classify missingness in a realistic dataset.
 stefvanbuuren.namedoi.orgdoi.org+22 min
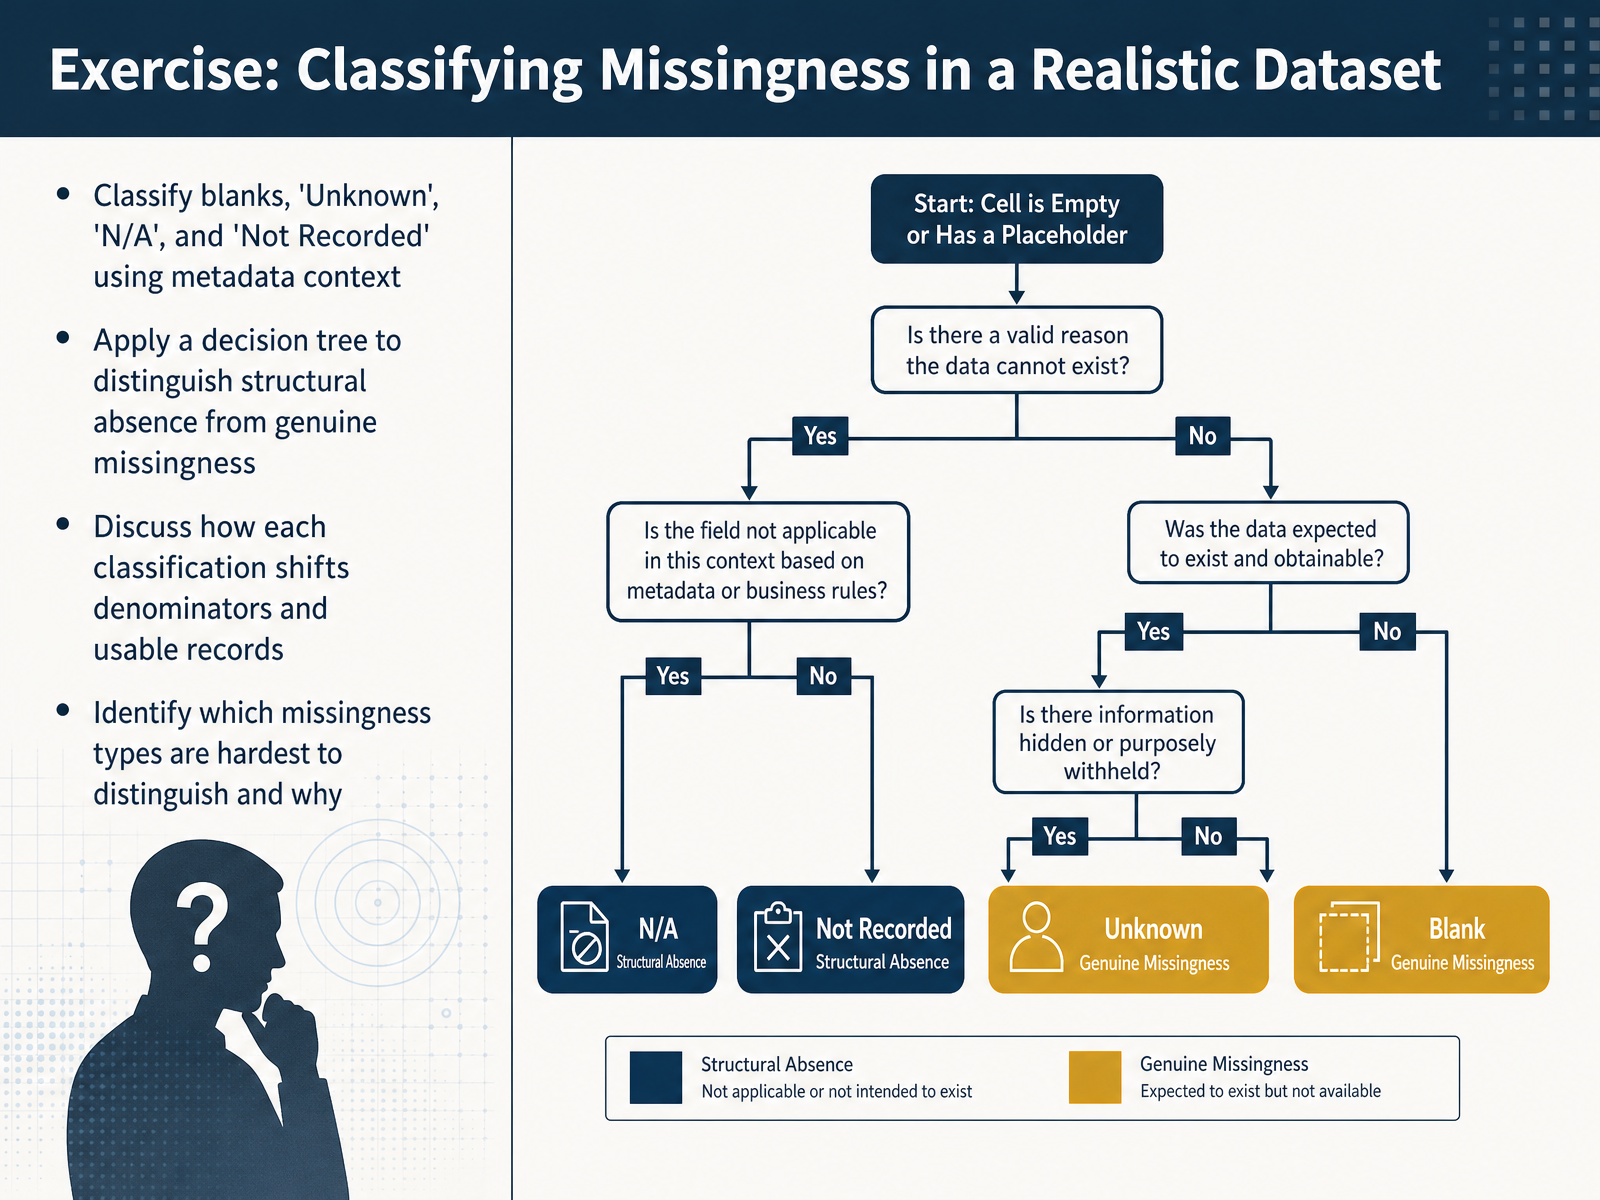
 - 12Exercise: Classifying Missingness in a Realistic DatasetNow we turn to a practical exercise. Here you have a realistic dataset that contains blanks, Unknown entries, N slash A codes, and fields marked Not Recorded. Your first task is to classify each one using its metadata, such as the data dictionary or survey skip logic. Next, apply the decision tree we discussed. Walk through each absence and decide: is this structural missingness, where the question genuinely does not apply, or is it genuine missingness where an answer should exist but does not? After classifying, pause and recalculate a simple metric, like a percentage of completed records. Notice how each classification shifts your denominator and changes the number of usable rows. A structural missing value is removed from the universe, while an unknown entry stays in the denominator but adds no information. Finally, identify which types are hardest to tell apart in your dataset. For many learners, it is the boundary between Not Recorded and genuine unknown, because both lack a value but only one signals an unanswered required field. This exercise builds the habit of interrogating absence instead of ignoring it. In our final slide, we will connect these skills to your own reporting workflows.
 pds.nasa.govnemsis.orgcdisc.org+22 min
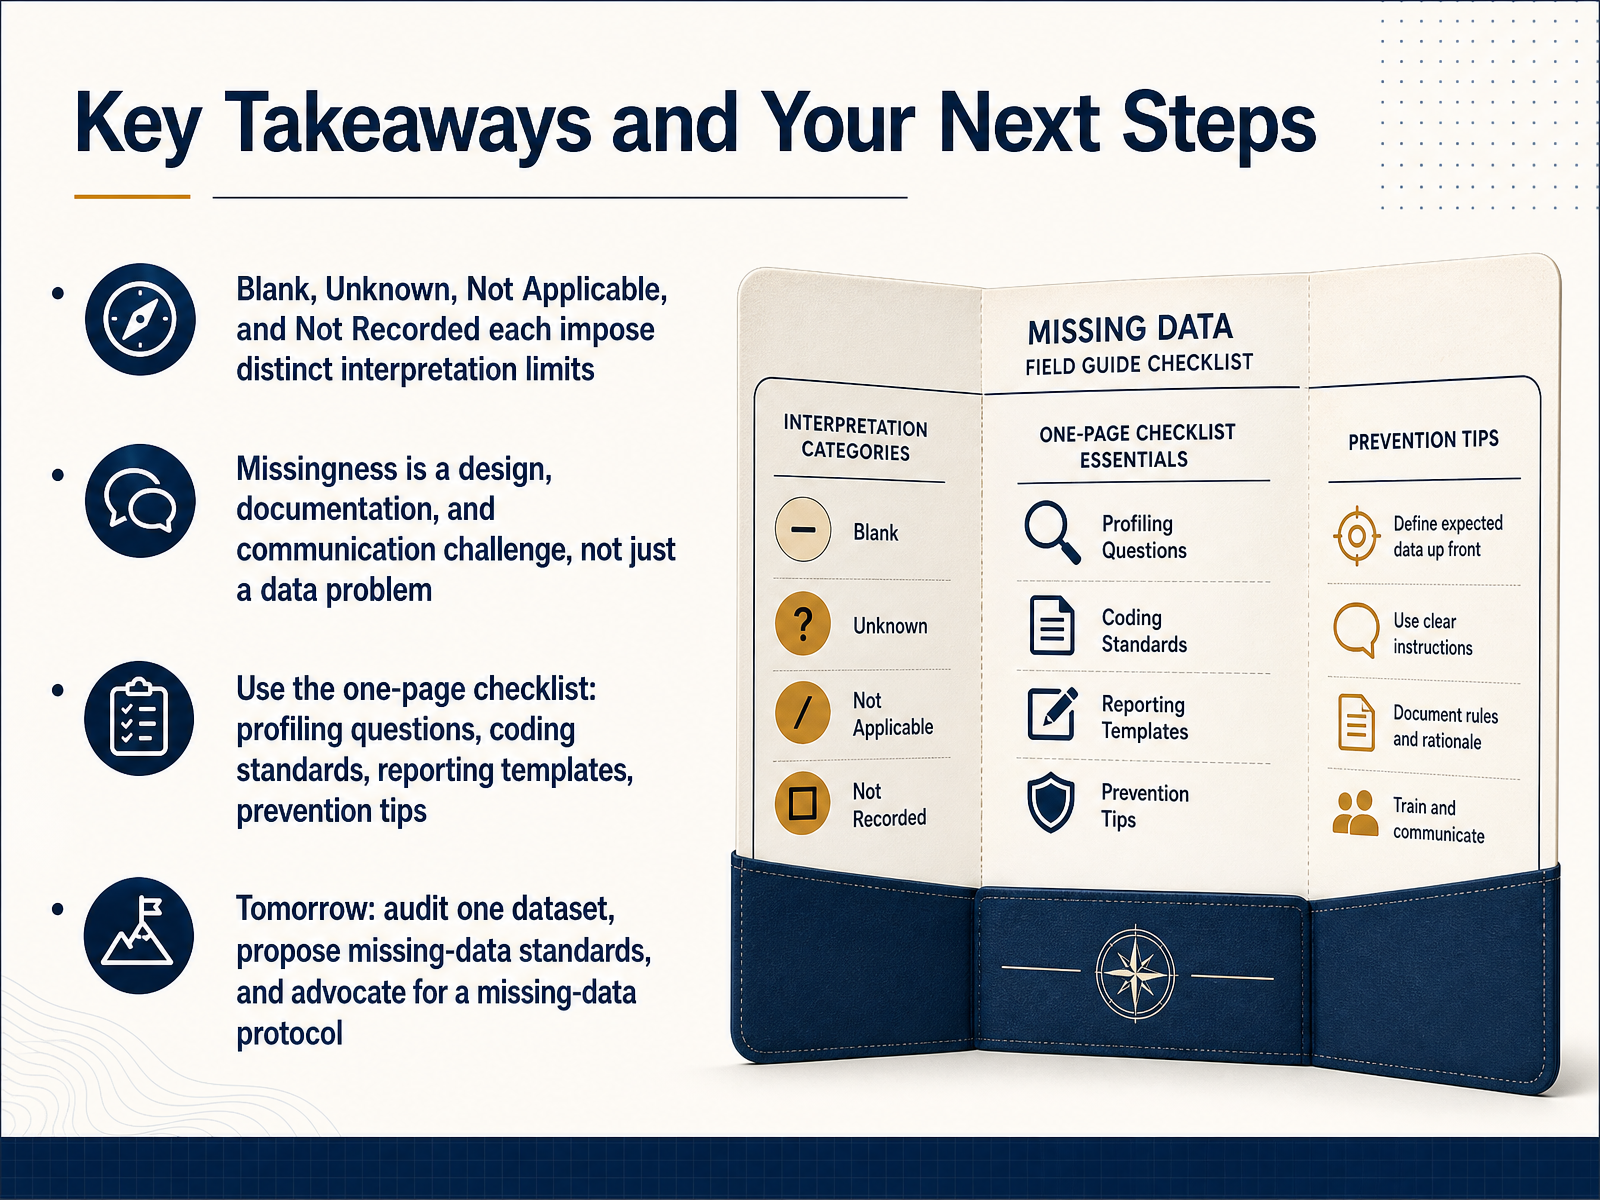
 - 13Key Takeaways and Your Next StepsLet's pull together the most important ideas from this course. First, remember that Blank, Unknown, Not Applicable, and Not Recorded are not interchangeable labels. Each one places a distinct limit on how you can interpret your data, so choosing the right code matters every single time. Second, missingness is not just a data problem. It is a design challenge, a documentation challenge, and a communication challenge. How you plan for missing values, how you code them, and how you explain them to others are all part of the solution. To help you put this into practice, use the one-page checklist we discussed. It includes profiling questions, coding standards, reporting templates, and prevention tips. Finally, here is your concrete next step for tomorrow. Pick one real dataset you work with. Audit its missing values. Propose a set of missing-data standards for it. Then advocate for a missing-data protocol that your team can follow. By doing this, you shift from being a data consumer to a data steward. You are now equipped to make missing data transparent, interpretable, and trustworthy. Thank you for your attention, and I look forward to hearing about the improvements you drive in your own work.
 pds.nasa.govnemsis.orgcdisc.org+22 min
Take the deck with you
Download this course as a file — free, no sign-up needed.
- PDF handoutEvery slide page, ready to print or share.14 pages · 4.0 MBDownload
- Narrated PowerPointThe deck that presents itself — every slide carries the digital human's narration video.14 pages · 15.0 MBDownload
- PowerPoint slidesThe full deck as a .pptx — open it in PowerPoint, Keynote, or Google Slides.14 pages · 3.9 MBDownload
Free to use in your own training — please keep the PersonWise credit page at the end.
Have your own deck? Turn it into a course
Sources consulted
Web sources consulted while building this course.
- Imputation of incomplete ordinal and nominal data by predictive mean matching — stefvanbuuren.name
- Missing Categorical Data in Sociological Surveys: An Experimental Evaluation of Imputation Techniques — doi.org
- Informative Missingness in Nominal Data: A Graph-Theoretic Approach to Revealing Hidden Structure — doi.org
- Hierarchical imputation of categorical variables in the presence of systematically and sporadically missing data — doi.org
- Missing Data in OHCA Registries: How Imputation Methods Affect Research Conclusions—Paper I — mdpi.com
- Mission imputable: Effects of missing data processing on infectious disease detection and prognosis | PLOS One — journals.plos.org
- Are we reporting well enough? A systematic survey of missing data in patient-reported outcomes from non-small cell lung cancer randomized trials | Health and Quality of Life Outcomes | Springer Nature Link — link.springer.com
- Evidence of unreliable data and poor data provenance in clinical prediction model research and clinical practice | BMC Medicine | Springer Nature Link — link.springer.com
- Missing data handling in pediatric appendectomy research: current practices and National Surgical Quality Improvement Program (NSQIP) analysis | Surgical Endoscopy | Springer Nature Link — link.springer.com
- Missing Data in OHCA Registries: How Multiple Imputation Methods Affect Research Conclusions—Paper II — mdpi.com
- NEMSIS V3 Guidance for the use of Not — nemsis.org
- Chapter 17. Usage of N/A, UNK and NULL — pds.nasa.gov
- Slide 1 — cdisc.org
- Codesystem-data-absent-reason - FHIR v4.3.0 — hl7.org
- Missing and Incomplete Data Reporting Guidelines: Overview — oregon.gov
- Bad Habits: Avoiding NULL in SQL Server — sqlperformance.com
- 18 Missing values – R for Data Science (2e) — r4ds.hadley.nz
- The Hidden Missing: What Your Data Isn’t Telling You – Numbers Around Us — kgryczan.github.io
- Stop using NULLs. It's a bad practice - by Daniel Moka — craftbettersoftware.com
- Working with missing data — pandas 3.0.3 documentation — pandas.pydata.org