Data Privacy KPI Measurement and Interpretation
Begin
14 pages · ~28 min
Data Privacy KPI Measurement and Interpretation
This training teaches professionals how to measure and interpret data privacy KPIs, enabling them to track compliance performance and drive continuous improvement.
What you’ll learn
- 01Data Privacy KPIs: Measurement and InterpretationWelcome. If you lead privacy operations or support governance analysis, you know the pressure to report metrics that hold up under scrutiny. This session is about building defensible privacy KPIs, not just collecting numbers for ad hoc reporting. We’ll cover how to design measures that align with program goals, what data sources actually support them, and how to interpret trends in a way leadership can act on. Here’s the context: according to Cisco’s benchmark study, 93 percent of organizations now track at least one privacy metric, and only 14 percent use five or more. That gap tells you most teams are still early in their measurement maturity. Our aim today is to move you beyond basic activity counts toward KPIs that demonstrate program effectiveness, support risk decisions, and communicate value across the organization. You’ll leave with a practical framework you can apply immediately. Let’s start with why privacy metrics matter in the first place.fpf.orggrip.globalrelay.comiapp.org+21 min
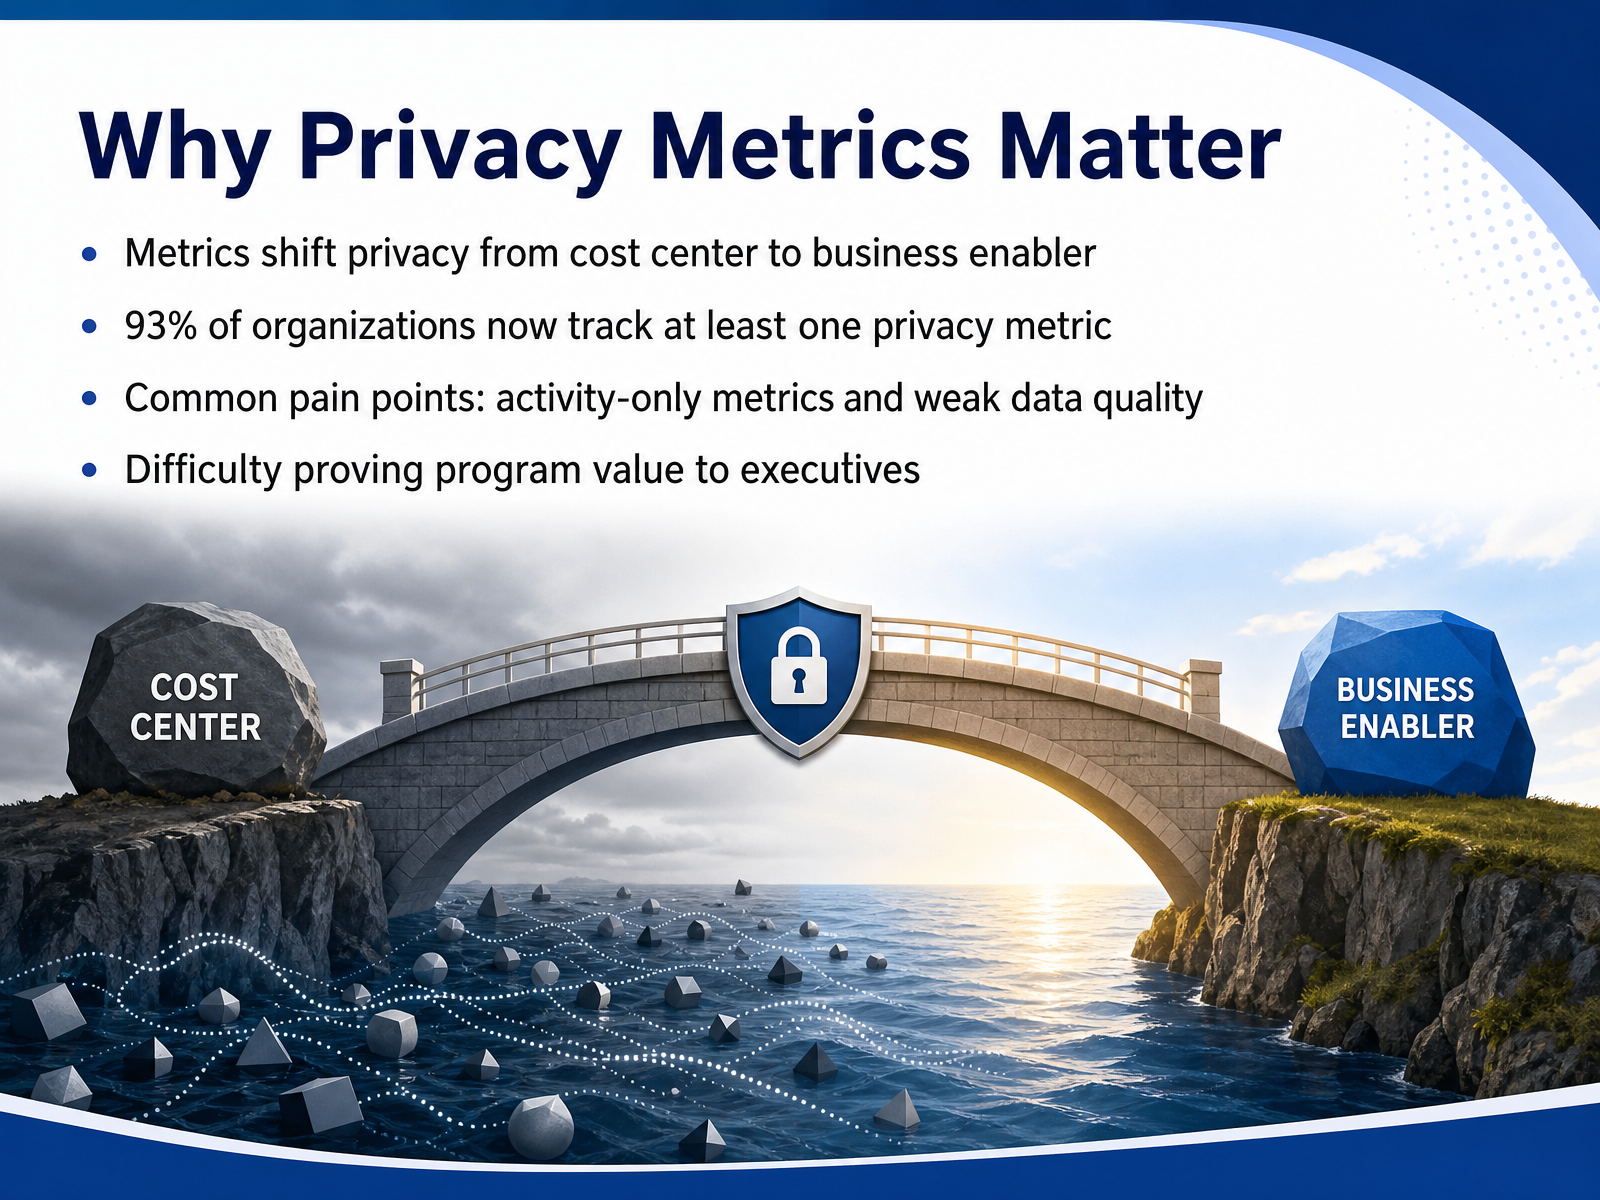
- 02Why Privacy Metrics MatterLet's start with the fundamentals. Why do privacy metrics matter? Because they shift the conversation. When chosen well, metrics transform privacy from a perceived cost center into a measurable business enabler. Industry data underscores this shift. According to Cisco, ninety-three percent of organizations now track at least one privacy metric. That's near-universal adoption. Yet, the reality is that many programs still stumble on two common pain points. First, an over-reliance on activity-only metrics, like the raw number of assessments completed or requests processed. Second, weak data quality, where the inputs themselves cannot support credible analysis. The consequence is clear. Privacy leaders struggle to prove program value to executives in financial or strategic terms. Operational metrics are necessary, but they do not articulate business impact. This gap leaves you vulnerable to budget constraints and frames privacy as an obligation rather than an asset. Your goal is to build a metrics program where the numbers demonstrate value. Something we will address throughout this course. As we move forward, let’s ground ourselves in our core definitions of metrics, KPIs, and KRIs.
 fpf.orggrip.globalrelay.comiapp.org+22 min
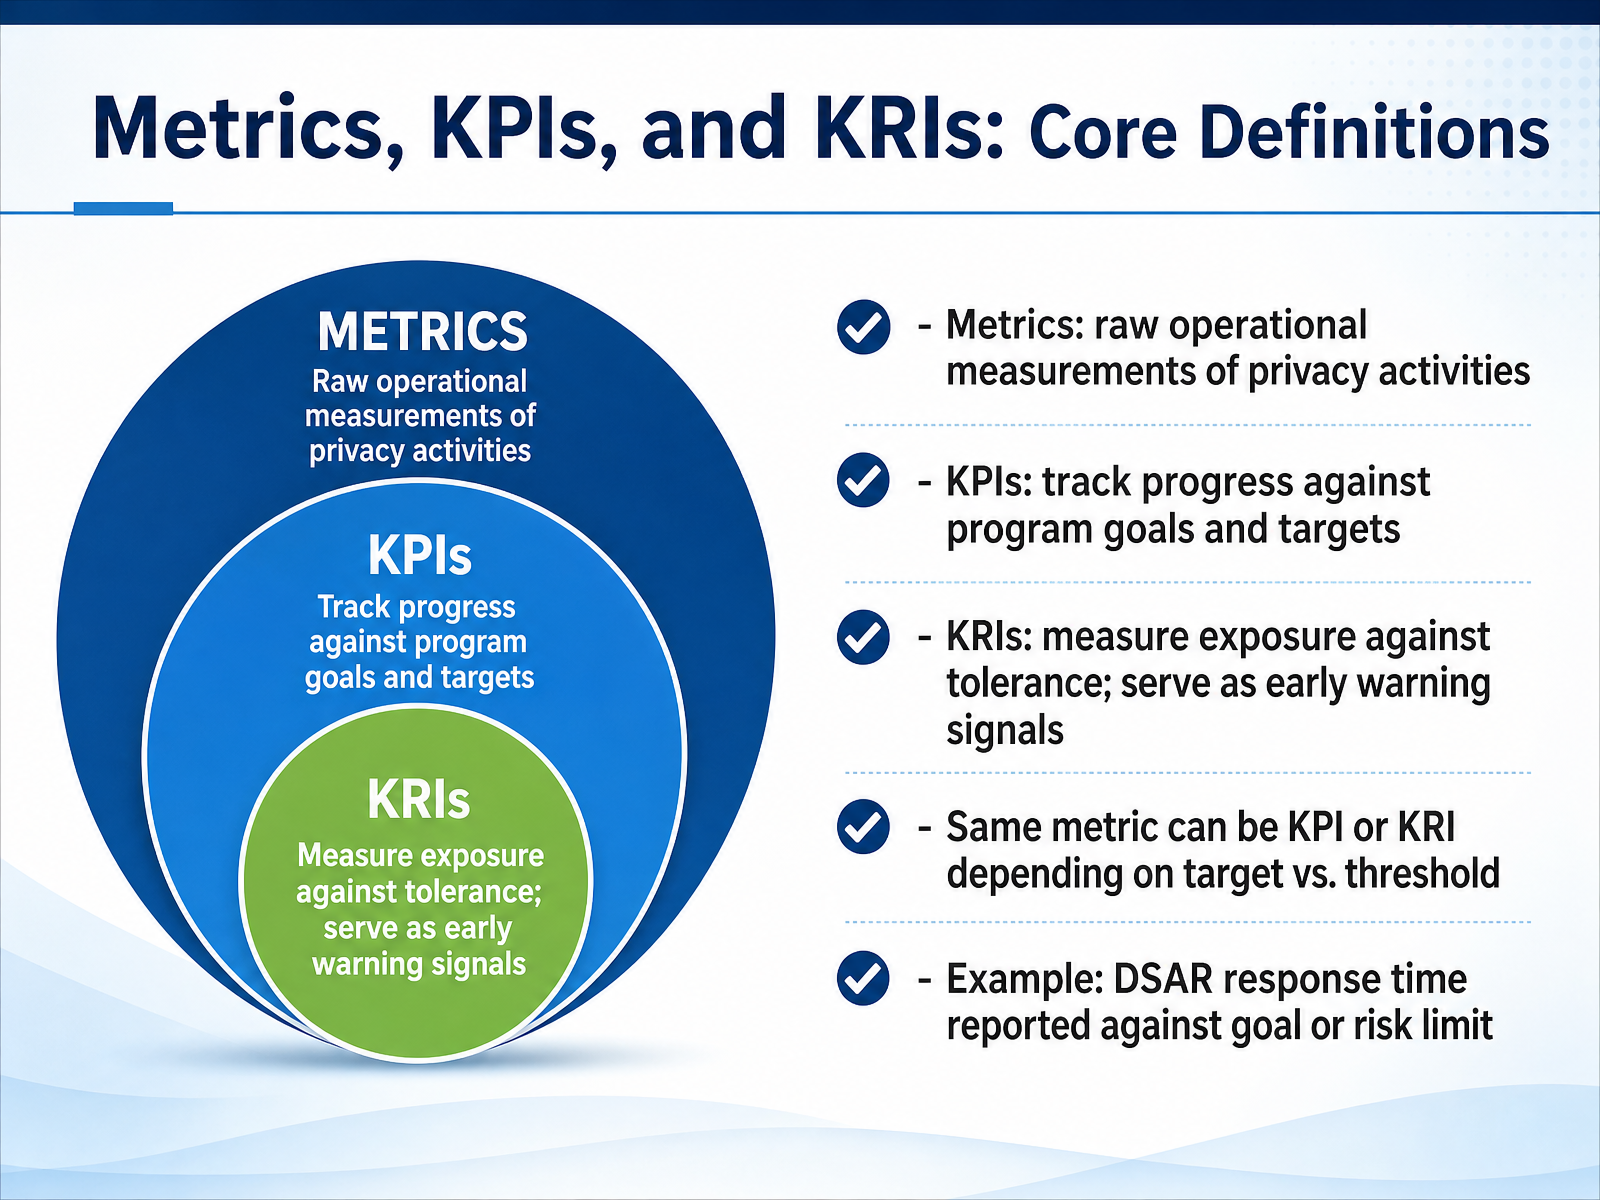
 - 03Metrics, KPIs, and KRIs: Core DefinitionsNow let's anchor ourselves in the vocabulary we'll use throughout this course. Metrics, KPIs, and KRIs often get used interchangeably, but they answer fundamentally different questions. A metric is a raw operational measurement, like the number of DSARs received this week. A KPI, or Key Performance Indicator, tracks progress against a program goal or target. It answers the question: are we meeting our plan? A KRI, or Key Risk Indicator, measures exposure against a documented tolerance, and serves as an early warning signal for a breach or regulator inquiry. Critically, the same data can serve either role. Take DSAR response time. If you report it against a ninety-percent on-time service target, it's a KPI. But if you report it against a risk threshold that says falling below ninety-five percent triggers an escalation memo, it's a KRI. The number is identical. What changes is the reference point: a goal you're aiming for, versus a limit you must not cross. This distinction is everything, because it determines whether your dashboard shows operational progress or strategic risk. Bearing this in mind, let's move on to differentiate between the time horizons of leading and lagging indicators.
 bscdesigner.comcpaexamsmastery.comriskpublishing.com+21 min
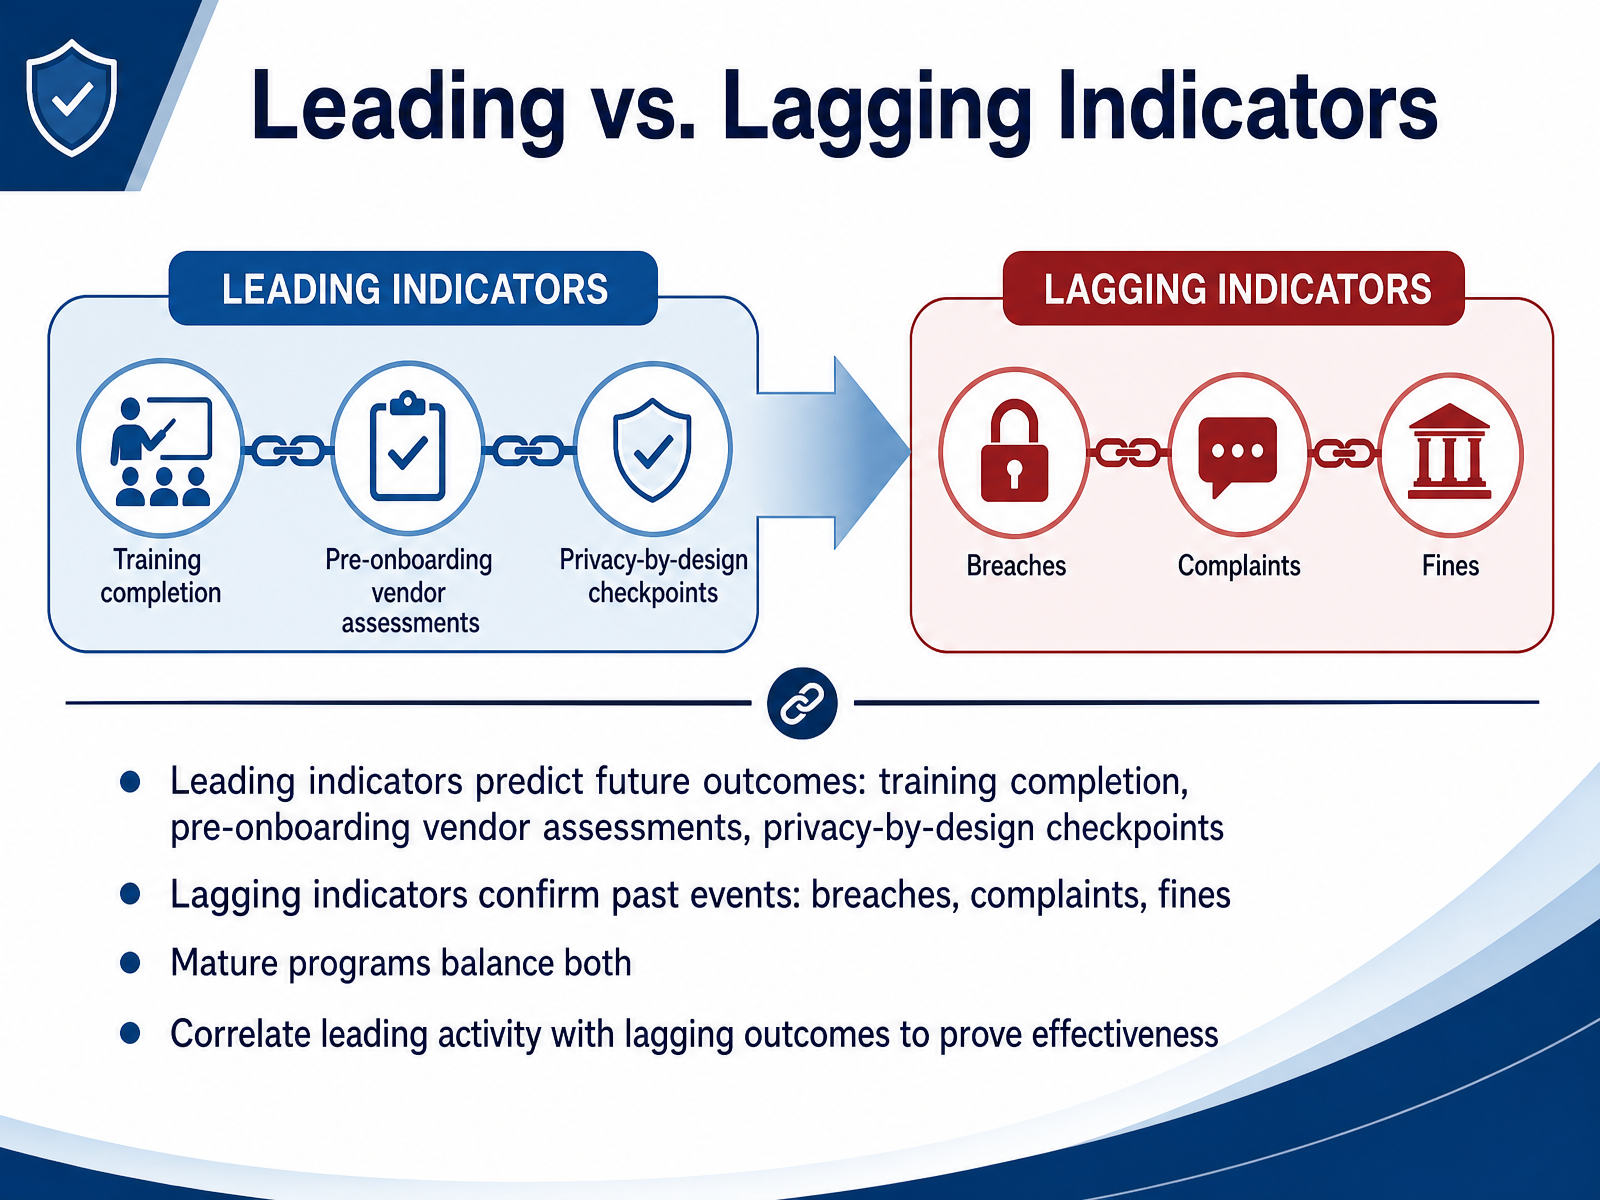
 - 04Leading vs. Lagging IndicatorsNow, let’s distinguish between the two indicator types you’ll rely on. Leading indicators predict future outcomes. Think training completion rates, pre-onboarding vendor assessments, or privacy-by-design checkpoints in development. Lagging indicators confirm what already happened. Breaches, complaints, and fines. Here’s the operational reality: lagging indicators are easy to collect and benchmark, but they only tell you what went wrong. Leading indicators move ahead of the breach or regulator inquiry. A mature program deliberately balances both. And the critical step is correlation. Track your leading activity against lagging outcomes to prove effectiveness. If a new-hire training module rolls out in March, and human-error incidents drop the following quarter, that correlation is your evidence the training works. Completion rates alone prove attendance, not impact. So tie those leading signals to the outcomes they’re meant to prevent. That linkage is what turns activity data into program justification. Next, we’ll map these indicators to specific privacy metric domains.
 fpf.orggrip.globalrelay.comiapp.org+22 min
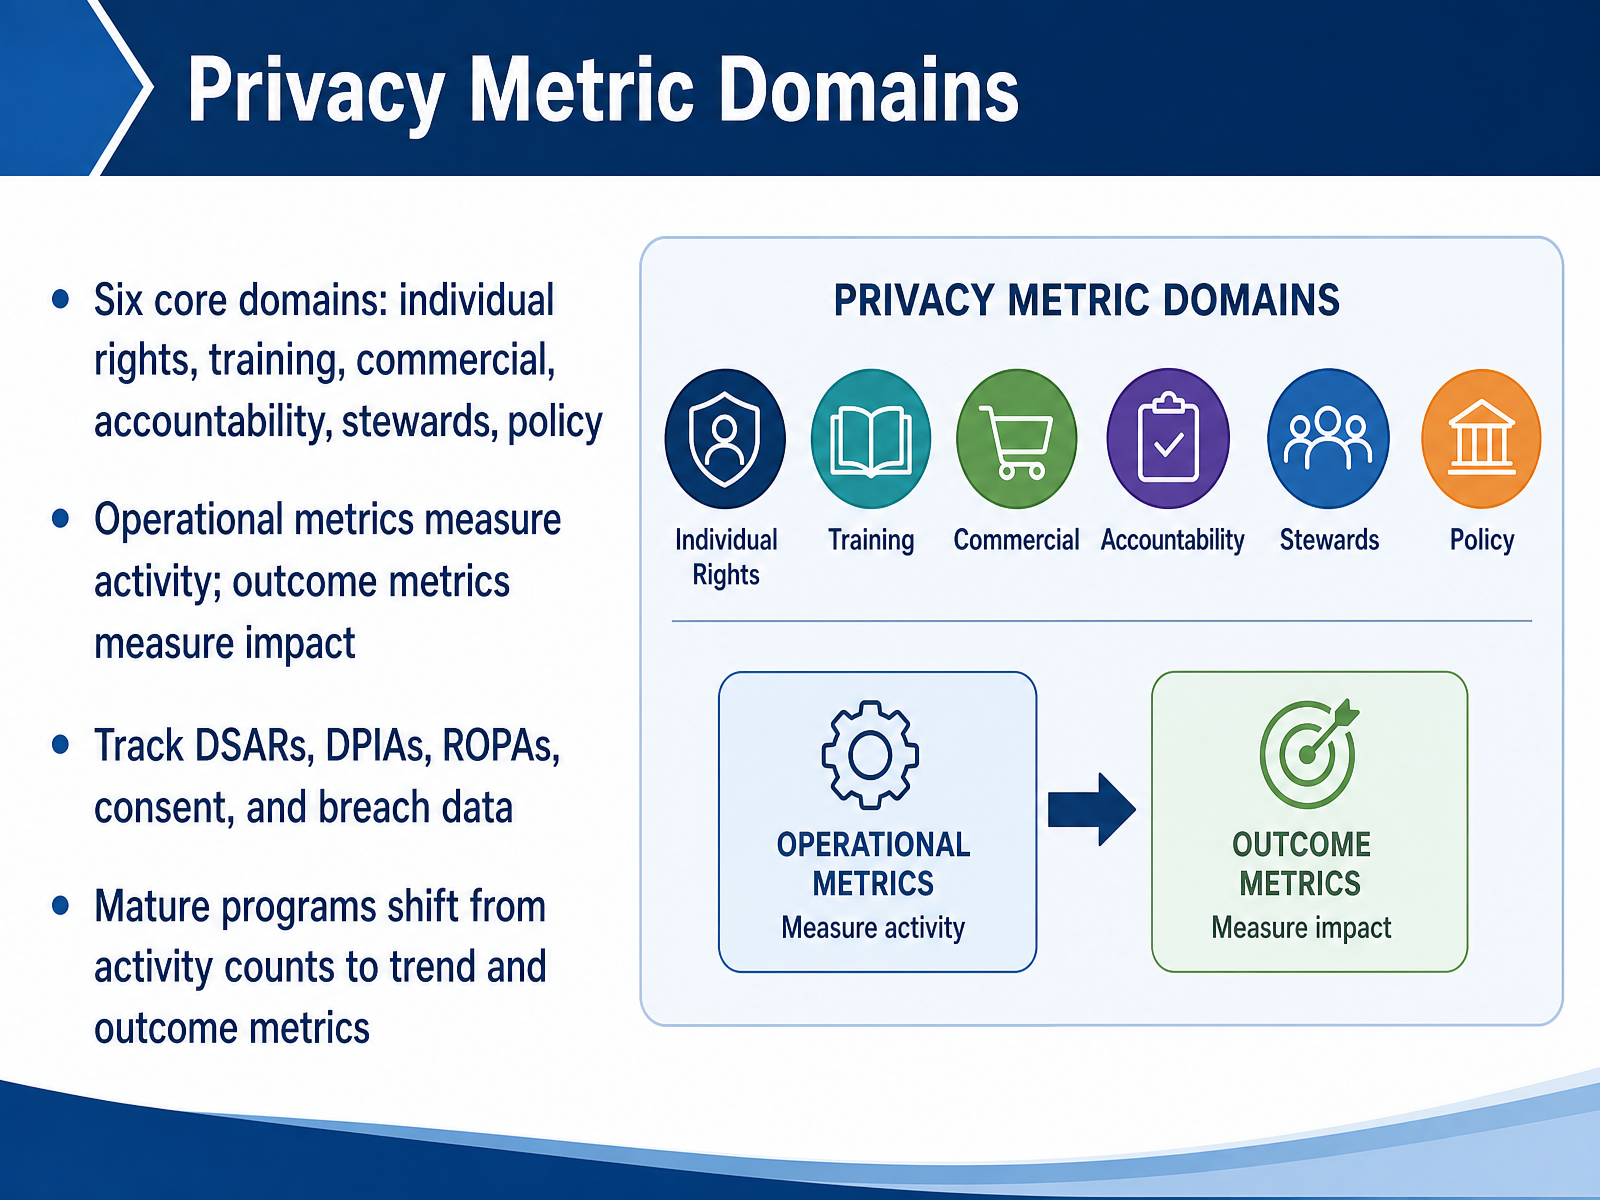
 - 05Privacy Metric DomainsLet’s move into the six domains that structure most privacy metric programs. These are individual rights, training, commercial, accountability, stewards, and policy. Each domain answers a distinct question about program health. And notice the progression across them. The first distinction you need to internalize is between operational and outcome metrics. Operational metrics count activity: how many DSARs were closed, how many DPIAs were completed, how many employees finished training. They measure throughput. Outcome metrics measure impact: what those activities changed. For example, not just completion of training, but the observed reduction in privacy incidents. In practice, mature programs start with the counts, using them to establish baselines. But the leadership conversation shifts when you move from volumes to trends, and from trends to demonstrated outcomes. That shift is what separates a program tracking activity from a program proving its value. Now let’s turn to how you select the KPIs that will actually matter to your stakeholders.
 fpf.orggrip.globalrelay.comiapp.org+21 min
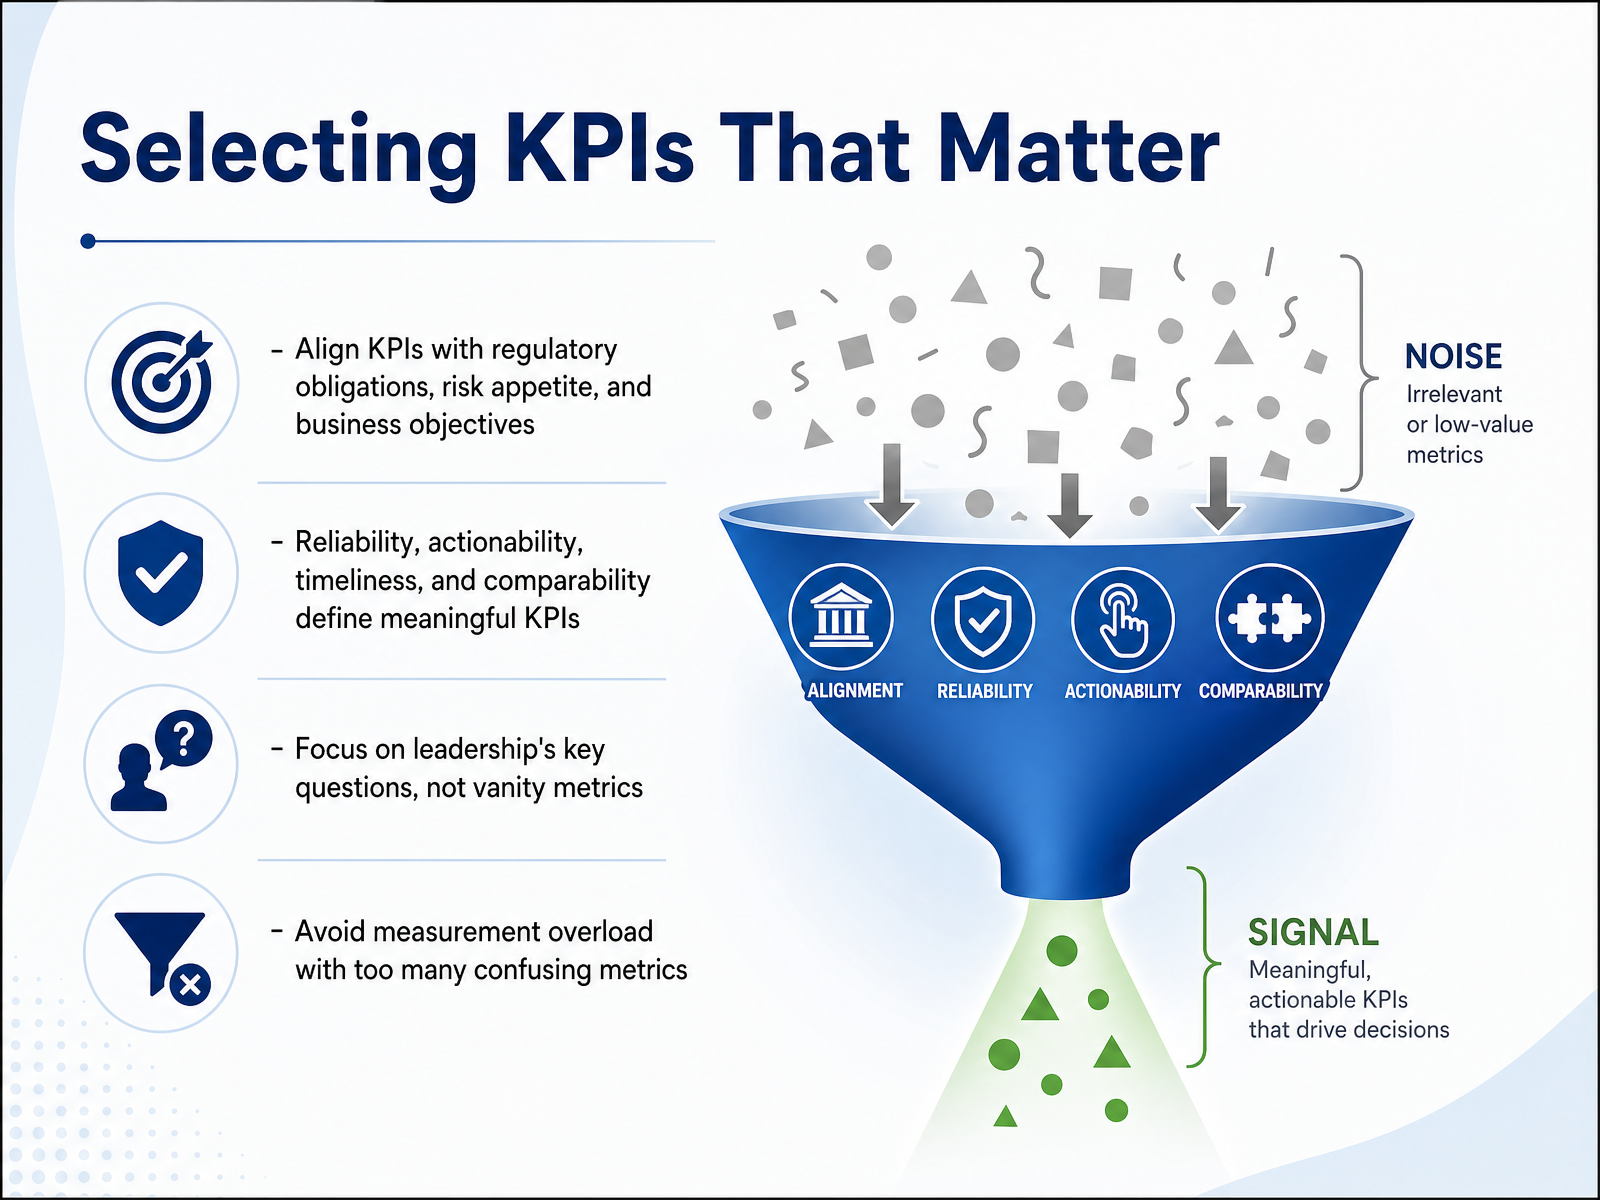
 - 06Selecting KPIs That MatterNow let's turn to selecting KPIs that matter. The core discipline is alignment. Every metric you put on the dashboard should trace directly to a regulatory obligation, a documented risk tolerance, or a stated business objective. If it doesn't, it's likely vanity. A meaningful KPI is reliable, actionable, timely, and comparable. Reliability means sound data inputs. Actionability means it drives a decision. Timeliness means you can intervene before the risk materializes, which is what separates a leading indicator from a lagging one. And comparability lets you benchmark against your own targets or industry peers. Before you finalize the set, ask what key questions leadership needs answered. If a metric doesn't speak to those questions, it's noise. Finally, resist measurement overload. Most mature programs run dozens of indicators, but only a focused subset, roughly eight to twelve, should reach the executive risk committee. Too many metrics simply dilute attention. Keep the set tight, and every number on the board earns its place. This framework sets the criteria; next, we'll examine the data sources and collection methods that feed these KPIs.
 fpf.orggrip.globalrelay.comiapp.org+21 min
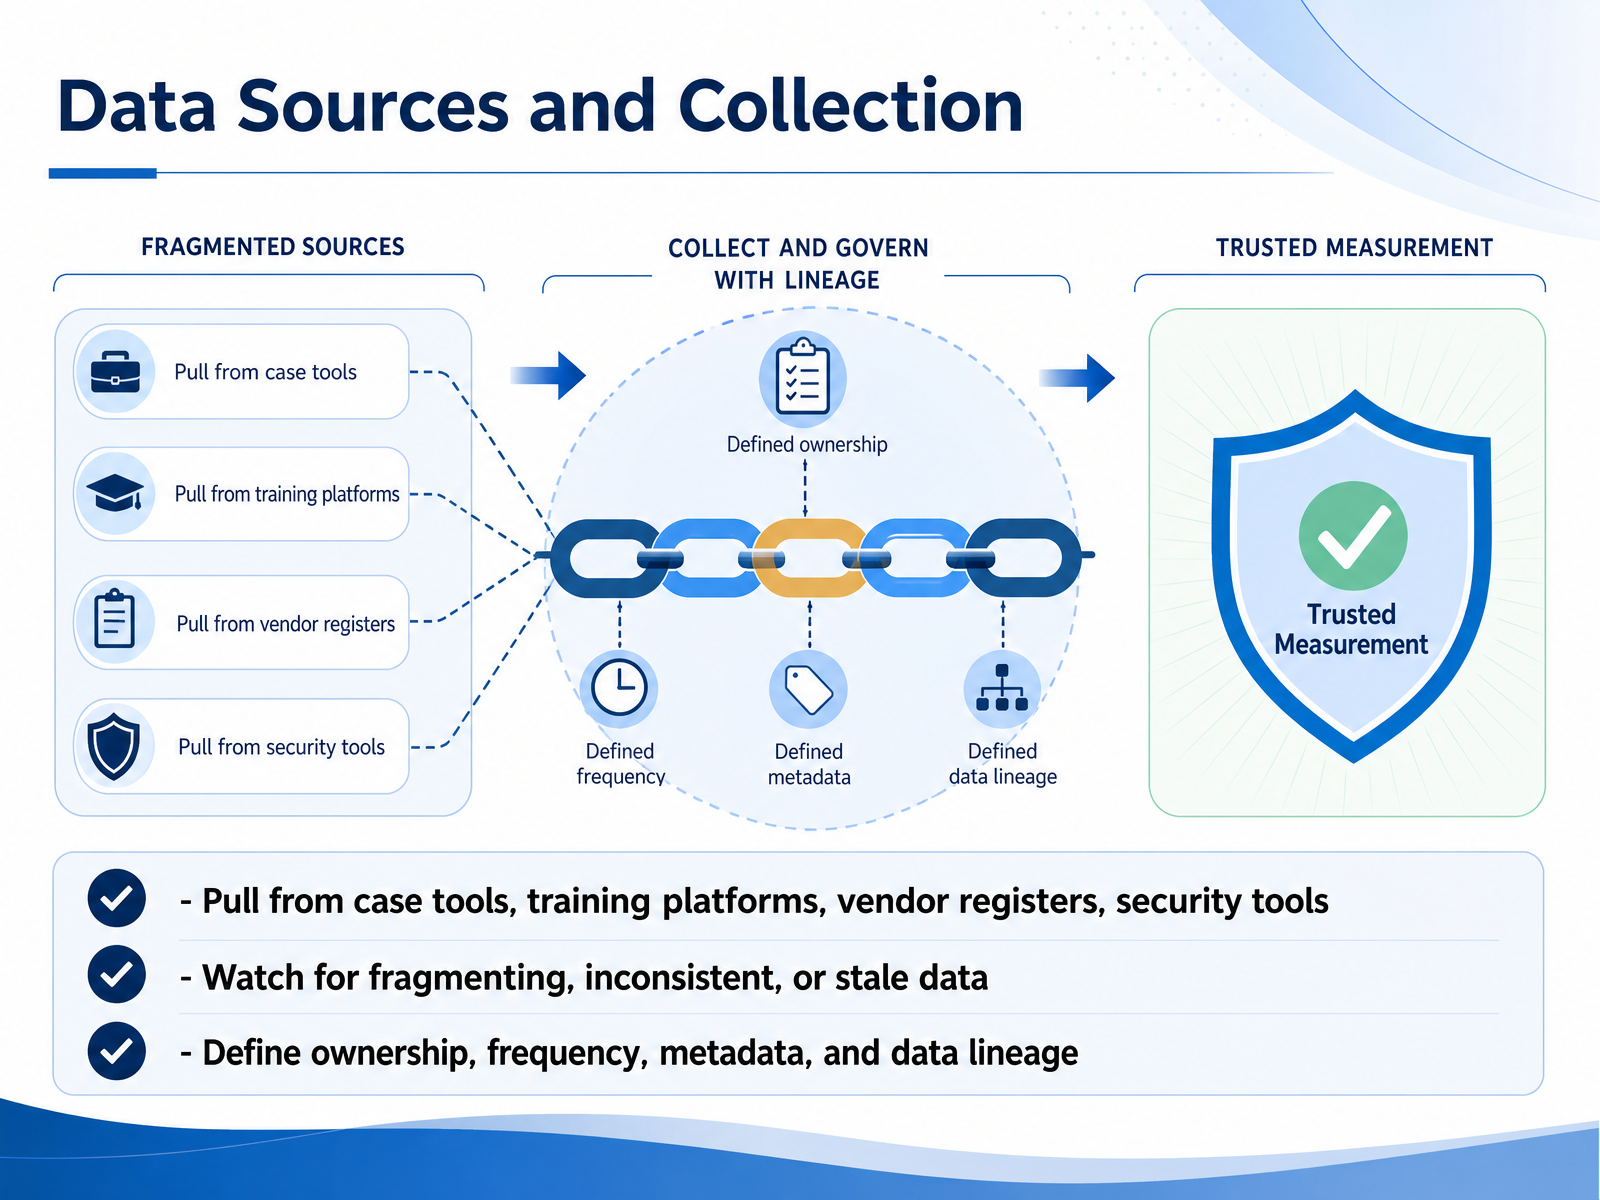
 - 07Data Sources and CollectionNow let’s look at where these KPIs come from. Your data sources need to span case management, training platforms, vendor registers, and security tooling. But pulling data is only half the problem. The real challenge is fragmentation. When each system defines a field differently, or updates on its own schedule, your metrics will quietly diverge from operational reality. Stale data is worse than no data because it drives confident decisions on false premises. To keep that from happening, you need three controls in place from day one. First, explicit data ownership, so someone is accountable when a feed breaks. Second, a defined collection frequency, synced to how fast your environment actually changes. And third, consistent metadata and documented lineage. Without lineage, you cannot explain why a number moved, and if you cannot explain it, you cannot defend it to the board or a regulator. Treat your data sourcing as a governance exercise, not a plumbing task. Get these controls right, and your KPIs will hold up under scrutiny. Next, we will look at how to interpret trends and variance in the numbers over time.
 ethyca.comtrueprivacy.iozeron.one+22 min
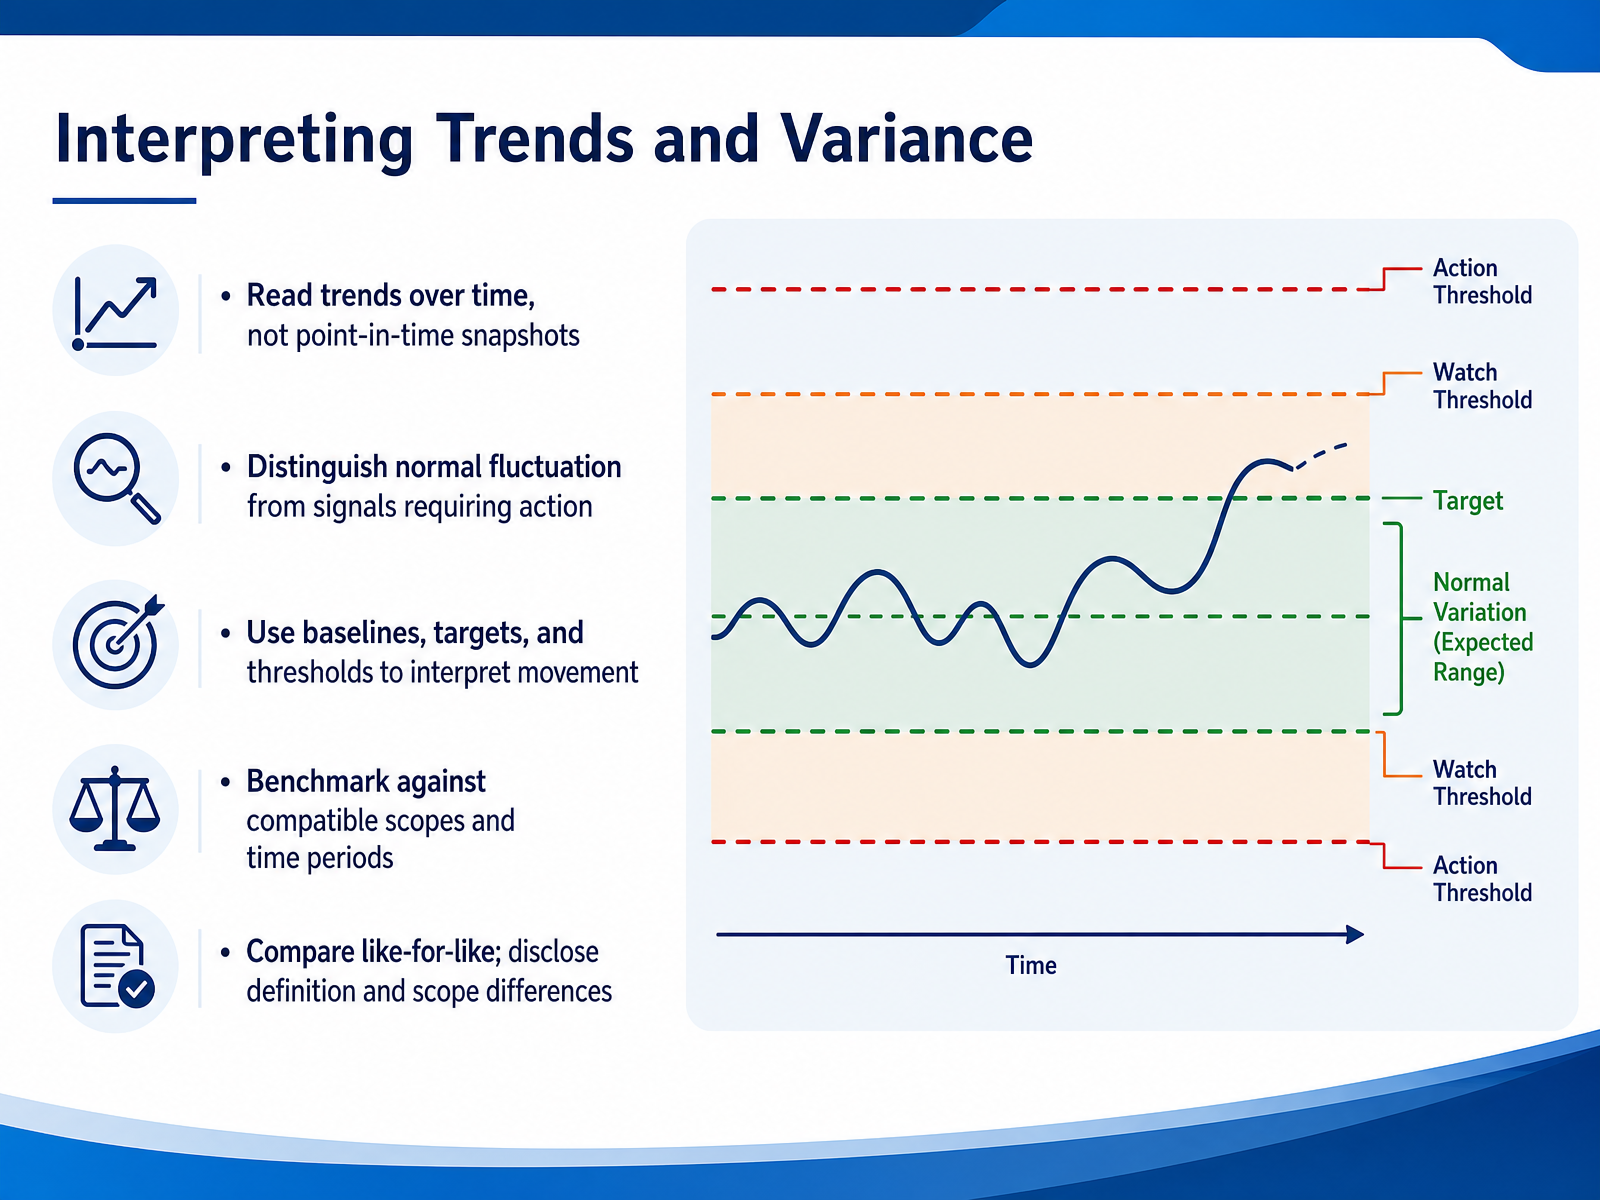
 - 08Interpreting Trends and VarianceOnce your KPIs are in place, resist the pull of point-in-time snapshots. A single month’s number rarely tells you whether your program is improving or degrading. Read the trend over at least three periods, and you start separating signal from noise. Normal fluctuation happens, so anchor your analysis with baselines and tolerances, and watch for sustained movement beyond those thresholds. A one-point dip in training completion may be noise; a three-month slide is a signal. When you benchmark, compare like-for-like. Another company’s DSAR timeliness is only useful if their scope and definitions match yours. If they exclude certain request types or use a different statutory clock, disclose that and adjust before drawing conclusions. Same discipline applies internally. If your denominator shifts because you added a new business unit, say so. Otherwise the trend line lies. This means your variance review will tell you whether to escalate, investigate, or simply note the change. Interpretation is not math; it is judgment with evidence.
 bscdesigner.comcpaexamsmastery.comriskpublishing.com+21 min
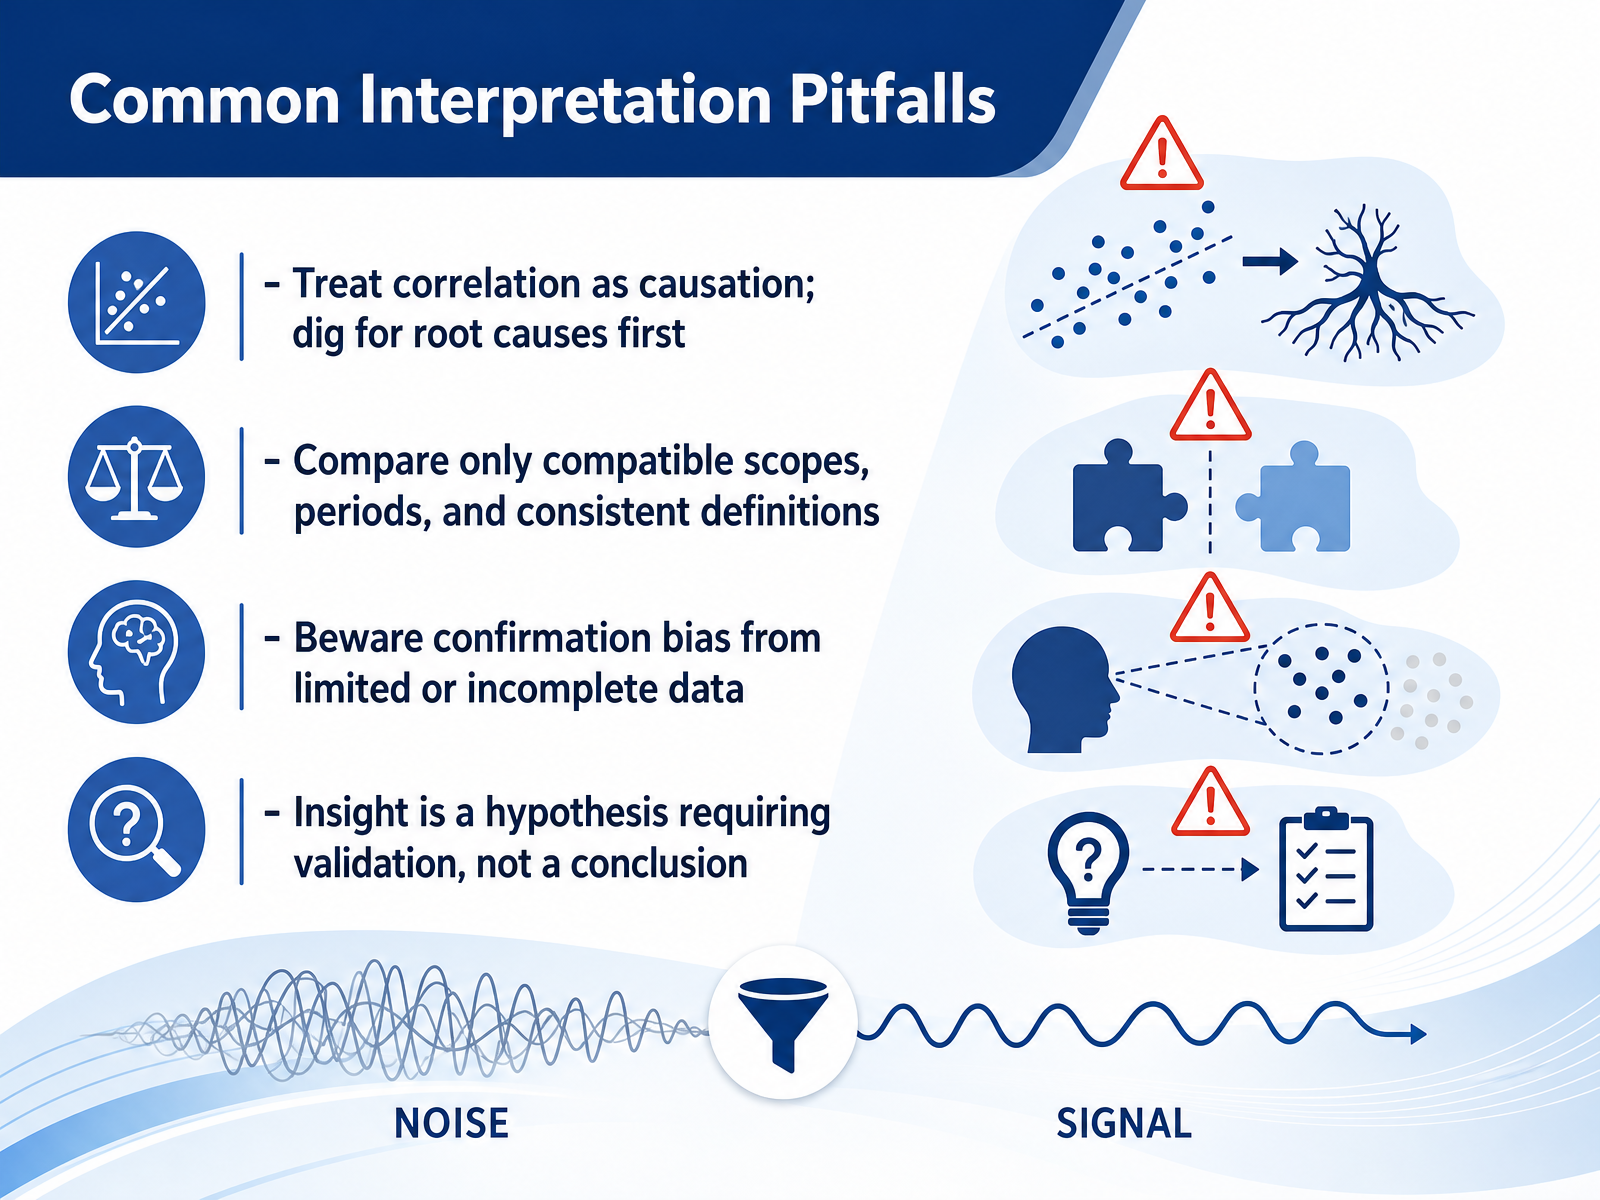
 - 09Common Interpretation PitfallsLet’s shift now to the common interpretation pitfalls that trip up even experienced privacy teams. First, treat correlation as a lead, not a verdict. If DSAR volume climbs alongside a new product launch, dig into the root cause before declaring a trend. Second, only compare compatible scopes, periods, and definitions. A quarter-over-quarter comparison is meaningless if your data inventory scope changed halfway through. Third, watch for confirmation bias. A single incomplete dataset can reinforce what you already believe, so actively seek counterevidence. Finally, remember that an insight is a hypothesis requiring validation, not a conclusion. Before you scale a remediation or change a process, test your explanation against the data. This discipline keeps your metrics credible and your decisions defensible. With those guardrails in place, we’ll turn to building effective privacy dashboards.
 bscdesigner.comcpaexamsmastery.comriskpublishing.com+22 min
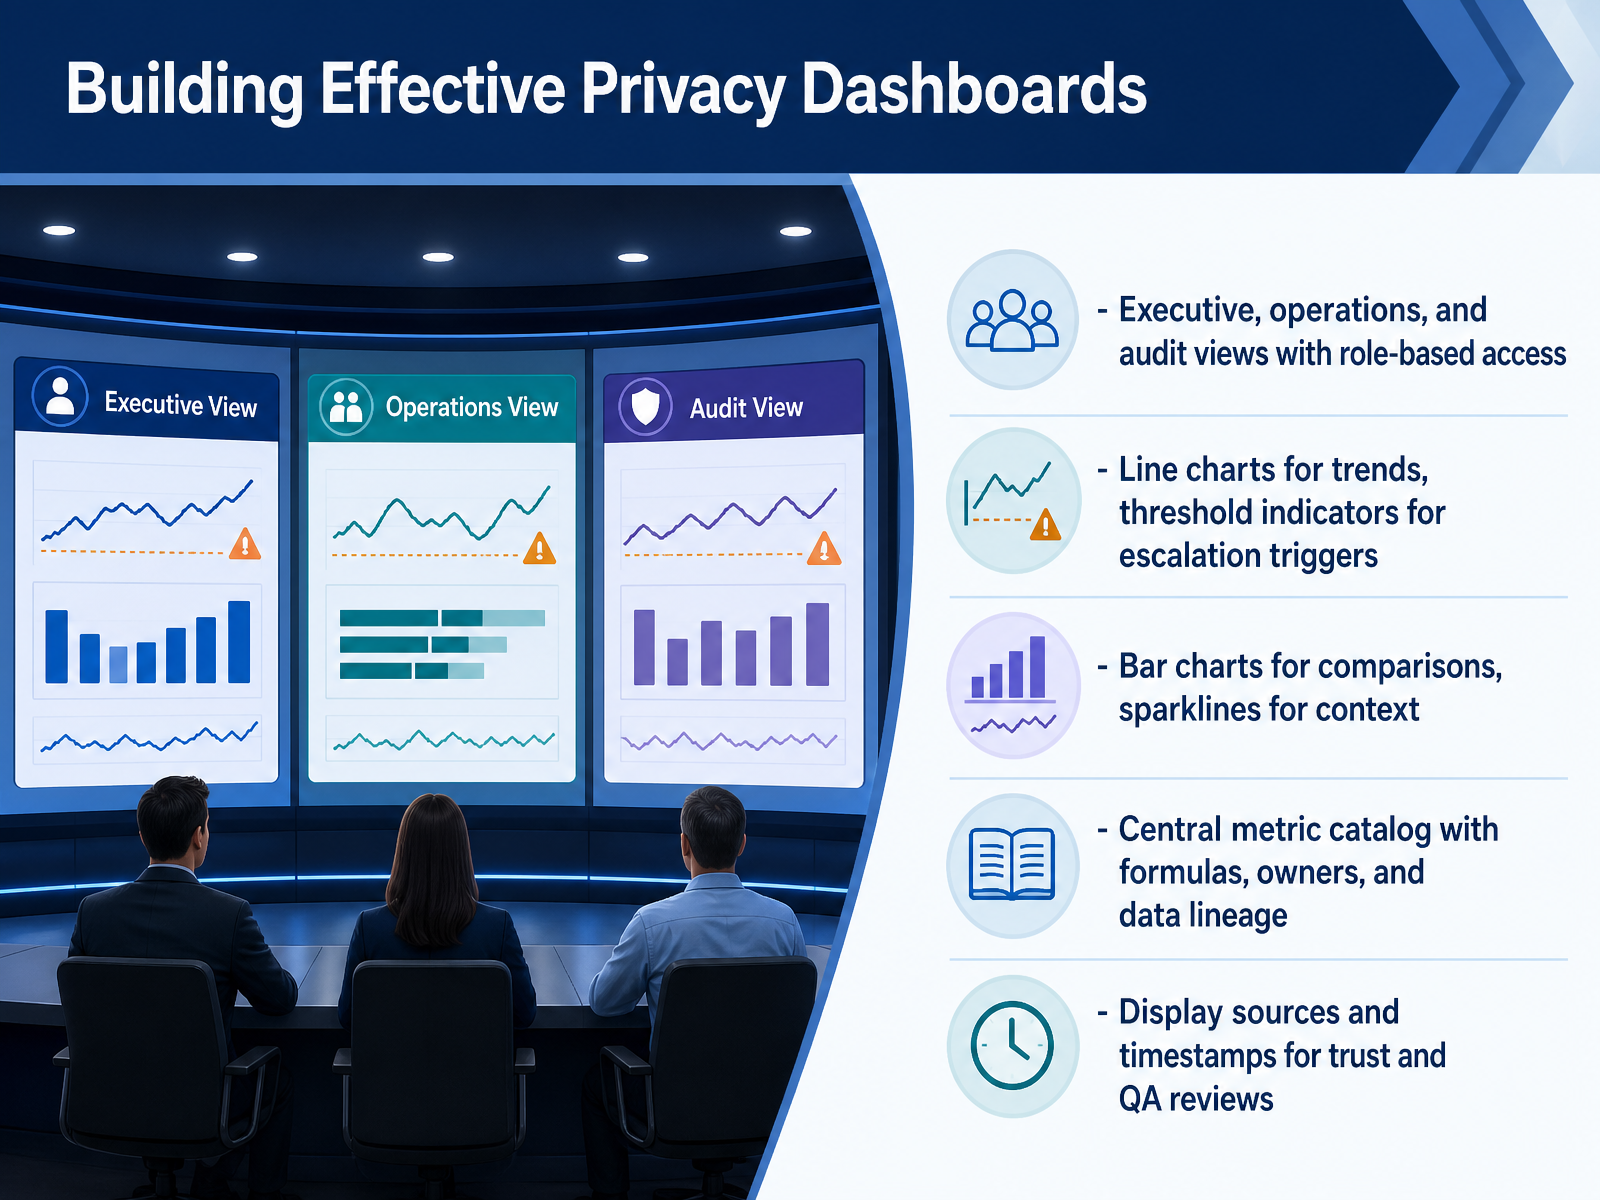
 - 10Building Effective Privacy DashboardsNow let’s turn to the operational side: building dashboards that actually drive decisions. A privacy dashboard is only as credible as the governance around it. That means separating views by role. Executives see risk exposure and strategic trends. Operations sees queues, aging items, and deadlines. Audit sees evidence trails and control status. Leverage chart types deliberately. Line charts show movement over time. Bar charts compare volumes across business units. And threshold indicators convert a value into a decision point, like red at ninety-five percent completion on high-risk assessments. The critical success factor is the metric catalog. It must document the formula, the owner, the source system, and the lineage behind every number. Without it, you have decoration, not decision support. Finally, display timestamps and sources directly on the dashboard. That single practice accelerates quality reviews and protects trust when a number is challenged. This foundation sets up the final question: how these metrics flow upward into leadership reporting and board materials.
 secureprivacy.aiprivacypatterns.orgivir.nl+22 min
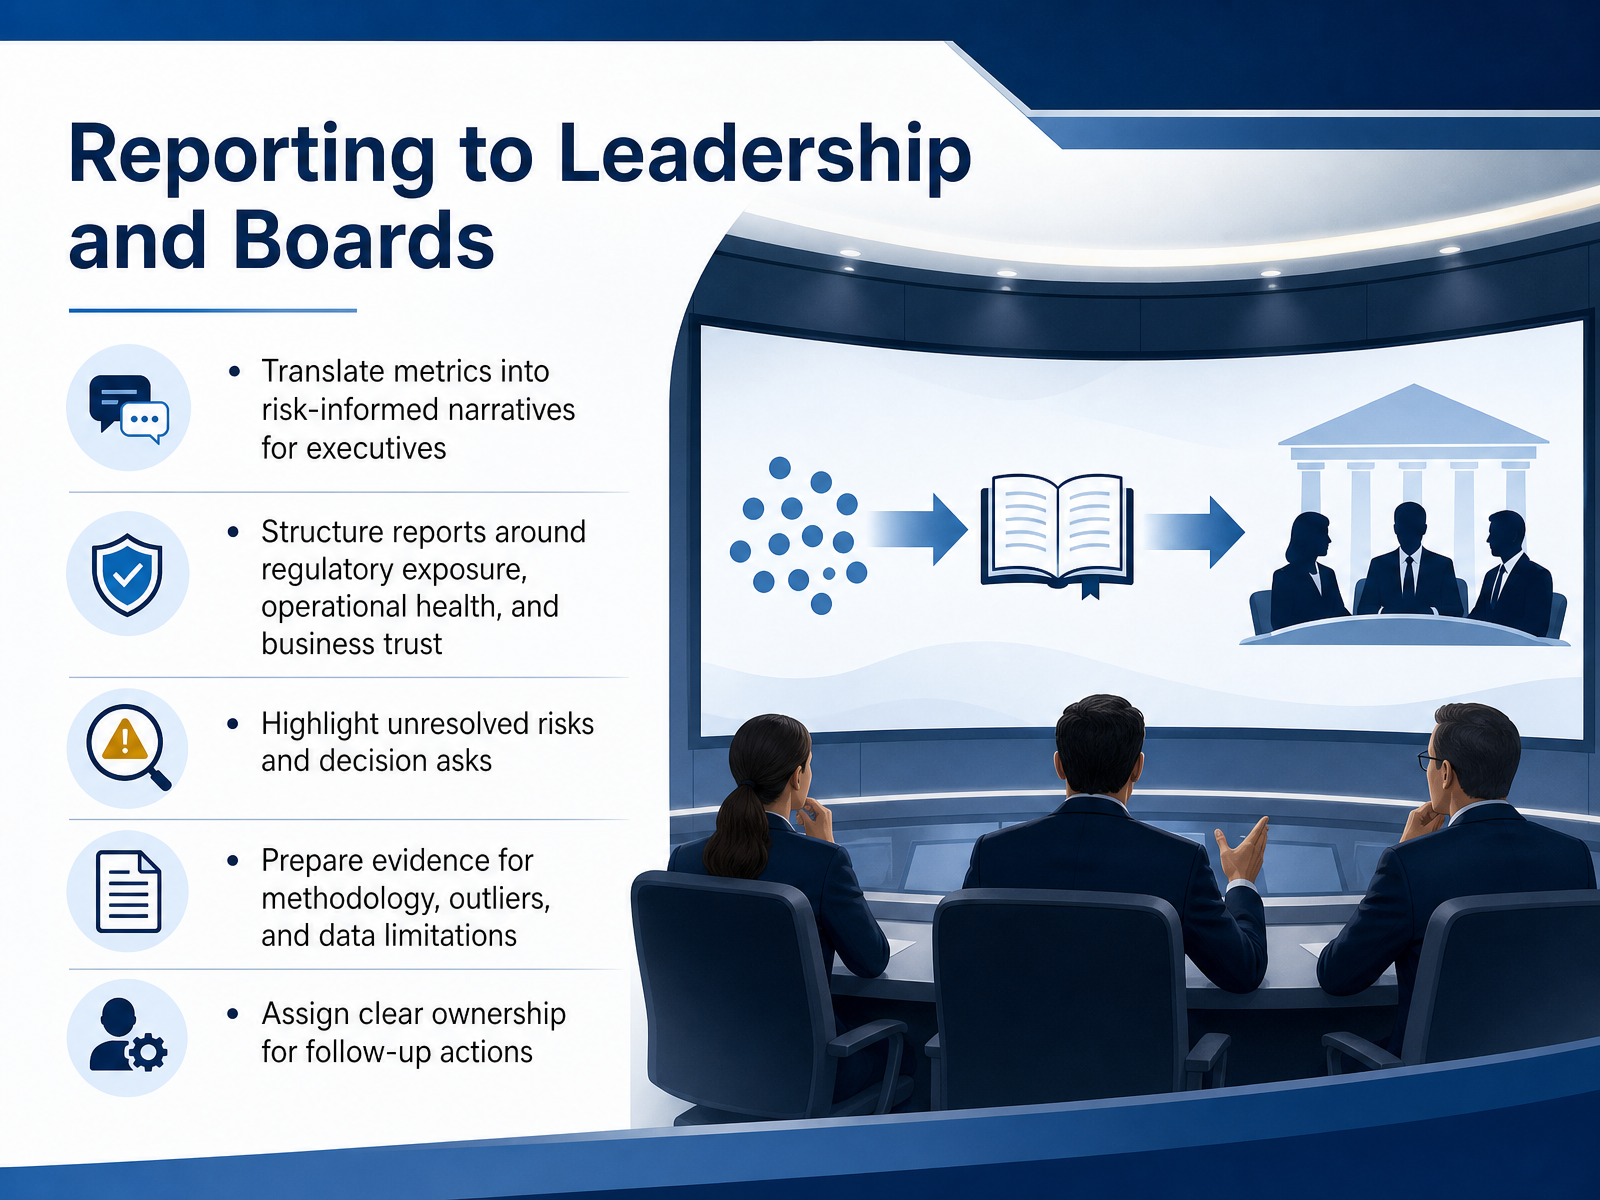
 - 11Reporting to Leadership and BoardsExecutive reporting is where measurement discipline either earns its budget or loses its credibility. The board does not need your monthly activity totals; it needs a risk-informed narrative structured across three dimensions. Regulatory exposure first, such as breach notification deadlines approaching or audit findings aging past tolerance. Operational health second, meaning remediation queue closure rates, DSAR response reliability. And business trust third, privacy inputs that accelerate deals or protect customer retention. For each dimension, lead with what has changed since the last quarter, where you sit against approved thresholds, and what remains a genuine decision ask. If there is an unresolved risk, name it explicitly. The pack must show the evidence behind your methodology, your outlier explanation, and any data limitations so a challenge does not derail the meeting. Every open item needs a named owner and a review date. That converts the report from a status update into a governance instrument. Keep the full board pack to two pages and preserve the detailed evidence file for the audit committee. This is how privacy reporting moves from being reviewed to being acted upon. Next, we will connect these KPI tiers directly to standing governance decisions and escalation triggers.
 fpf.orgcoalfire.comriskpublishing.com1 min
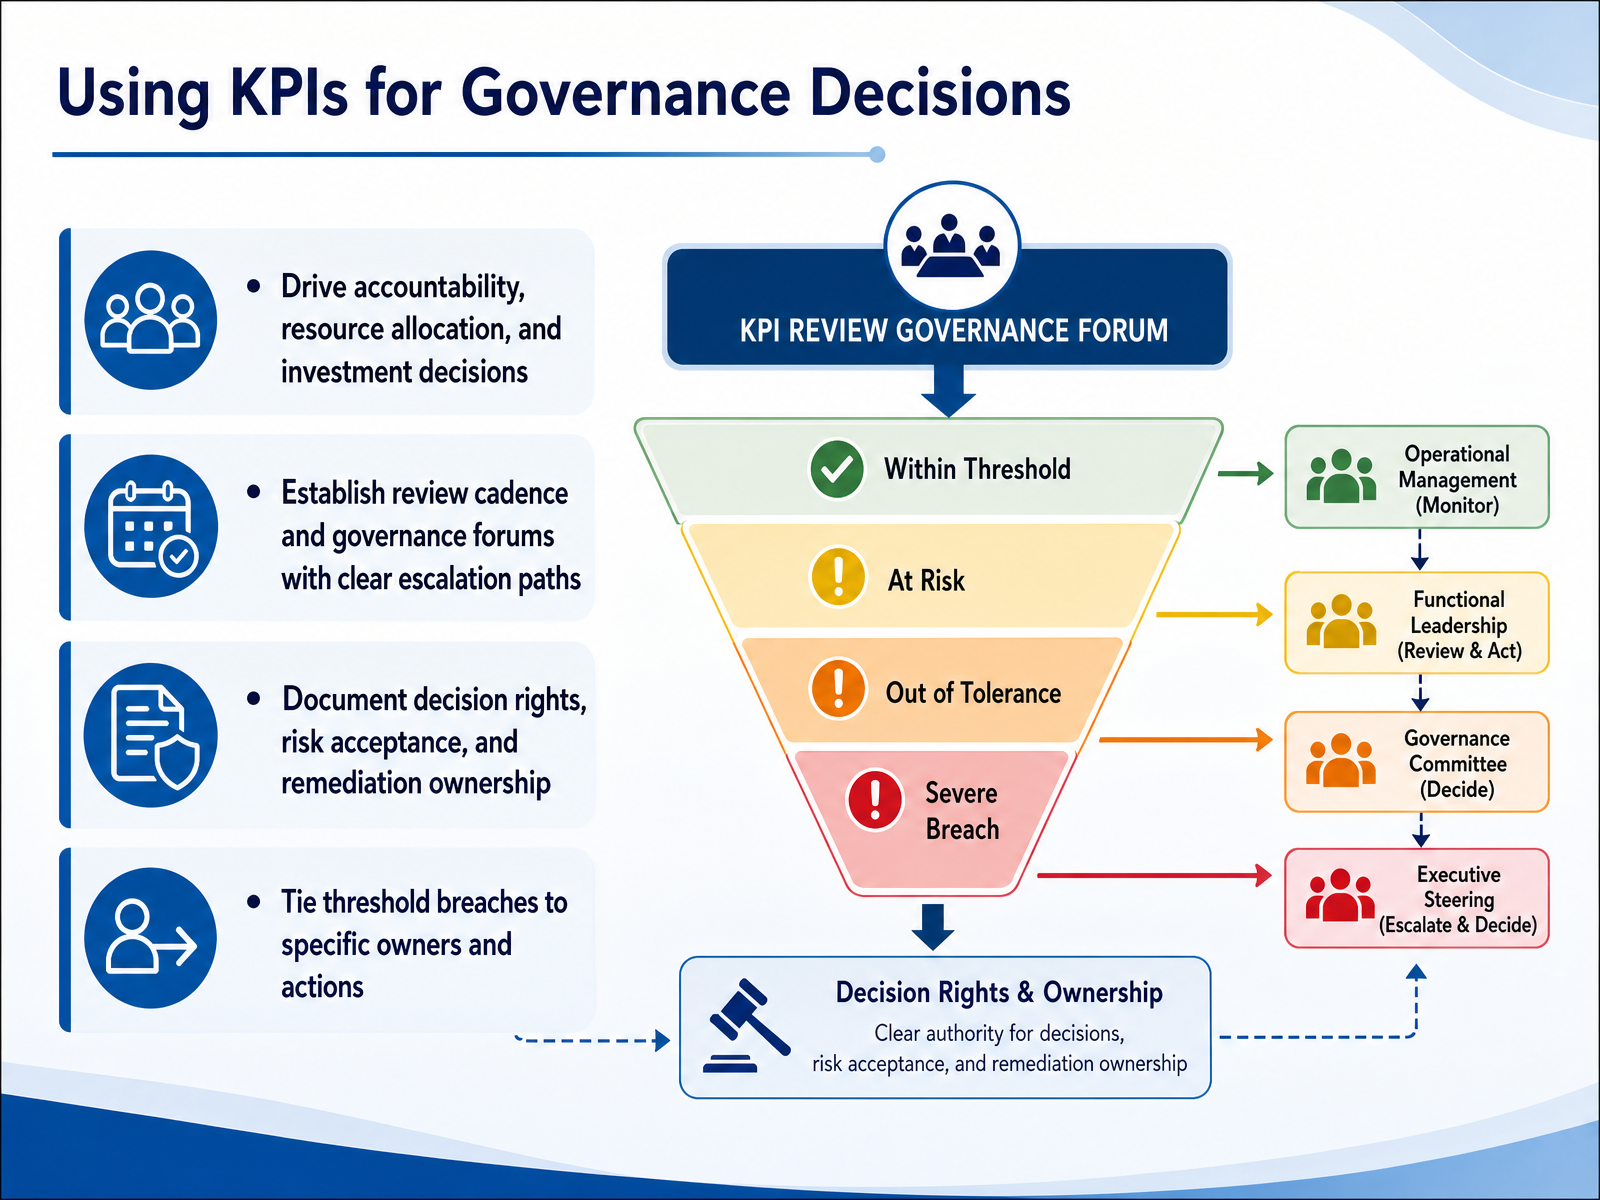
 - 12Using KPIs for Governance DecisionsNow let’s turn those numbers into decisions. A KPI dashboard only earns its place when it drives accountability, resource allocation, and investment choices. That means every metric needs a named owner who can act on it, not just a team that reports it. Tie each threshold breach to a specific action and a specific person. If the data subject request backlog crosses amber, the privacy operations lead should already know what to do, who to notify, and when to escalate. Establish a regular review cadence, monthly at the privacy committee, quarterly at the board or risk committee, and document the escalation path for anything that hits red. Governance forums work when decision rights are explicit. Who approves a risk acceptance? Who signs off on remediation funding? Write those answers down. And when a breach does happen, the board needs to see trend, threshold history, owner, and remediation status, all anchored to your stated risk appetite. That is not decoration. That is decision support. As you build this rhythm, you will naturally start to see which metrics matter and which are noise, which brings us to KPI maturity and roadmap.
 riskpublishing.combscdesigner.comcpaexamsmastery.com+21 min
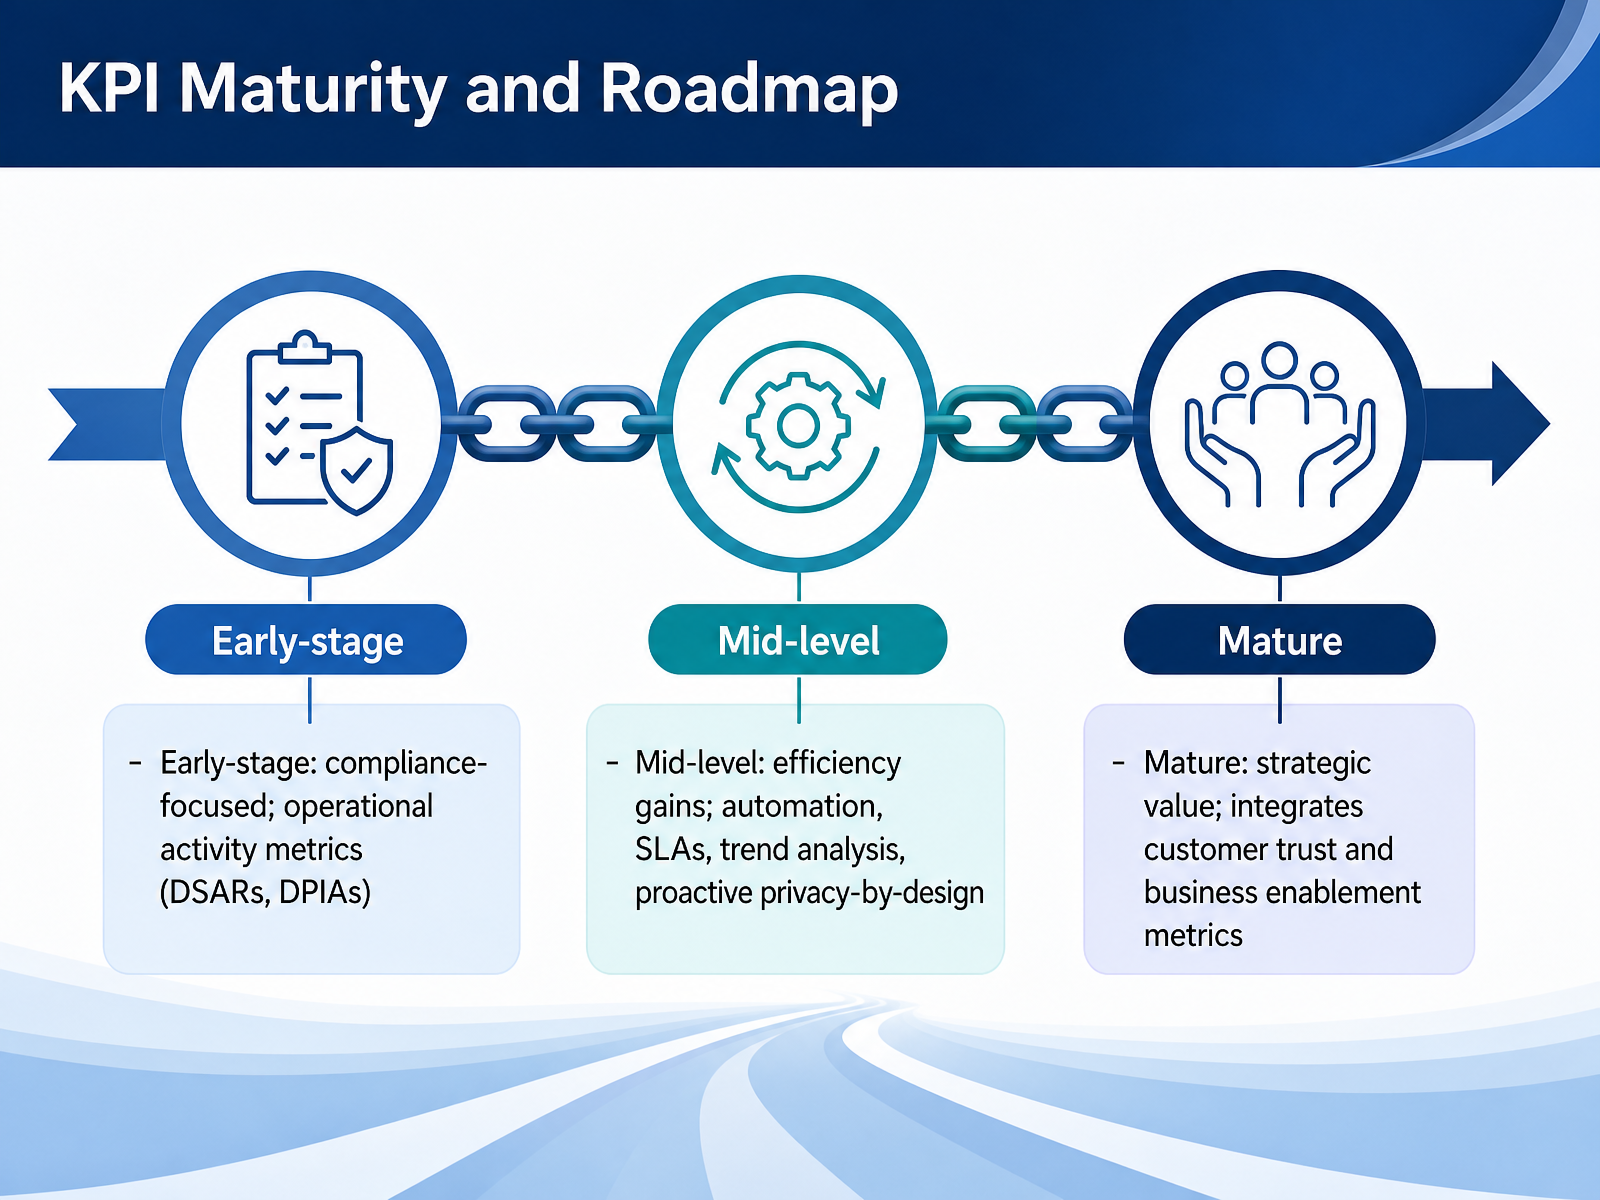
 - 13KPI Maturity and RoadmapLet’s put the metrics we’ve discussed into a maturity context. Early-stage programs naturally focus on compliance, tracking operational activity like DSAR volumes and DPIA completions. These counts prove you’re meeting obligations, but they don’t tell you if you’re managing risk efficiently. As you move to the mid-level, the emphasis shifts to efficiency gains. Here, automation reduces manual effort, SLAs govern response times, and trend analysis replaces static counts. You start asking why a backlog is growing, not just how large it is. This is also where proactive privacy-by-design becomes measurable, with checkpoints embedded in the development lifecycle. Mature programs take a different posture entirely. The metrics shift from activity to outcome, integrating customer trust indicators and business enablement. You might measure how privacy reviews accelerate sales or how transparent data practices reduce churn. In mature programs, metrics inform strategy, not just remediation. Don’t treat these as rigid phases. Assess where each capability sits, and prioritize the gaps that carry the most risk. Next, let’s move to practical next steps for building your KPI roadmap.
 fpf.orgriskpublishing.comiapp.org+12 min
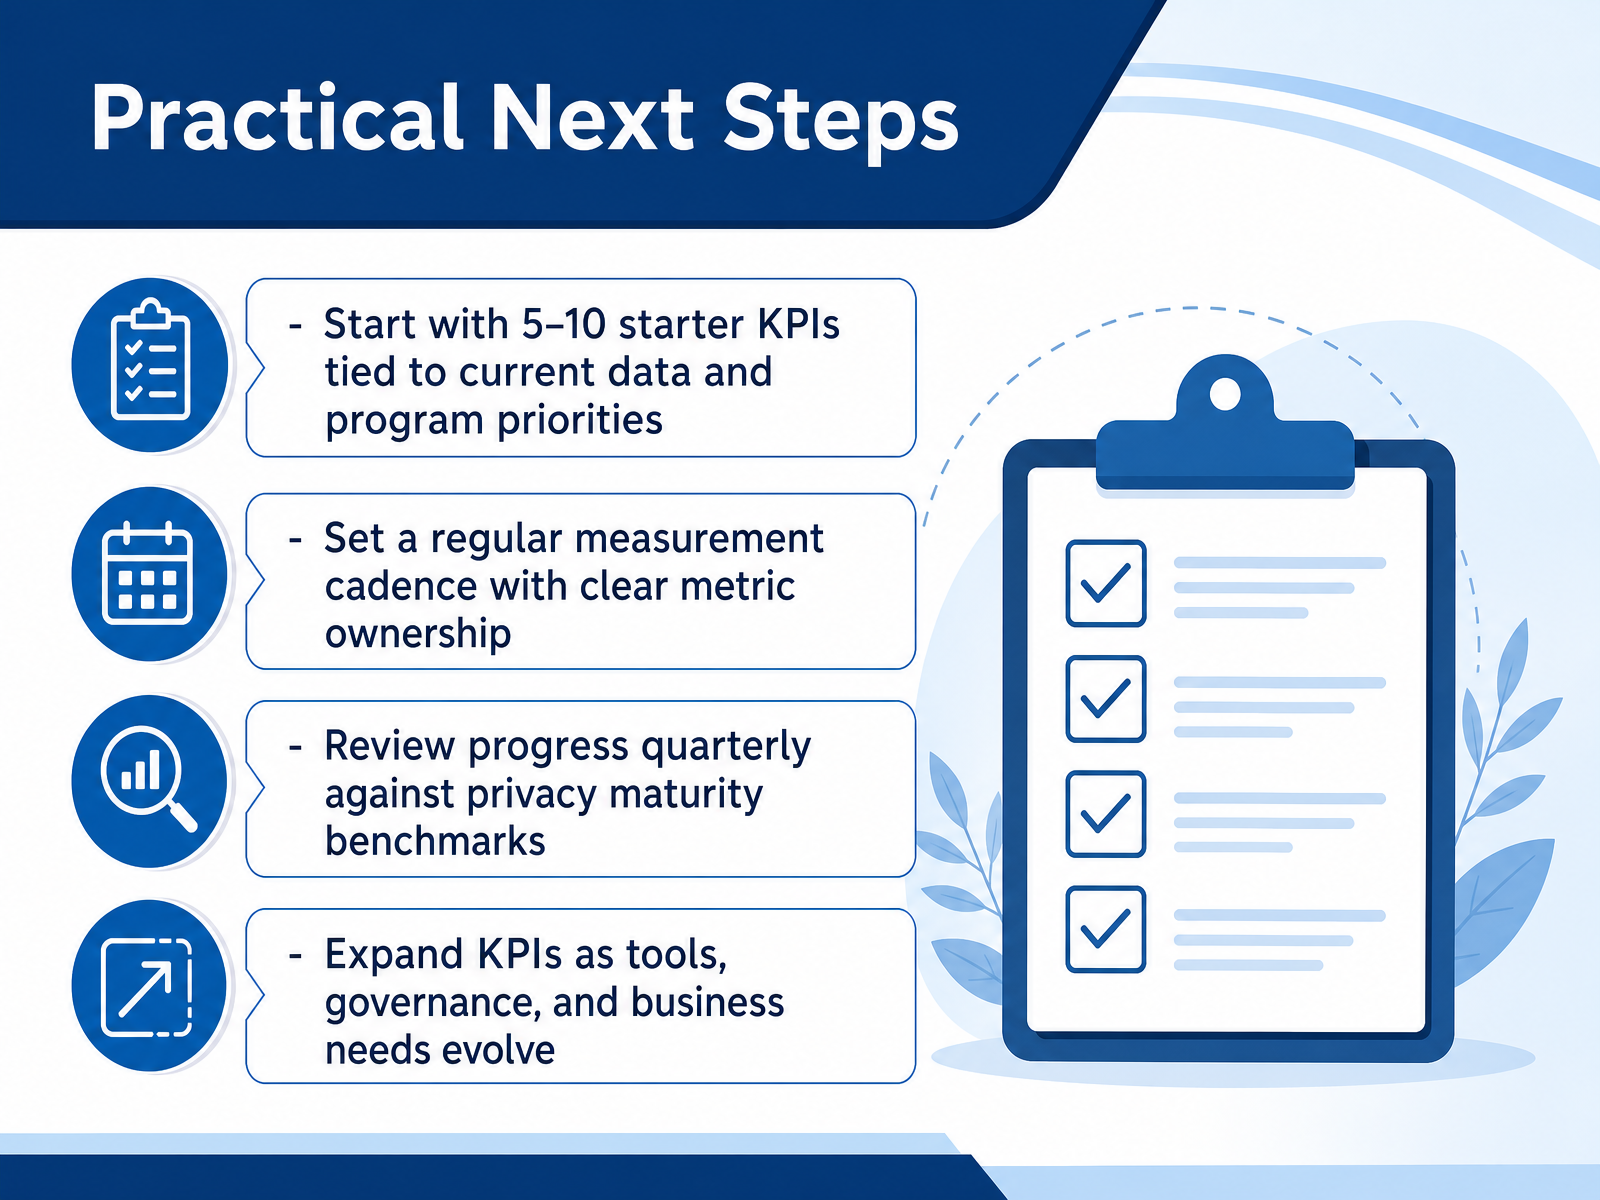
 - 14Practical Next StepsLet's turn this into your operating plan. Start with five to ten starter KPI's tied directly to your current data and program priorities. Resist the urge to build a full dashboard on day one. Set a regular measurement cadence and assign clear metric ownership. Metrics without an owner drift. Review progress quarterly against privacy maturity benchmarks. That cadence turns raw numbers into trend lines. Finally, plan for expansion as your tools, governance, and business needs evolve. What you measure today should not be what you measure next year. You now have the framework to select, interpret, and act on privacy data. Thank you for your attention, and good luck building a program that demonstrates its value.
 iapp.orggrip.globalrelay.comiapp.org+21 min
Take the deck with you
Download this course as a file — free, no sign-up needed.
- PDF handoutEvery slide page, ready to print or share.15 pages · 3.5 MBDownload
- Narrated PowerPointThe deck that presents itself — every slide carries the digital human's narration video.15 pages · 16.5 MBDownload
- PowerPoint slidesThe full deck as a .pptx — open it in PowerPoint, Keynote, or Google Slides.15 pages · 3.4 MBDownload
Free to use in your own training — please keep the PersonWise credit page at the end.
Have your own deck? Turn it into a course
Sources consulted
Web sources consulted while building this course.
- PRIVACY METRICS REPORT — fpf.org
- Strategic privacy KPIs: Aligning metrics with program goals – Global Relay Intelligence & Practice — grip.globalrelay.com
- How To Measure Your Privacy Program, Step-by-Step | IAPP — iapp.org
- Measuring privacy programs: The role of metrics | IAPP — iapp.org
- Privacy Metrics That Matter to Business | Coalfire — coalfire.com
- KPI Analysis Guide: Trends, Variance, Correlation, and Benchmarks for Data-Driven Decision — bscdesigner.com
- Variance Analysis Against Budgets, Standards, Benchmarks, and KPIs | Core 2 Management Accounting for Decisions and Performance | CPA Exams Mastery — cpaexamsmastery.com
- Data Privacy Key Risk Indicators Examples: A 2026 Practitioner Guide — riskpublishing.com
- Making Sense of KPI Changes | Towards Data Science — towardsdatascience.com
- Financial Analysis & Trend Interpreter | Claude Code Playbooks — claudecodehq.com
- Helios | Real-Time DSPM, Discovery, Classification & Data Inventory | Ethyca — ethyca.com
- TruePrivacy — Data Privacy Operations, Automated — trueprivacy.io
- DPDP Compliance: How to Operationalize the DPDP Act - Cyber Risk Intelligence Platform — zeron.one
- Data Privacy Management - Securiti — securiti.ai
- Ketch Agent Network: Privacy Operations, Finally at AI Speed — ketch.com
- Privacy Governance Dashboard for GDPR: What to Track, ... — secureprivacy.ai
- Privacy dashboard - Privacy Patterns — privacypatterns.org
- Enhancing User Control via Privacy Dashboards — ivir.nl
- Designing a GDPR-compliant and Usable — specialprivacy.ercim.eu
- Data protection by design and by default | ICO — ico.org.uk