Data Engineering Fundamentals
Begin
10 pages · ~20 min
Data Engineering Fundamentals
This training introduces data engineering fundamentals, covering core concepts, tools, and best practices for building and maintaining data pipelines. Ideal for aspiring data engineers and analysts seeking to understand data architecture and ETL processes.
What you’ll learn
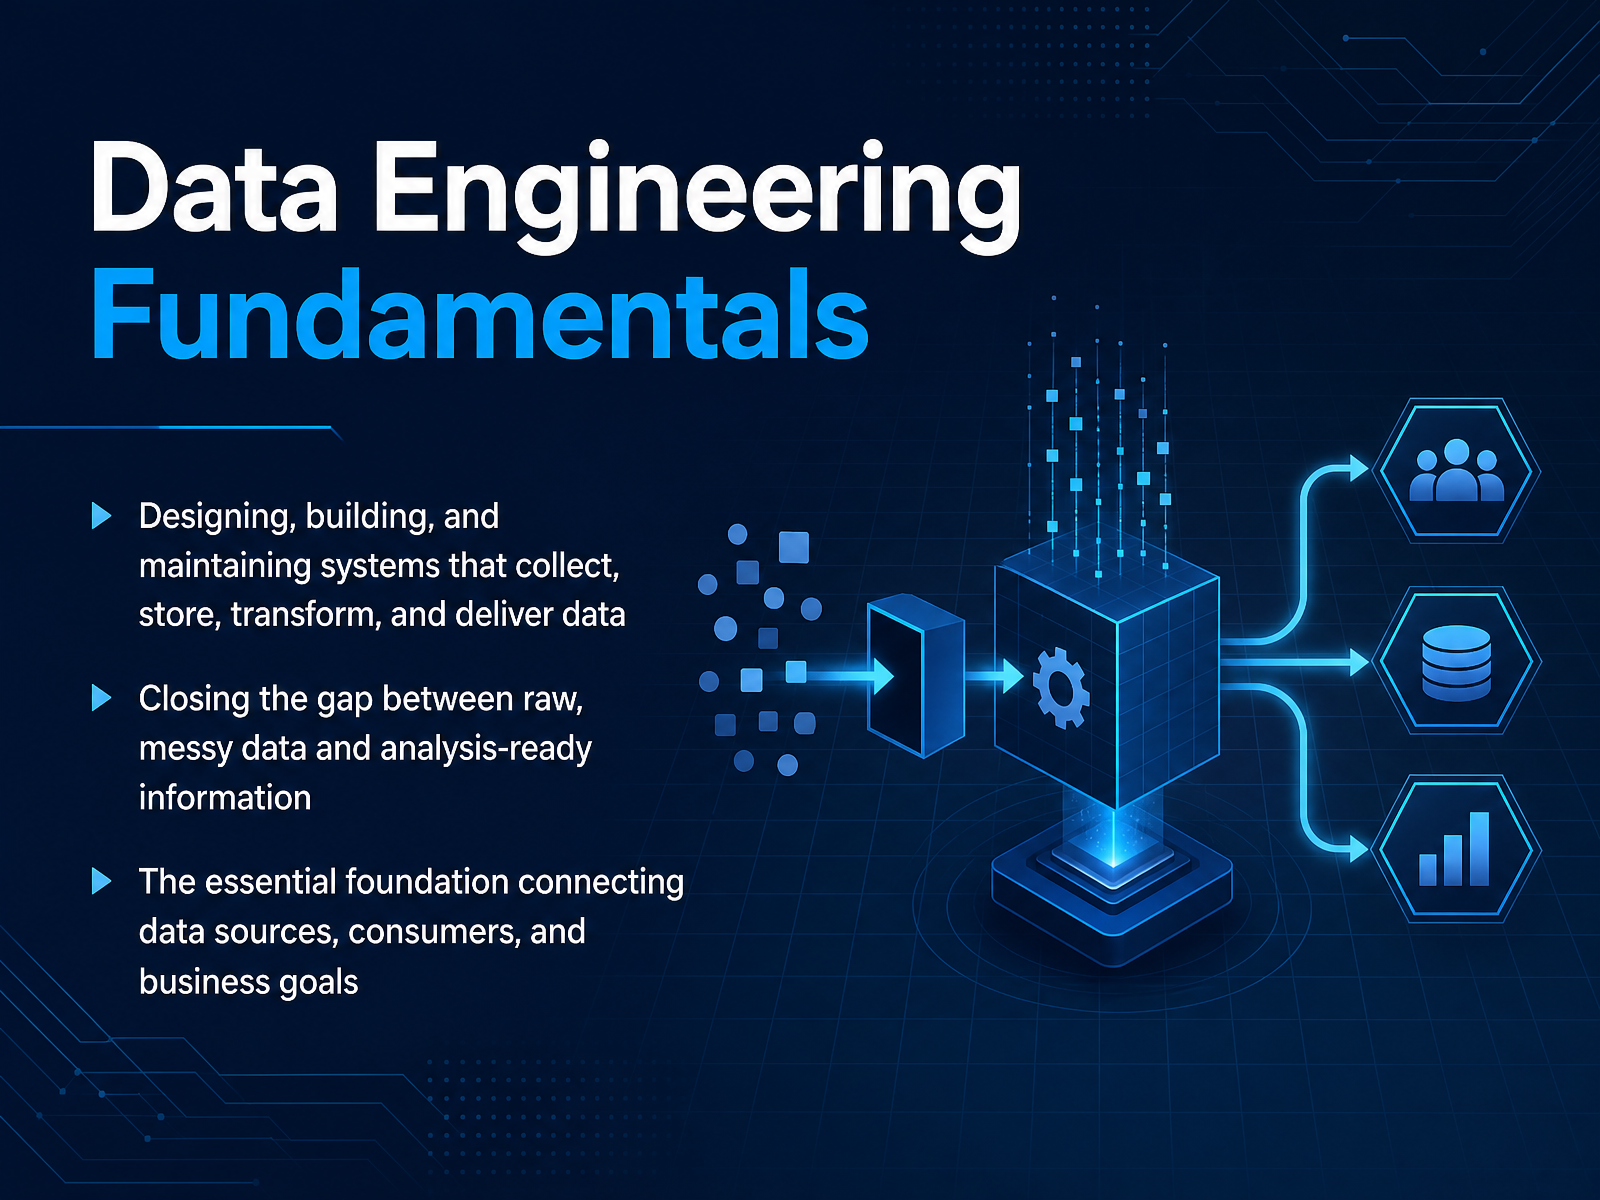
- 01Data Engineering FundamentalsWelcome! I am glad you are here. In this session, we will explore the fundamentals of data engineering. If you are new to this field, do not worry. We will build your understanding step by step, starting with the big picture. So, what is data engineering? At its core, it is the practice of designing, building, and maintaining the systems that collect, store, transform, and deliver data. Think of raw data like ingredients delivered to a restaurant. On their own, they are messy and unusable. A chef needs those ingredients washed, chopped, and organized before cooking. Data engineers do this for data. They build the pipelines that close the gap between raw, messy data and analysis-ready information. This is the essential foundation that connects data sources, like apps and databases, to the people who consume it, like analysts and business teams, all while serving a bigger business goal. Now, let us look at why this foundation is so critical to every organization.databricks.combydatafix.cominfinisynapse.com+21 min
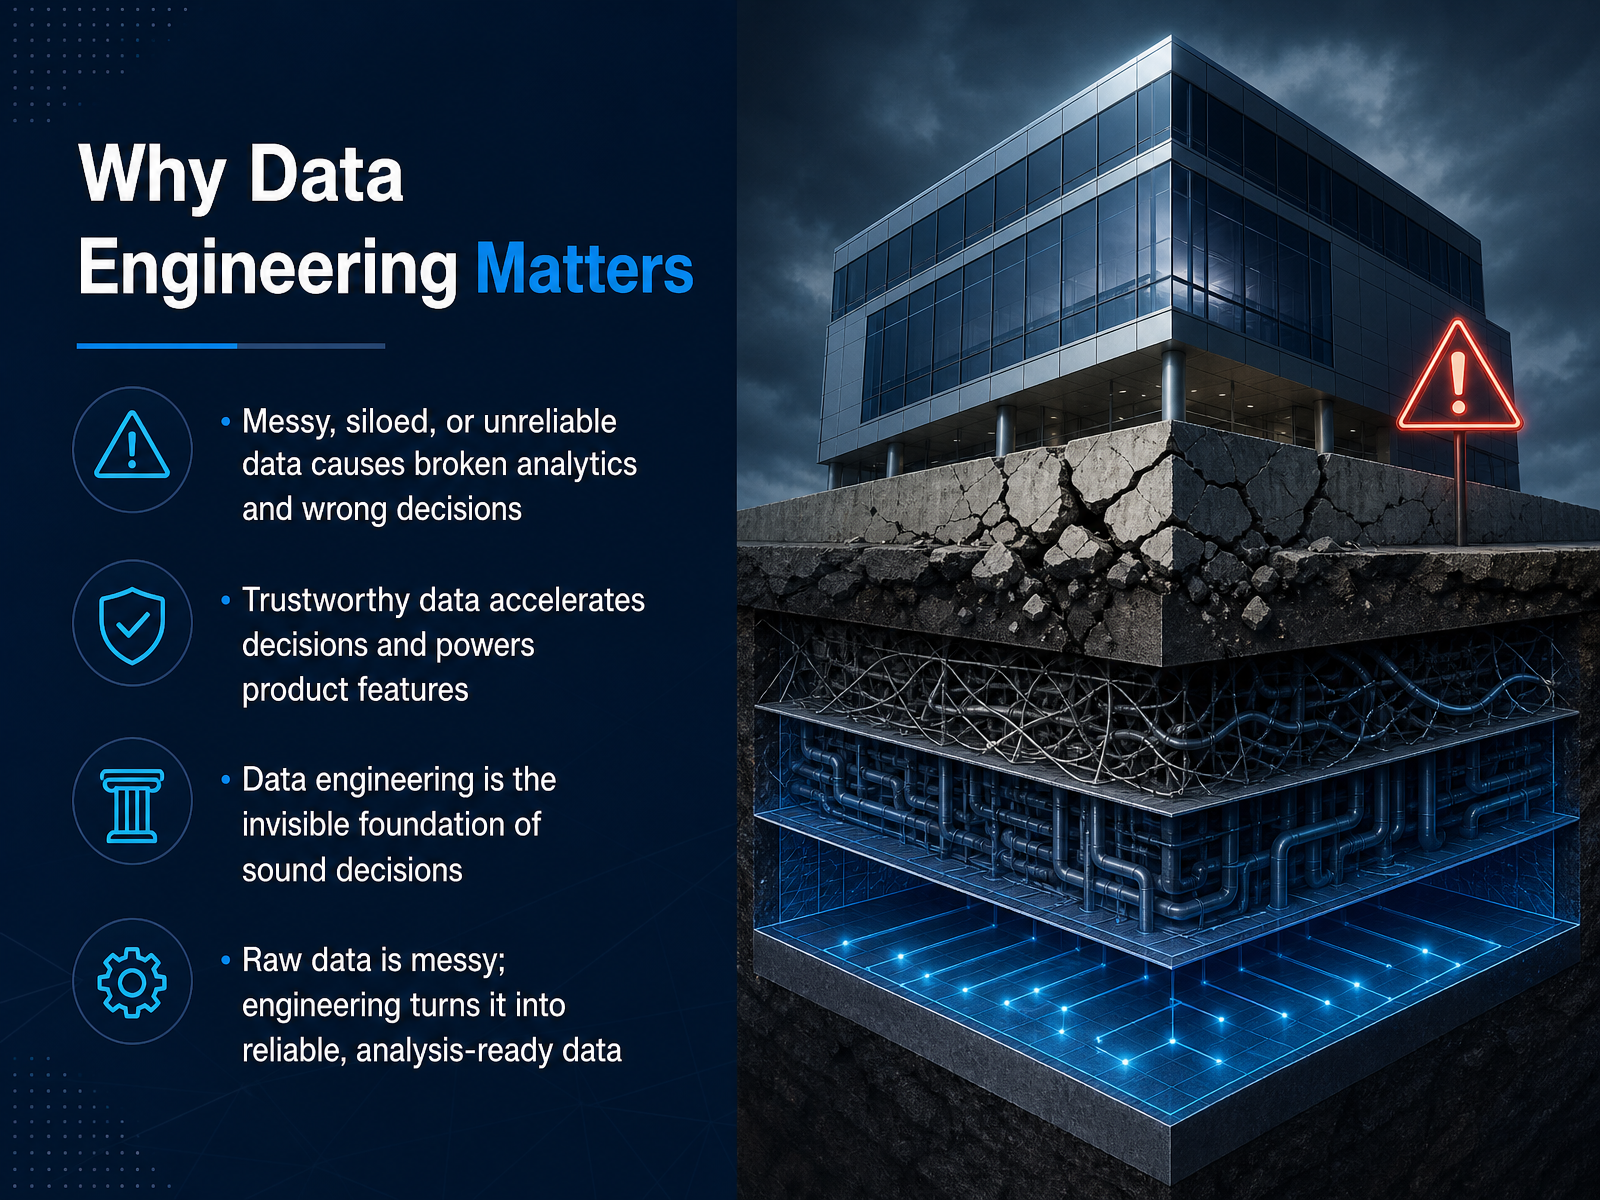
- 02Why Data Engineering MattersSo why should we care about data engineering? Because data is rarely ready to use the moment it's created. Raw data is messy. It can be scattered across different systems, contain duplicates, or have missing values. Without engineering, this mess can lead to broken analytics and decisions made on faulty information. But when data is handled well, it becomes something you can trust. Good data engineering is the invisible foundation that makes reliable dashboards, accurate reports, and useful product features possible. It's the work of collecting raw information, cleaning it, and organizing it until it's ready for analysis. Think of it like prepping ingredients before cooking a meal. The raw materials might be great, but until they're washed, chopped, and measured, they aren't easy to work with. When the foundation is solid, decisions can be made quickly and confidently. That's why this first step matters so much. Now let's look at how that work actually flows, in the data engineering lifecycle.
 databricks.combydatafix.cominfinisynapse.com+21 min
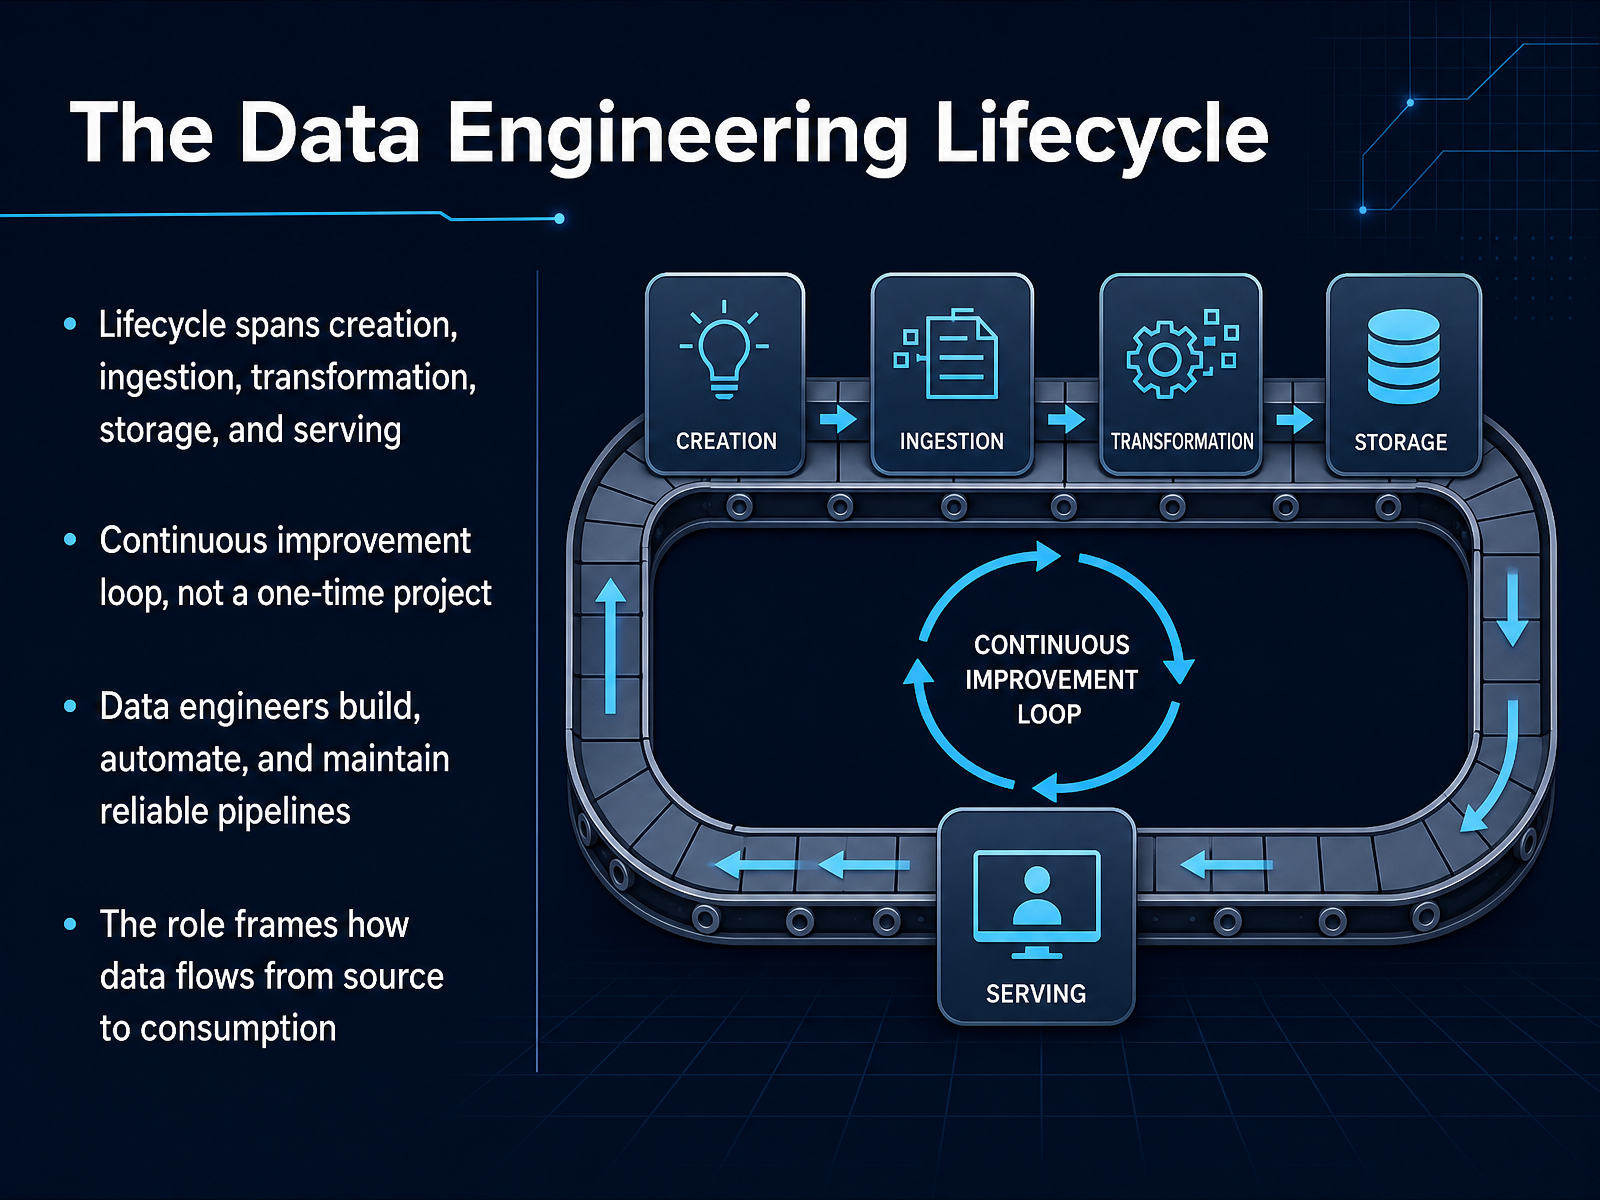
 - 03The Data Engineering LifecycleNow let's look at the data engineering lifecycle. This is the journey data takes, from the moment it's created to the moment someone actually uses it. Think of it in five stages: creation, ingestion, transformation, storage, and serving. Creation is where data is born, like a user clicking a button on a website. Ingestion is bringing that raw data into your system. Transformation is where you clean it up, fix errors, and reshape it so it's actually useful. Storage is giving it a proper home, like a well-organized warehouse. And serving is delivering it to the people who need it, like an analyst building a dashboard. Here's the key thing. This isn't a one-time project. It's a continuous loop. Data keeps flowing, and the pipeline needs to keep updating. A data engineer's job is to build this automated pipeline and make sure it runs reliably, day after day. They're the ones ensuring data flows smoothly from source to consumption, so the business always has clean, trustworthy information. That continuous, reliable flow is what makes all downstream analytics possible. Now that we have the lifecycle, let's dive into the core building blocks that power it.
 databricks.combydatafix.cominfinisynapse.com+22 min
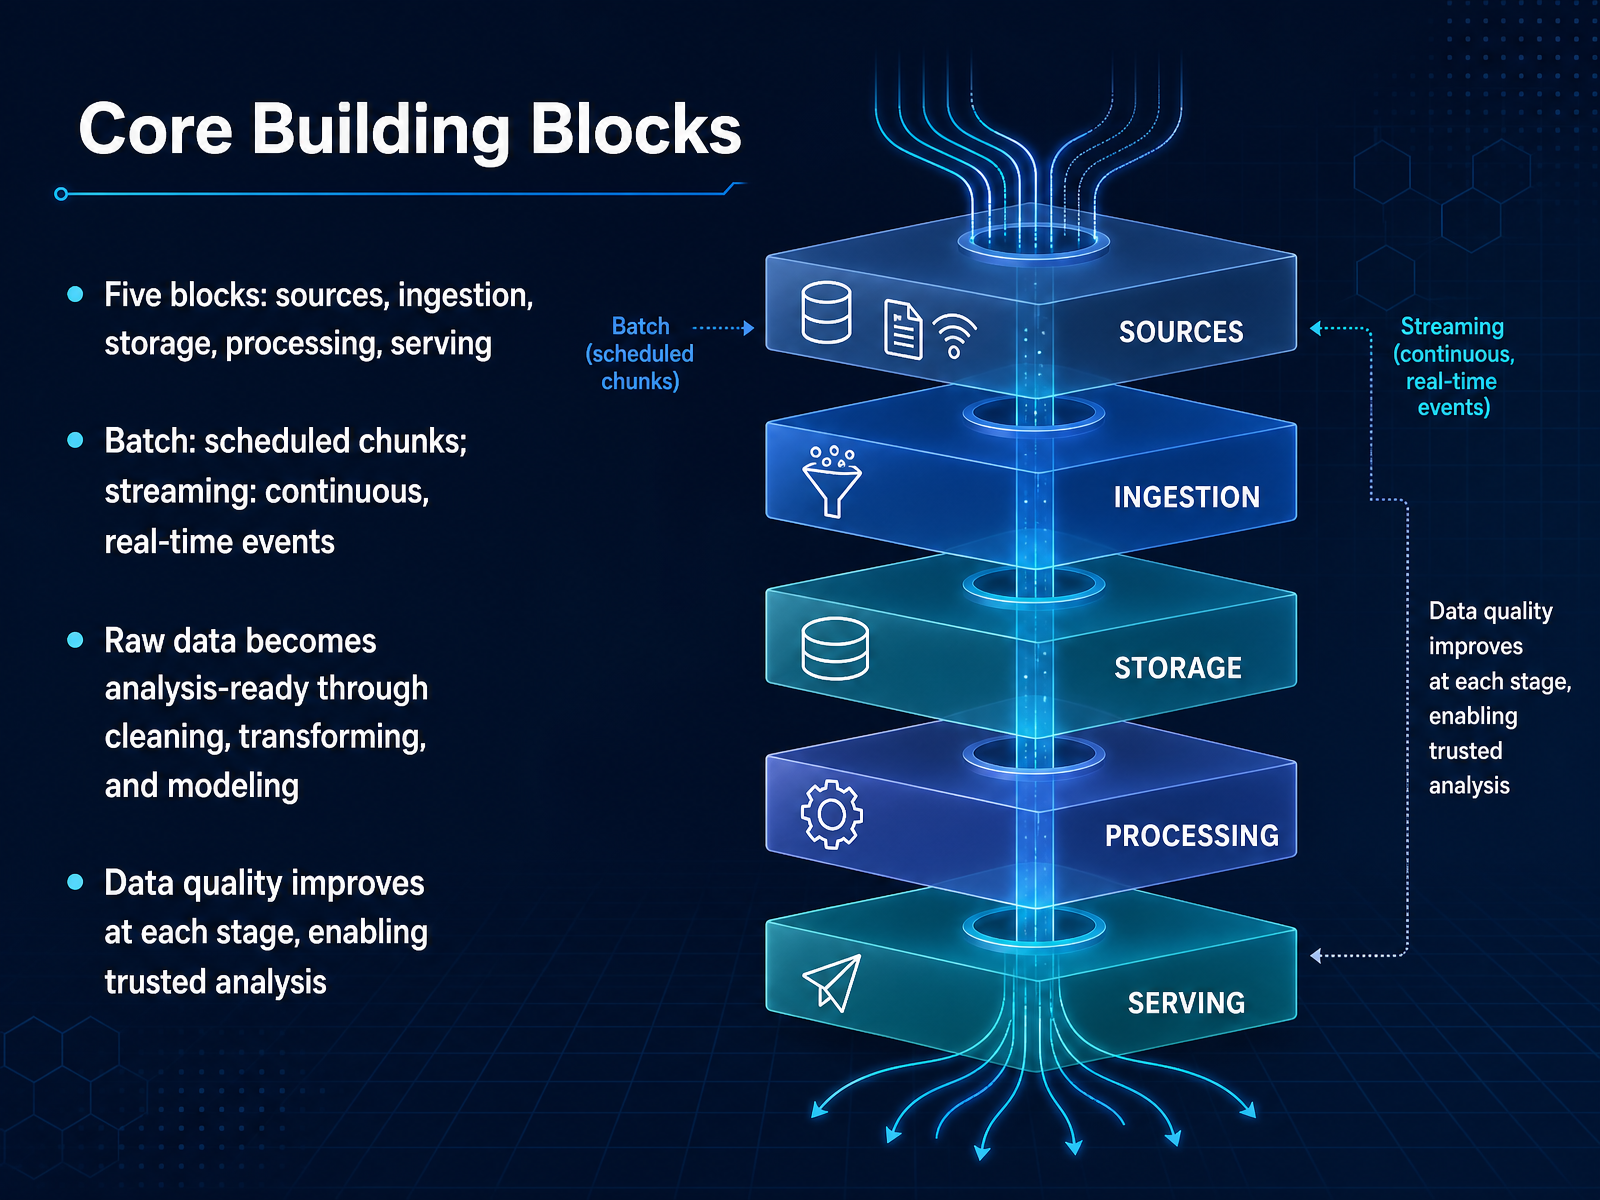
 - 04Core Building BlocksNow let's look at the core building blocks of any data system. Think of five main stages: sources, ingestion, storage, processing, and serving. Sources are where data comes from, like apps, databases, or sensors. Ingestion is how we bring that data in, and this can happen in two ways. Batch means collecting data on a schedule, say every hour or every night. Streaming means data flows in continuously, as events happen, like a live feed. Storage is where we keep the data, and processing is where we clean and shape it up. This is the crucial step where raw data becomes analysis-ready. We fix missing values, remove duplicates, and standardize formats. Each stage improves data quality, so by the time data reaches the serving stage, it is trustworthy and ready for dashboards and reports. The goal is simple: turn raw facts into something you can actually rely on. Next, we'll walk through a simple, end-to-end pipeline to see how these pieces fit together.
 databricks.combydatafix.cominfinisynapse.com+22 min
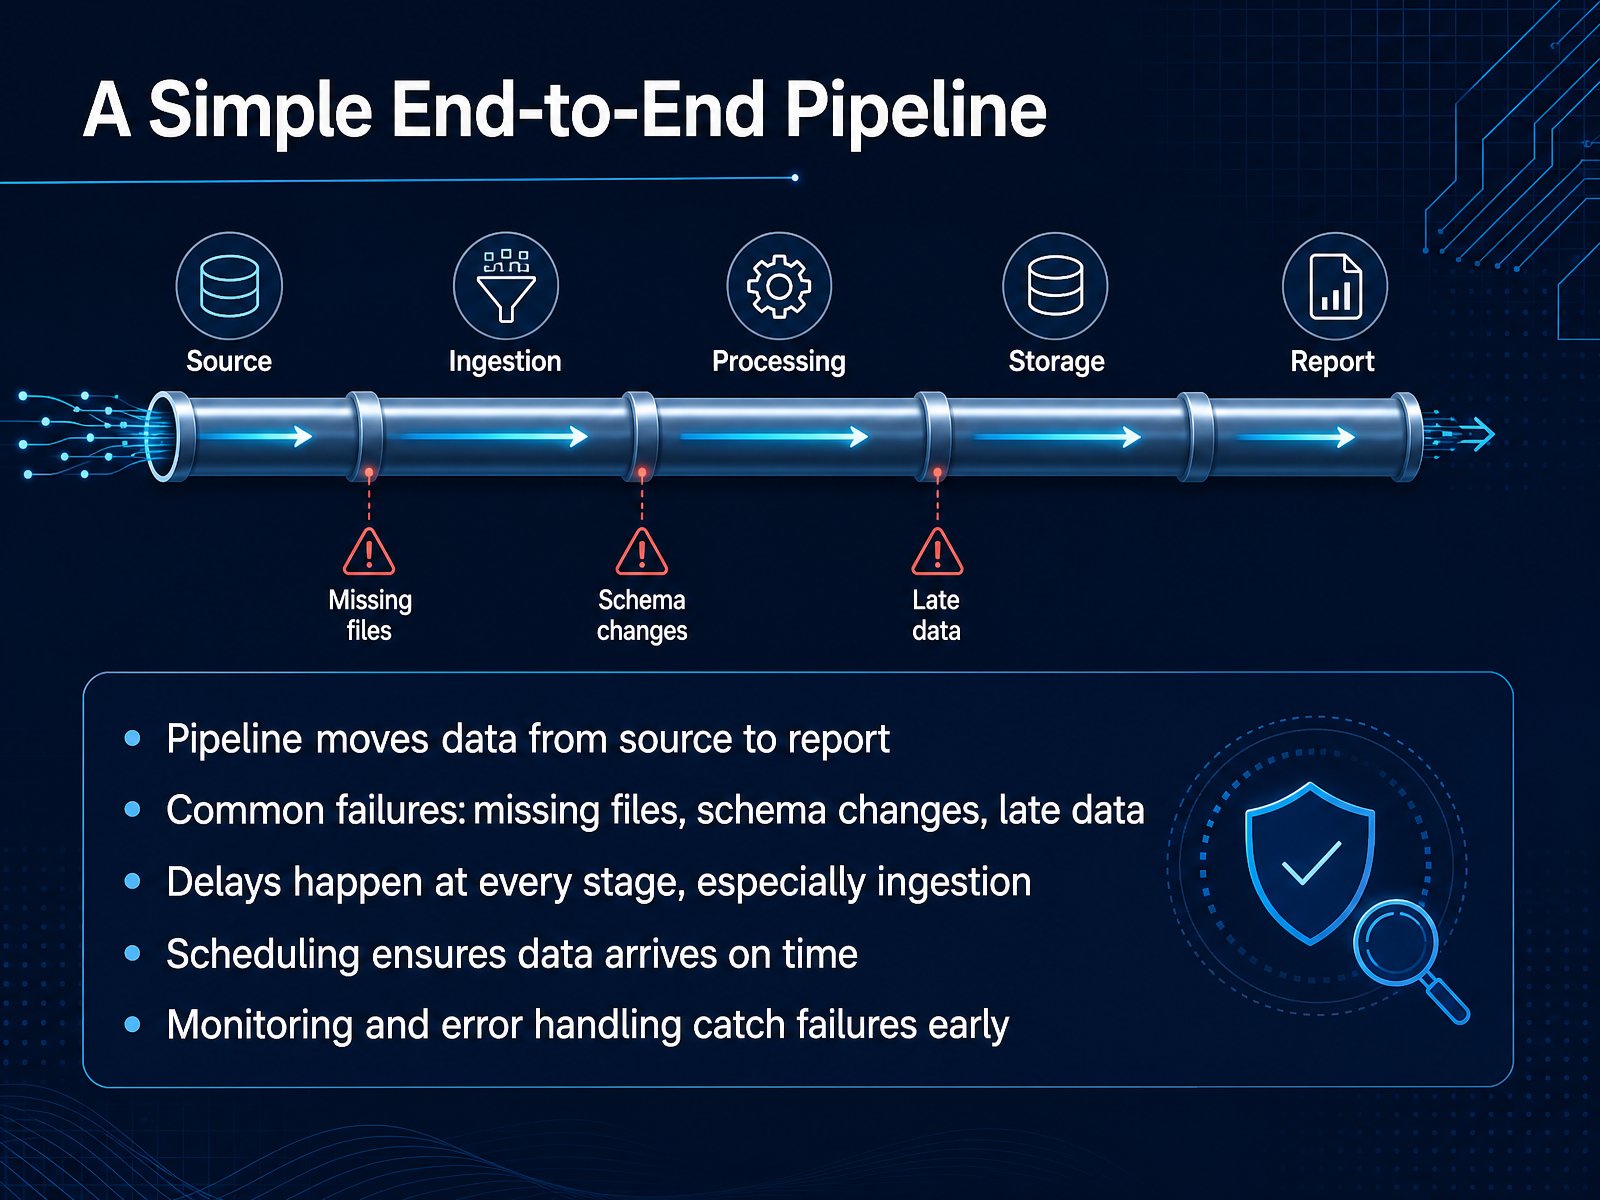
 - 05A Simple End-to-End PipelineLet's bring these pieces together and look at a simple, end-to-end pipeline. Think of it as the journey data takes, from its source all the way to a final report. At a high level, the pipeline moves data through several steps. But here is the reality check: things go wrong more often than you might expect. The file you were promised never arrives, the source system changes its format overnight, or data shows up hours late. Delays can happen at every single stage, but they are especially common right at the beginning, during ingestion, when we first pull the data in. This is why scheduling matters so much. Scheduling is simply the practice of making sure your data arrives on time, on a regular, predictable rhythm. And because failures are inevitable, we need monitoring and error handling. Monitoring alerts us the moment something goes wrong, and error handling gives the system a way to catch and recover from those problems early. So while the pipeline looks like a straight line on a diagram, in practice, it is a system built for reliability. Now that we have seen how data flows, let's talk about where it actually lives, in our next section on data storage and formats.
 databricks.combydatafix.cominfinisynapse.com+21 min
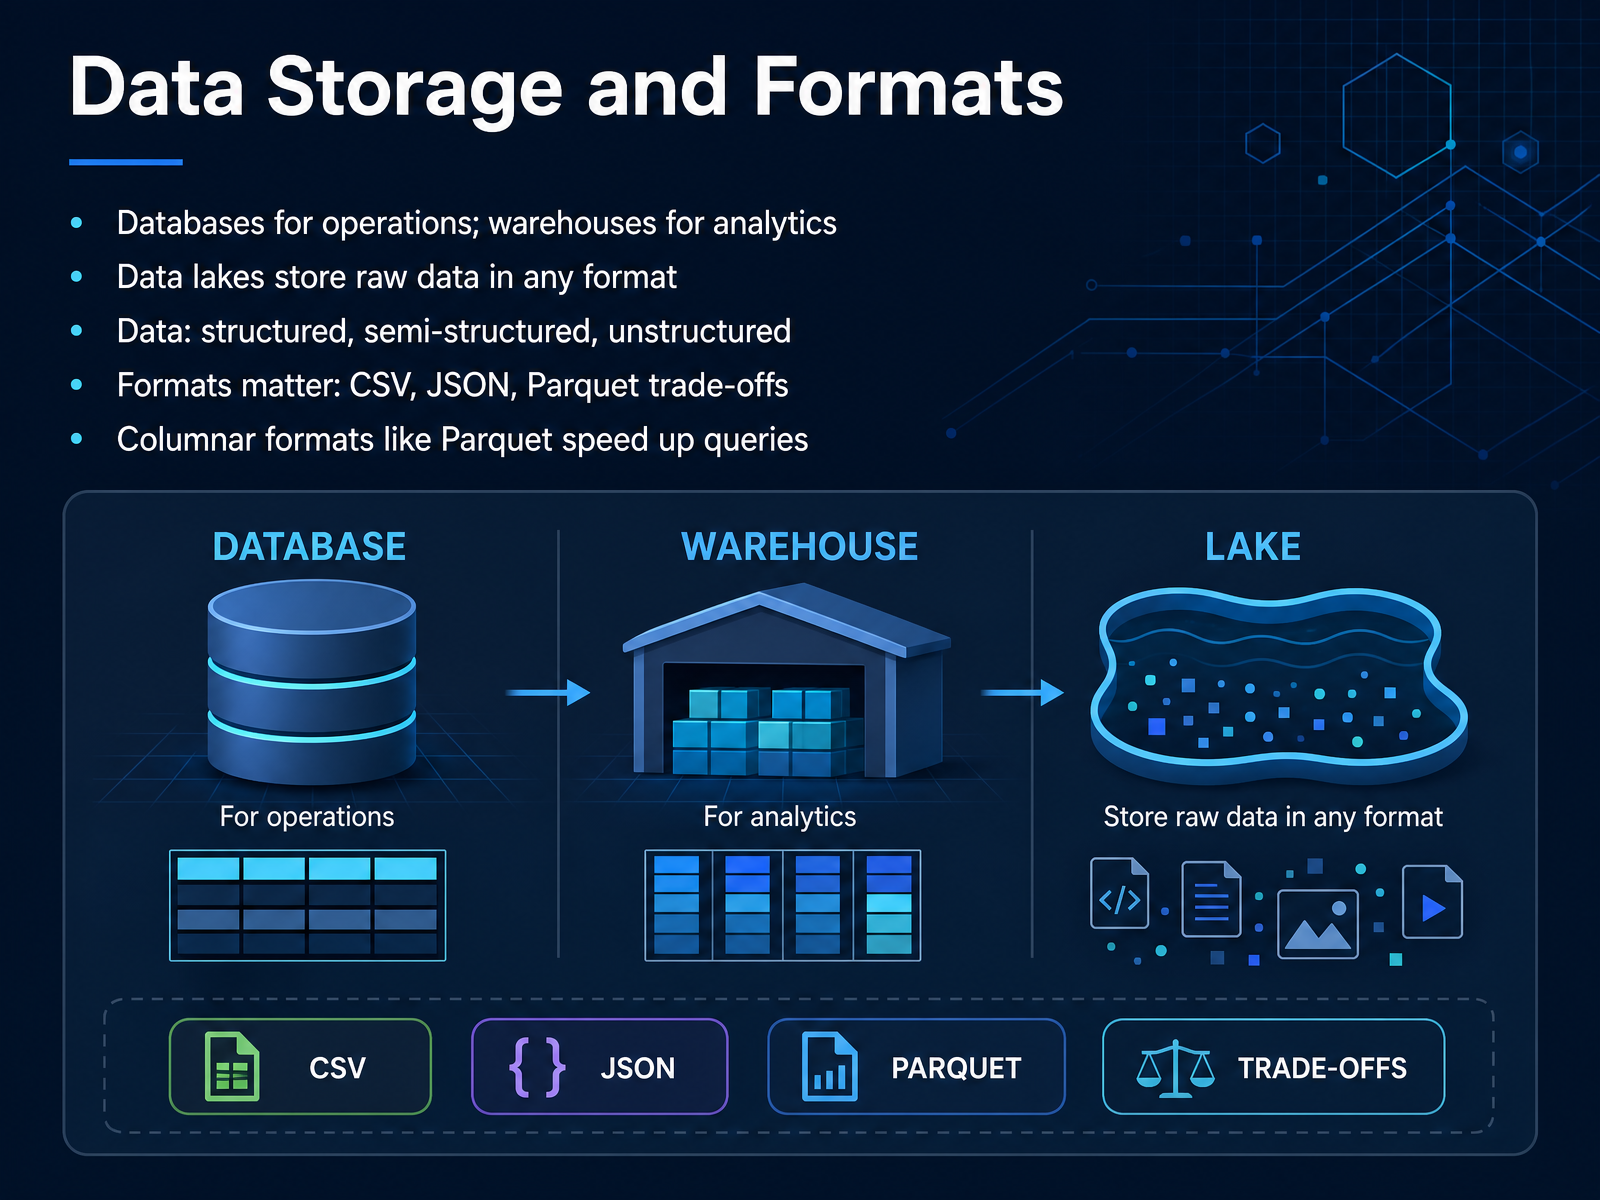
 - 06Data Storage and FormatsNow let's talk about where data actually lives and how it's stored. Think of it like organizing a kitchen. You have a fridge for ingredients you use every day, and a pantry for bulk supplies. Databases are like the fridge — they handle everyday operations, like recording each order as it comes in. Data warehouses, on the other hand, are built for analysis. They store clean, structured data so you can run big reports quickly. Then there are data lakes — these are more like the pantry. They hold raw data in any format, whether it's structured, like a spreadsheet, semi-structured, like a JSON file, or completely unstructured, like plain text or images. The format you choose matters too. CSV files are simple and human-readable, but they're slow for big queries. JSON is flexible and great for nested data. Parquet, though, is the star for analytics — it stores data in a columnar format. That means it only reads the columns you actually need, which speeds up queries dramatically. So, in practice, you might land raw data in a lake, transform it, and store the final version in a warehouse as Parquet for fast reporting. The key takeaway? Match the storage and format to the job. Next, we'll talk about how you can actually trust that data once it's there — with data quality and trust.
 databricks.combydatafix.cominfinisynapse.com+22 min
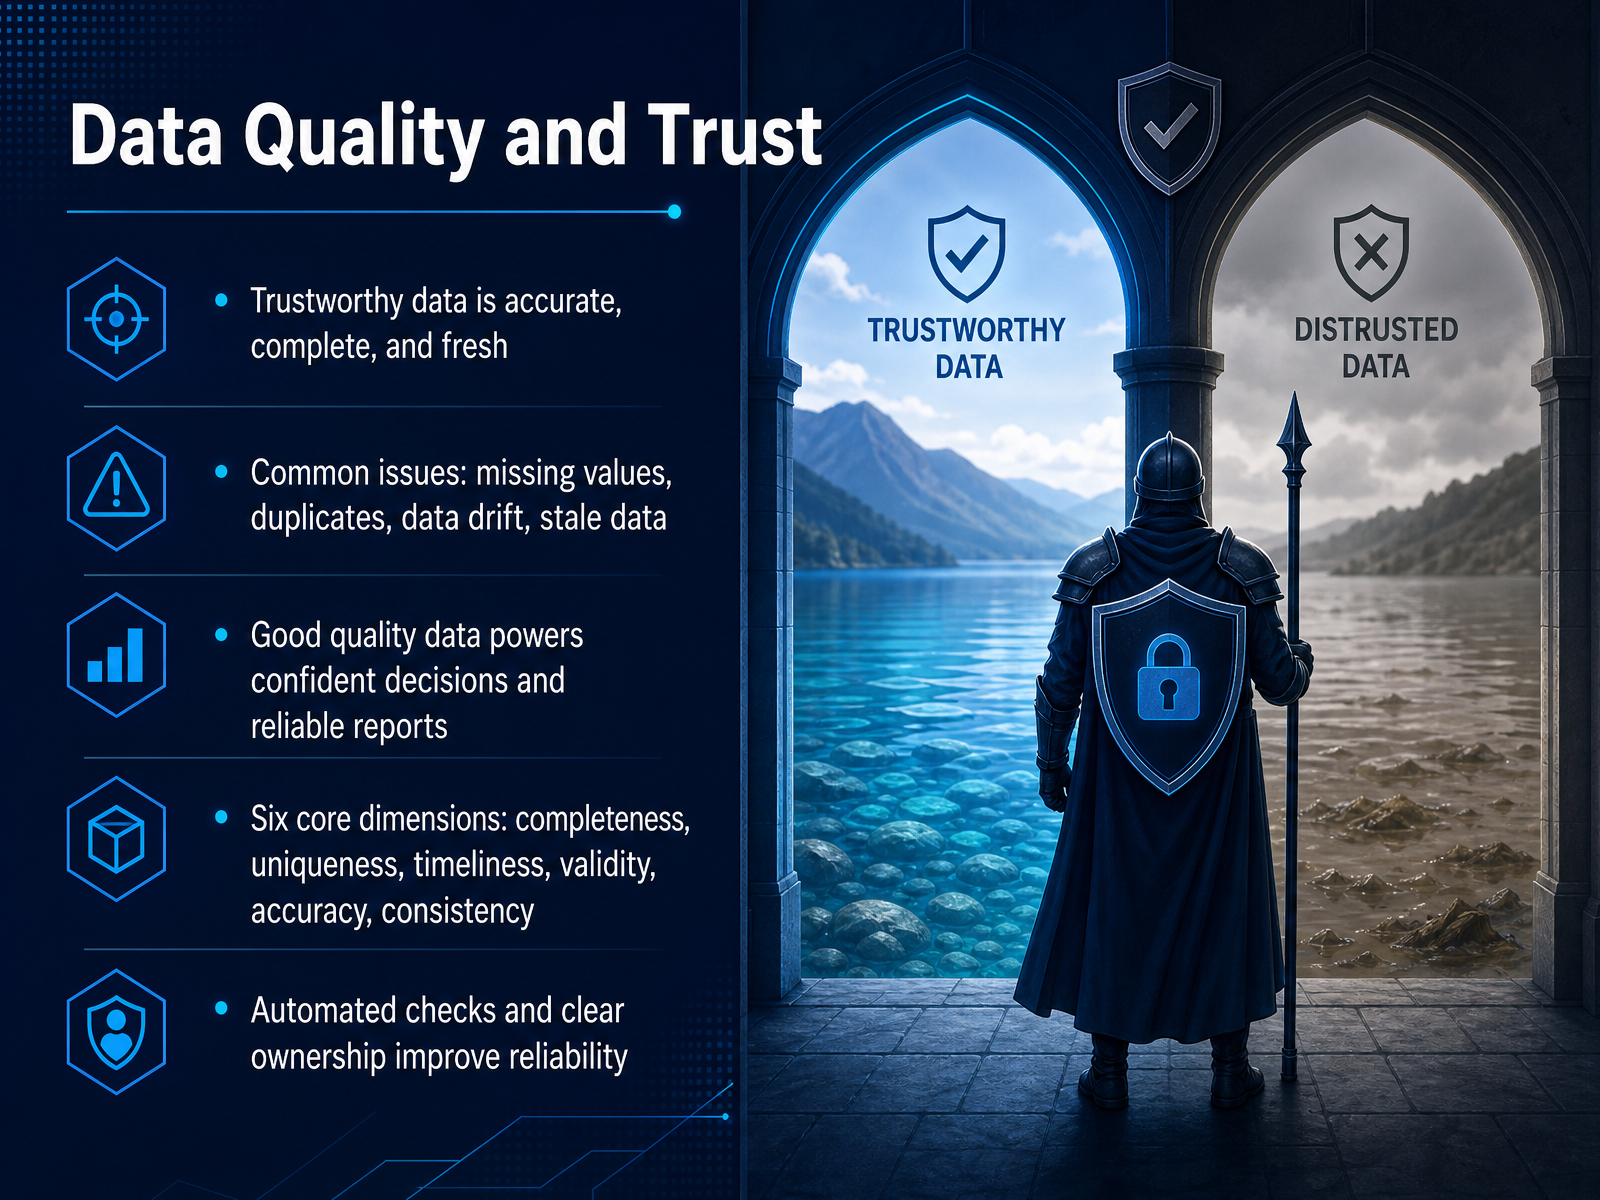
 - 07Data Quality and TrustNow let's talk about something that makes all your data work meaningful: data quality and trust. Think of data like ingredients in a recipe. If the ingredients are stale or mixed up, the final dish won't turn out right. The same goes for data. Trustworthy data is accurate, complete, and fresh. It's data you can rely on to make confident decisions and produce reports that people actually believe in. But data can run into problems. Common issues include missing values, duplicate records, data that drifts from its expected patterns over time, and stale data that's no longer current. To keep data in good shape, we look at six core dimensions. Completeness checks if anything is missing. Uniqueness makes sure there are no duplicates. Timeliness confirms the data is fresh enough. Validity ensures values follow the right format, like dates or currency. Accuracy verifies the data truly reflects reality. And consistency checks that the same fact matches across different systems. The good news is you don't have to do this manually. Automated checks can be built into your data pipelines to constantly monitor these dimensions. And clear ownership means someone is accountable when something goes wrong. When you combine these checks with clear responsibilities, you build a system people can trust. Next, we'll see how different roles work together to keep data flowing and reliable.
 prophecy.aicoalesce.iosoda.io+21 min
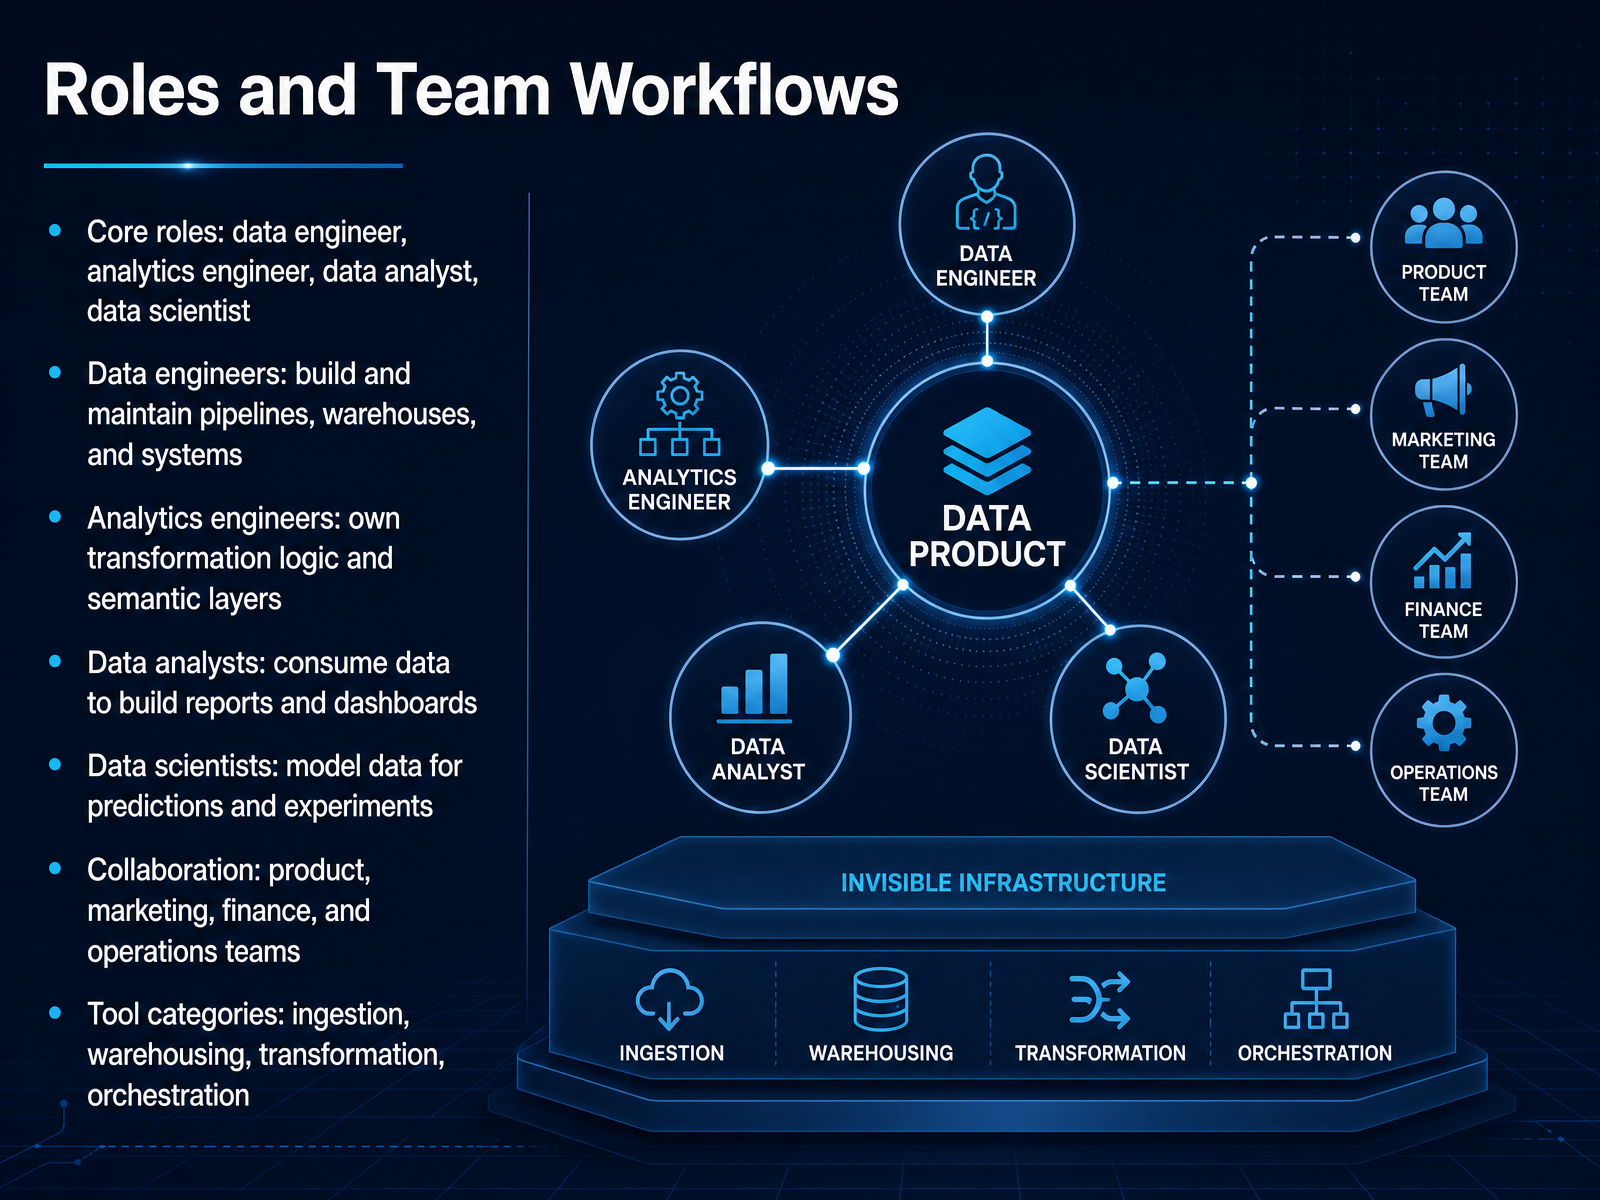
 - 08Roles and Team WorkflowsNow, let's look at how data teams actually work together. There are four core roles. Data engineers build and maintain the pipelines and warehouses that move and store data. Analytics engineers take that data and shape it into models and metrics that make business sense. Data analysts use the data to build reports and dashboards. And data scientists model the data for predictions and experiments. The key idea is that each role passes work along the line. Engineers deliver raw material, analysts turn it into a view of the business. Your team is not just these four roles, though. You will also work closely with product, marketing, finance, and operations. Each has questions that data answers. To support all of them, your team relies on a stack of tools. Ingestion tools pull data in. Warehouses store it. Transformation tools, like dbt, shape it. And orchestrators, like Airflow, schedule the whole process. When you understand who does what and which tool handles which step, you start seeing the bigger picture of data engineering in practice.
 dev.todqlabs.aivaliotti.com+22 min
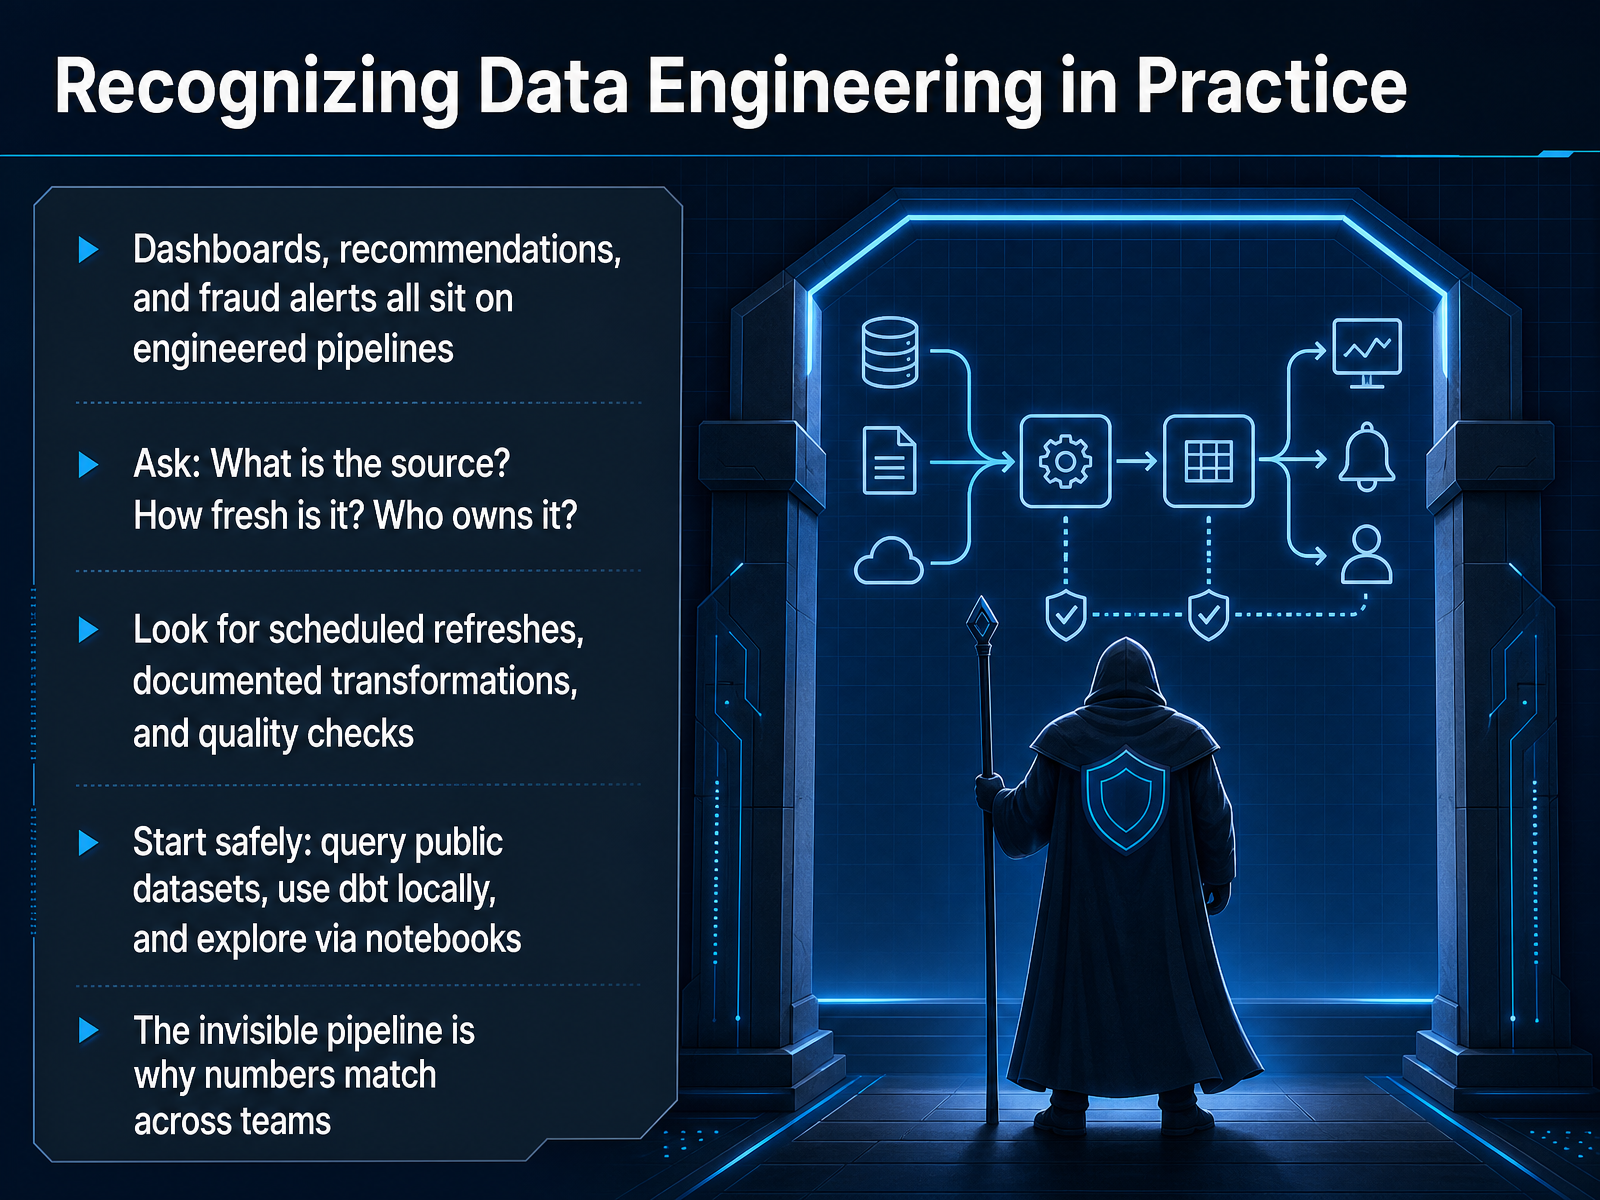
 - 09Recognizing Data Engineering in PracticeLet's bring all of this into focus. When you look at a dashboard, get a product recommendation, or receive a fraud alert, there's an engineered pipeline behind it. Data engineers are the invisible force making those numbers appear consistently across teams. Here's a simple mental exercise to recognize data engineering in the wild. Ask three questions. What is the source of this data? How fresh is it? And who owns it? The answers reveal the pipeline. Now, look for the fingerprints of good engineering. Scheduled refreshes, documented transformations, and quality checks. These are the signs of a system built for reliability, not just a one-off script. If you're eager to see this for yourself, start safely. Query public datasets, experiment with dbt on your local machine, and explore data in notebooks. This hands-on practice is how the concepts click. Remember, the best pipelines are invisible. They work so well that you don't notice them. That's the mark of solid data engineering. Next, we'll wrap up with the key takeaways and your next steps.
 dev.todqlabs.aivaliotti.com+22 min
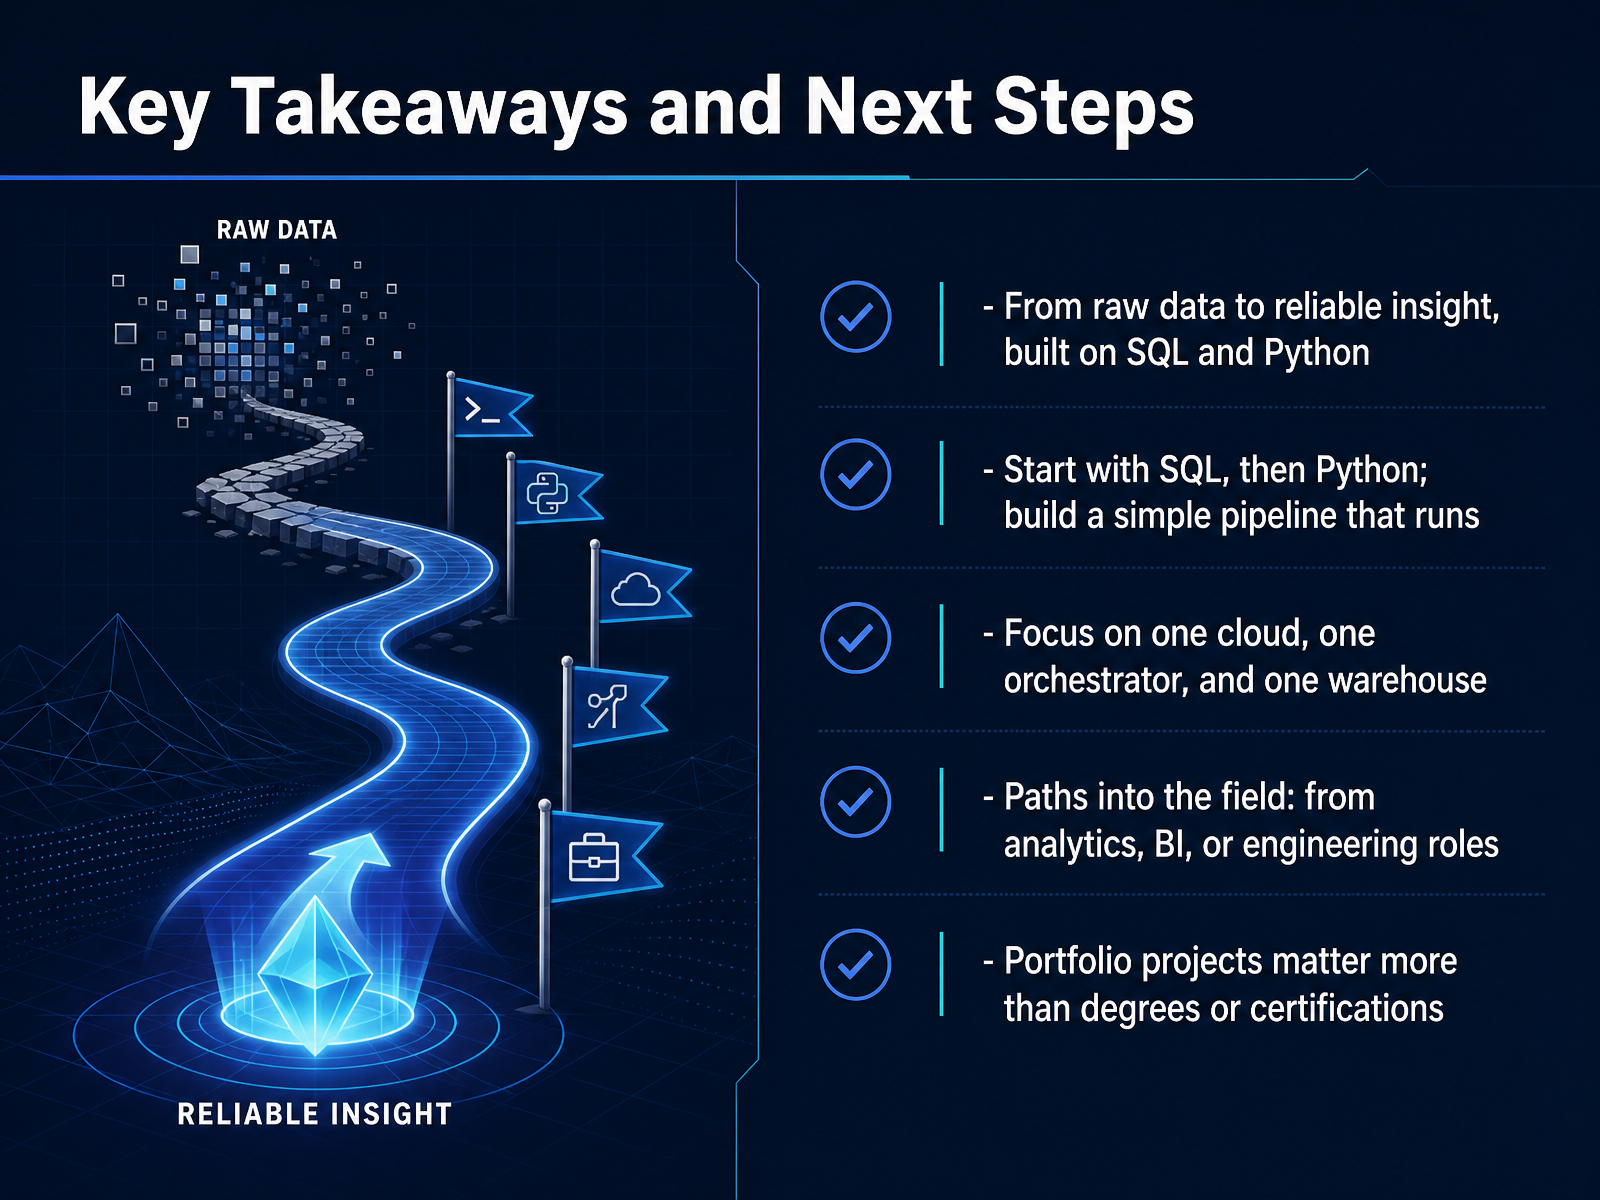
 - 10Key Takeaways and Next StepsWe've covered a lot of ground today, so let's bring it all together. Remember that the journey from raw data to reliable insight is built on two core skills: SQL and Python. Start with SQL, then add Python, and build a simple pipeline that actually runs. Don't try to learn everything at once—focus on one cloud, one orchestrator, and one warehouse. Go deep before you go wide. When you're ready to enter the field, know that there are multiple paths. You might come from analytics, business intelligence, or software engineering. Each route has its own advantages. And here's the key takeaway: portfolio projects matter more than degrees or certifications. Build something real, put it on GitHub, and let your work speak for itself. Thank you for joining me today. You have everything you need to take the first step. Start small, stay consistent, and keep building. The best time to start was yesterday—the second best time is now.
 dataquest.iodataquest.iodataskew.io+21 min
Take the deck with you
Download this course as a file — free, no sign-up needed.
- PDF handoutEvery slide page, ready to print or share.11 pages · 2.7 MBDownload
- Narrated PowerPointThe deck that presents itself — every slide carries the digital human's narration video.11 pages · 10.3 MBDownload
- PowerPoint slidesThe full deck as a .pptx — open it in PowerPoint, Keynote, or Google Slides.11 pages · 2.7 MBDownload
Free to use in your own training — please keep the PersonWise credit page at the end.
Have your own deck? Turn it into a course
Sources consulted
Web sources consulted while building this course.
- What is Data Engineering? | Databricks — databricks.com
- What Is Data Engineering? Simple Beginner's Guide (2026) — bydatafix.com
- What Is Data Engineering: Complete 2026 Guide — infinisynapse.com
- Data Engineering for Beginners: The 2026 Essential Guide — mindboxtrainings.com
- What is Data Engineering? Role, Stack, Day-in-the-Life (2026) - DEV Community — dev.to
- Building a Data Quality Framework: 2026 Guide — prophecy.ai
- Complete Guide to Data Quality: How to Improve Reliability — coalesce.io
- https://soda.io/blog/guide-data-quality-frameworks-tools-best-practices — soda.io
- How to improve data quality: 10 best practices for 2026 — rudderstack.com
- Data Quality Management: Our Ultimate Guide (For 2026) — mammoth.io
- The Data Engineer's Guide: Skills, Tools & What's Changing in 2026 — dqlabs.ai
- Data Engineer Roadmap 2026: Skills, Tools, Pay | Valiotti Data — valiotti.com
- The Data Engineering Landscape in 2026 — datavidhya.com
- Data Engineering 2026: Pipelines, Tools, and Career Guide — precisionaiacademy.com
- How to Become a Data Engineer in 2026 — dataquest.io
- The Data Engineering Roadmap for Beginners (2026) — dataquest.io
- How to Become a Data Engineer in 2026: Complete Career Guide | dataskew.io Blog — dataskew.io
- Data Engineer Roadmap 2026: From Zero to Job-Ready (Step-by-Step) - Expert Data Engineering Roadmap | dataskew.io — dataskew.io
- Data Engineering Courses & Self-Study Roadmap (2026): From SQL to Your First DE Job - DEV Community — dev.to