Begin
14 pages · ~28 min
Reading the H-R Diagram: Classifying Stars
Learn to read and interpret the Hertzsprung-Russell diagram to classify stars by luminosity, temperature, and evolutionary stage. Ideal for astronomy students and science educators.
A digital instructor presents all 14 pages. Hold “Ask” at any point and ask out loud — the answer comes from this course. No sign-up needed.
What you’ll learn
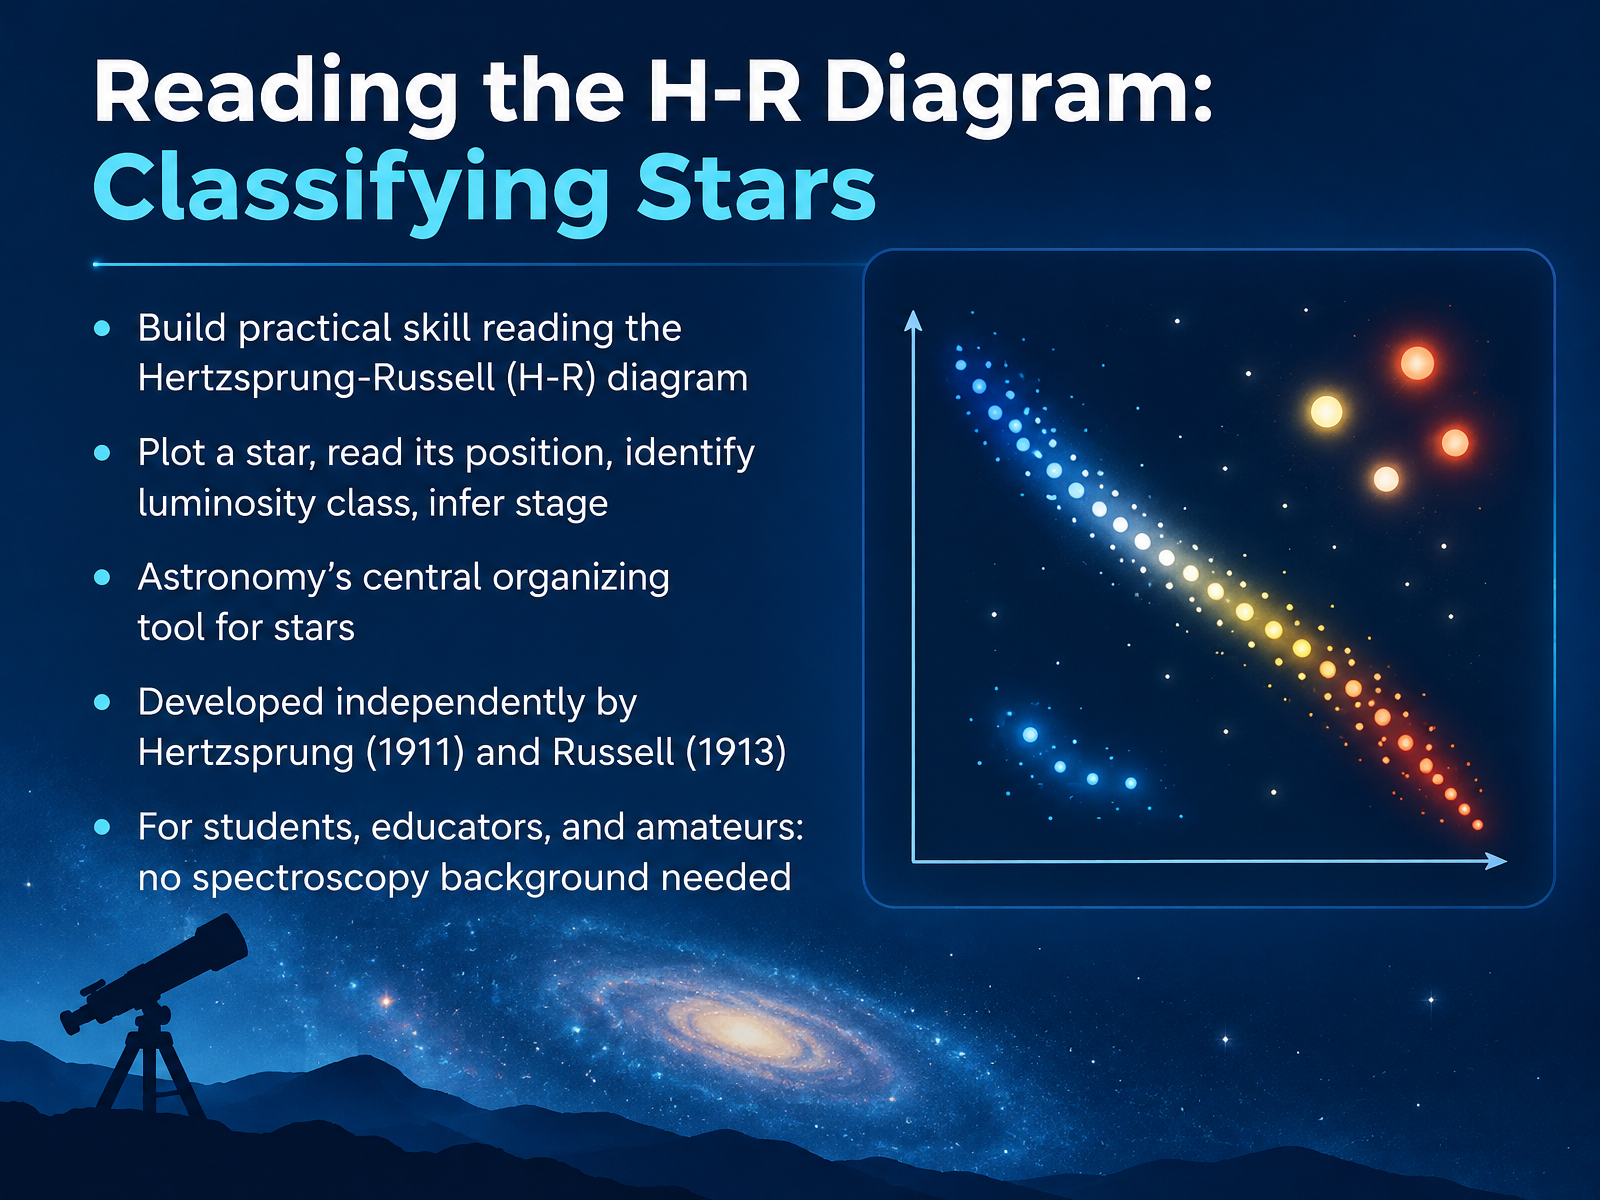
- 01Reading the H-R Diagram: Classifying StarsWelcome. I'm glad you're here, because today we're going to learn a skill that astronomers use constantly. We're going to read the Hertzsprung-Russell diagram, usually just called the H-R diagram. It's astronomy's central organizing tool for stars, a single chart that helps us make sense of how stars relate to one another.
The H-R diagram was developed independently by Ejnar Hertzsprung in nineteen eleven and Henry Norris Russell in nineteen thirteen. On this chart, we'll plot a star, read its position, identify its luminosity class, and infer what stage of life it's in. And here's the encouraging part. You don't need a background in spectroscopy. We'll define terms in plain language as we go, so anyone curious about the sky can follow along.
Let's start with why plotting stars reveals structure.openstax.orgastro.unl.eduvoyages.sdss.org+21 min
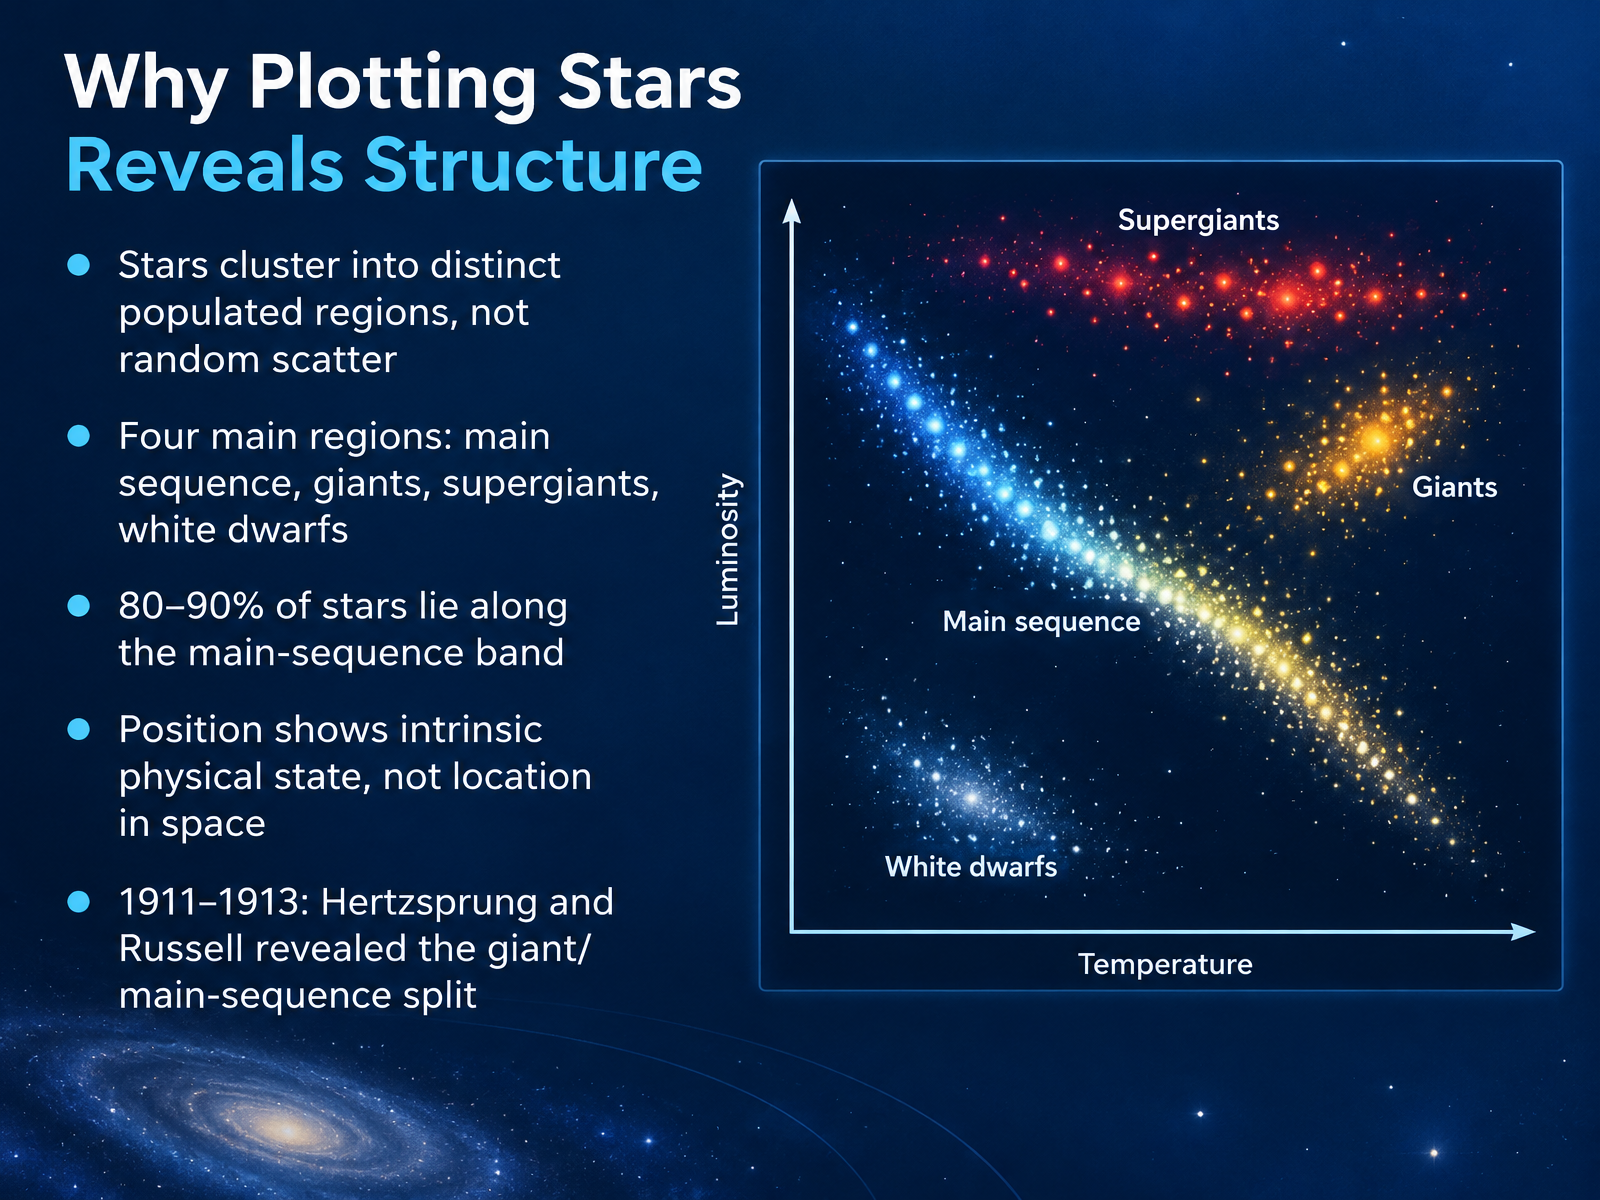
- 02Why Plotting Stars Reveals StructureSo why bother plotting stars at all? Because the pattern that emerges is anything but random. When Hertzsprung and Russell did this work between nineteen eleven and nineteen thirteen, they found that stars cluster into a few distinct populated regions rather than scattering everywhere.
The main sequence is the big diagonal band, and about eighty to ninety percent of stars live there. Above it sit the giants and supergiants, and below it, in the lower left, are the white dwarfs. Four main regions in total.
Here is the key distinction. A star's position on this chart does not show where it sits in space. It shows its intrinsic physical state, its temperature and its true brightness, and therefore its size and life stage.
So the diagram is really a map of stellar physics. Next, let's look at the axes themselves: axes and scales, temperature, luminosity, and magnitude.
 openstax.orgastro.unl.eduvoyages.sdss.org+22 min
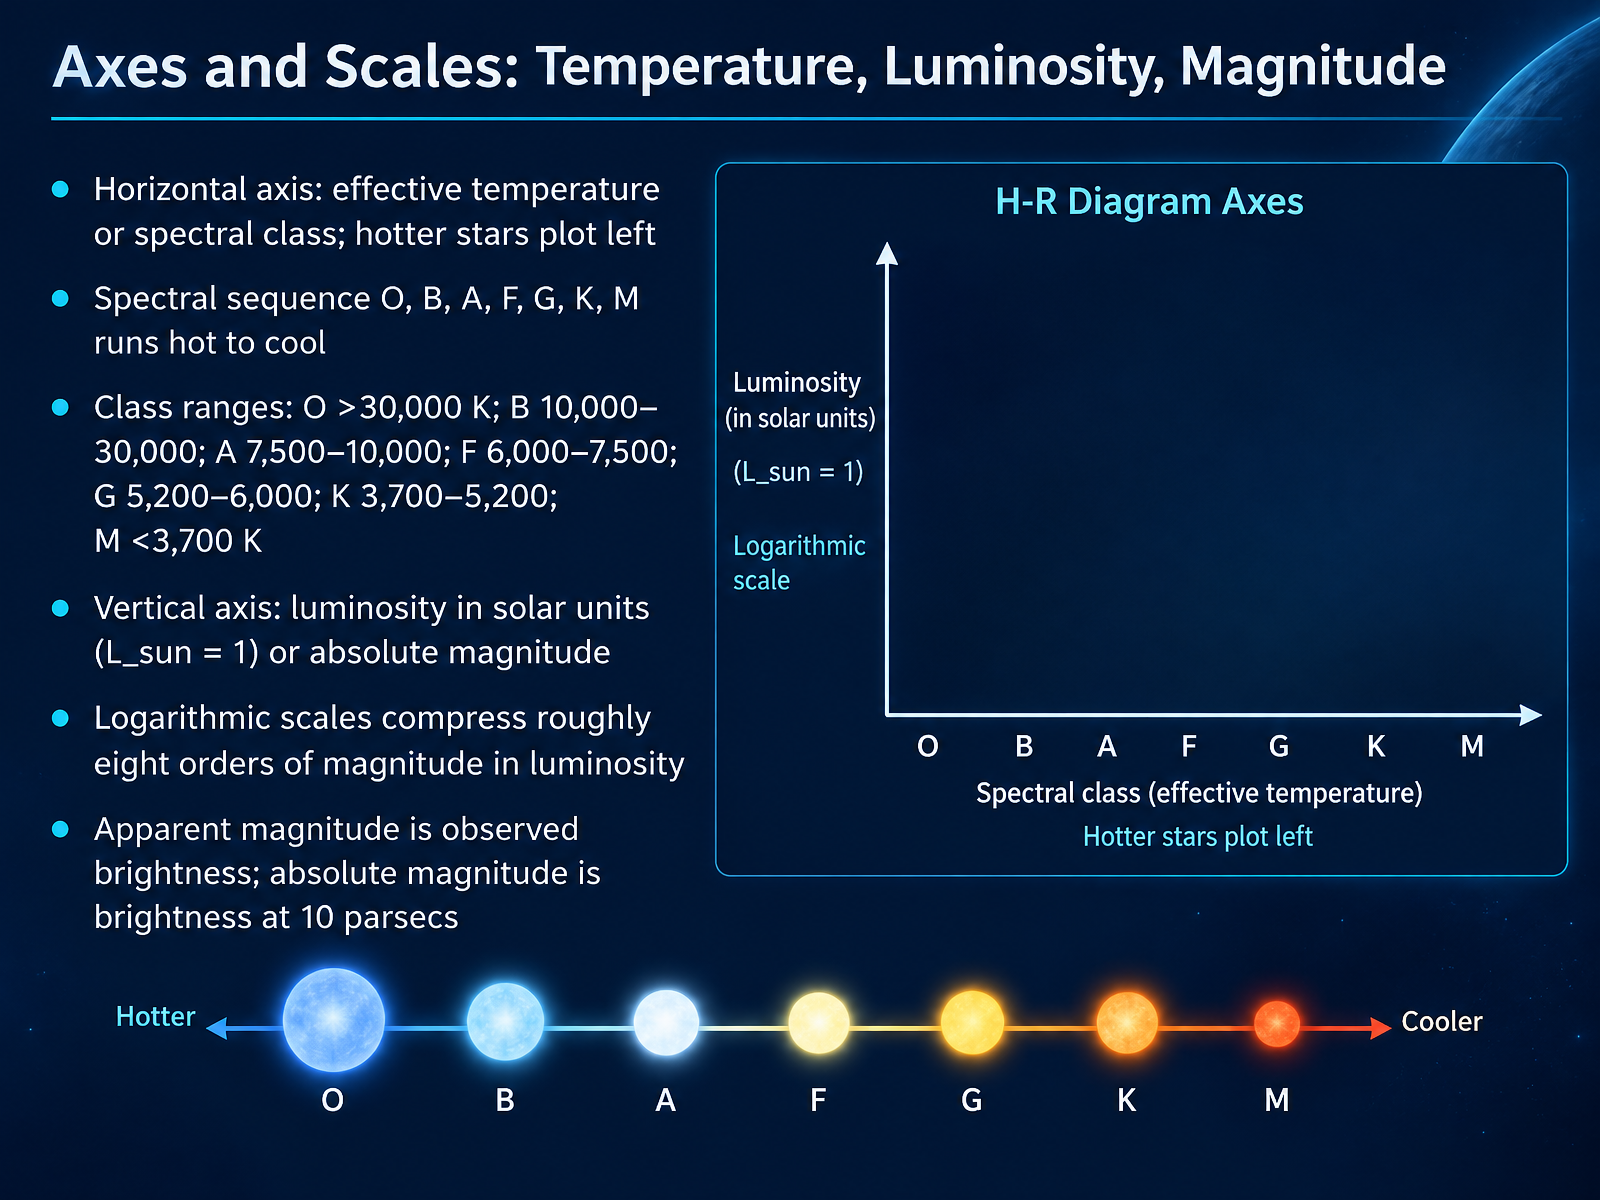
- 03Axes and Scales: Temperature, Luminosity, MagnitudeNow let's look at how the H-R diagram is actually laid out. It's a graph with two axes, and the conventions on each one take a little getting used to. Across the horizontal axis, we plot effective temperature, or its shorthand, spectral class. And here's the first quirk: hotter stars sit on the left, cooler stars on the right, so temperature runs backwards from what you might expect. The spectral sequence goes O, B, A, F, G, K, M, running from hot to cool. O stars are hotter than thirty thousand kelvin. B stars fall between ten thousand and thirty thousand. A from seventy-five hundred to ten thousand. F from six thousand to seventy-five hundred. G from fifty-two hundred to six thousand, and that's where our Sun lives. K spans thirty-seven hundred to fifty-two hundred, and M stars are cooler than thirty-seven hundred kelvin. On the vertical axis, we plot luminosity in solar units, where our Sun equals one, or absolute magnitude. Both use logarithmic scales, which compress roughly eight orders of magnitude of brightness into a manageable chart. And keep this distinction clear: apparent magnitude is how bright a star looks from Earth, while absolute magnitude is how bright it would appear from ten parsecs away. Take a moment with that pair, because it comes up again. In short, position on this diagram tells you two things at once: how hot a star is, and how much light it truly gives off. Next, we'll see how stars group together on this grid in Main Sequence Stars and the Mass-Luminosity Link.
 openstax.orgastro.unl.eduvoyages.sdss.org+22 min
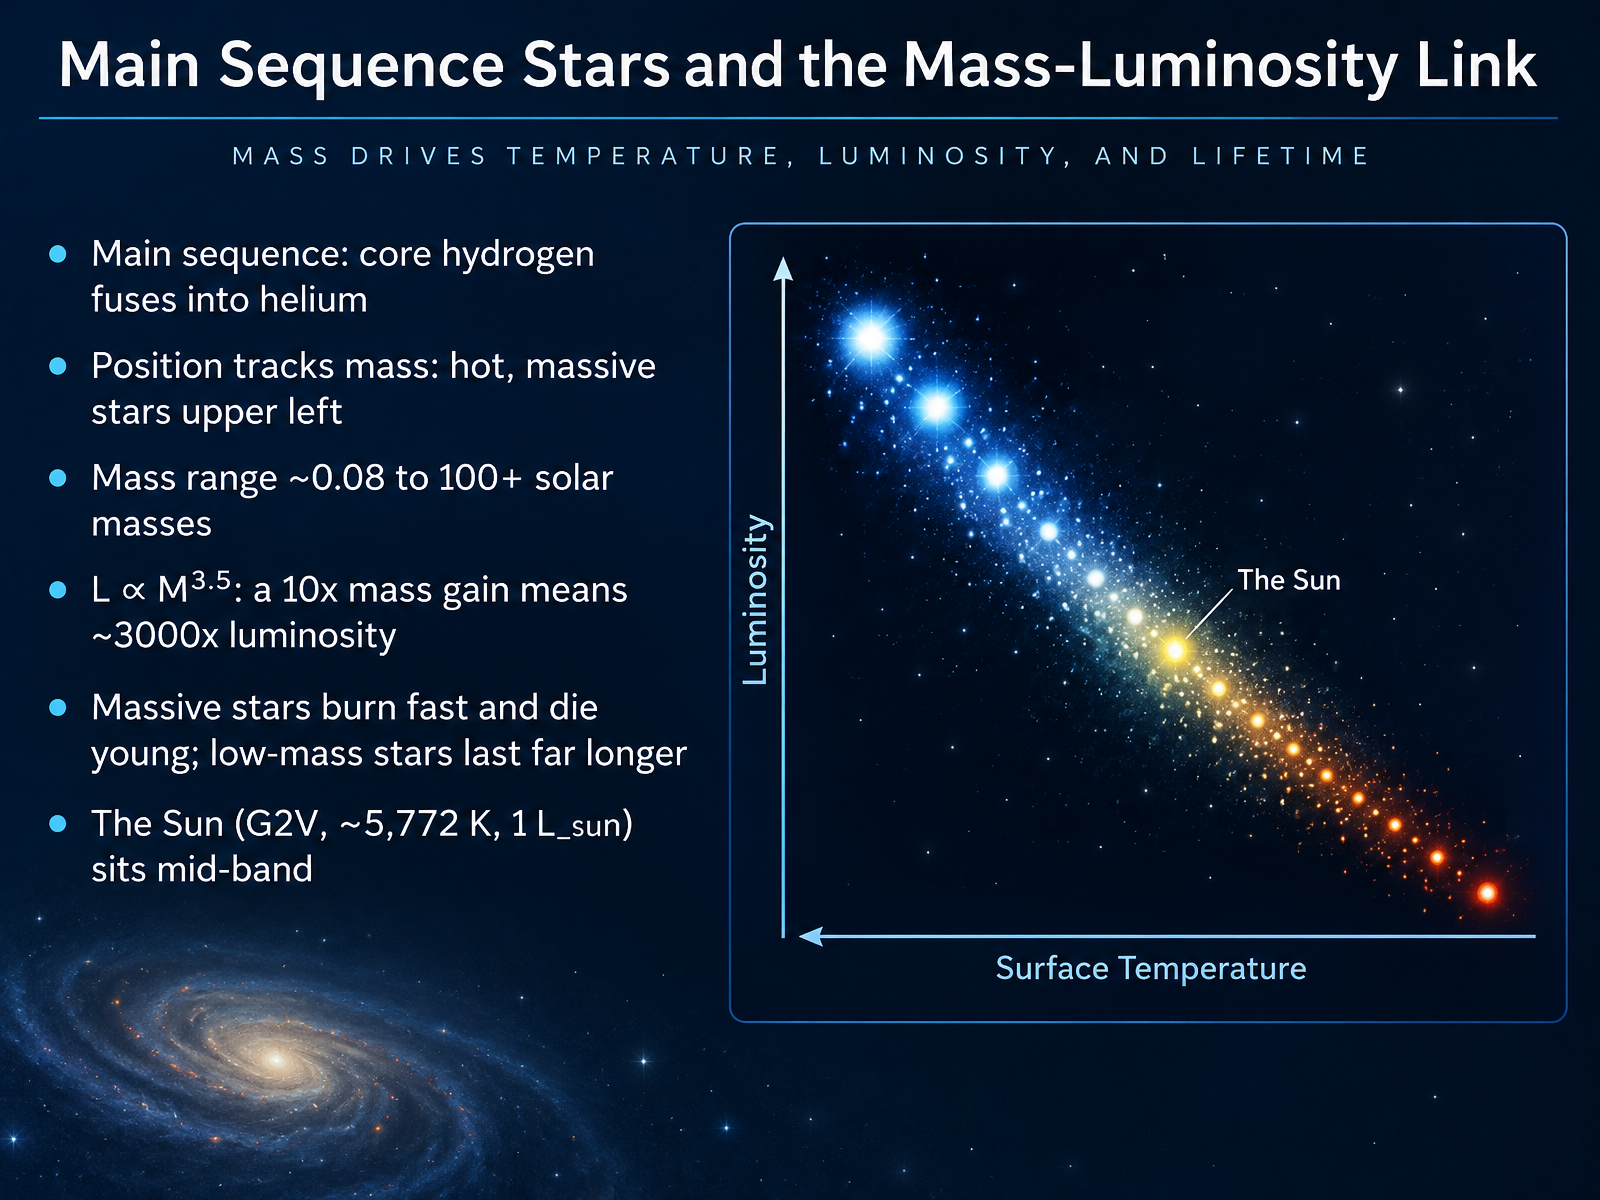
- 04Main Sequence Stars and the Mass-Luminosity LinkNow let's look at the main sequence itself, where stars spend most of their lives fusing hydrogen into helium in their cores. On the diagram, position tracks mass. The hot, massive stars sit in the upper left, and cooler, lower-mass stars fall toward the lower right. Masses run from about eight hundredths of a solar mass up to more than one hundred. Here's the key relationship: luminosity is proportional to mass raised to roughly the three and a half power. So if a star has ten times the Sun's mass, it shines about three thousand times brighter. That means massive stars burn through their fuel fast and die young, while low-mass stars last far longer. Our Sun, a G2V star at about fifty seven hundred seventy two kelvin and one solar luminosity, sits right in the middle of the band. Next, we'll move on to giants, supergiants, and white dwarfs.
 openstax.orgdoi.orgphysics.unlv.edu+21 min
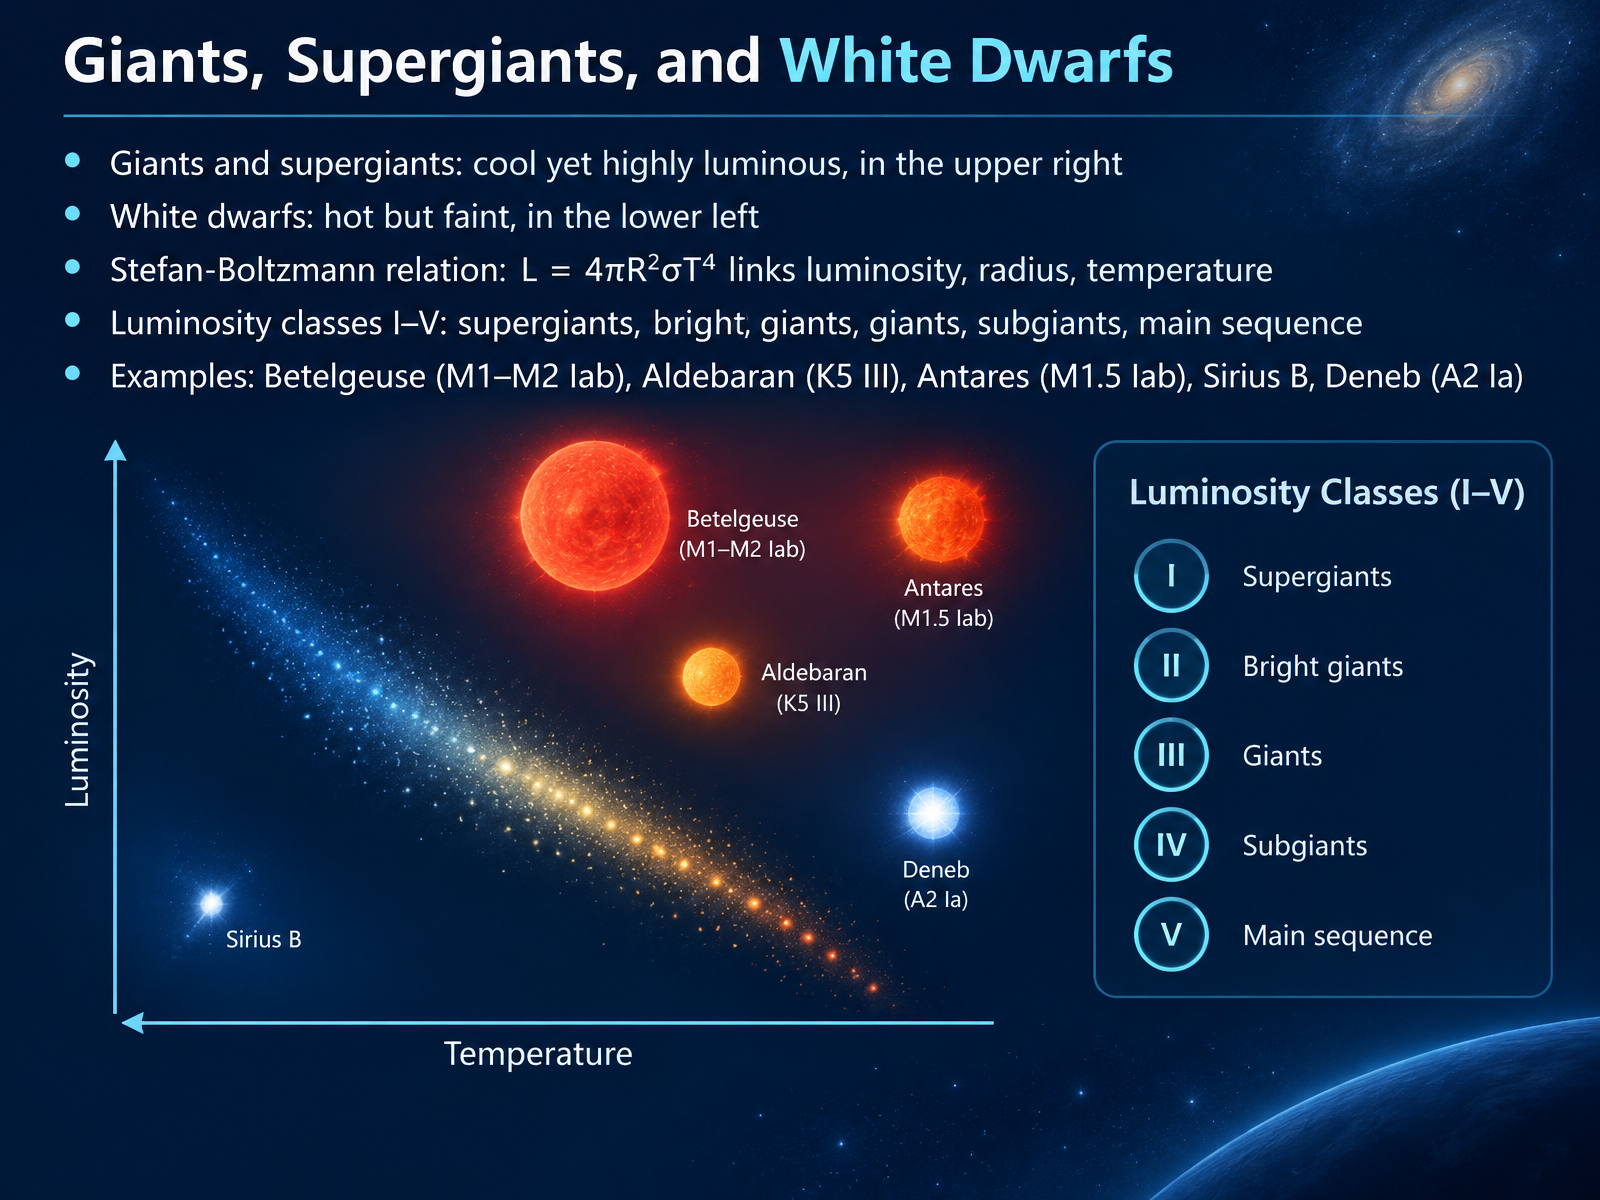
- 05Giants, Supergiants, and White DwarfsNow let's look at three unusual neighborhoods on the diagram. Giants and supergiants sit in the upper right, cool yet highly luminous. How can a cool star be so bright? Because it's enormous, with a vast surface area. White dwarfs sit in the lower left, hot but faint, because they're tiny. The Stefan-Boltzmann relation ties this together. Luminosity equals four pi times radius squared times the Stefan-Boltzmann constant times temperature to the fourth power. In plain terms, temperature matters a lot, but a bigger radius means more surface area and more total light. That's why astronomers add luminosity classes. Class one covers supergiants, two bright giants, three giants, four subgiants, and five the main sequence. Betelgeuse and Antares are class one red supergiants. Aldebaran is a class three giant. Deneb is a hot class one supergiant. And Sirius B, a white dwarf, is hot yet extremely faint. So remember, size explains the outliers. Next, we'll see how spectral lines reveal these luminosity classes. Spectral Lines and the MK Luminosity Classes.
 chandra.harvard.eduopenstax.orgcas.sdss.org+22 min
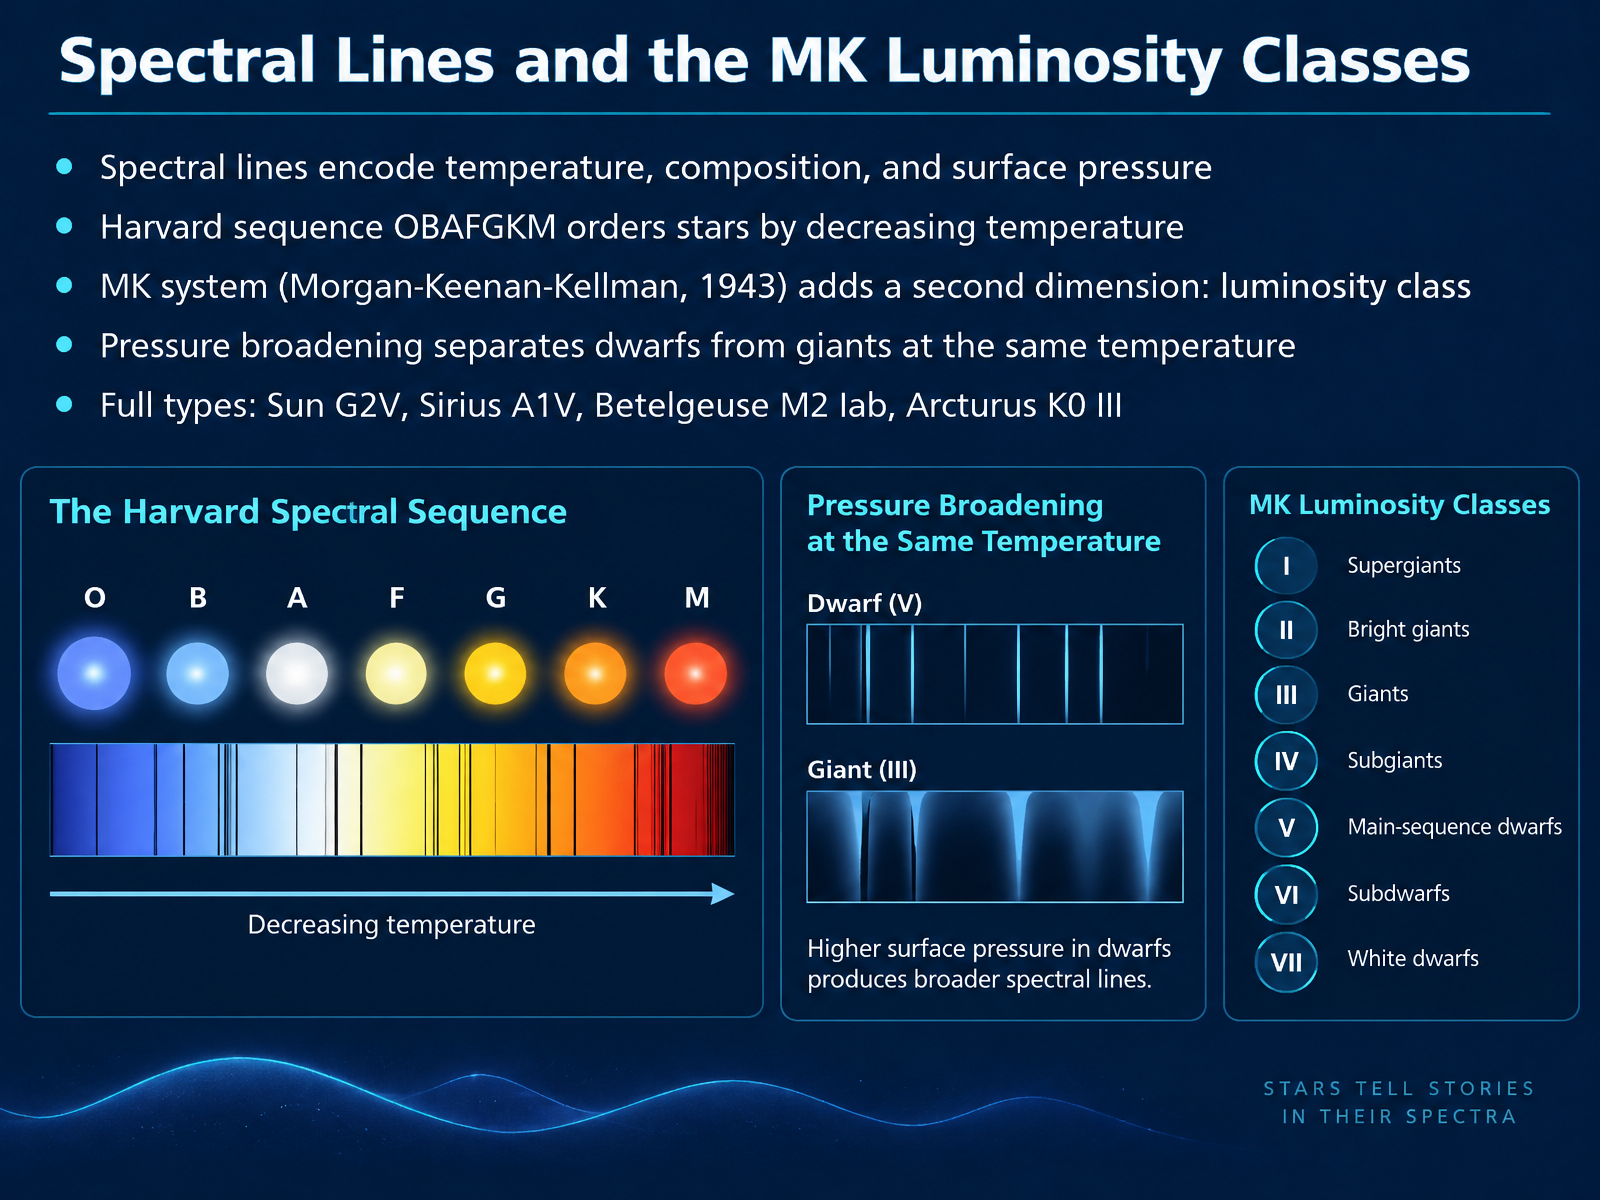
- 06Spectral Lines and the MK Luminosity ClassesNow let's go a level deeper into those spectra. A star's spectral lines carry three kinds of information at once: temperature, chemical composition, and the pressure at the surface. The classic Harvard sequence, O, B, A, F, G, K, M, ranks stars by decreasing temperature. But in 1943, Morgan, Keenan, and Kellman noticed something missing. Two stars can share the same temperature yet differ hugely in brightness. Their solution was the MK system, which adds a second dimension: luminosity class, written with Roman numerals. The key is pressure broadening. A dense, compact star has higher surface pressure, which smears its spectral lines wider. A giant star's low-pressure atmosphere produces narrow, sharp lines. So at the same temperature, line width alone separates dwarfs from giants. That is why the Sun is typed G2V, Sirius A1V, Arcturus K0 III, and Betelgeuse M2 Iab. Next, let's see how these full types get placed onto the diagram.
 ucl.ac.uken.wikipedia.orgdoi.org+22 min
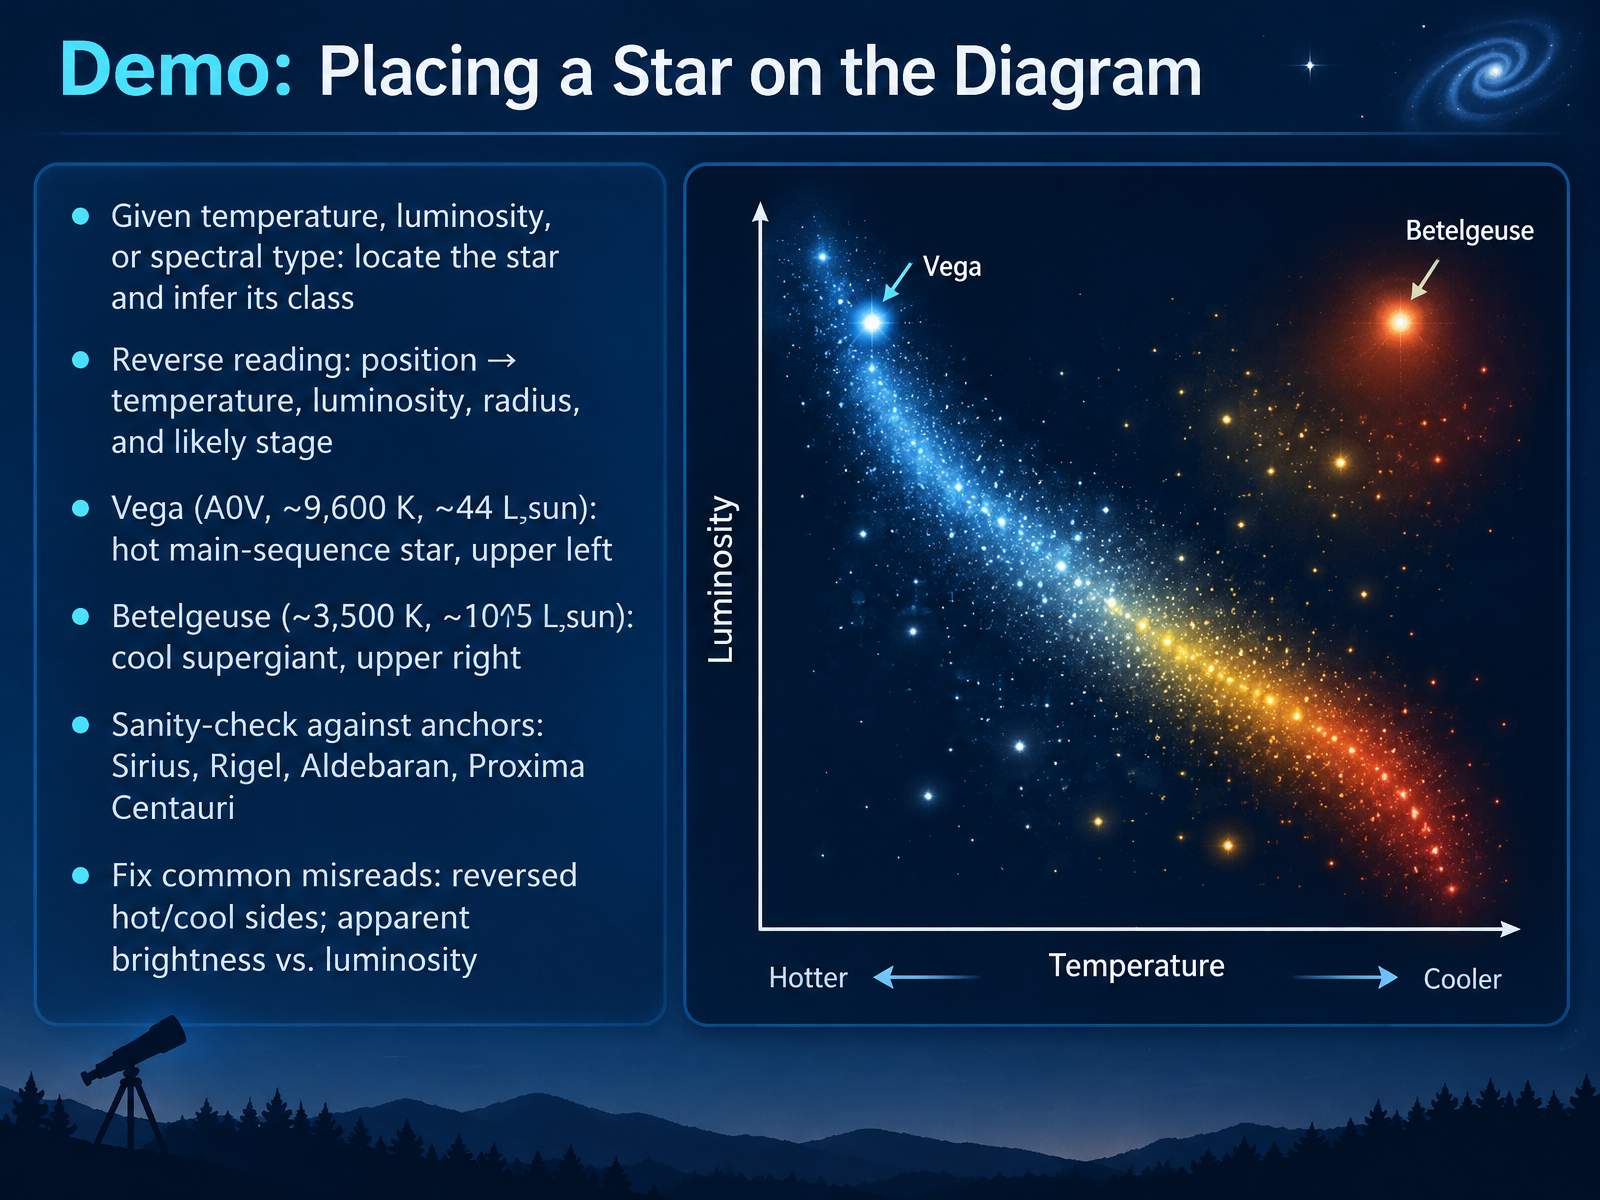
- 07Demo: Placing a Star on the DiagramLet's put that reading skill into practice by placing a few real stars on the diagram. If you are given a temperature, a luminosity, or a spectral type, your job is to locate the star and infer its class. You can also read it in reverse. From a position, you infer temperature, luminosity, radius, and likely stage. Take Vega. It is spectral type A zero, about ninety-six hundred Kelvin, and roughly forty-four times the Sun's luminosity. That places it in the upper left, a hot main-sequence star. Now Betelgeuse. Around thirty-five hundred Kelvin, but about one hundred thousand times the Sun's luminosity. That cool, bright combination puts it in the upper right as a red supergiant. Use anchors to sanity-check yourself, like Sirius, Rigel, Aldebaran, and Proxima Centauri. And watch the two common misreads: hot stars belong on the left, cool on the right, not the reverse, and apparent brightness is not the same as luminosity. Next, we look at how stars move across the diagram in evolution across the diagram.
 physics.unlv.eduvoyages.sdss.org2 min
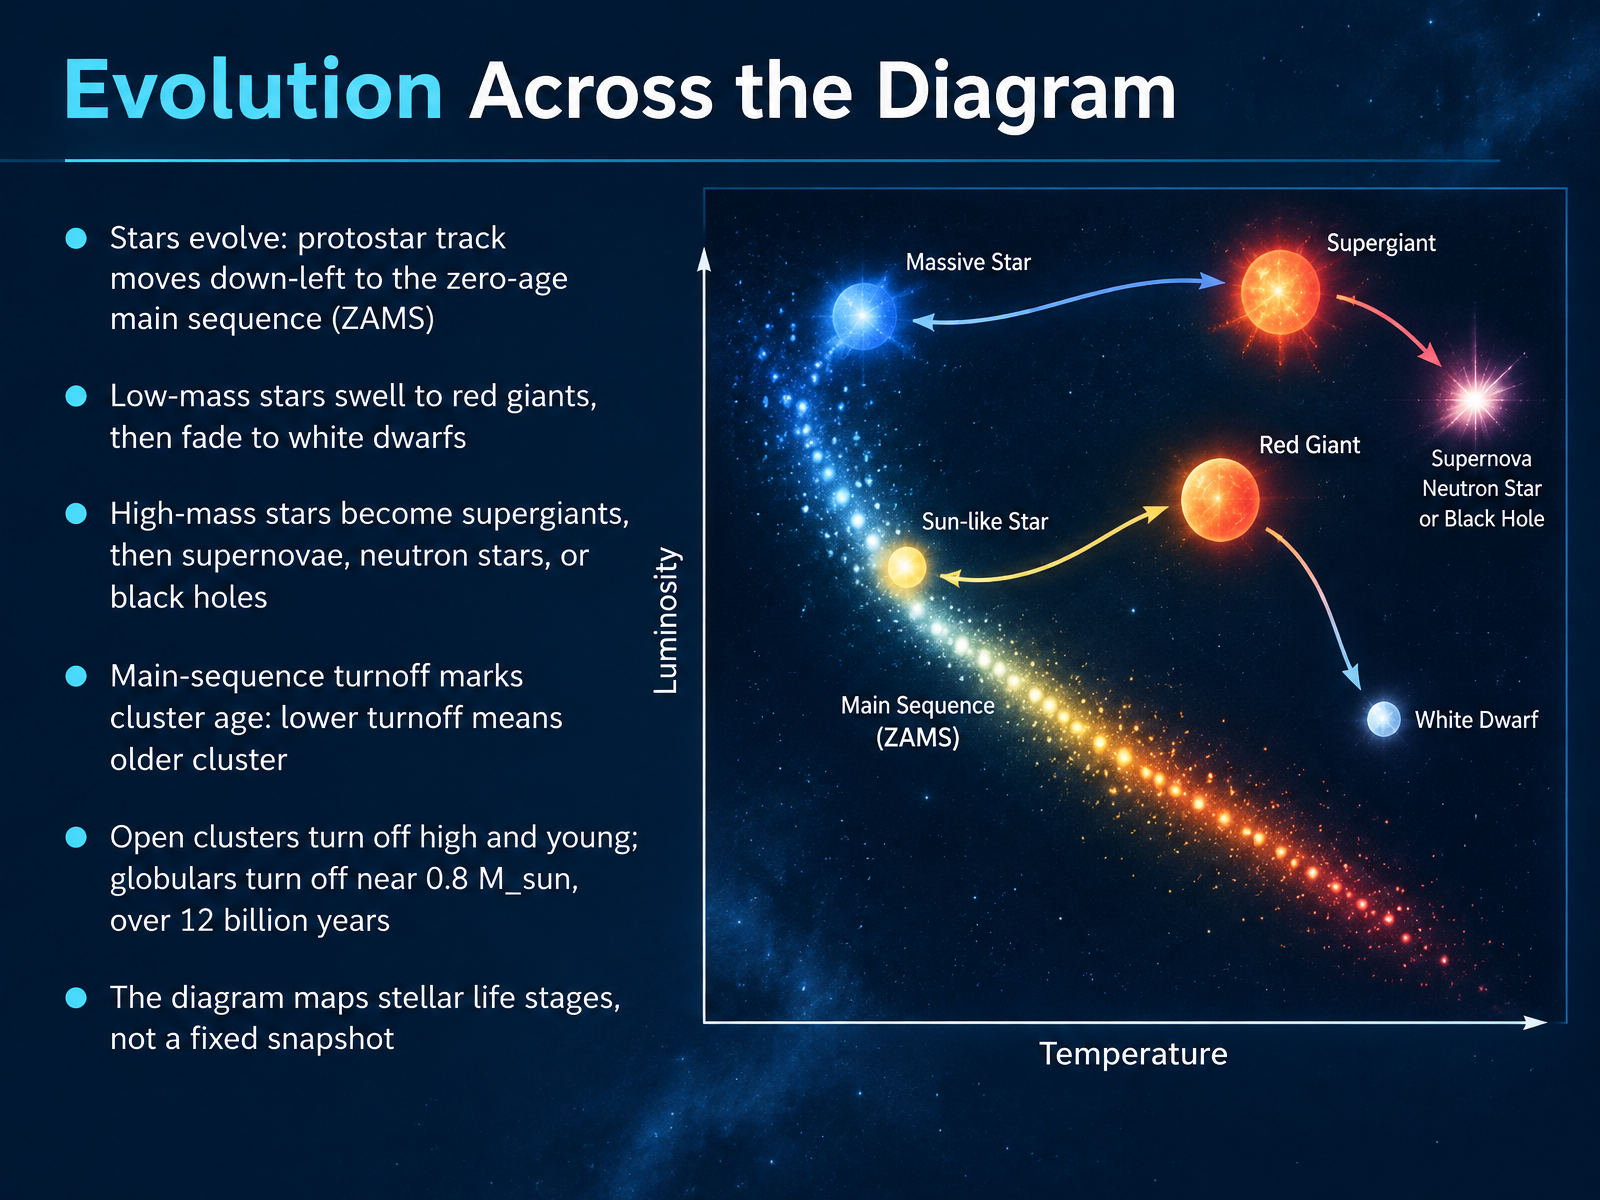
- 08Evolution Across the DiagramNow here's where the diagram really comes alive. A star's position isn't permanent. Stars evolve, and the H-R diagram can map that journey. A protostar contracts and traces a track down and to the left until it settles onto the zero-age main sequence, the ZAMS, where stable hydrogen fusion begins. After that, the path depends on mass. Low-mass stars, like our Sun, eventually swell into red giants, then fade away as white dwarfs. High-mass stars become supergiants and end dramatically, as supernovae, leaving behind neutron stars or black holes. One powerful application is cluster aging. The main-sequence turnoff is the point where stars are just leaving the main sequence. The lower that turnoff sits, the older the cluster. Young open clusters turn off high up. Globular clusters turn off near eight tenths of a solar mass, over twelve billion years old. So remember, the diagram maps life stages, not a fixed snapshot. Next, we'll look at observing with the diagram, color and brightness.
 chandra.harvard.eduopenstax.orgcas.sdss.org+22 min
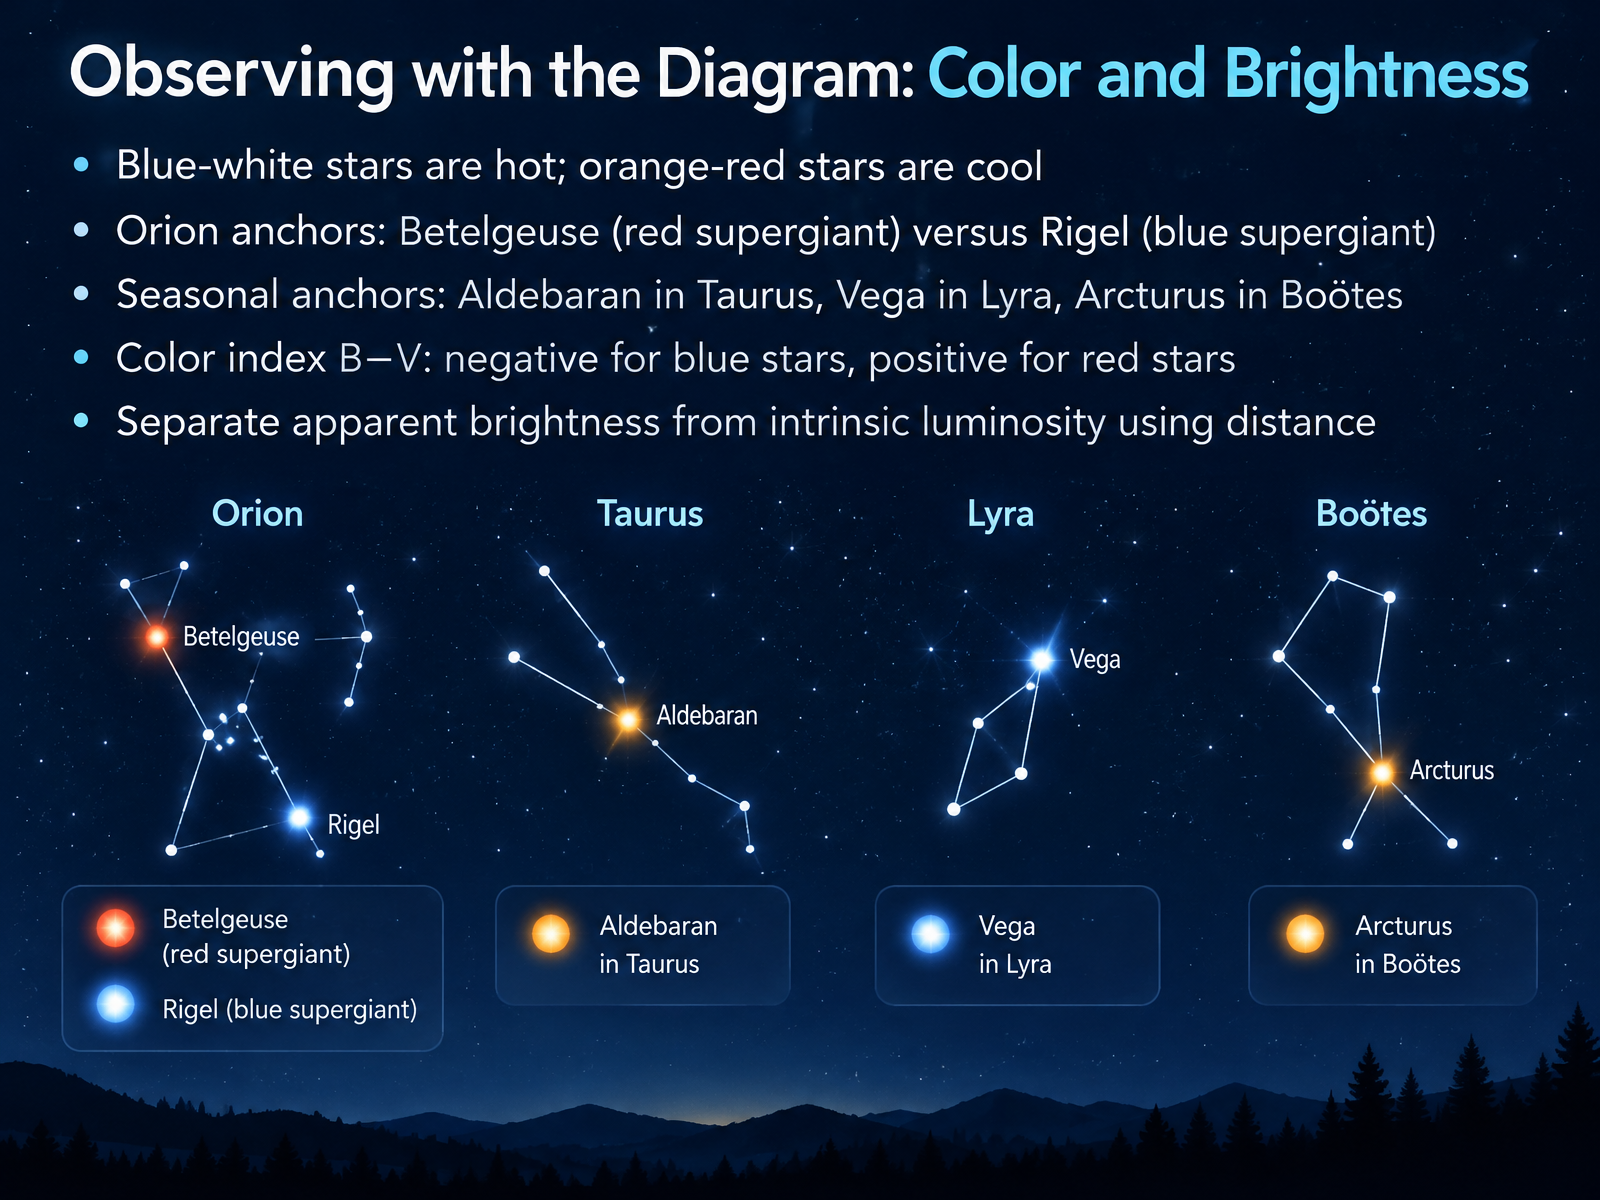
- 09Observing with the Diagram: Color and BrightnessNow let's put the diagram to practical use and read color and brightness. Star color is really a temperature signal. Blue-white stars are hot, and orange-red stars are cool. Orion gives us a beautiful contrast: Betelgeuse, a red supergiant, sits beside Rigel, a blue supergiant, in the same constellation but at very different temperatures. You can build seasonal anchors too: Aldebaran in Taurus, Vega in Lyra, and Arcturus in Boötes. Astronomers also measure color with the B minus V color index, the difference between blue and visual brightness. It is negative for blue stars and positive for red stars. Finally, keep apparent brightness separate from intrinsic luminosity. A star can look bright simply because it is close, so distance matters when we place it on the diagram. Next, we will explore teaching activities and interactive tools.
 openstax.orgastro.unl.eduvoyages.sdss.org+22 min
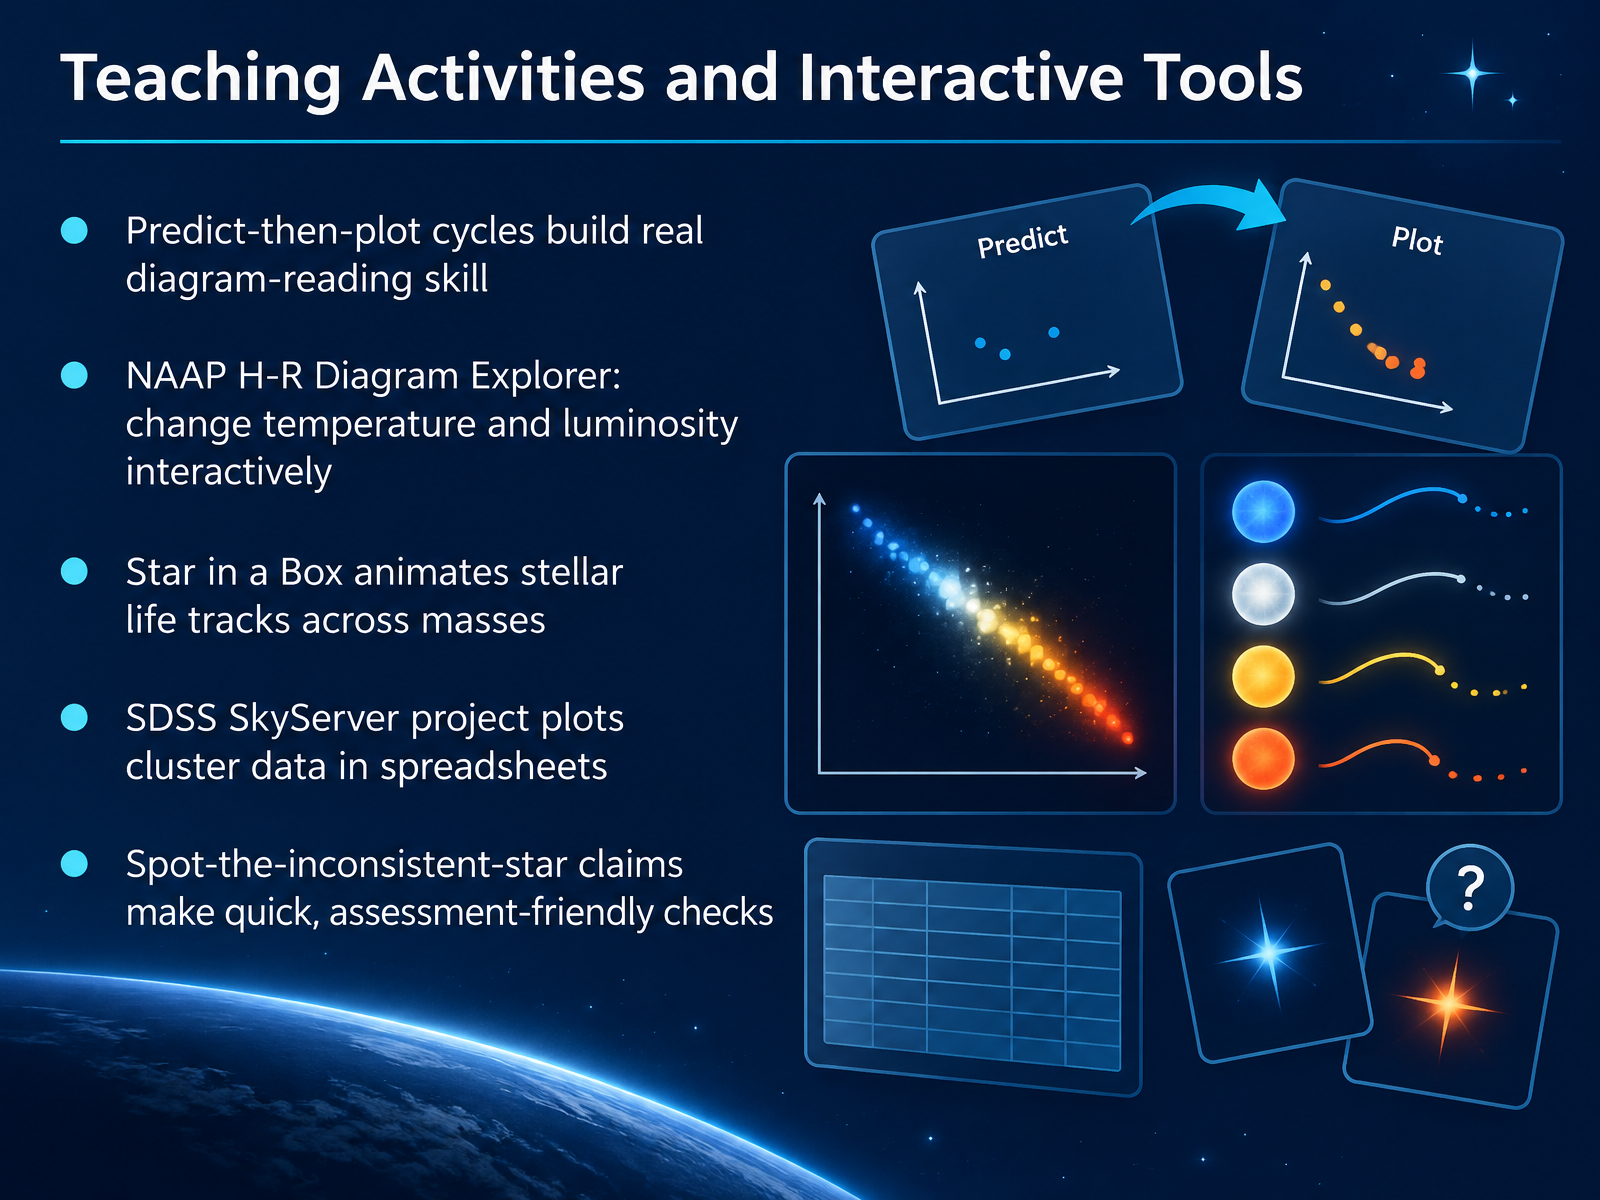
- 10Teaching Activities and Interactive ToolsSo how do we turn all of this into real diagram-reading skill? The most effective approach is a predict-then-plot cycle. Students predict where a star should land, then plot it and compare. That habit builds understanding far better than copying points from a chart. Several free tools make this easy. The NAAP H-R Diagram Explorer lets learners change a star's temperature and luminosity and watch how its position on the diagram shifts. Star in a Box animates a star's life tracks, and students can switch between different masses to see how the path changes. For real data, the SDSS SkyServer project has students pull cluster data into a spreadsheet and plot it themselves, which shows why large samples matter. And for quick checks, try a spot-the-inconsistent-star claim: give a short statement about a star's properties and let students decide whether it fits the diagram. These activities pair well together, and each one gives you a quick read on how well the concepts are landing. Now let's look at some common misconceptions and how to fix them.
 2 min
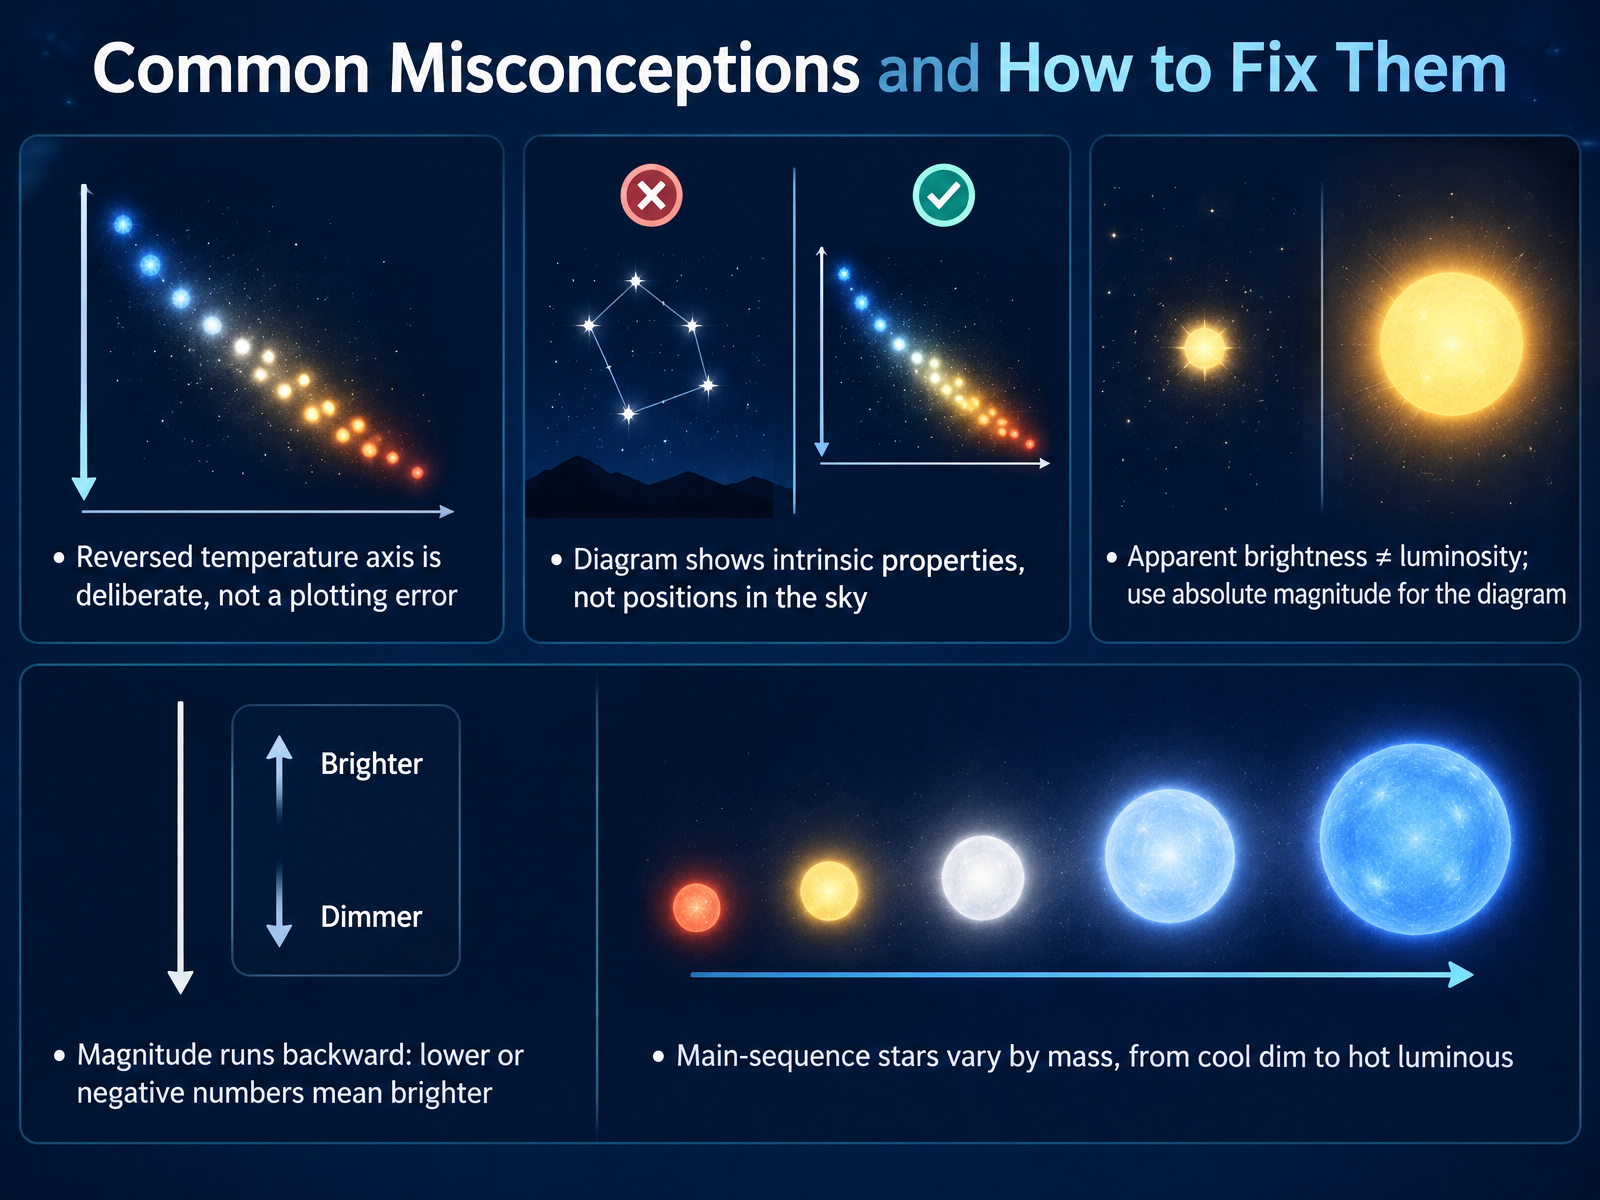
- 11Common Misconceptions and How to Fix ThemBefore we move on, let's clear up a few common misconceptions, because the H-R diagram has some conventions that can trip people up. First, the reversed temperature axis is deliberate, not a plotting error. Astronomers traditionally put hotter stars on the left and cooler stars on the right. Second, the diagram shows intrinsic properties, like surface temperature and luminosity, not where a star sits in the sky. Third, apparent brightness is not the same as luminosity. Apparent brightness depends on distance, so the diagram uses absolute magnitude instead. And remember, magnitude runs backward. A lower or more negative number means a brighter star. Finally, main-sequence stars span a range of masses, from cool, dim, low-mass stars at the lower right to hot, luminous, massive stars at the upper left. So treat these conventions as features, not mistakes. Next, let's put this into practice with Practice Set: Read, Classify, and Check.
 openstax.orgastro.unl.eduvoyages.sdss.org+21 min
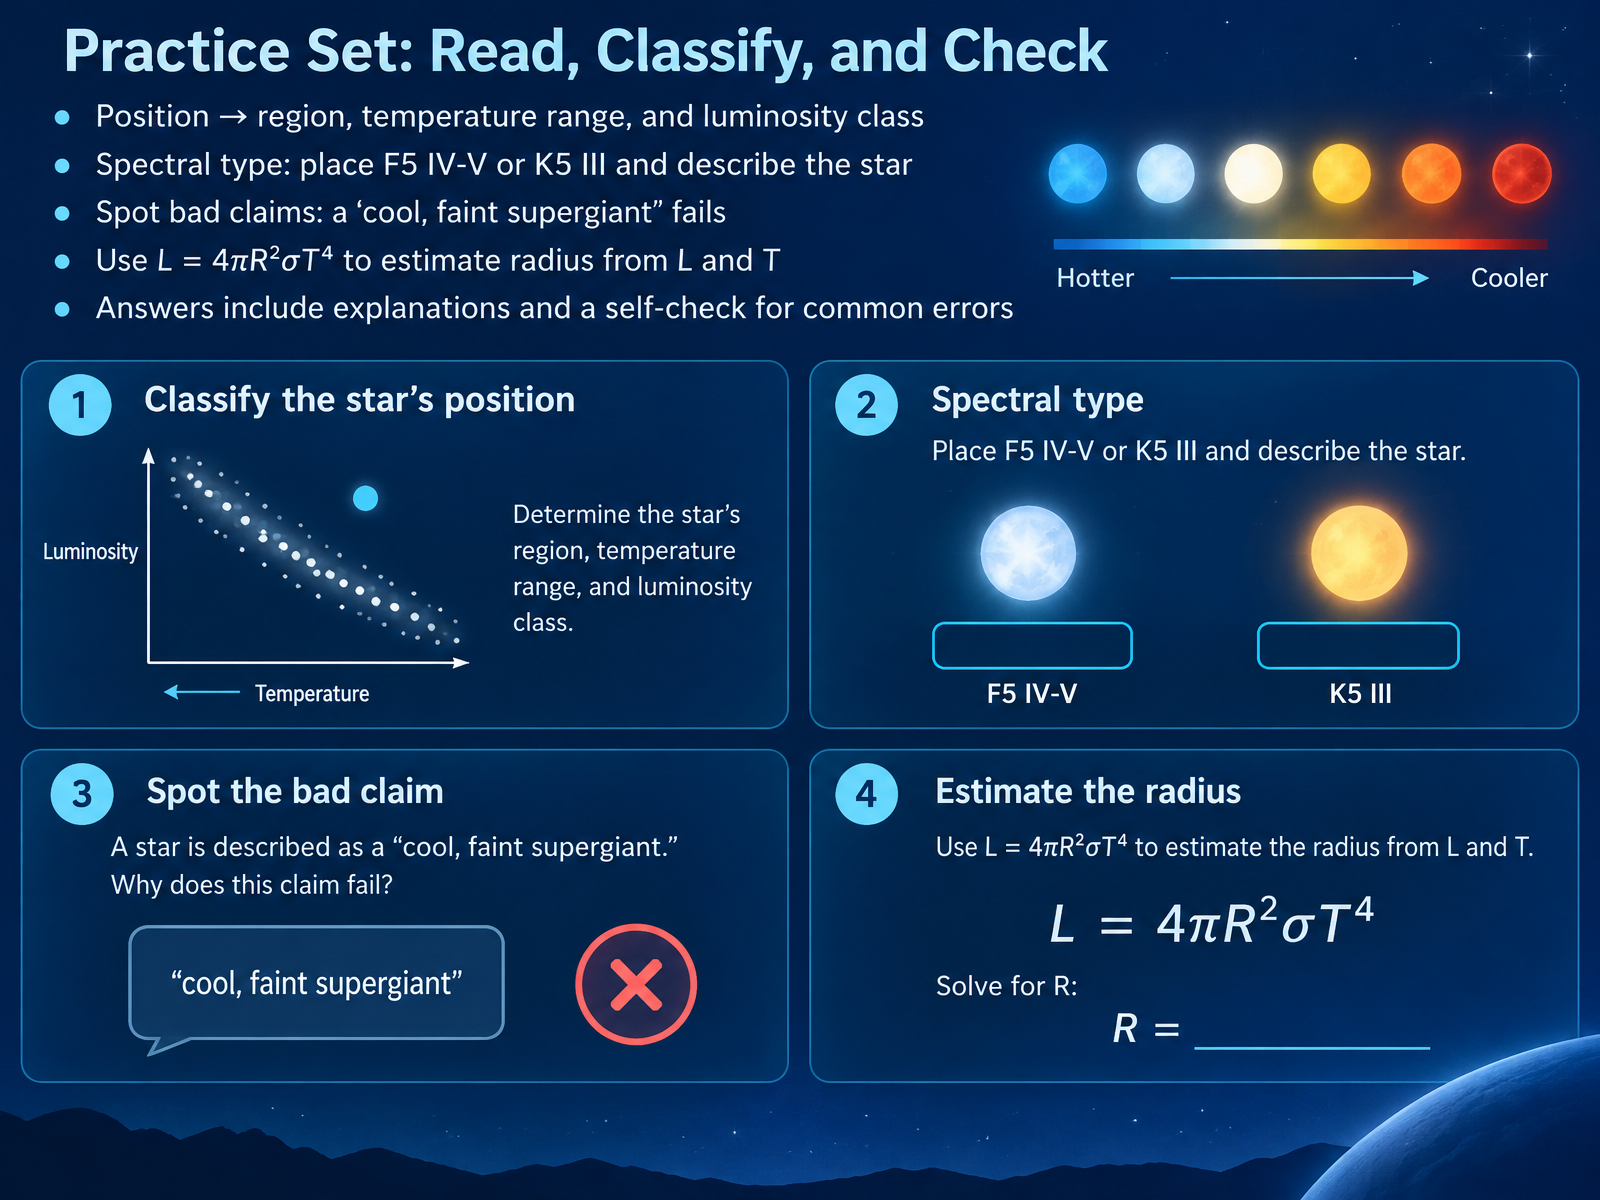
- 12Practice Set: Read, Classify, and CheckNow let's put those skills into practice. For each star, start with its position, which tells you the region, the temperature range, and the luminosity class. Take F5 IV-V, like Procyon. That's an F-type star, hotter than the Sun, sitting just between subgiant and main sequence. Now K5 III, like Aldebaran: a cooler orange giant, well off the main sequence. Next, spot bad claims. A cool, faint supergiant fails immediately, because cool supergiants are enormously luminous, not faint. Finally, use luminosity equals four pi R squared sigma T to the fourth to estimate radius from luminosity and temperature. Your answers should include explanations, plus a self-check for those common errors. Coming up next, Five Core Moves for Reading Any H-R Diagram.
 physics.unlv.eduvoyages.sdss.orgucl.ac.uk+21 min
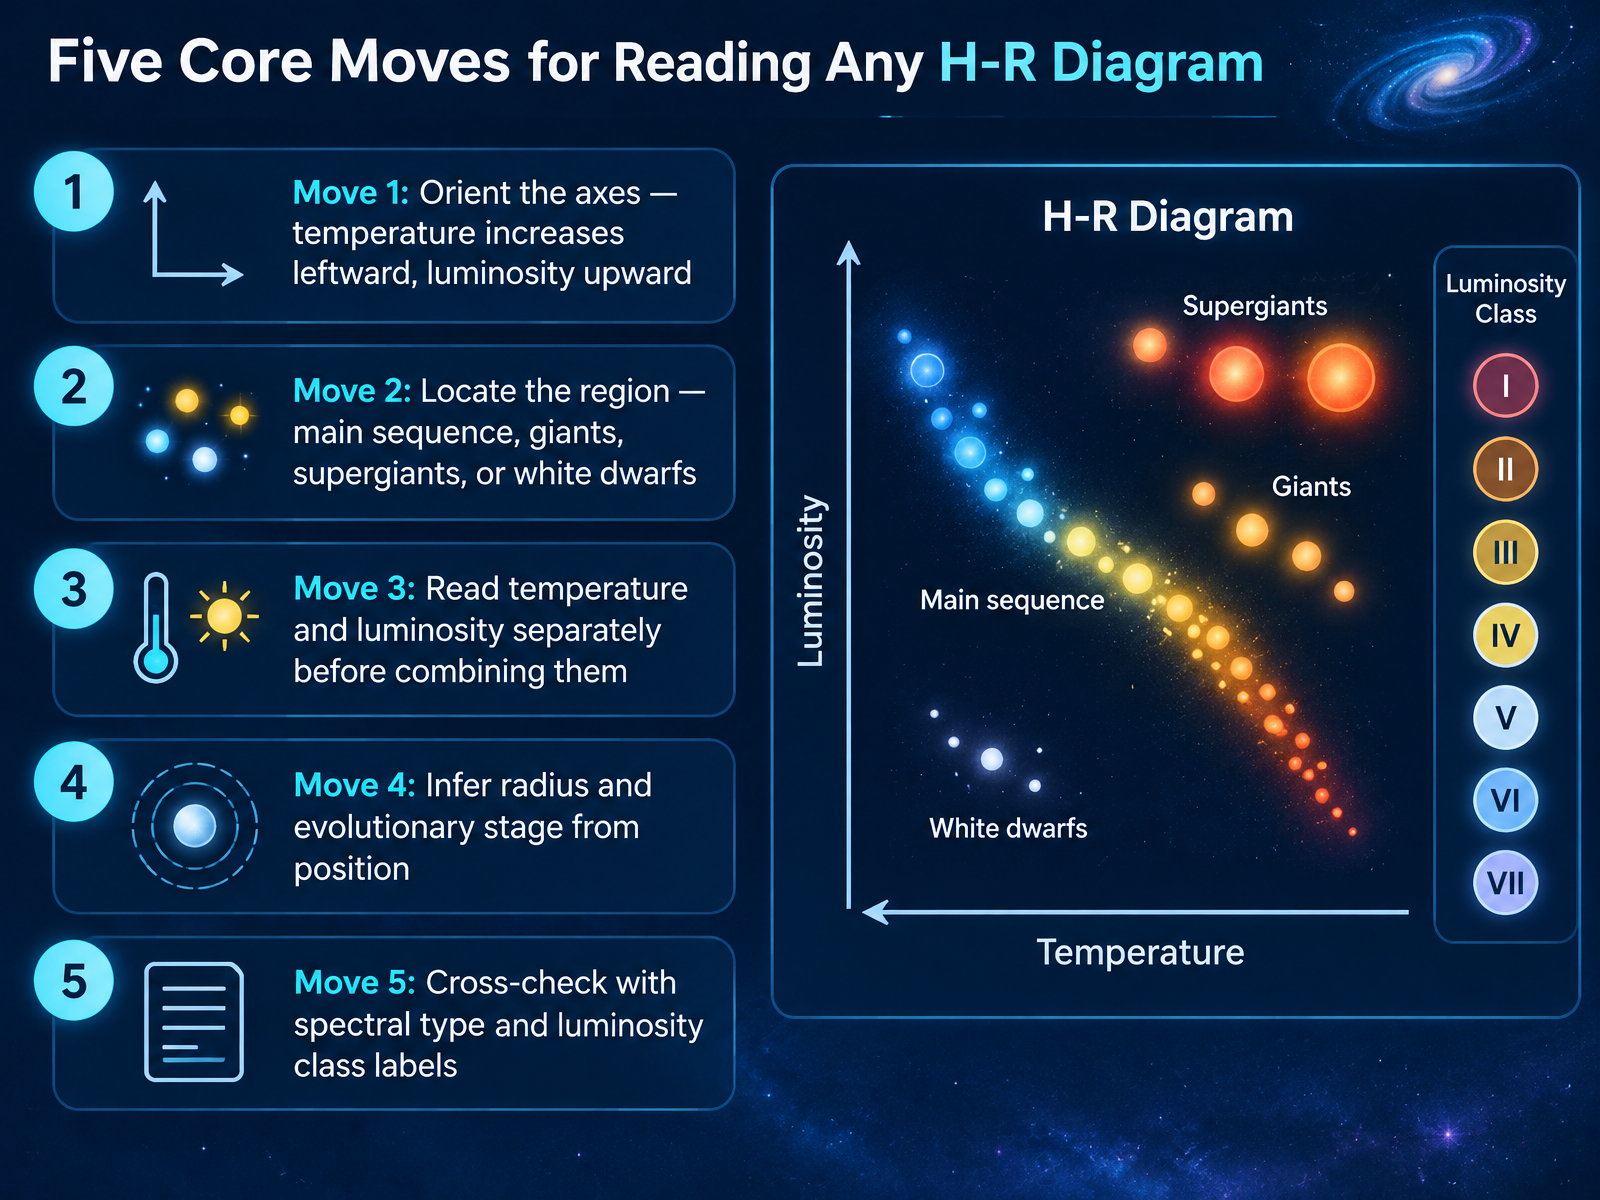
- 13Five Core Moves for Reading Any H-R DiagramLet's bring everything together into five core moves you can use on any H-R diagram. Move one, orient the axes. Temperature increases toward the left, and luminosity increases upward, so the hottest, brightest stars sit at the upper left. Move two, locate the region. Is the star on the main sequence, among the giants or supergiants, or down among the white dwarfs? Move three, read temperature and luminosity separately before you combine them. For example, a cool but very luminous star must be enormous, which is why it appears as a giant. Move four, infer radius and evolutionary stage from position. Stars above the main sequence are larger and further along in their lives, while hot, dim stars below it are small white dwarfs. Move five, cross-check with spectral type and luminosity class labels, such as G2 V for the Sun. Those Roman numerals confirm what your eyes are telling you. Practice these five moves, and any H-R diagram becomes a readable map of the stars. Next, let's pull the key takeaways together and look at where to go from here.
 openstax.orgastro.unl.eduvoyages.sdss.org+22 min
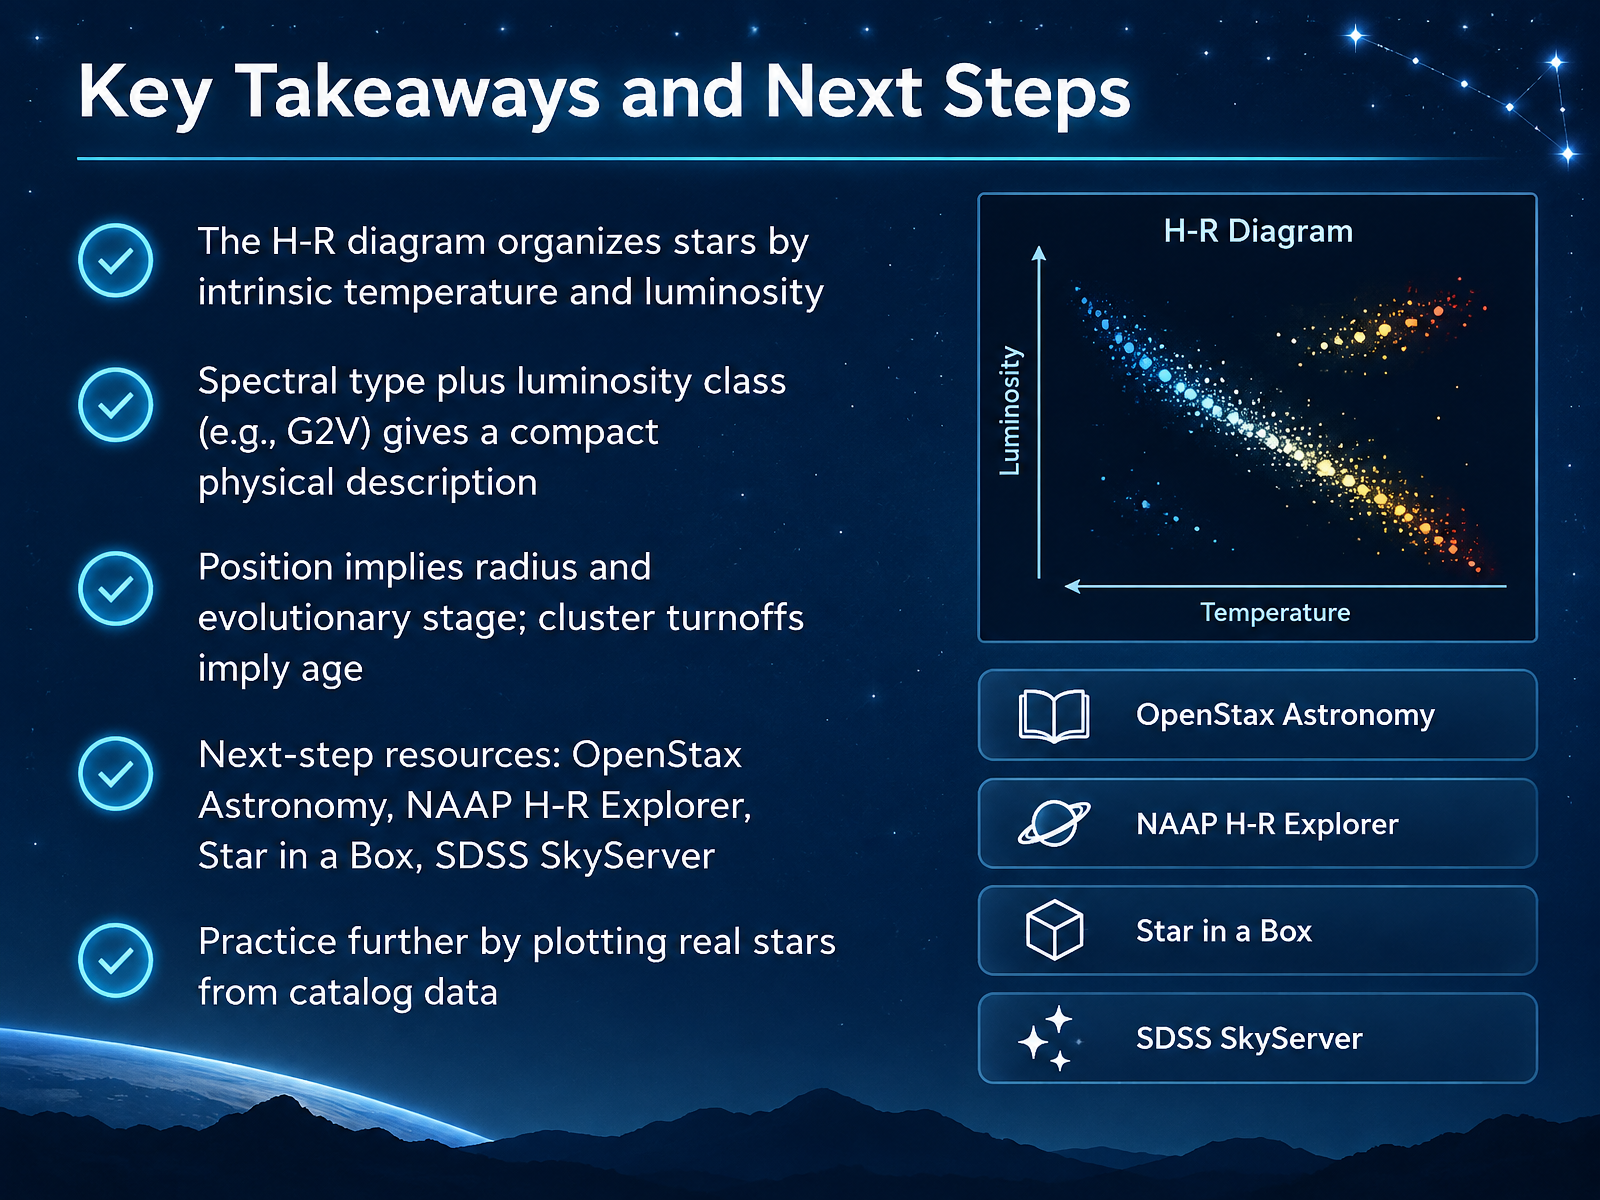
- 14Key Takeaways and Next StepsLet's bring everything together. The H-R diagram organizes stars by their intrinsic temperature and luminosity, so it shows what a star is truly like, not just how bright it appears from Earth. Combine spectral type with luminosity class, like G2V for our Sun, and you have a compact physical description. Position implies radius and evolutionary stage, and in a star cluster, the main sequence turnoff tells you the cluster's age. To keep exploring, try OpenStax Astronomy, the NAAP H-R Explorer, Star in a Box, and SDSS SkyServer. Best of all, plot real stars from catalog data yourself. Thank you for learning with me today. Keep looking up, stay curious, and enjoy charting the stars.
 chandra.harvard.eduopenstax.orgcas.sdss.org+22 min
Take the deck with you
Download this course as a file — free, no sign-up needed.
- PDF handoutEvery slide page, ready to print or share.15 pages · 3.7 MBDownload
- Narrated PowerPointThe deck that presents itself — every slide carries the digital human's narration video.15 pages · 13.3 MBDownload
- PowerPoint slidesThe full deck as a .pptx — open it in PowerPoint, Keynote, or Google Slides.15 pages · 3.6 MBDownload
Free to use in your own training — please keep the PersonWise credit page at the end.
Have your own deck? Turn it into a course
Sources consulted
Web sources consulted while building this course.
- 18.4 The H–R Diagram - Astronomy 2e | OpenStax — openstax.org
- The Hertzsprung-Russell Diagram - Hertzsprung-Russell Diagram - NAAP — astro.unl.edu
- A Simple H-R Diagram – Voyages — voyages.sdss.org
- Hertzsprung-Russell Diagram — pages.uoregon.edu
- Hertzsprung–Russell diagram — en.wikipedia.org
- Ch. 22 Figuring for Yourself - Astronomy | OpenStax — openstax.org
- Properties of Main Sequence Stars — doi.org
- Mass luminosity.html — physics.unlv.edu
- 22.1 Evolution from the Main Sequence to Red Giants - Astronomy 2e | OpenStax — openstax.org
- Interrelated main-sequence mass–luminosity, mass–radius ... — academic.oup.com
- Educational Materials :: The Hertzsprung-Russell Diagram — chandra.harvard.edu
- Stars and Nebulae — cas.sdss.org
- H-R Diagram - Teacher's Guide — cas.sdss.org
- Hertzsprung–Russell diagram — en.wikipedia.org
- An Atlas of Stellar Spectra — ucl.ac.uk
- Stellar classification - Wikipedia — en.wikipedia.org
- The MK Classification and Its Calibration — doi.org
- CESAR BOOKLET — cesar.esa.int
- <b>Field 32</b>: Spectral type and luminosity class — wwwhip.obspm.fr
- https://www.physics.unlv.edu/~jeffery/astro/star/star_table_brightest_apparent.html — physics.unlv.edu