Statistical Power Fundamentals
Begin
14 pages · ~28 min
Statistical Power Fundamentals
Learn the core concepts of statistical power, its purpose in hypothesis testing, and practical examples for designing robust studies. Ideal for researchers and analysts.
What you’ll learn
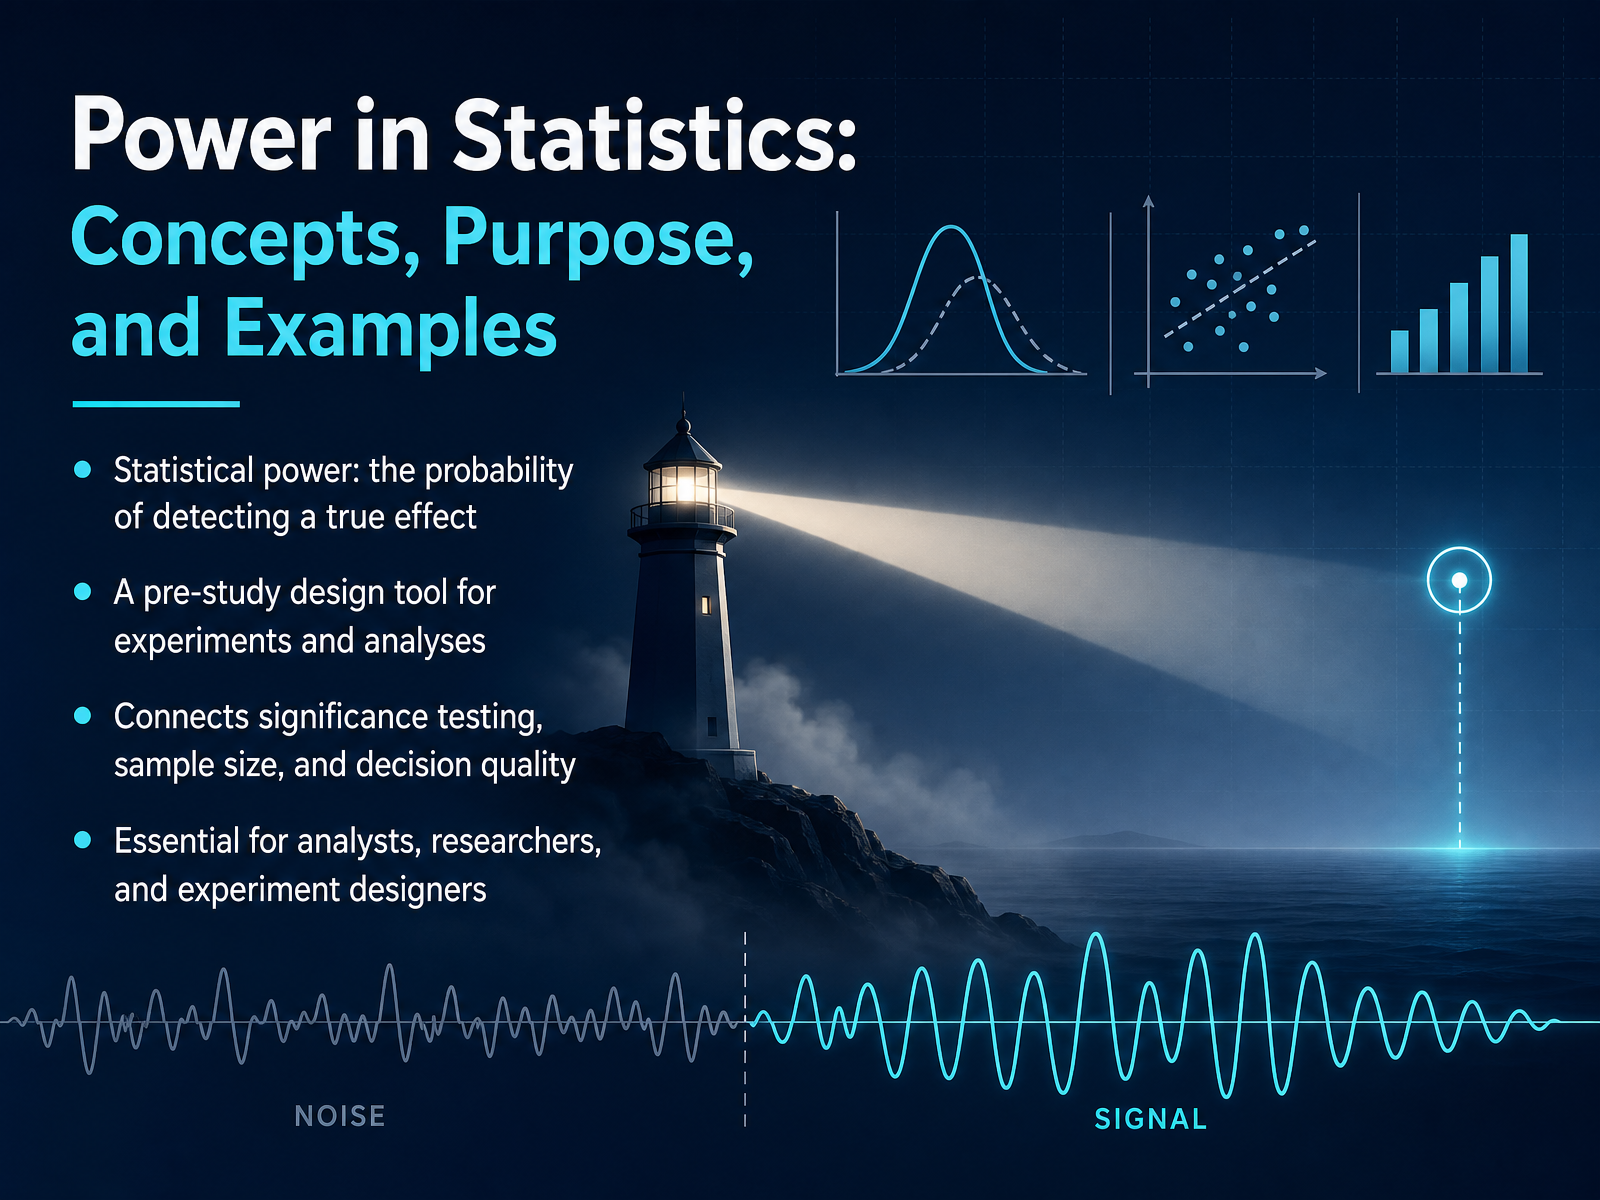
- 01Power in Statistics: Concepts, Purpose, and ExamplesWelcome. If you design studies, run experiments, or interpret research findings, this course is for you. Today, we are looking at statistical power, a concept that often gets buried under jargon but is really about one practical question: can your study actually detect what it is looking for? Statistically speaking, power is the probability of detecting a true effect. It is your safeguard against false negatives, the risk of concluding that nothing happened when something actually did. Now, power is not something you check after the data comes in. It is a pre-study design tool. Before you collect a single observation, you need to decide your sample size, estimate your effect size, and confirm you have enough sensitivity to make your analysis worthwhile. More than just a number, power connects your significance testing directly to decision quality. A study with low power wastes time and resources, and it can mislead future research. As an analyst or experiment designer, you need to build power into your planning from the start. In this session, we will break down the mechanics and walk through examples that show why this matters. Let's begin with the essentials. What is statistical power?ncbi.nlm.nih.govscribbr.comen.wikipedia.org+21 min
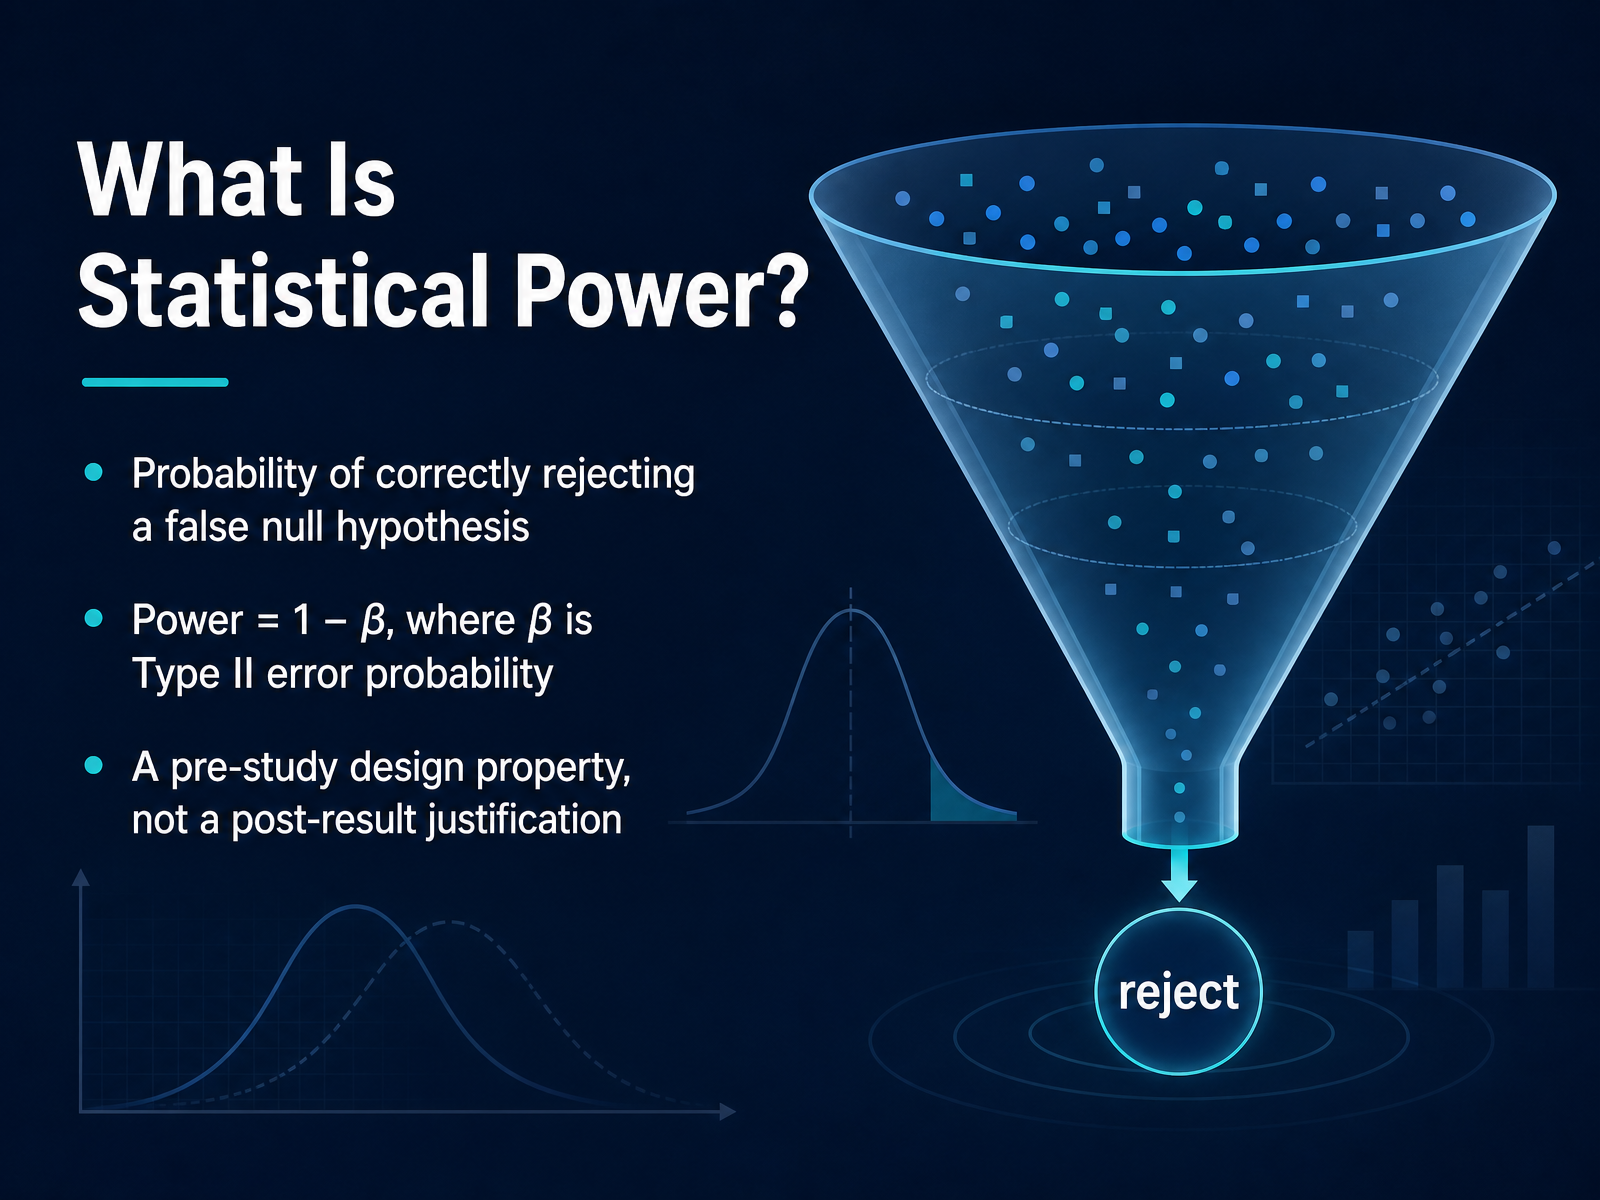
- 02What Is Statistical Power?So, what exactly is statistical power? Think of it as your study's sensitivity. Formally, it is the probability that you will correctly reject a false null hypothesis. In plain terms, it is your chance of detecting a real effect when one actually exists. The math is straightforward: power equals one minus beta, where beta is the probability of a Type Two error, your risk of a false negative. If your beta is twenty percent, your power is eighty percent. You will often hear eighty percent cited as an acceptable target, and higher is generally better. But here is the critical point to remember: power is a pre-study design property. It is something you calculate before you collect a single data point, to answer the question, if this effect is real, how likely am I to catch it? It is not a post-result justification. Running a post hoc power calculation after seeing your results adds no real information and can lead you to false conclusions. So, plan your power in advance, during the design phase. Decide what sample size you need to give your study a fair shot. Before we go further, let's make sure we're clear on the foundation this all stands on: hypothesis testing. Let's review that next.
 ncbi.nlm.nih.govscribbr.comen.wikipedia.org+22 min
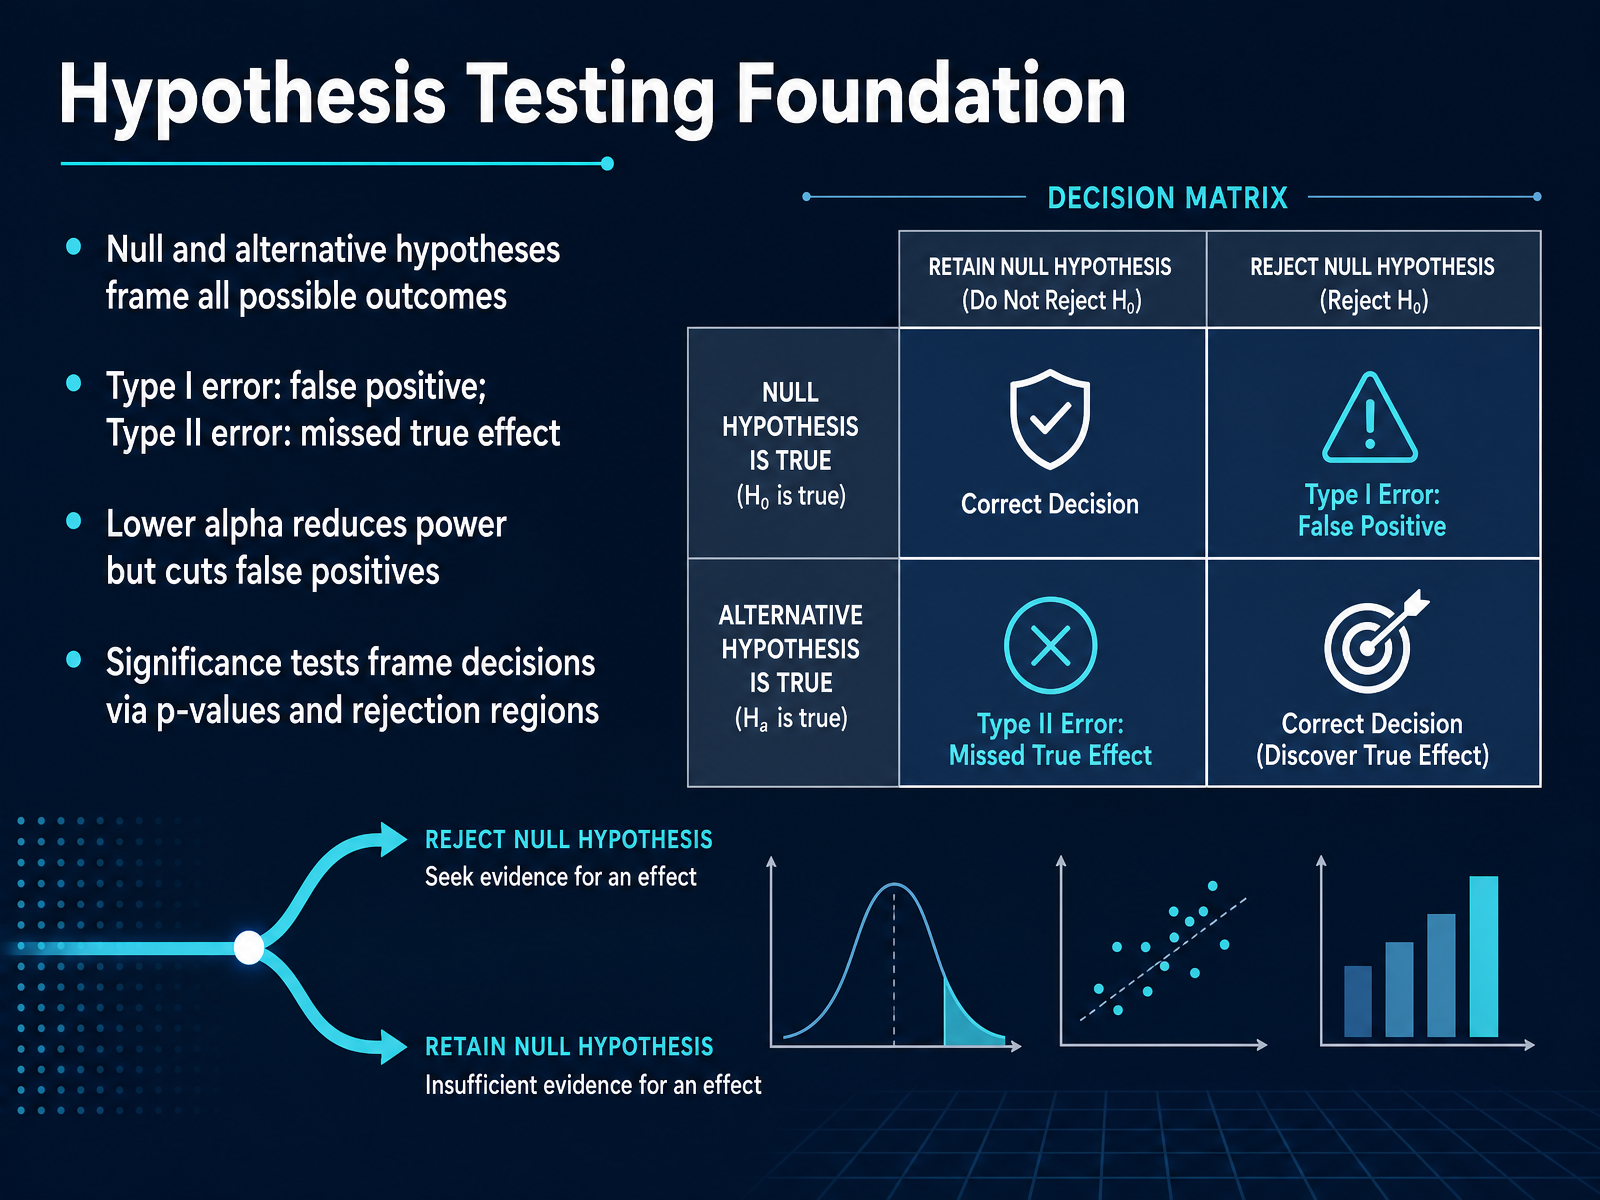
 - 03Hypothesis Testing FoundationNow let’s anchor these ideas in the hypothesis-testing framework you already use. Every study starts with two competing claims: the null hypothesis, which says there’s no effect, and the alternative hypothesis, which says there is one. Together, they cover every possible outcome. But when you make a decision, you can be wrong in two distinct ways. A Type I error is a false positive: you claim an effect exists when it doesn’t. A Type II error is a missed true effect: you conclude nothing is happening when, in reality, something is. This is where alpha comes in. Alpha is the risk of a Type I error you’re willing to accept, usually five percent. Lowering alpha makes your test more conservative and cuts false positives — but there’s a trade-off. It also shrinks your ability to detect real effects, which means lower power. And when you run the test, the p-value tells you whether your data fall into the rejection region or not. But a p-value alone won’t tell you whether you had enough data to find the effect in the first place. That question leads directly to our next topic: the four interlocking quantities that determine your study’s power.
 ncbi.nlm.nih.govscribbr.comen.wikipedia.org+22 min
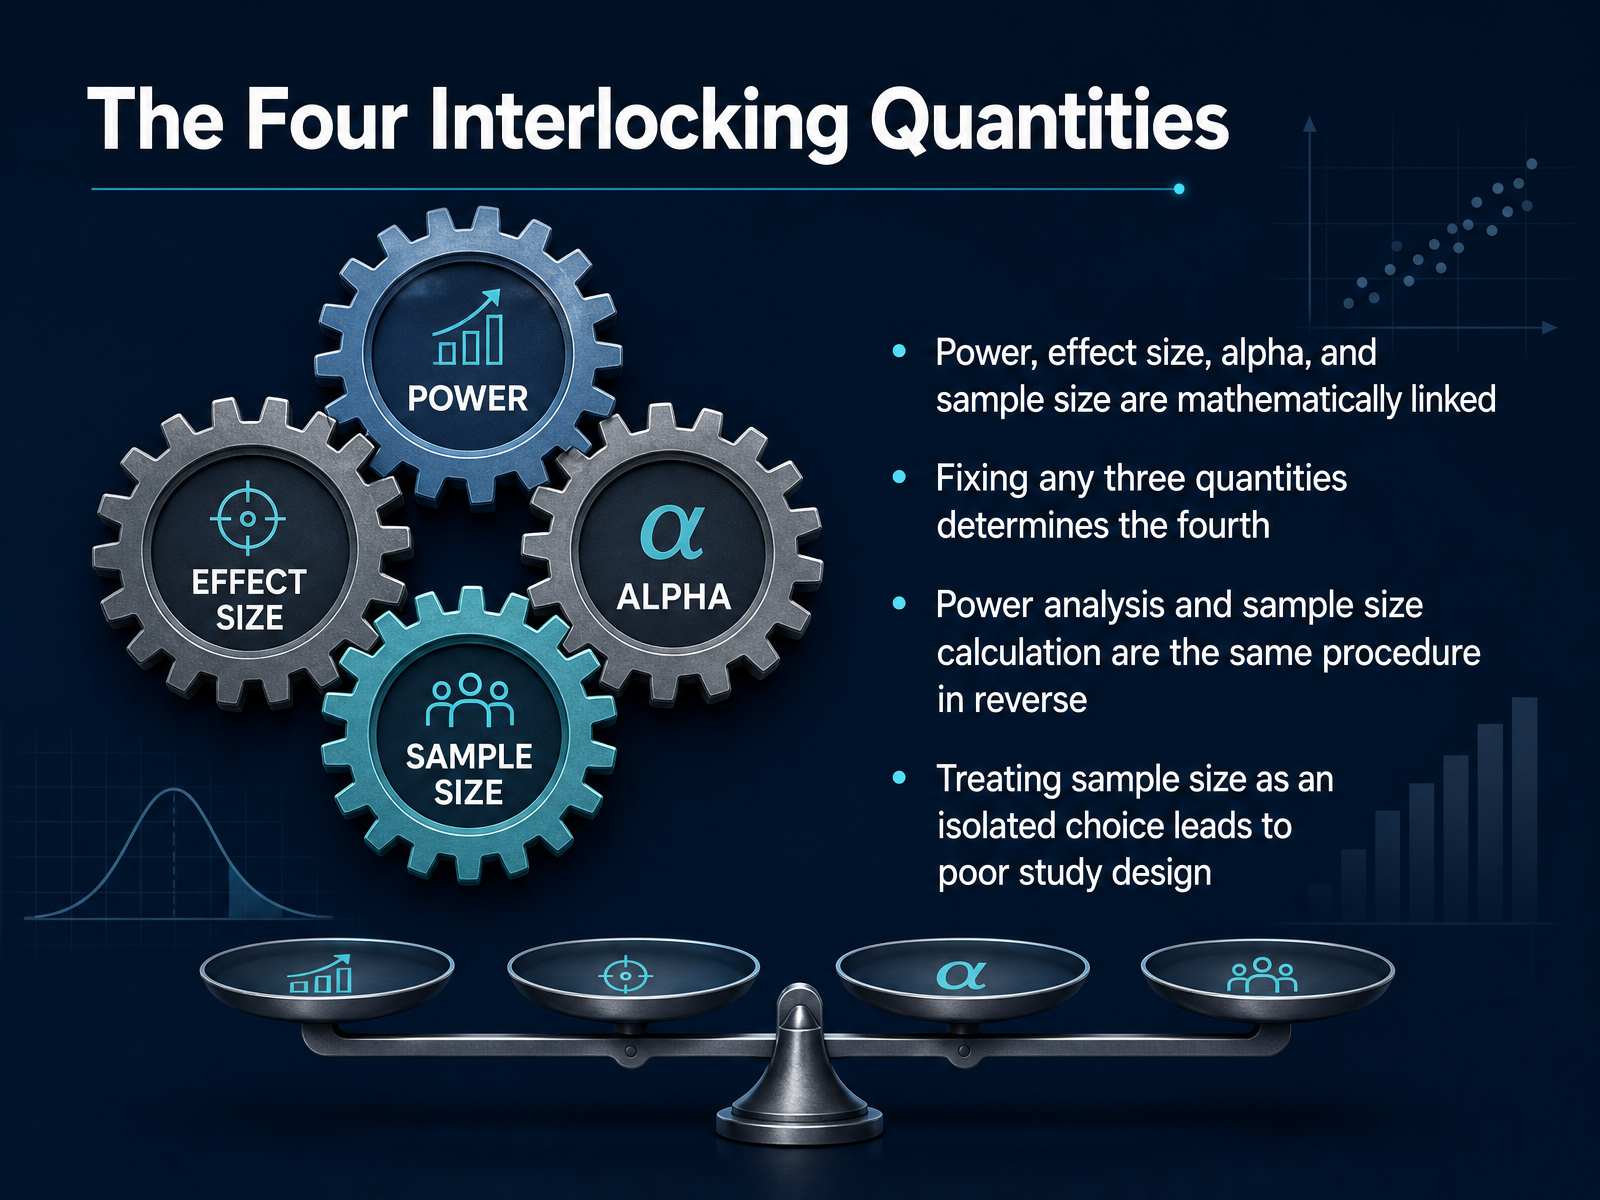
 - 04The Four Interlocking QuantitiesNow, here is the core idea that ties everything together. Power, effect size, alpha, and sample size are not separate concerns. They are four interlocking quantities, mathematically linked in a single relationship. Here is the practical rule to remember: fix any three of them, and the fourth is no longer a free choice. It is determined for you. This is why power analysis and sample size calculation are the same procedure, just run in reverse. When you calculate sample size, you are deciding on an effect size, an alpha, and a target power, and solving for N. When you run a power analysis, you are typically doing the exact same thing from the other direction. The danger is treating sample size as an isolated choice, like picking a round number that feels feasible. That approach ignores the fact that your sample size only has meaning in relation to the effect you expect and the error rates you are willing to accept. Change the expected effect size, and the sample size you need changes dramatically. So, when you plan a study, you need to think of these four values as a system, not as separate decisions. That mindset is what separates a defensible design from a guess. Now, let's look at the first input you need to pin down: the effect size, the magnitude worth detecting.
 casrai.orgrips-irsp.combeckerguides.wustl.edu+21 min
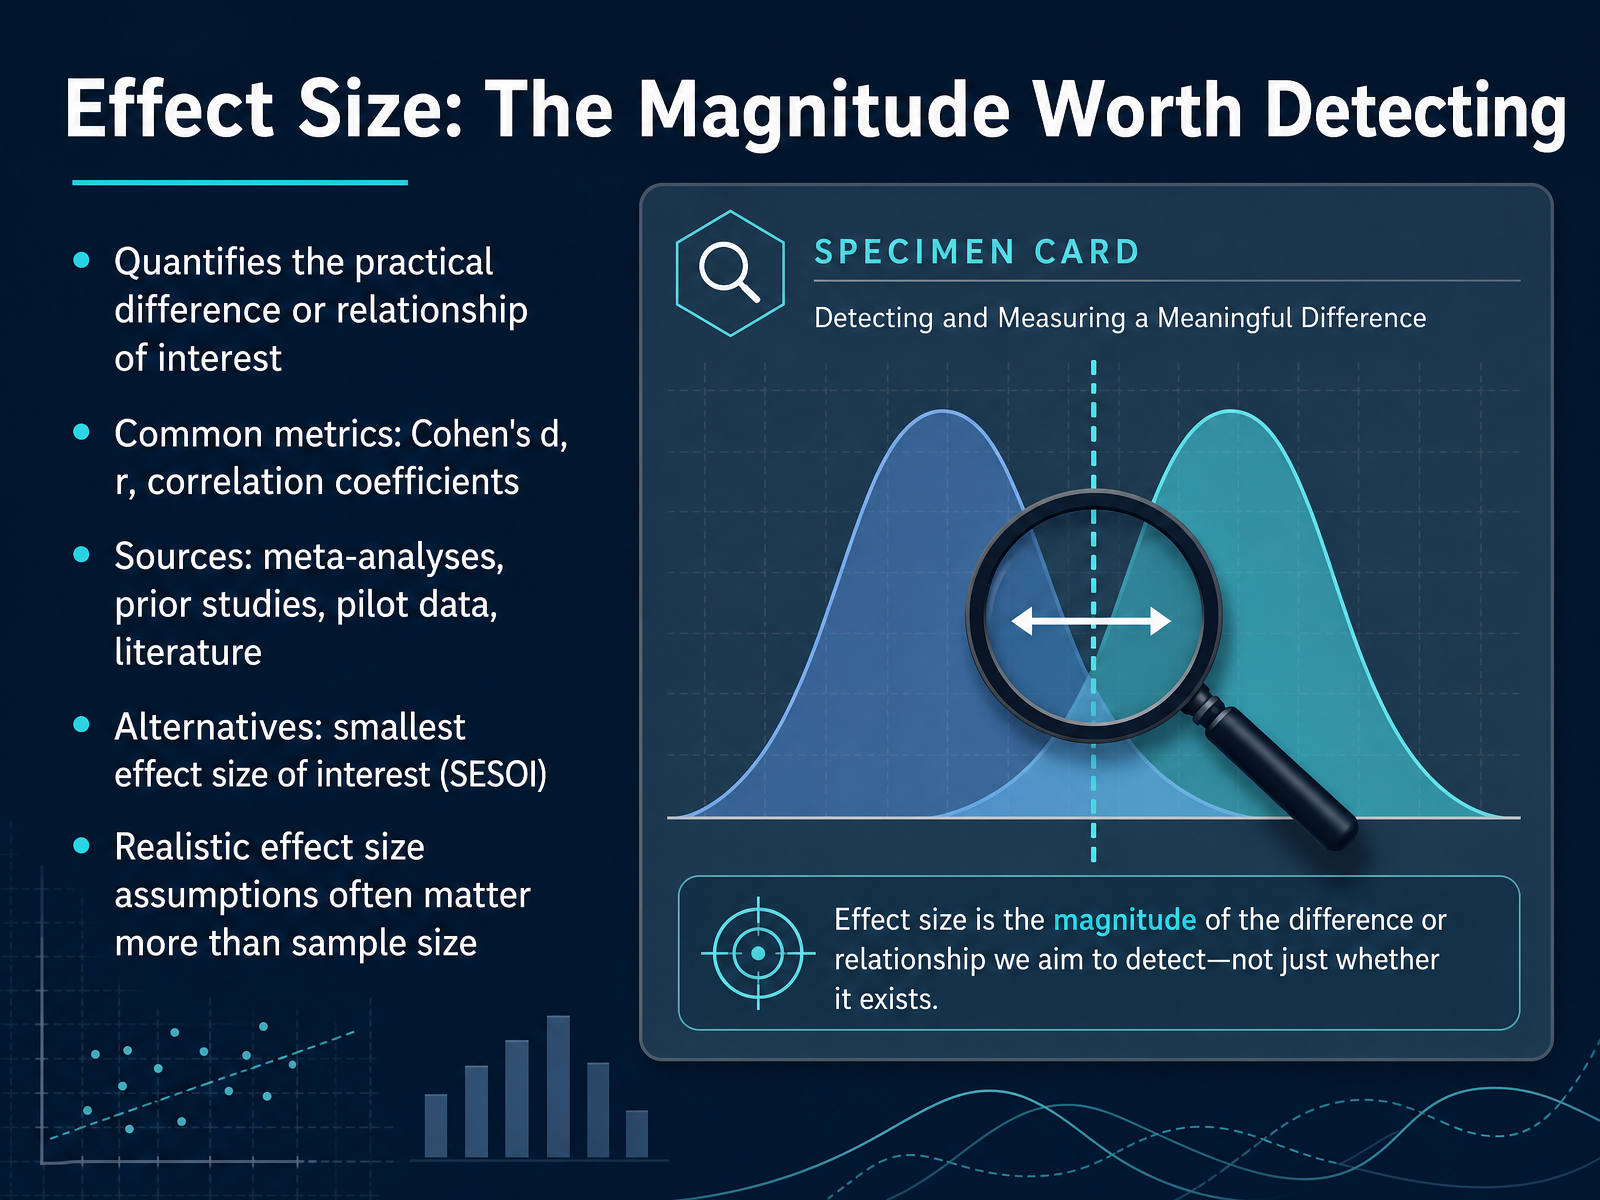
 - 05Effect Size: The Magnitude Worth DetectingNow let’s turn to effect size, which is the magnitude of the difference or relationship you are actually trying to detect. Think of it this way: power analysis is a relationship among four numbers — effect size, alpha, power, and sample size. Fix any three, and the fourth is determined. The effect size is the hardest input to justify honestly, because it's the one number you don't yet know — if you did, you wouldn't need the study. Effect size is typically expressed in standardized metrics like Cohen's d for mean differences or r for correlations. Where do you get it? In order of defensibility: from a meta-analysis of prior studies, a single closely comparable study used with caution, or your own pilot data. Cohen's benchmarks — small, medium, large — are only a last resort, not a substitute for field knowledge. The increasingly preferred alternative is to set a smallest effect size of interest: define what effect would actually matter if it were true, and power the study to detect that. Realistic effect size assumptions almost always matter more than sample size — assuming a large effect when the true one is small leaves you with a fatally underpowered study. Next, let's connect this to the other inputs in the equation: alpha, variability, and sample size.
 casrai.orgrips-irsp.combeckerguides.wustl.edu+22 min
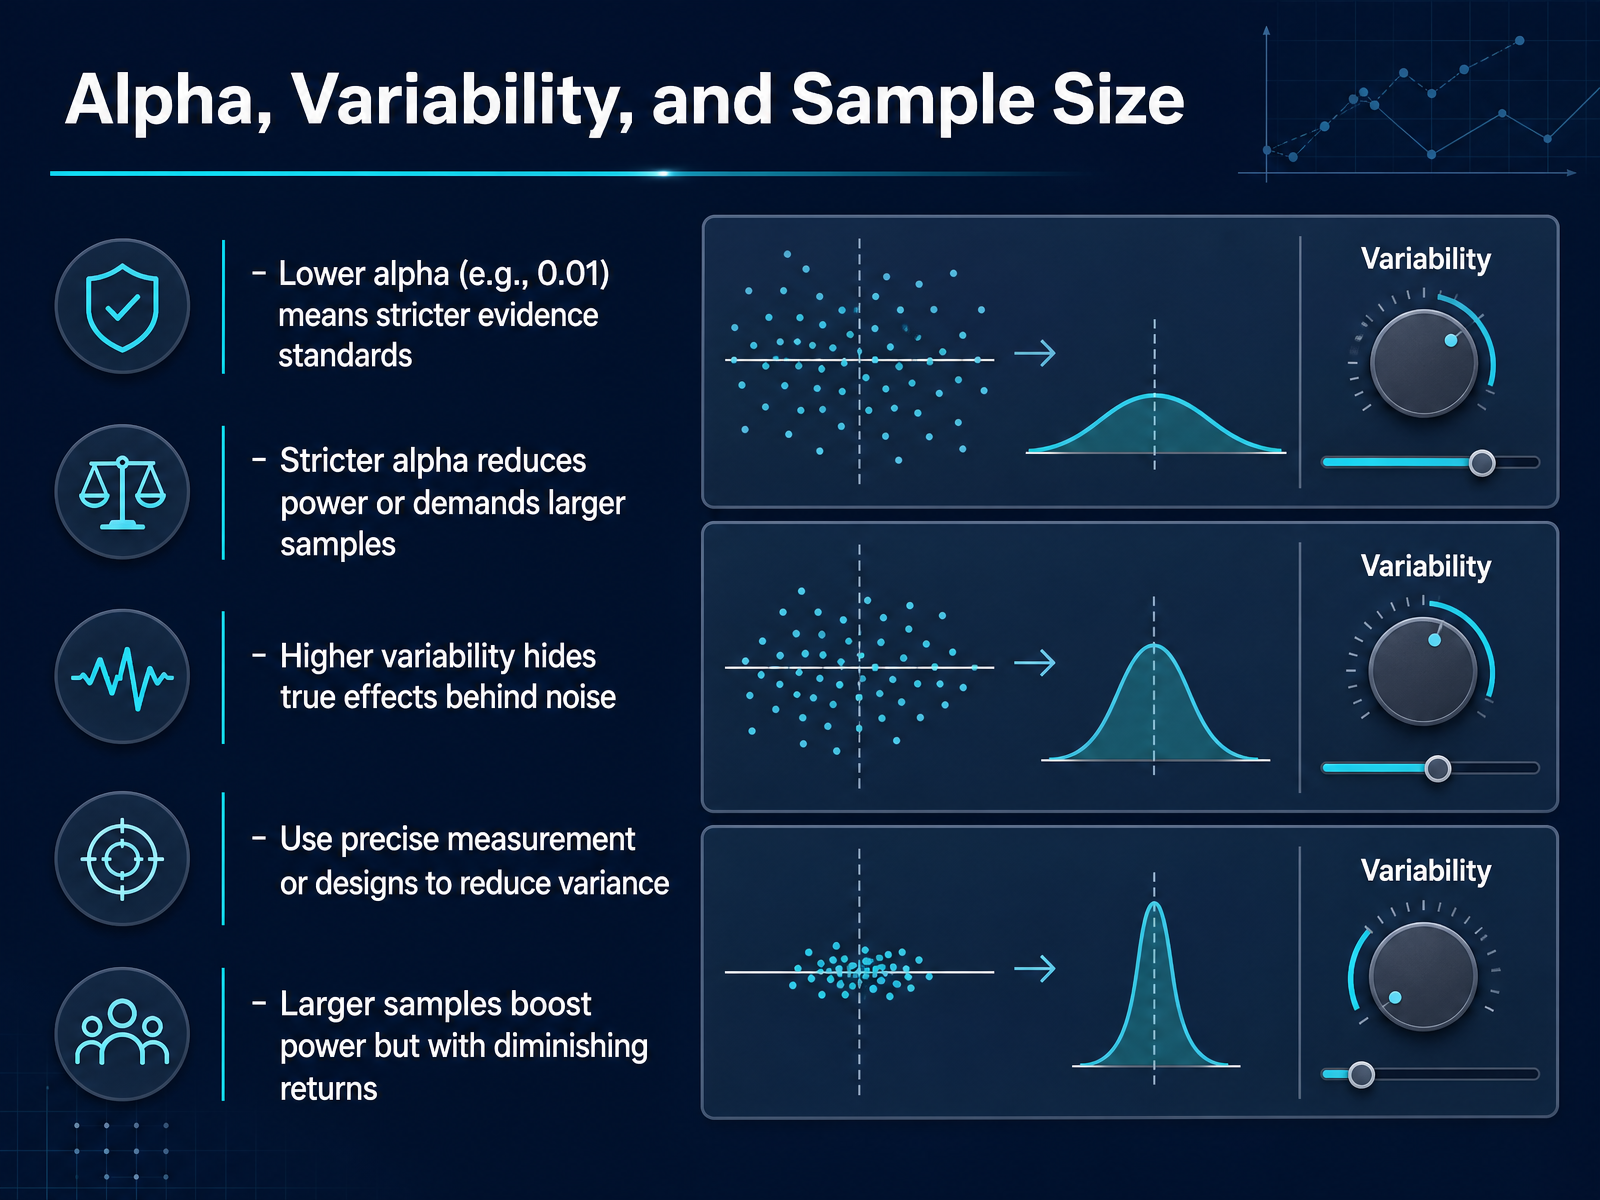
 - 06Alpha, Variability, and Sample SizeNow let’s look at three controls you can adjust when planning a study: alpha, variability, and sample size. First, alpha. If you set alpha to 0.01 instead of 0.05, you’re demanding stronger evidence before declaring a result real. That’s good for avoiding false positives, but it makes detecting a true effect harder. To keep your power at 80 percent with a stricter alpha, you’ll need a larger sample. Next, variability. Think of noise in your measurements as static that hides the signal. If your outcome measure is noisy, true effects get buried. You can fix this by using precise measurement tools, averaging multiple observations, or using a design that controls for known sources of variation. Blocking and stratification are two design strategies that reduce error variance. Finally, sample size. Adding participants narrows your sampling error and boosts power, but the gain shrinks as you go. Moving from 30 to 60 subjects helps a lot; moving from 300 to 330 helps far less. So be strategic. If you can reduce noise or relax an overly strict alpha, that’s often cheaper than chasing a few extra percentage points of power with more subjects. Now, let’s consider why power matters in practice.
 advstats.psychstat.orgpmc.ncbi.nlm.nih.govweb.ma.utexas.edu+22 min
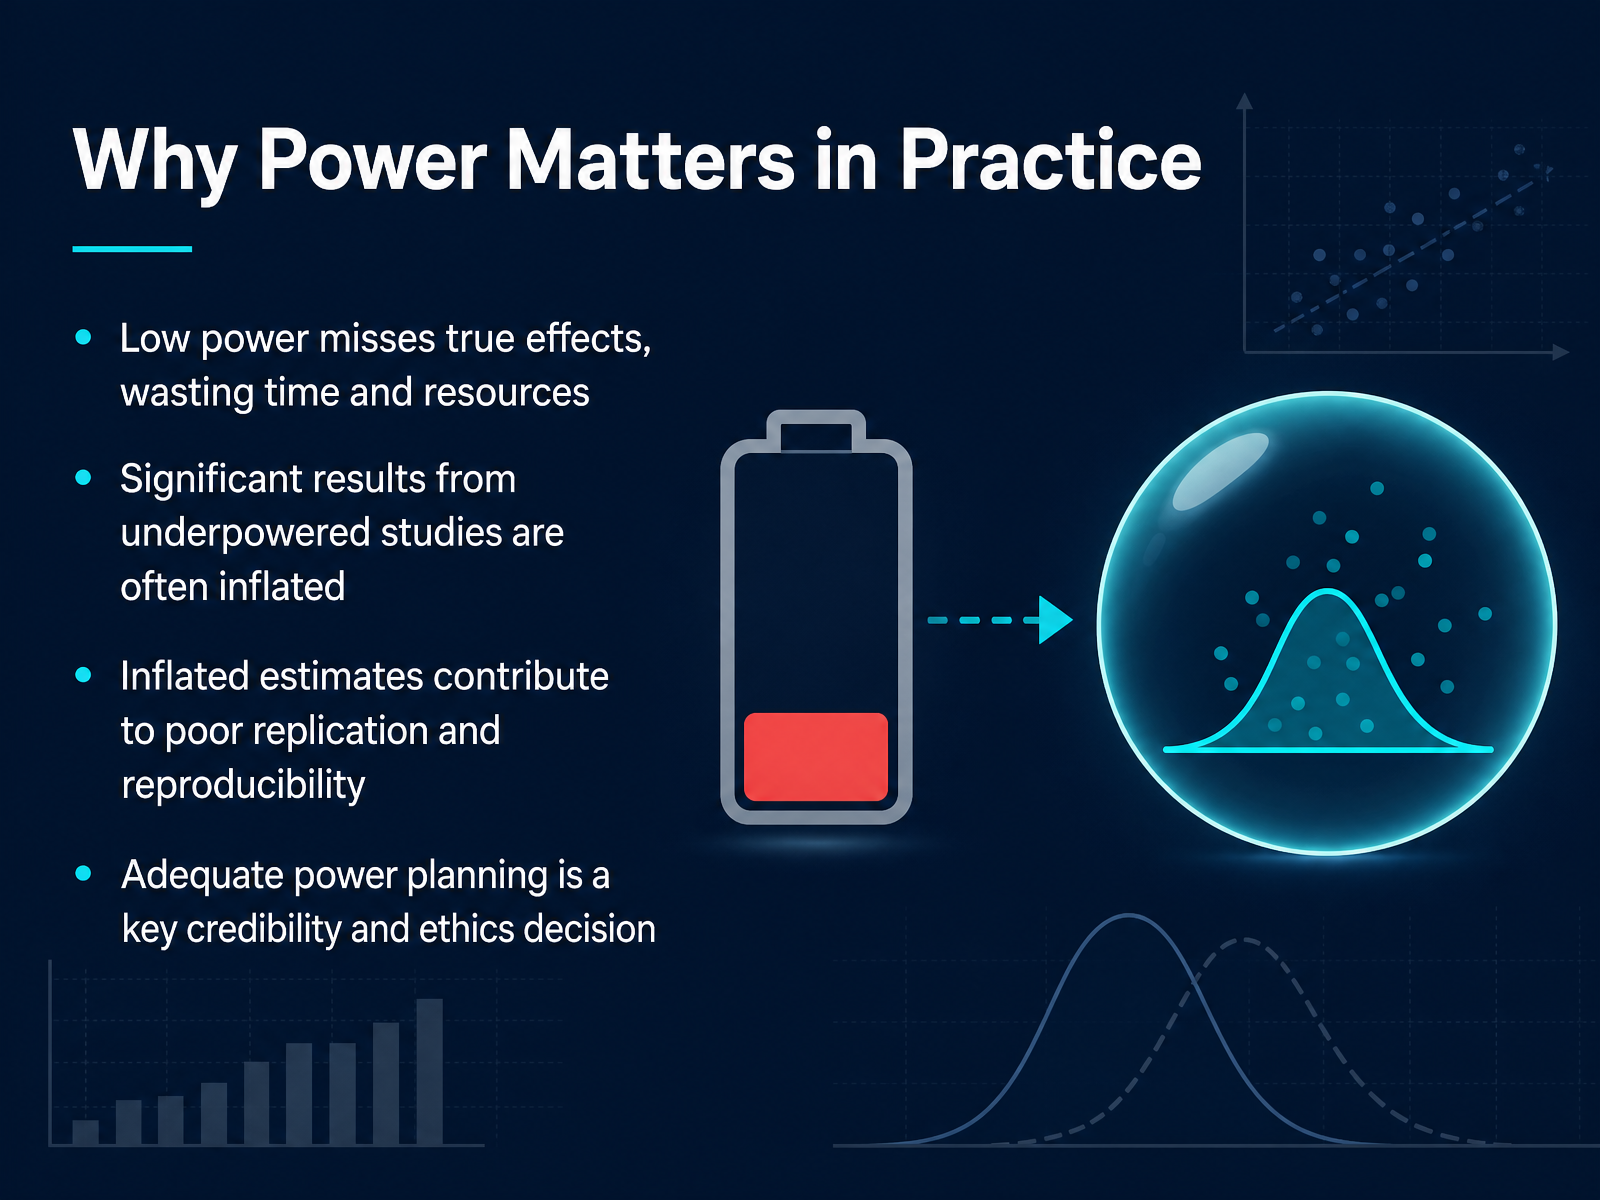
 - 07Why Power Matters in PracticeSo why does all this matter to you in practice? Because low power has real consequences, not just abstract ones. First, if your study is underpowered, you are likely to miss a true effect that is actually there. All that time, budget, and participant effort goes into a study that was never designed to succeed. Second, and less obvious, results that do come out significant from underpowered studies are often inflated. Think of it this way: with a small sample, only the most extreme, lucky results cross the significance line, so the effect you publish may be much larger than reality. These inflated estimates then become the foundation for future research, and when others try to build on them or replicate them, they fail. That contributes directly to the reproducibility crisis we have seen across many fields. Adequate power planning is therefore not a technical afterthought, it is a credibility and ethics decision. An underpowered study wastes resources and can mislead the literature. Good planning shows respect for your participants, your funding, and the scientific record. Next, let us walk through the workflow that ensures your study starts with adequate power.
 nature.comsciencedirect.comdoi.org+22 min
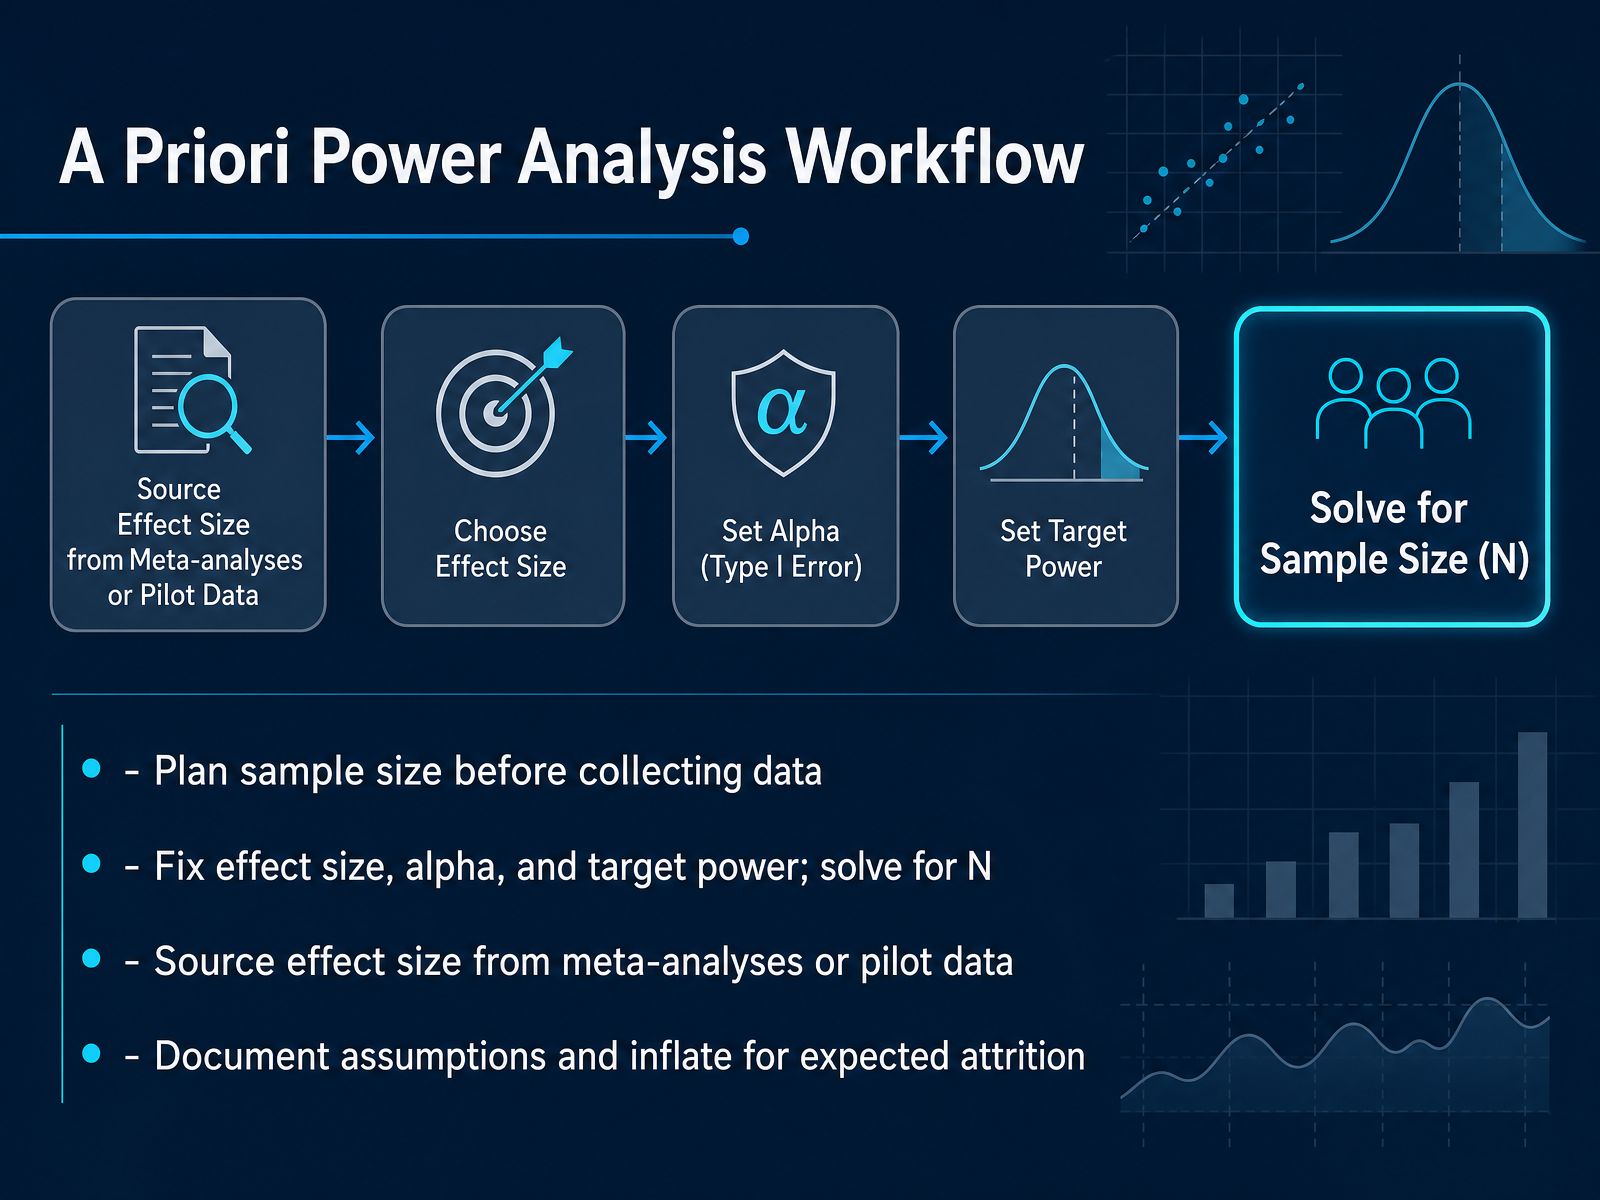
 - 08A Priori Power Analysis WorkflowNow let's walk through the workflow for an a priori power analysis. Remember, this happens before you collect any data. It's your plan for how many participants you'll need. Start by fixing three values: your effect size, your alpha, and your target power. Then, solve for the sample size, N. The effect size is the hardest input to pin down. Don't just guess. Source it from a meta-analysis, a pilot study, or prior comparable research. If none of that exists, base it on the smallest effect that would be practically meaningful. Your choice here drives everything. Document your assumptions clearly, and if you expect some participants to drop out, inflate your number. For example, if you need two hundred participants and expect ten percent attrition, recruit two hundred and twenty-three. This workflow turns a vague guess into a defensible, concrete number. Next, let's look at sensitivity analysis and the minimum detectable effect.
 casrai.orgrips-irsp.combeckerguides.wustl.edu+22 min
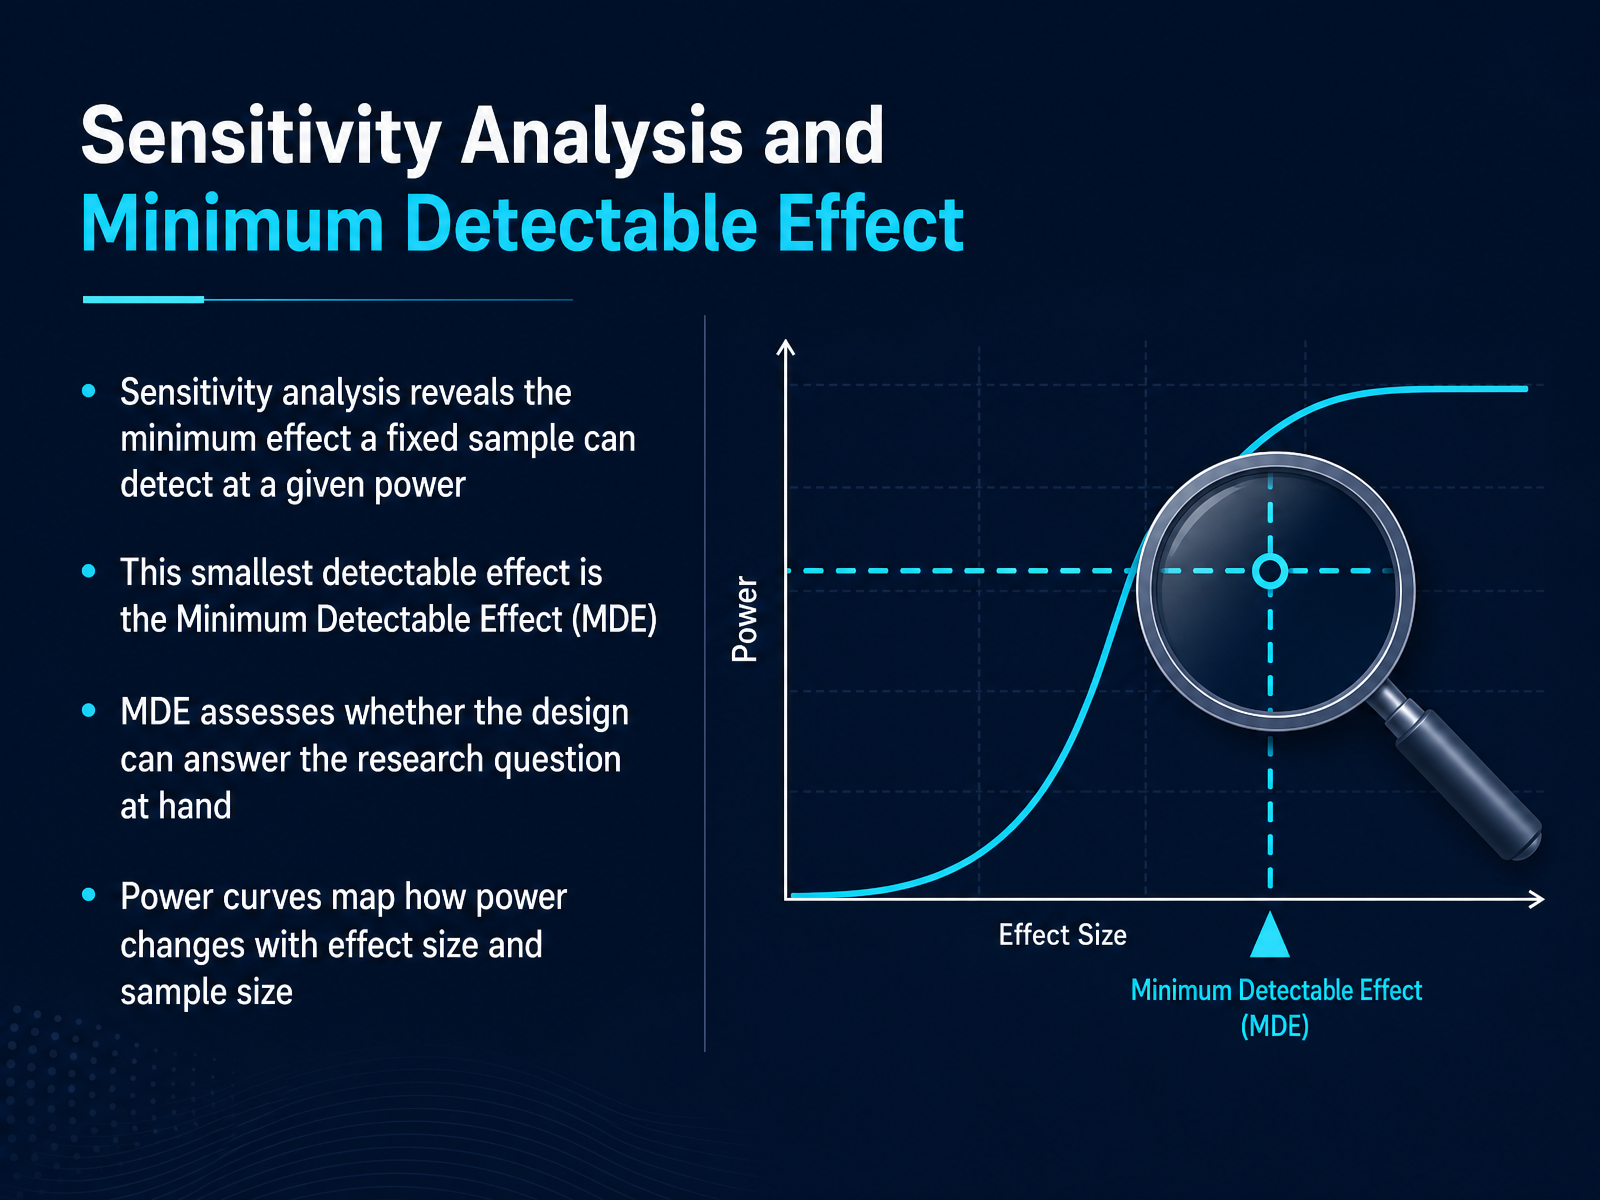
 - 09Sensitivity Analysis and Minimum Detectable EffectLet’s flip the question around. Instead of asking how many people you need for a given effect, ask what effect your fixed sample can actually detect. That is sensitivity analysis, and the answer it returns is the minimum detectable effect, or MDE. This is not a theoretical nicety. It is a practical guardrail. If your sample size is locked by budget, recruitment, or a rare population, the MDE tells you the smallest true effect your design could reliably pick up at your chosen power. And here is the key judgment call: if that minimum detectable effect is larger than the effect you care about, your study cannot answer your research question. Full stop. Your power curve shows this trade-off visually. Run the calculation across a range of effect sizes and sample sizes, and you will see power climb as either one grows. Use this to check whether the design is worth running, or whether you need to revisit your assumptions. So, when your sample is already fixed, run a sensitivity analysis and state your MDE plainly. It turns an underpowered study into an honest, defensible one. Now, let’s look at what you should not do after the study is over: post hoc power.
 casrai.orgrips-irsp.combeckerguides.wustl.edu+22 min
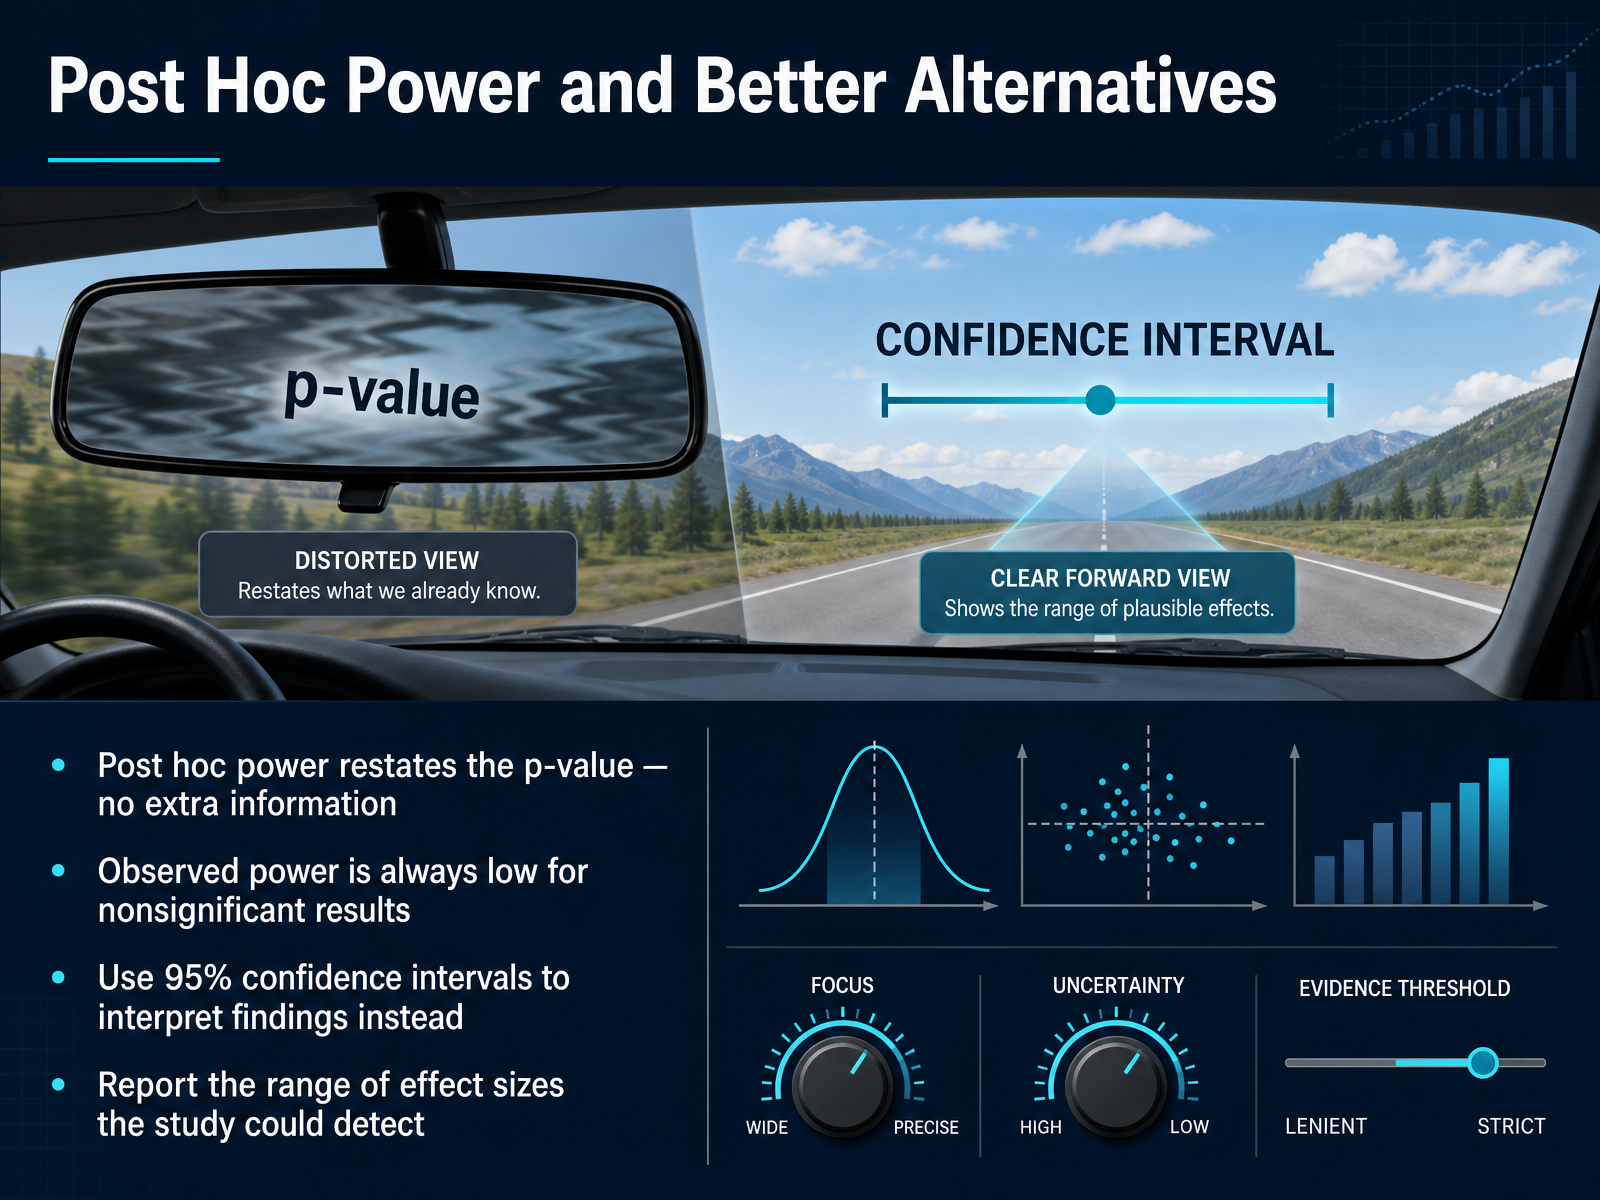
 - 10Post Hoc Power and Better AlternativesNow let's talk about post hoc power. This is when you calculate power after the study is done, using your observed results. It's tempting, but it's a mistake. Here's the key issue: post hoc power is just a restatement of your p-value. It carries no extra information. In fact, if your result isn't significant, observed power will always be low. So it doesn't tell you whether you missed a real effect. Instead of calculating post hoc power, focus on the 95% confidence interval around your effect size. That interval shows the range of effects consistent with your data. If it's wide and includes meaningful benefits and harms, your study is inconclusive. If it's narrow and excludes what you care about, you have useful evidence. Also, report the range of effect sizes your study could detect. This gives readers a sense of precision without the misleading certainty of a single power number. In short, after the data are in, let confidence intervals guide your interpretation. Next, we'll look at how to interpret power alongside confidence intervals in practice.
 2 min
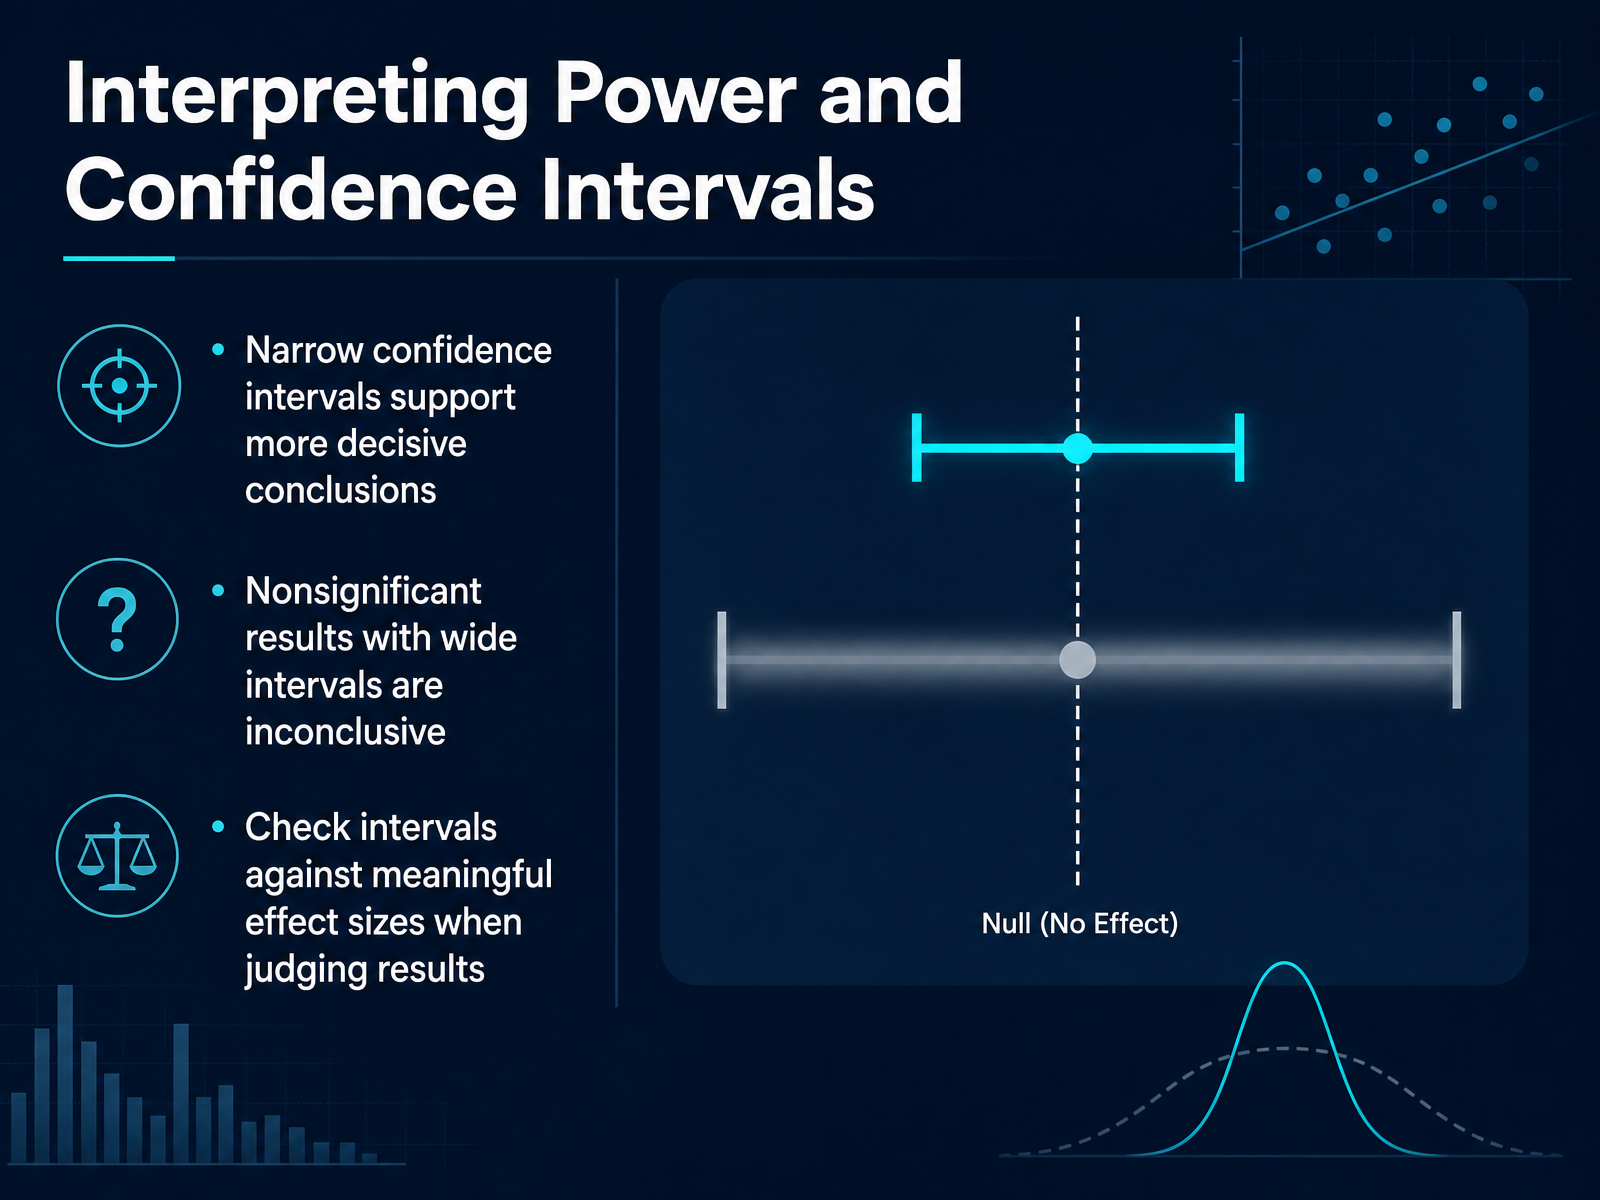
2 min - 11Interpreting Power and Confidence IntervalsNow that you have your results, power is no longer the main question. The confidence interval takes over. A narrow interval means your estimate is precise, which supports decisive conclusions. But when results are not significant and the interval is wide, that is a signal of uncertainty. You cannot conclude there is no effect. Instead, treat the result as inconclusive. The interval likely spans from meaningful harm to meaningful benefit, so more data is needed before you make any practical call. Here is the key habit: always check the interval against the range of effect sizes you would consider meaningful. Do not rely on the p-value to tell you whether something matters. For example, a confidence interval from negative 0.2 to positive 0.1 may be nonsignificant, but it actually rules out any large effect. On the other hand, an interval from negative 10 to positive 20 means the true effect could be substantial in either direction. Same p-value, opposite conclusions. So report the confidence interval, read the whole range, and judge it against your meaningful effect size. This keeps you honest about what the data truly support. Up next, we will walk through practical examples of these concepts across different fields.
 1 min
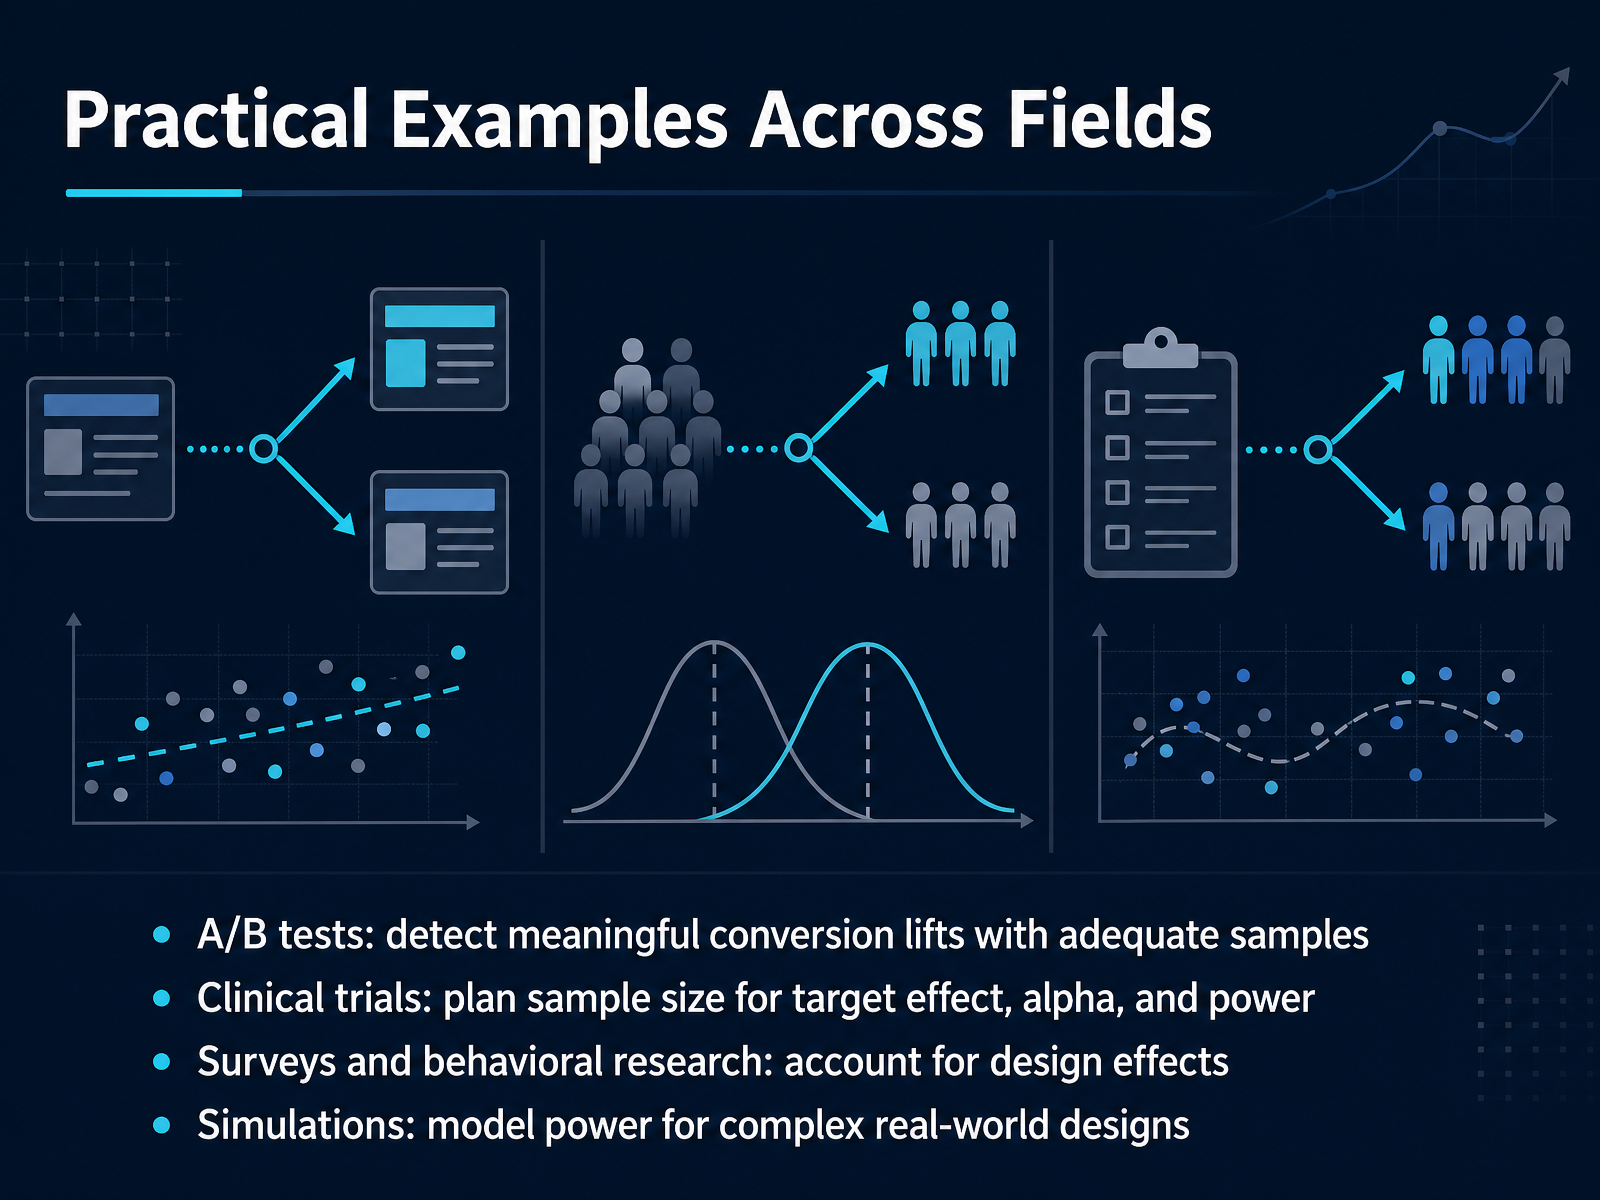
1 min - 12Practical Examples Across FieldsLet’s bring these ideas to life with some practical examples you’ll actually encounter. In A/B testing, say product teams want to detect a meaningful conversion lift. A power analysis tells you how many users per variant you need. A small effect, say a point-five percent lift, might require tens of thousands of users, while a two percent lift might only need a few thousand. Powering the test upfront prevents you from ending inconclusive experiments and wasting weeks of traffic. Clinical trials follow the same logic but with higher stakes. You specify your target effect, your alpha of point zero five, and power at point nine or higher. That calculation defines your patient sample before a single dose is given, which is exactly what ethics committees expect. Surveys and behavioral research add a layer of complexity: design effects. Clustered samples and weighting reduce precision, so the raw sample size has to be inflated to account for it. And for complicated real-world designs that don’t match standard formulas, simulations are your answer. You simulate the data, run your planned analysis thousands of times, and measure the proportion of significant results. That is your power. Each of these settings shares one move: decide the effect, fix your errors, and solve for the sample size. Next, let’s examine some common misconceptions and pitfalls that trip up even experienced researchers.
 casrai.orgrips-irsp.combeckerguides.wustl.edu+22 min
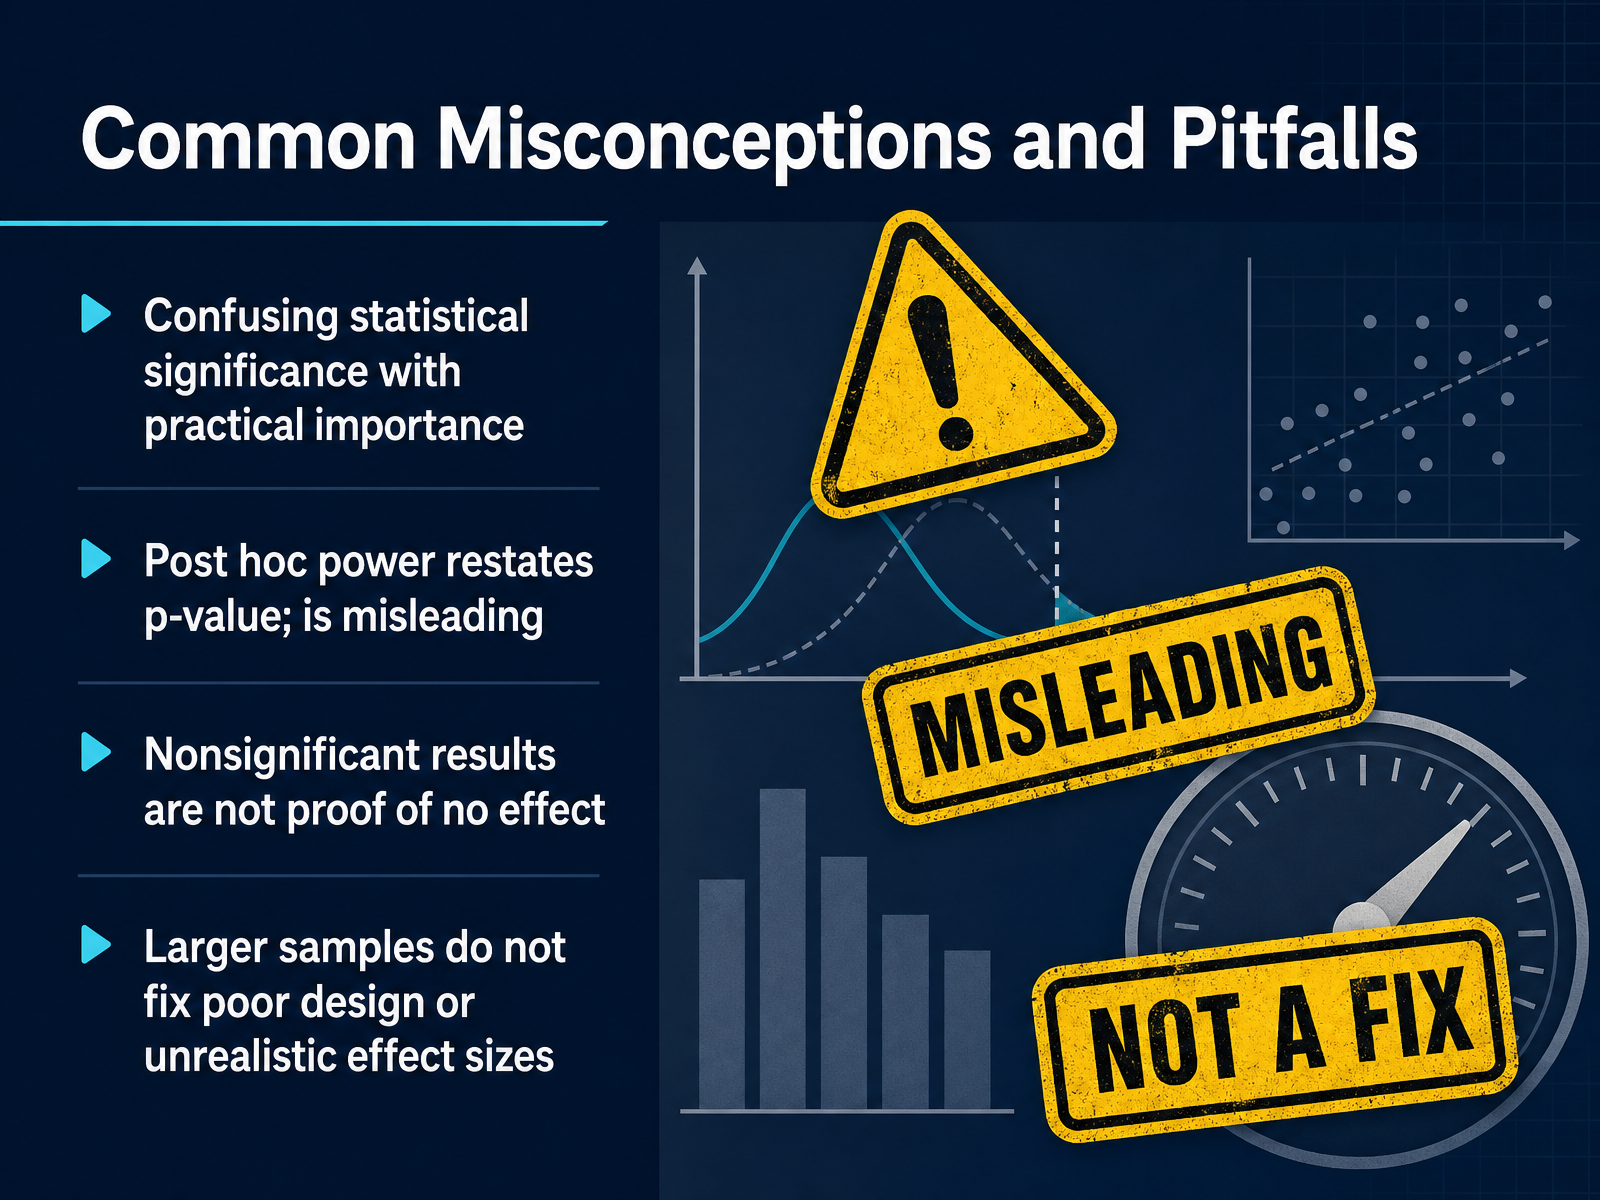
 - 13Common Misconceptions and PitfallsLet's tackle some common misconceptions about power. First, statistical significance isn't the same as practical importance. A tiny effect can be significant with a huge sample, but it might not matter in the real world. Always ask: is this effect big enough to act on? Next, post hoc power is a trap. Calculating power after you've seen your results just restates your p-value. It adds no new information, so don't use it to rescue a null finding. Instead, use confidence intervals to see the range of plausible effects. Third, a nonsignificant result is not proof of no effect. It might just mean your study was underpowered. Absence of evidence isn't evidence of absence. Finally, bigger samples can't fix a poor design or an unrealistic effect size. If your design is flawed or you're chasing an effect that doesn't exist, more data won't save you. Plan carefully from the start. Power is about design, not damage control. Keep these pitfalls in mind and you'll make sounder decisions. Next, let's look at useful tools for power analysis.
 nature.comsciencedirect.comdoi.org+22 min
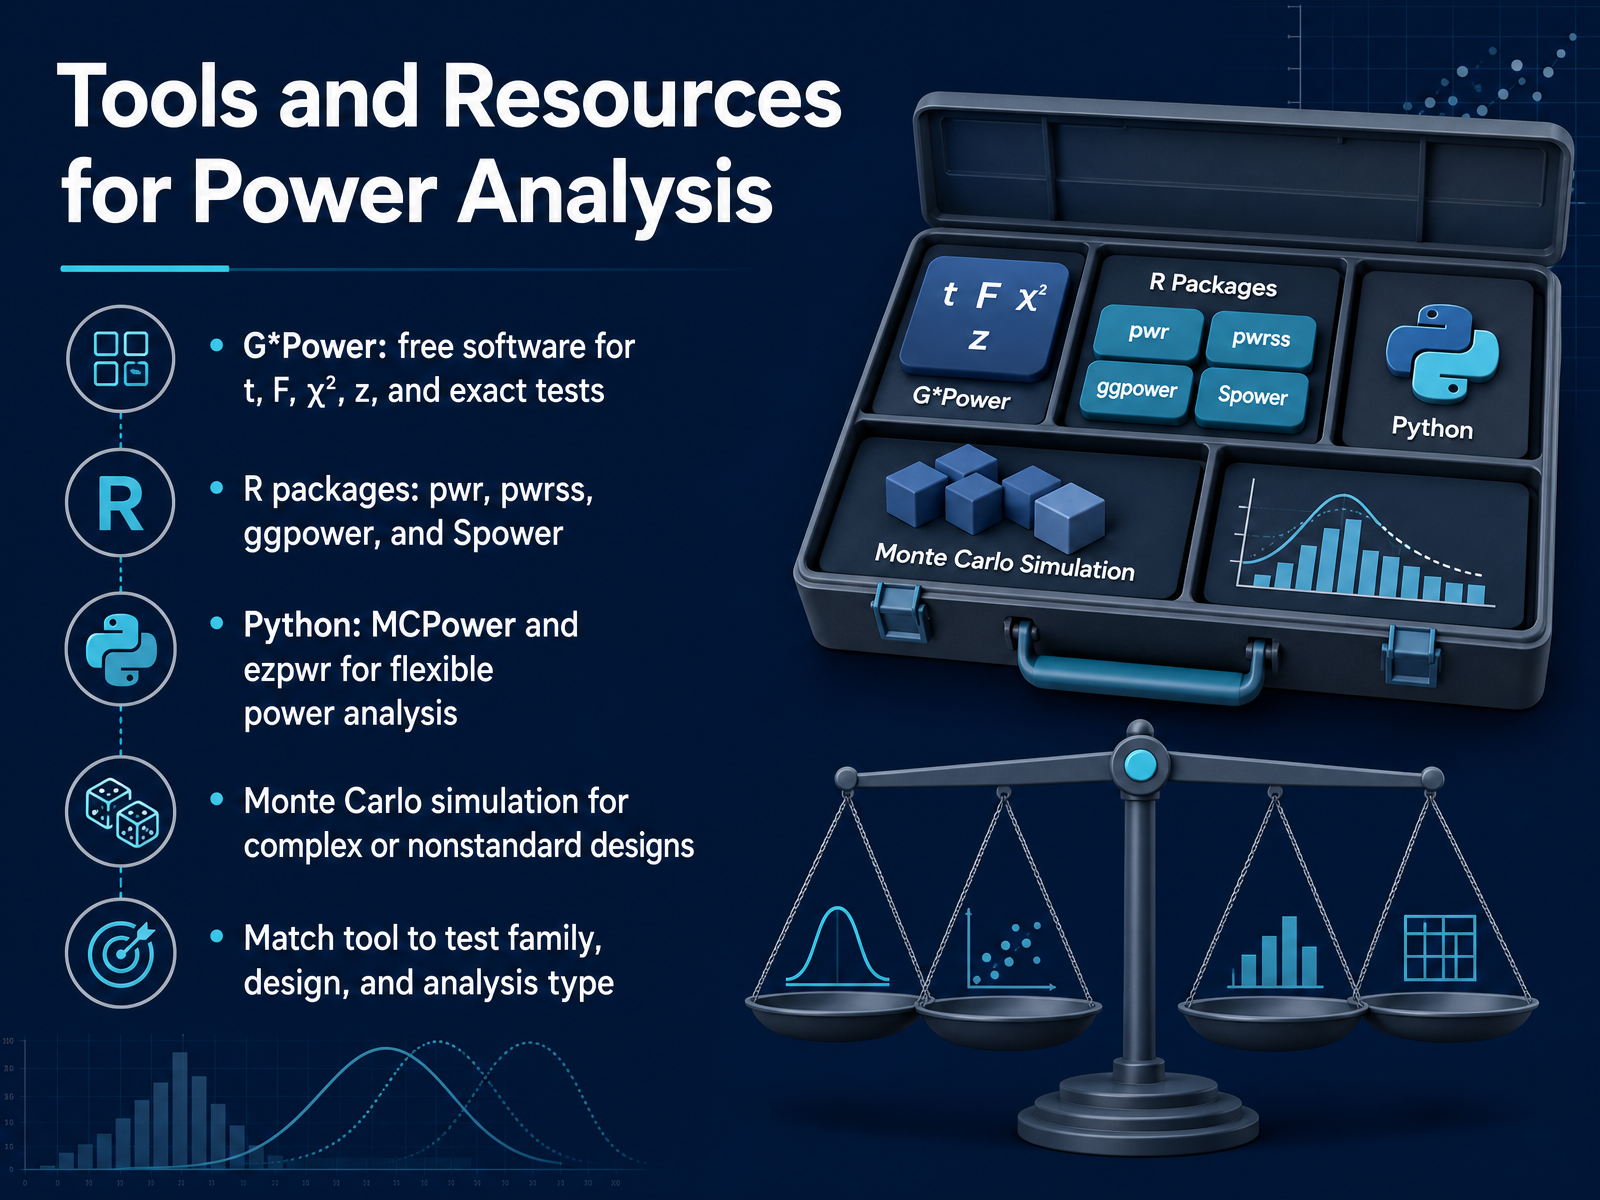
 - 14Tools and Resources for Power AnalysisYou have the concepts, the formulas, and the judgment. Now you need the right tools to put power analysis into practice. For most standard designs, G*Power remains the go-to starting point. It is free, covers t tests, F tests, chi-square tests, z tests, and exact tests, and gives you both numerical output and clear distribution plots. If you work in R, the pwr and pwrss packages handle routine calculations well and integrate smoothly with your analysis workflow. The ggpower package adds a graphical interface and publication-ready power curves. When your design is complex, a Monte Carlo simulation is your best answer. The R package Spower and the Python package MCPower let you simulate thousands of datasets that match your specific structure, including interactions, correlated predictors, or non-normal data. The Python toolkit ezpwr is another practical option for flexible sample size and power calculations. My advice: match the tool to your test family, your design, and your analysis type. Use a formula-based tool when assumptions are clean. Switch to simulation when they are not. This is the final step. You now have the full toolkit to design studies with confidence, justify your sample size, and defend your conclusions. Thank you for your attention, and go run your power analysis before you collect another row of data.
 2 min
2 min
Take the deck with you
Download this course as a file — free, no sign-up needed.
- PDF handoutEvery slide page, ready to print or share.15 pages · 3.2 MBDownload
- Narrated PowerPointThe deck that presents itself — every slide carries the digital human's narration video.15 pages · 14.5 MBDownload
- PowerPoint slidesThe full deck as a .pptx — open it in PowerPoint, Keynote, or Google Slides.15 pages · 3.1 MBDownload
Free to use in your own training — please keep the PersonWise credit page at the end.
Have your own deck? Turn it into a course
Sources consulted
Web sources consulted while building this course.
- Type I and Type II Errors and Statistical Power - StatPearls - NCBI Bookshelf — ncbi.nlm.nih.gov
- Statistical Power and Why It Matters | A Simple Introduction — scribbr.com
- Power (statistics) — en.wikipedia.org
- Statistical Power: What Is It and When Should It Be Used? - PMC — pmc.ncbi.nlm.nih.gov
- 11.1: What is statistical power? - Statistics LibreTexts — stats.libretexts.org
- https://casrai.org/guides/power-analysis-sample-size-calculation — casrai.org
- A Practical Primer To Power Analysis for Simple Experimental Designs — rips-irsp.com
- Biostatistics Guide: Power Analysis & Sample Size — beckerguides.wustl.edu
- Sample Size Calculation with G*Power: Step-by-Step Guide — analisisdedatospsicologia.com
- Power Rules: Practical Statistical Power Calculations — doi.org
- Statistical power analysis -- Advanced Statistics using R — advstats.psychstat.org
- Sample size, power and effect size revisited - PMC - NIH — pmc.ncbi.nlm.nih.gov
- Factors that Affect the Power of a Statistical Procedure — web.ma.utexas.edu
- Best (but oft forgotten) practices: sample size planning for powerful studies — sciencedirect.com
- What is statistical power? How to calculate sample size, effect size, and power | Editage Insights — editage.com
- Power failure: why small sample size undermines the reliability of neuroscience | Nature Reviews Neuroscience — nature.com
- Why are replication rates so low? — sciencedirect.com
- Power failure: why small sample size undermines the reliability of neuroscience — doi.org
- Empirical assessment of published effect sizes and power in the recent cognitive neuroscience and psychology literature - PMC — pmc.ncbi.nlm.nih.gov
- How Replicable Are Statistically Significant Findings? — arxiv.org