Begin
14 pages · ~28 min
Customer Education Program Design Patterns
This training helps customer education teams design effective programs by examining proven patterns, strengths, and common pitfalls.
A digital instructor presents all 14 pages. Hold “Ask” at any point and ask out loud — the answer comes from this course. No sign-up needed.
What you’ll learn
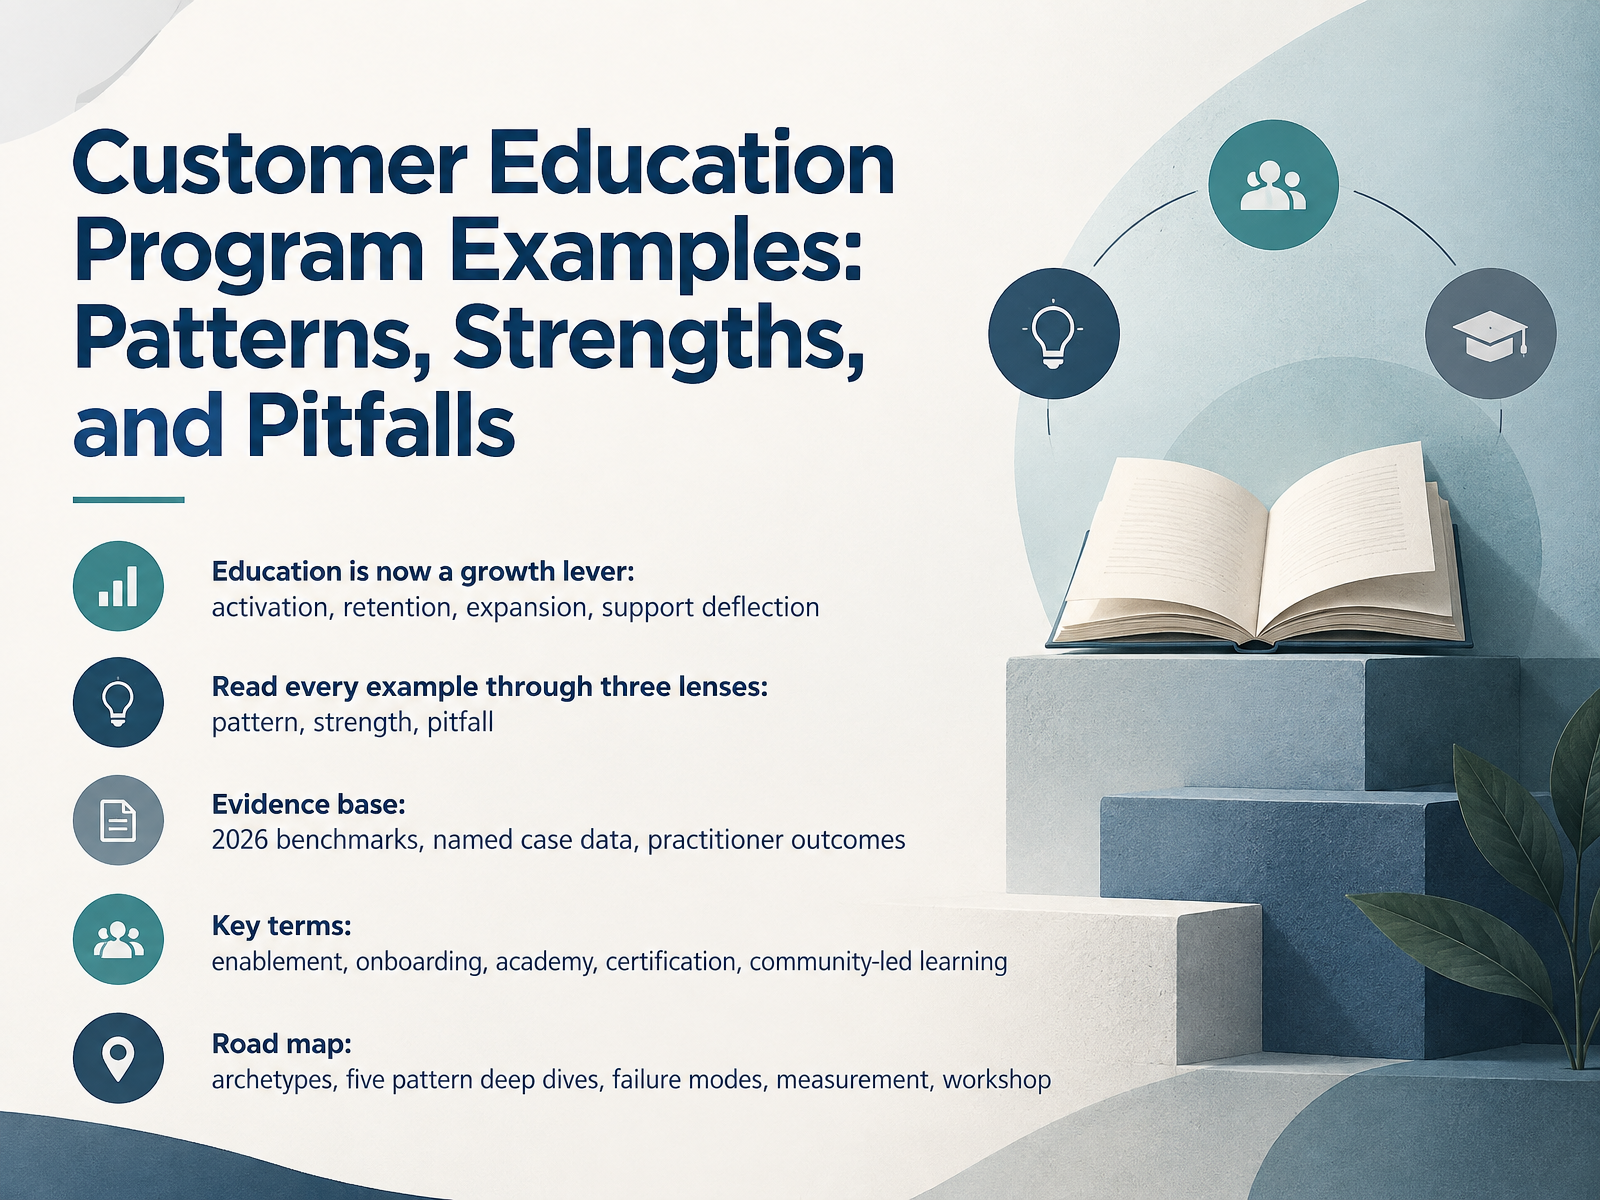
- 01Customer Education Program Examples: Patterns, Strengths, and PitfallsWelcome. Let's talk about customer education program examples, and how to read them well. Education is no longer just a support function. It's a growth lever. It drives activation, retention, expansion, and support deflection. So the goal here is practical. We'll look at real examples through three lenses. First, the pattern. What design choice is being repeated? Second, the strength. What does that choice make easier for the learner? Third, the pitfall. What trade-off or failure mode shows up if you copy it blindly? Our evidence base comes from 2026 benchmarks, named case data, and practitioner outcomes. We'll also use a shared vocabulary: enablement, onboarding, academy, certification, and community-led learning. Here's the road map. We'll start with archetypes. Then five pattern deep dives. Next, failure modes. Then measurement. And we'll finish with a workshop. As we go, map each example to your own program. Ask yourself: what would this cost to implement, and what learner outcome would it change? That keeps the analysis honest. Next, we'll ground the terms in definitions and scope, so we're precise about education, enablement, and where this work sits.2 min
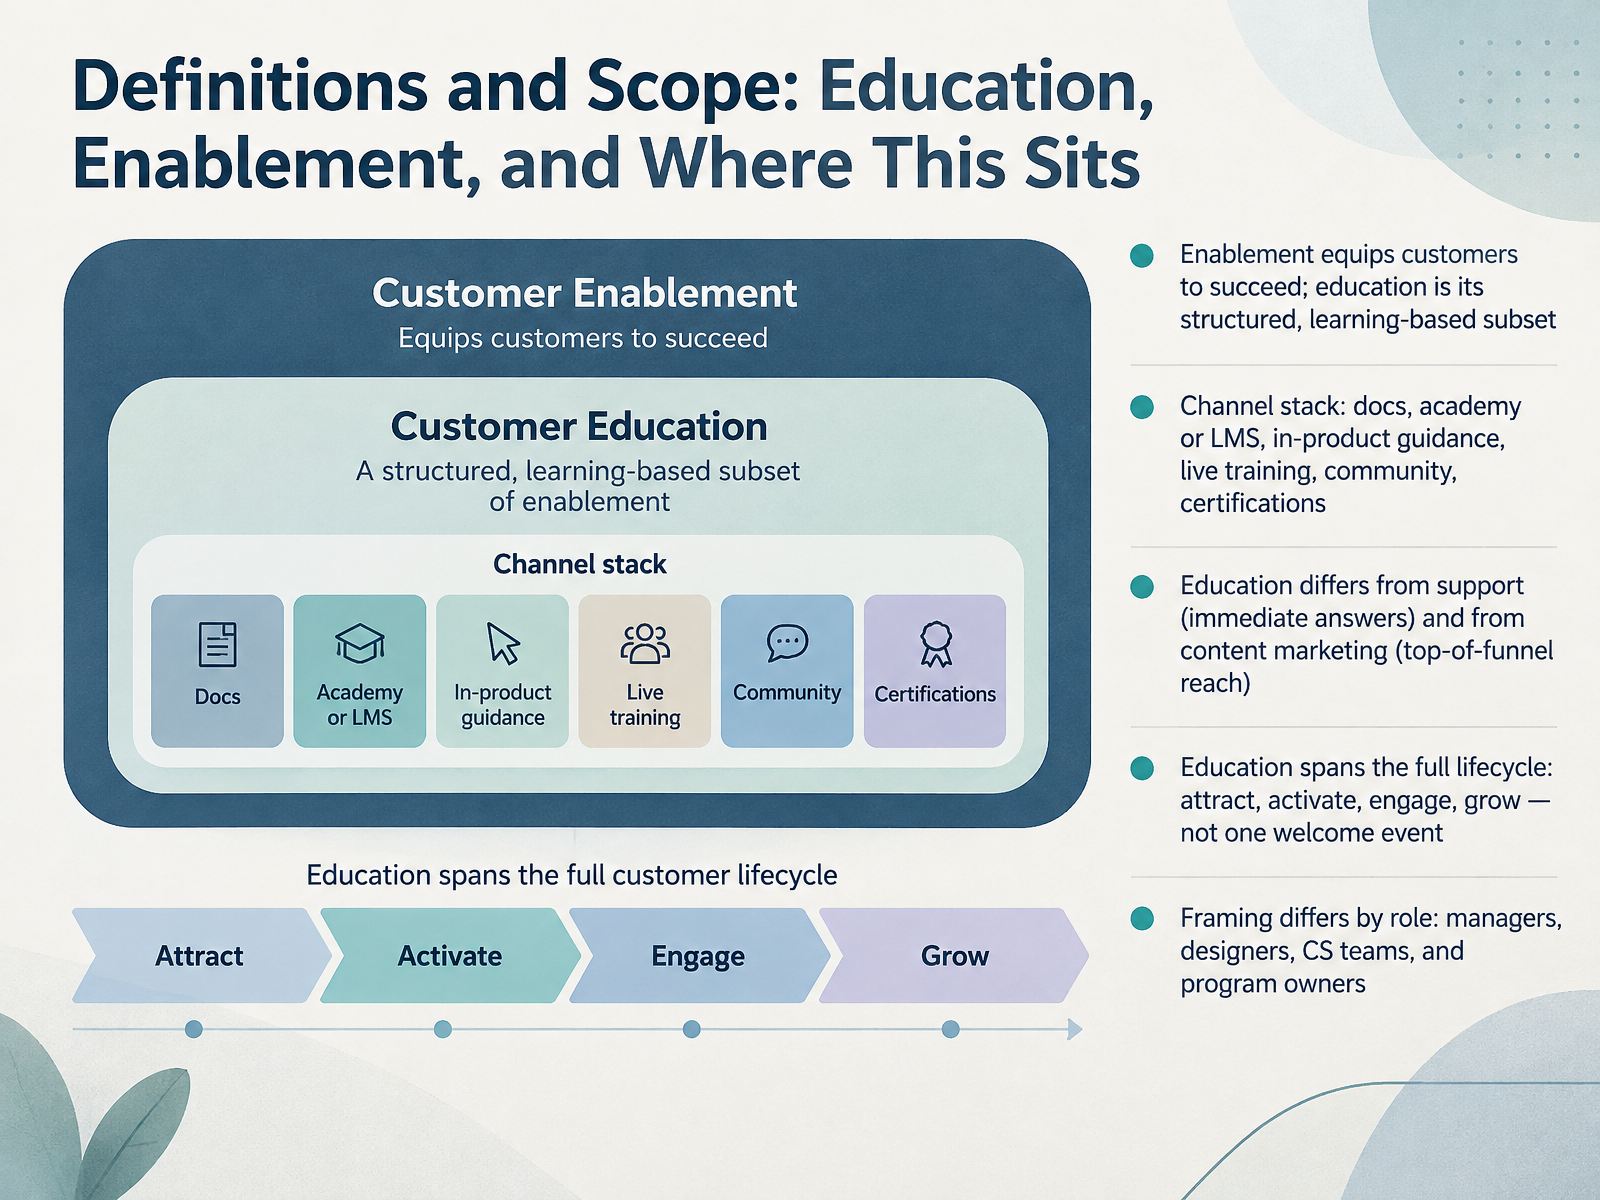
- 02Definitions and Scope: Education, Enablement, and Where This SitsLet's draw some clear lines, because the words we use shape the programs we build. Enablement is the broad goal. It equips customers to succeed with your product. Education is the structured, learning-based subset of that. It has objectives, practice, and assessment. Now, think about your channel stack. Documentation, an academy or L M S, in-product guidance, live training, community, and certifications. These are delivery channels, not the strategy itself. Education also differs from support, which gives immediate answers, and from content marketing, which mostly chases top-of-funnel reach. Education spans the full lifecycle. Attract, activate, engage, grow. It is not one welcome event. And the framing shifts by role. Managers care about outcomes and coverage. Designers care about sequence and cognitive load. Customer success teams care about adoption signals. Program owners care about scope and effort. So before you copy any example, check which pattern you are actually solving for. That single question will save you weeks of rework. Next, we look at the 2026 landscape, including maturity, spend, and what the benchmarks say.
 2 min
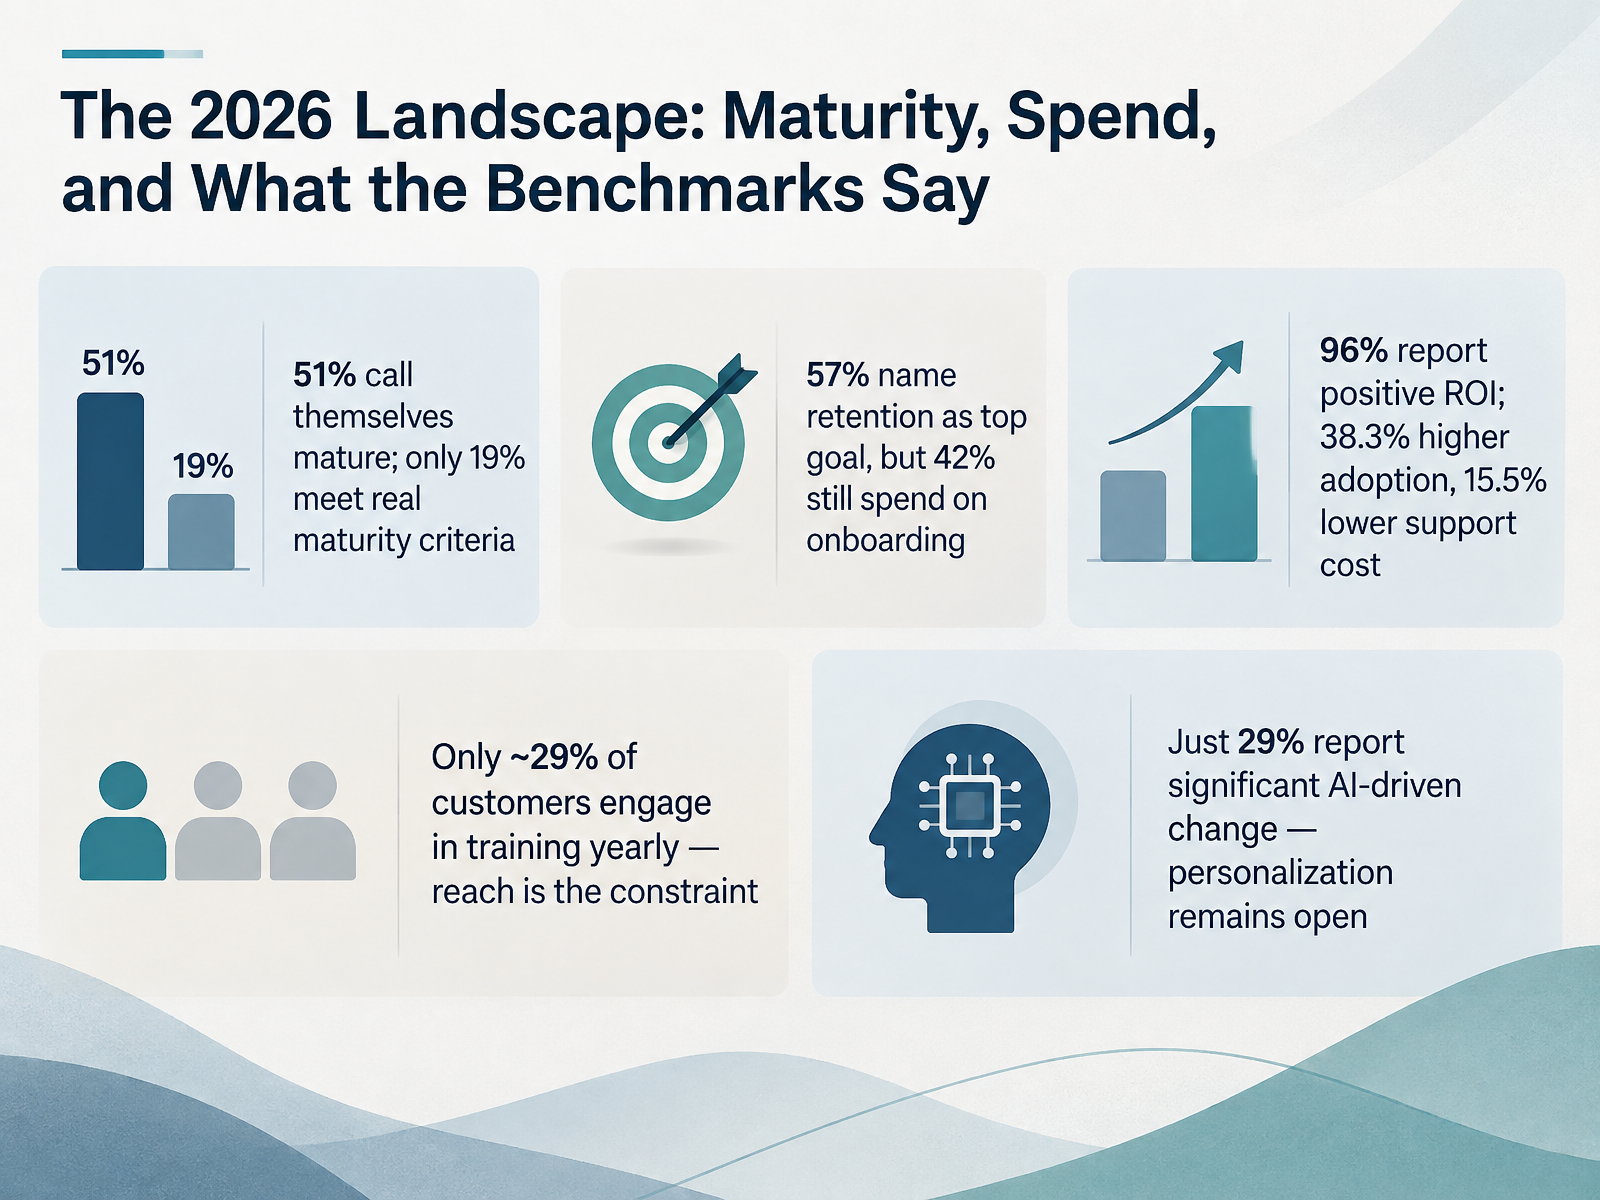
- 03The 2026 Landscape: Maturity, Spend, and What the Benchmarks SayLet's look at the 2026 landscape, because the benchmarks tell a story worth examining. Fifty-one percent of organizations call themselves mature. Only nineteen percent actually meet real maturity criteria. That gap matters. It means many programs are confident, but not yet structured for scale. Now look at goals and spend. Fifty-seven percent name retention as their top goal, yet forty-two percent still spend on onboarding. That is a misalignment. Onboarding matters, but if retention is the goal, your budget should follow the full customer journey. The ROI picture is stronger. Ninety-six percent report positive ROI. That shows up as thirty-eight point three percent higher adoption, and fifteen point five percent lower support cost. Good evidence for program leads. But here is the constraint. Only about twenty-nine percent of customers engage in training yearly. Reach, not content quality, is often the bottleneck. And only twenty-nine percent report significant AI-driven change. So personalization is still an open opportunity. Next, we'll look at program archetypes, the six shapes you will see in the wild.
 2 min
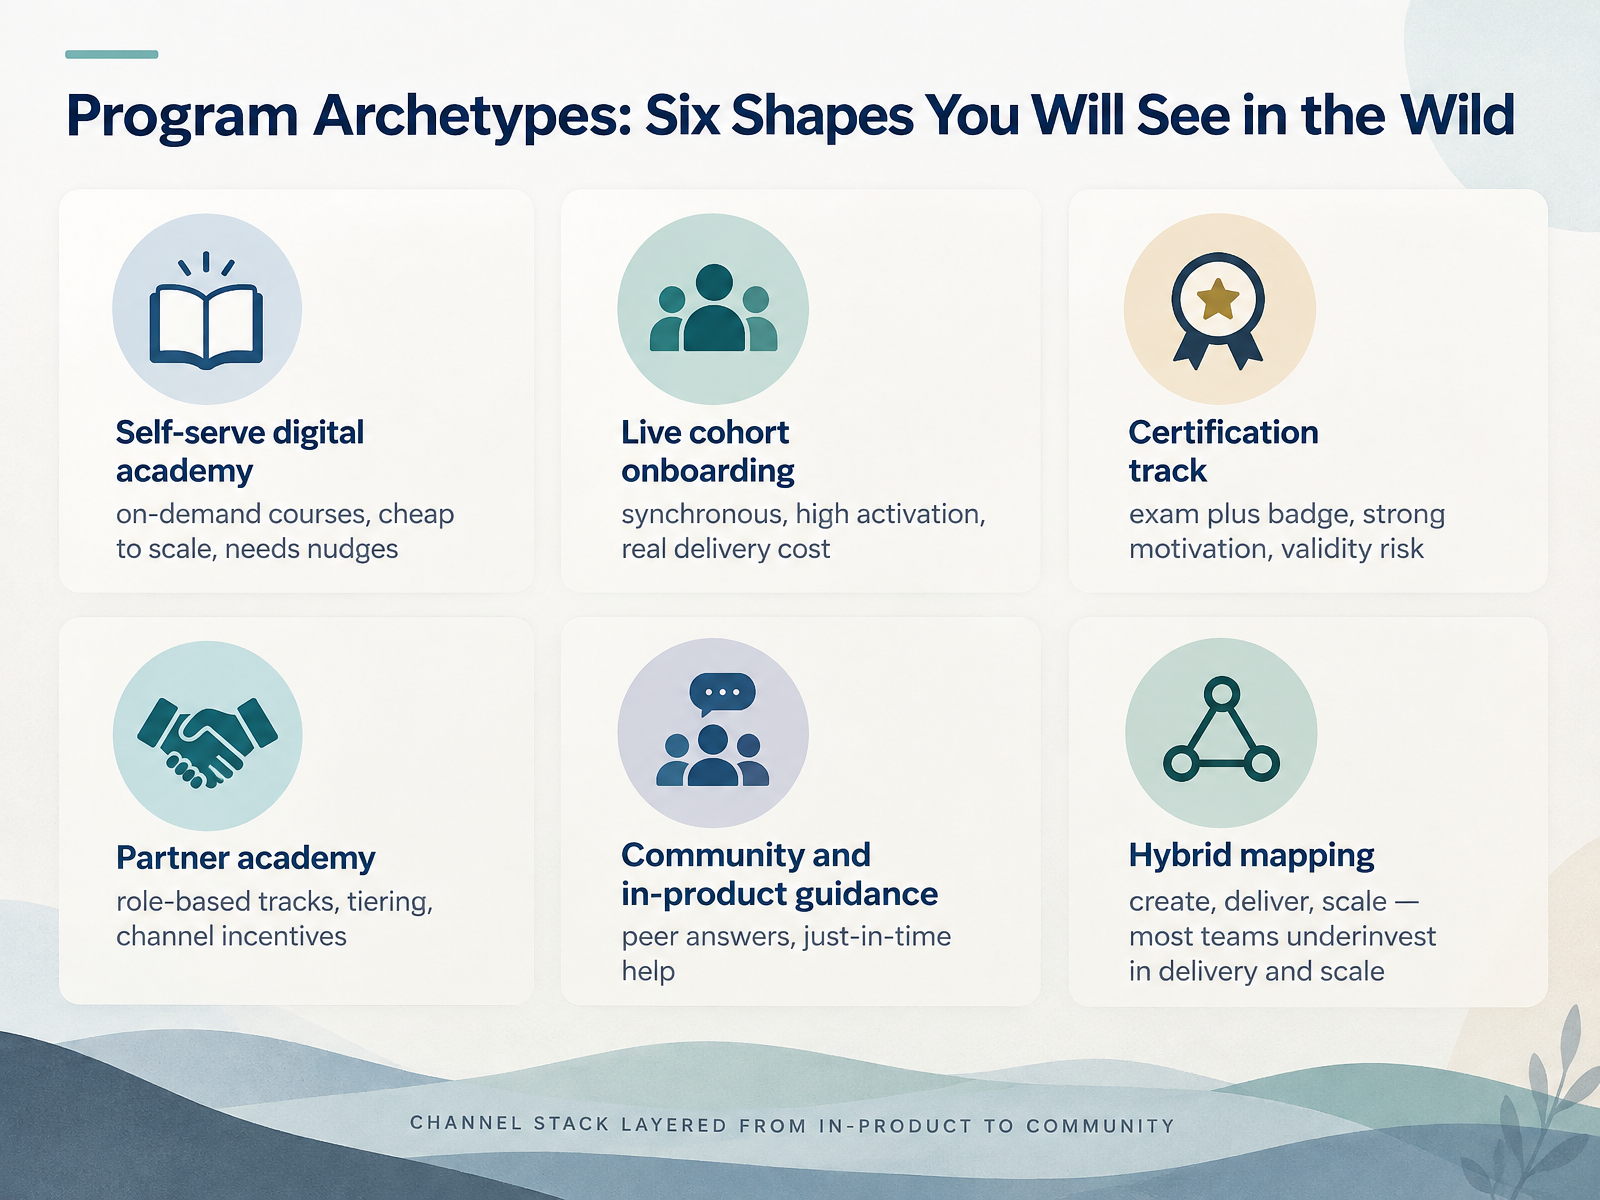
- 04Program Archetypes: Six Shapes You Will See in the WildNow, let's walk through six program archetypes you will likely see in the wild. First, the self-serve digital academy. On-demand courses, cheap to scale, but it depends on nudges to keep learners moving. Next, live cohort onboarding. Synchronous sessions drive high activation, yet they carry real delivery cost. Then the certification track. An exam plus a badge creates strong motivation, but watch for validity risk if the assessment drifts from actual job tasks. The partner academy uses role-based tracks, tiering, and channel incentives to align external teams. Community and in-product guidance delivers peer answers and just-in-time help, which is fast but needs curation. Finally, hybrid mapping across create, deliver, and scale. Most teams underinvest in delivery and scale. Notice the trade-offs here: reach, cost, and proof of skill rarely peak together. As you map these to your own program, ask which archetype you actually run, and where the gaps sit. That sets up our next section on designing for real customer jobs. Let's look at Pattern 1, Outcome-First Curriculum Tied to Customer Jobs.
 2 min
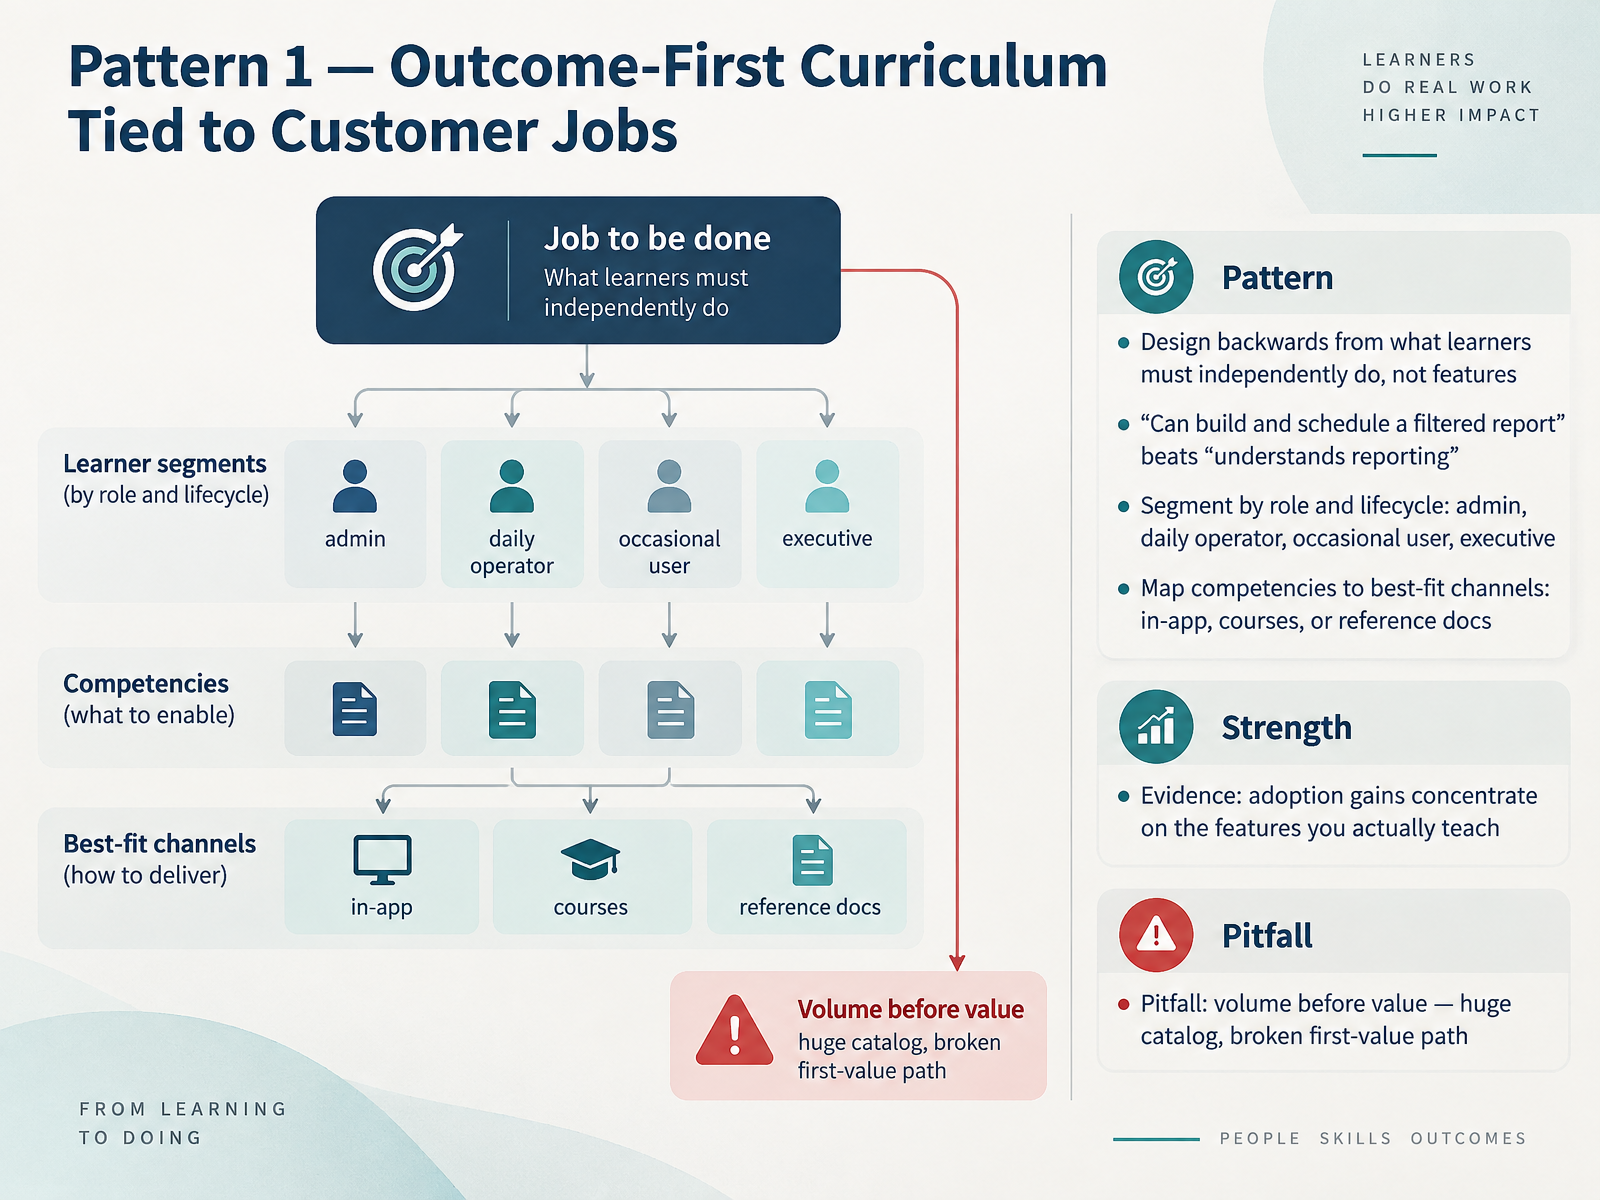
- 05Pattern 1 — Outcome-First Curriculum Tied to Customer JobsLet's look at our first pattern: an outcome-first curriculum tied to customer jobs. The core design choice is to work backwards from what learners must independently do, not from your feature list. So the outcome is, can build and schedule a filtered report. That beats, understands reporting. Notice the difference. One is observable. The other is not. Next, segment by role and lifecycle. An admin needs different depth than a daily operator, an occasional user, or an executive. Then map each competency to the best-fit channel. Some skills belong in-app at the moment of need. Some belong in a course. Others belong in reference docs. Here is your evidence check. Adoption gains concentrate on the features you actually teach. Teach it, and usage tends to follow. The pitfall to watch is volume before value. A huge catalog with a broken first-value path looks impressive, but it stalls new users before their first win. So for your own program, pick one customer job, define the observable outcome, and build the shortest path to it. That brings us to our next pattern: Pattern 2, Blended Delivery: Self-Paced, Live, and In-Product.
 2 min
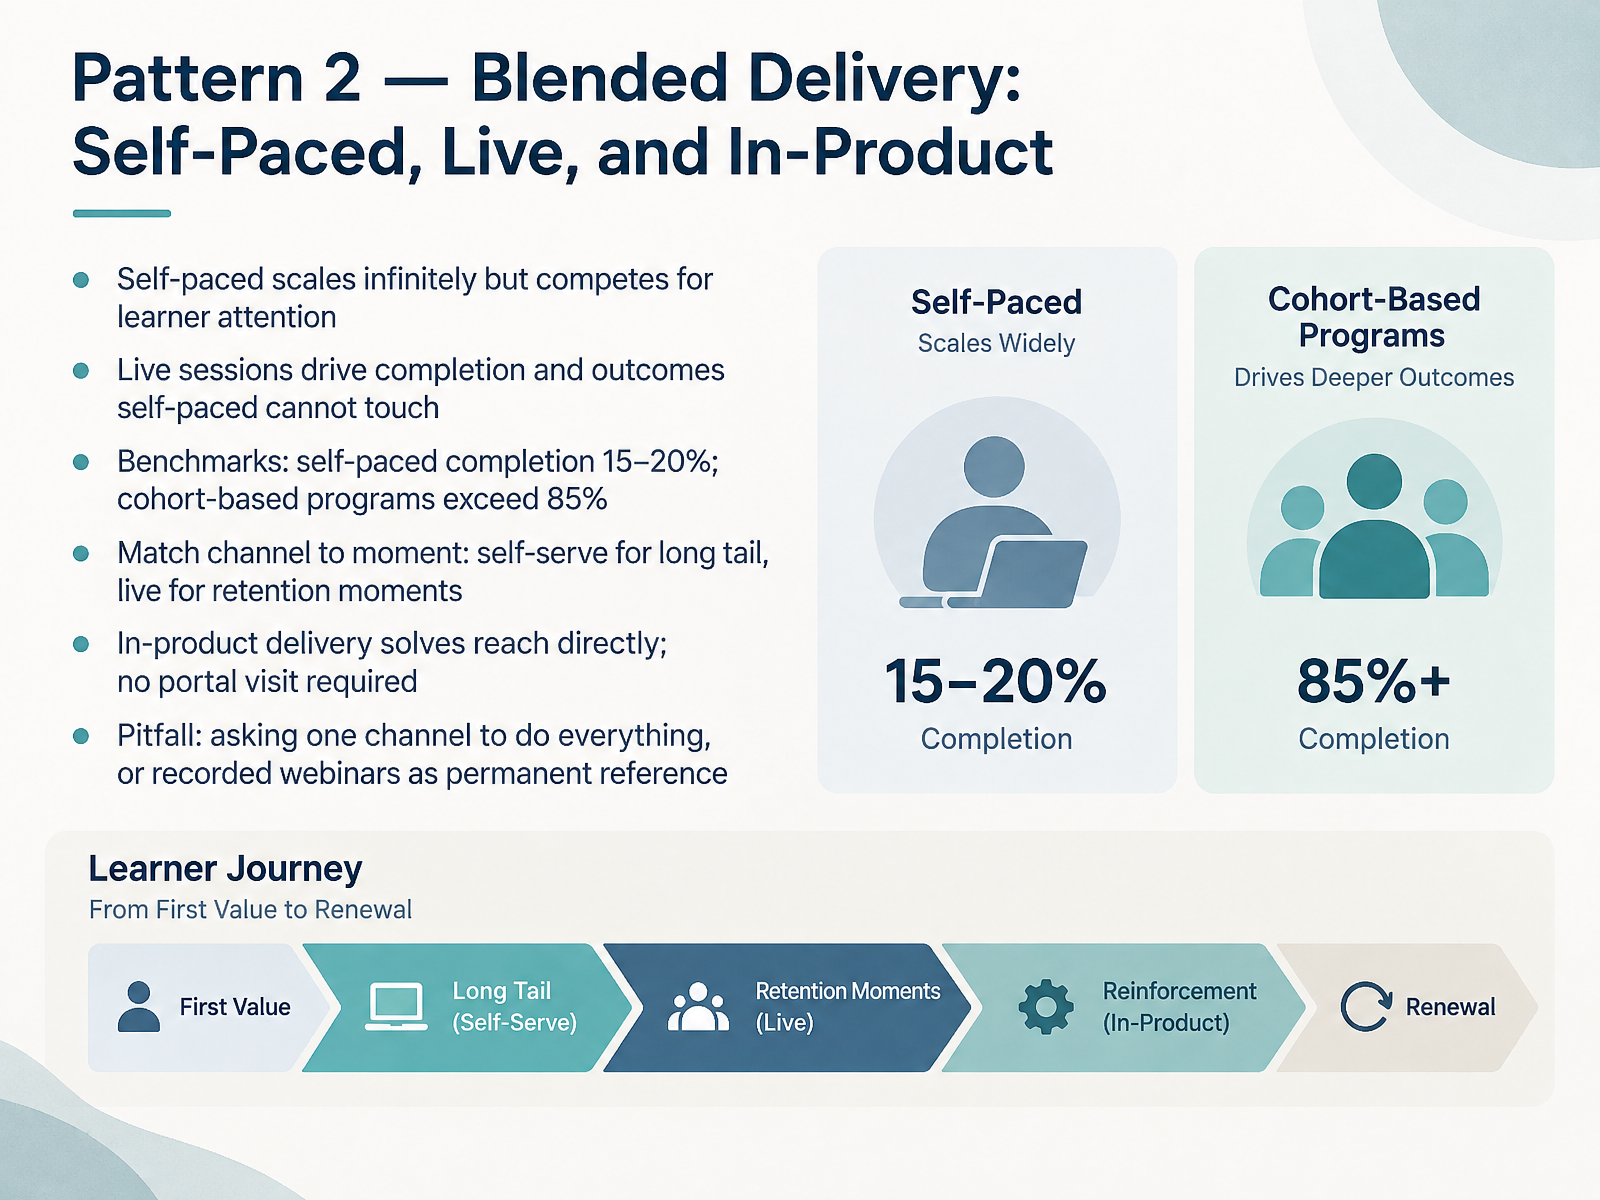
- 06Pattern 2 — Blended Delivery: Self-Paced, Live, and In-ProductLet's look at pattern two: blended delivery, combining self-paced, live, and in-product channels. Self-paced content scales infinitely, but it competes for learner attention every single day. Live sessions drive completion and outcomes that self-paced content simply cannot touch. The benchmarks make this concrete. Self-paced completion typically lands between fifteen and twenty percent. Cohort-based programs often exceed eighty-five percent. That gap is not about content quality. It is about channel fit. So match the channel to the moment. Use self-serve for the long tail of learners who need answers on their own schedule. Use live for retention moments, where commitment and accountability matter most. In-product delivery solves reach directly, because learners never have to visit a separate portal. Here is the pitfall. Asking one channel to do everything, or treating recorded webinars as permanent reference material. Recordings lose context, and they age quickly. Instead, choose channels deliberately based on learner intent and business moment. Next, pattern three: certification and credentials as the engagement engine.
 2 min
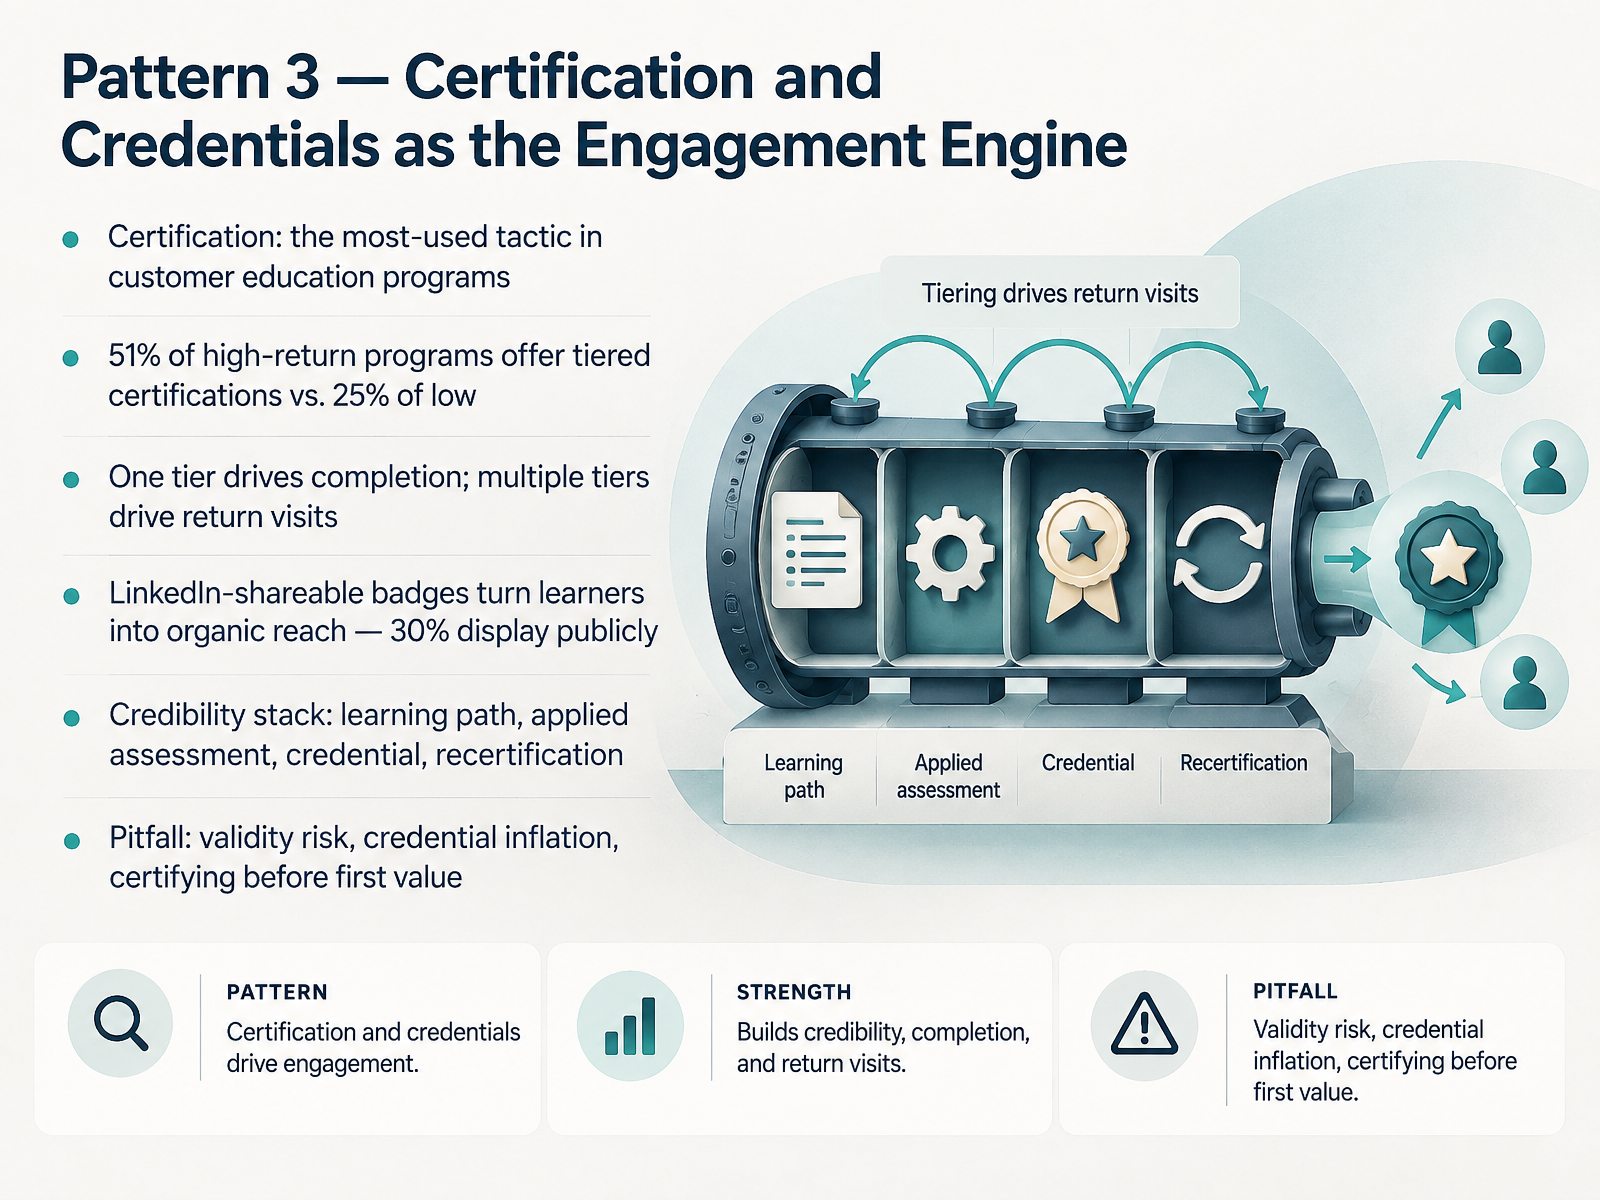
- 07Pattern 3 — Certification and Credentials as the Engagement EngineNow let's look at a pattern many of you already use: certification and credentials as the engagement engine. Certification is the most-used tactic in customer education programs, and the data tells an interesting story. Fifty-one percent of high-return programs offer tiered certifications, compared with just twenty-five percent of low-return programs. Here's the distinction that matters. One tier drives completion. Multiple tiers drive return visits. Learners finish level one, and the next tier gives them a reason to come back. Shareable badges add another layer. Roughly thirty percent of learners display them publicly, which turns your customers into organic reach on LinkedIn and beyond. The credibility stack is learning path, applied assessment, credential, then recertification. But watch the pitfalls. Validity risk, credential inflation, and certifying before the customer has seen first value. So check your program: does your certification precede value, or reinforce it? Next, we turn to Pattern 4, Data-Informed Iteration and the Instrumentation Order.
 2 min
- 08Pattern 4 — Data-Informed Iteration and the Instrumentation OrderLet's look at Pattern 4: data-informed iteration, and the instrumentation order.
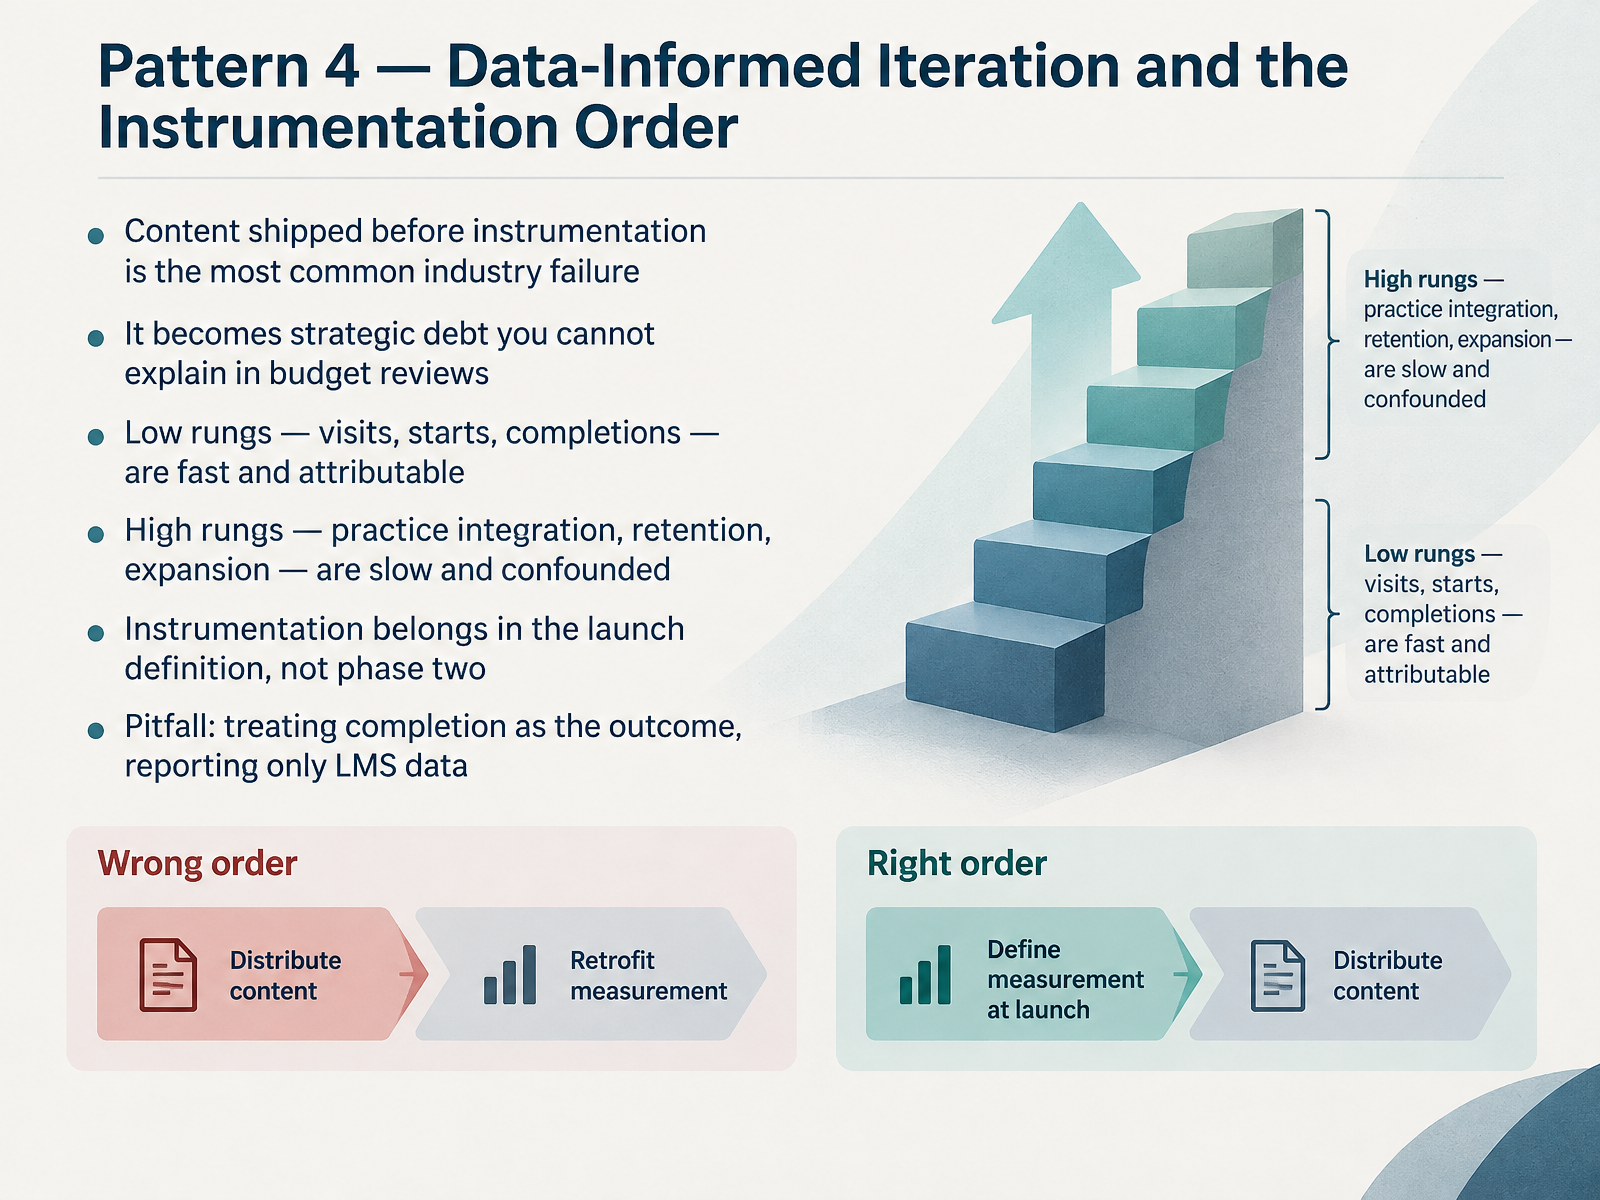
Here's the hard truth. Content shipped before instrumentation is the most common industry failure. Teams build the course, launch it, then ask how we'll measure this. By then, it's too late. That gap becomes strategic debt, and you cannot explain strategic debt in a budget review.
Think in rungs. Low rungs, like visits, starts, and completions, are fast and attributable. You get them quickly, and you can tie them to a campaign. High rungs, like practice integration, retention, and expansion, are slow and confounded. They're the outcomes that matter, but they take months and many variables push on them.
So instrumentation belongs in the launch definition, not phase two. If you can't state the metric at kickoff, you're not ready to build.
The pitfall here is treating completion as the outcome and reporting only LMS data. Completion is a low rung. It tells you people finished, not that behavior changed.
Before we move on, ask yourself one question. What will you measure before you build? That answer shapes your launch.
Next, Pattern 5: cross-functional governance and ownership.
 2 min
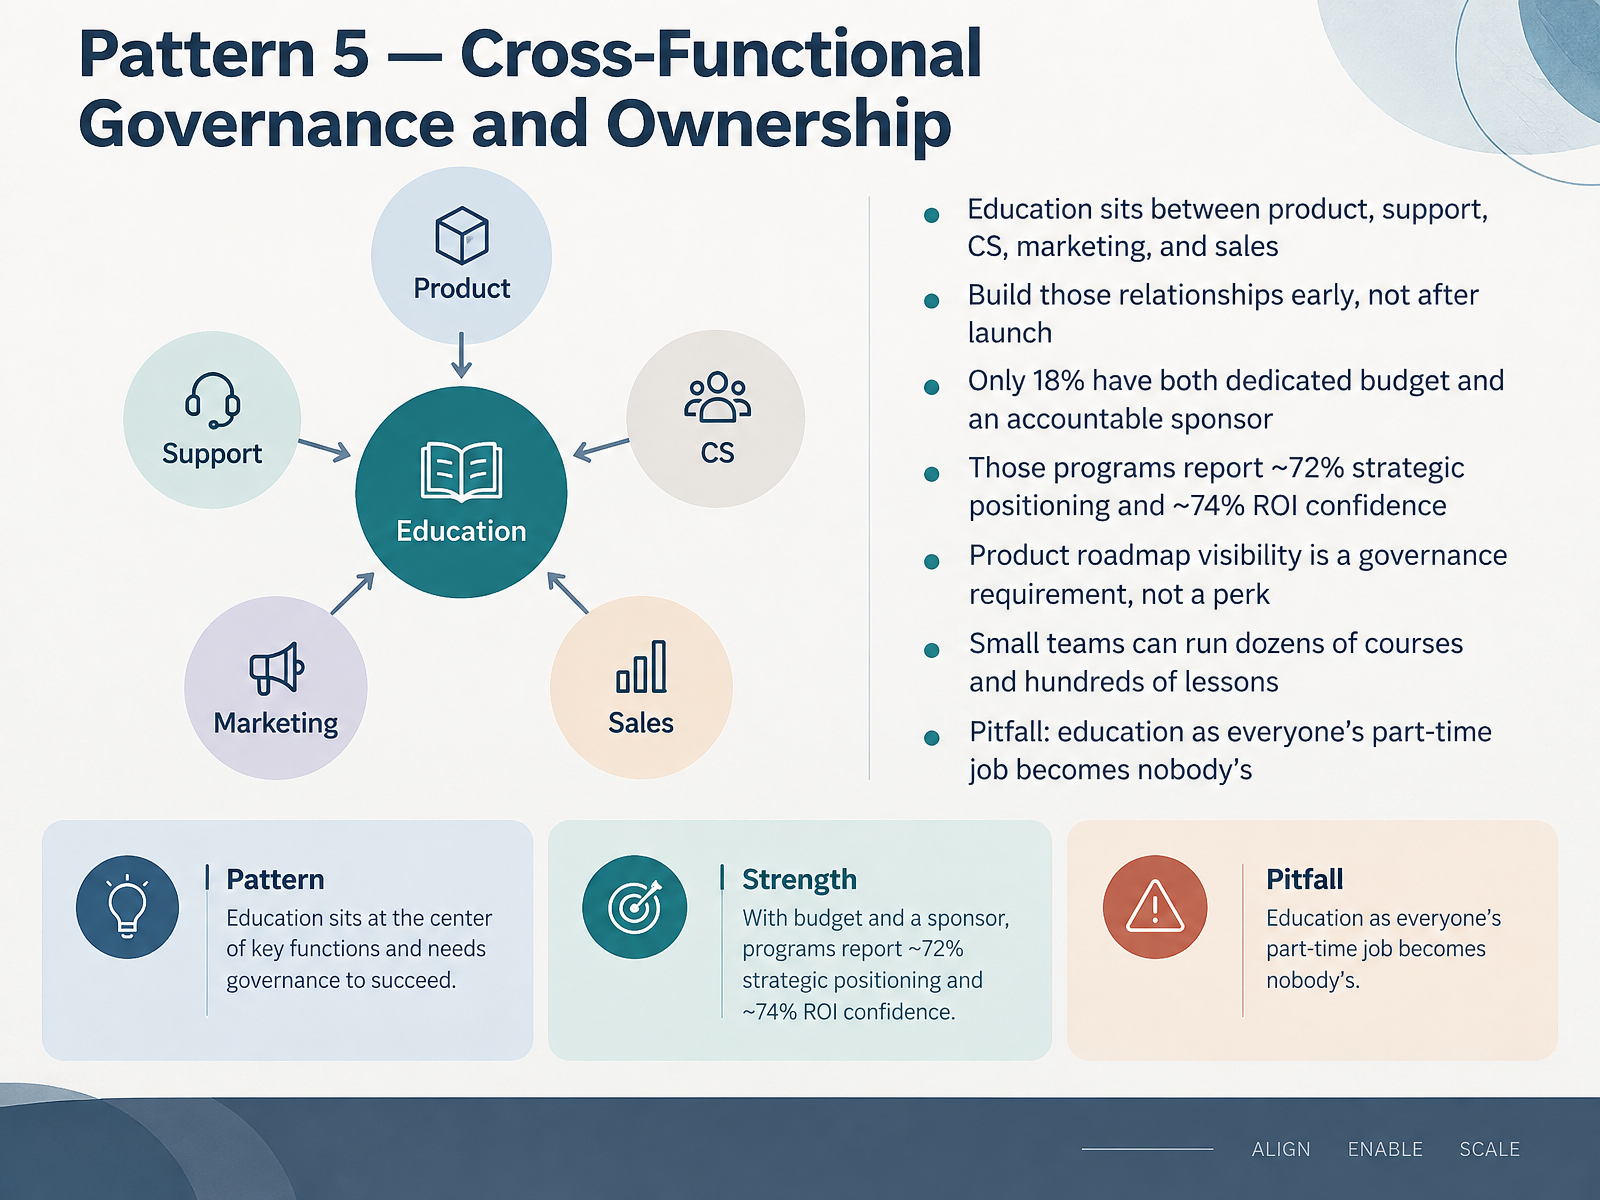
- 09Pattern 5 — Cross-Functional Governance and OwnershipLet's look at Pattern Five, cross-functional governance and ownership.
Customer education rarely lives in one department. It usually sits between product, support, customer success, marketing, and sales. That position is a strength, but only if you build those relationships early, not after launch.
The data here is telling. Only eighteen percent of programs have both a dedicated budget and an accountable sponsor. Those programs report about seventy-two percent strategic positioning and about seventy-four percent ROI confidence. So governance is not bureaucracy. It is what turns shared interest into funded, sustained work.
Product roadmap visibility is a governance requirement, not a perk. Without it, you plan courses against yesterday's product. With it, you sequence lessons around what is actually shipping.
And scale does not require a huge team. Small teams can run dozens of courses and hundreds of lessons when ownership is clear.
The pitfall is simple. When education becomes everyone's part-time job, it becomes nobody's.
Next, we will look at a deep dive. Self-serve digital academy in practice.
 2 min
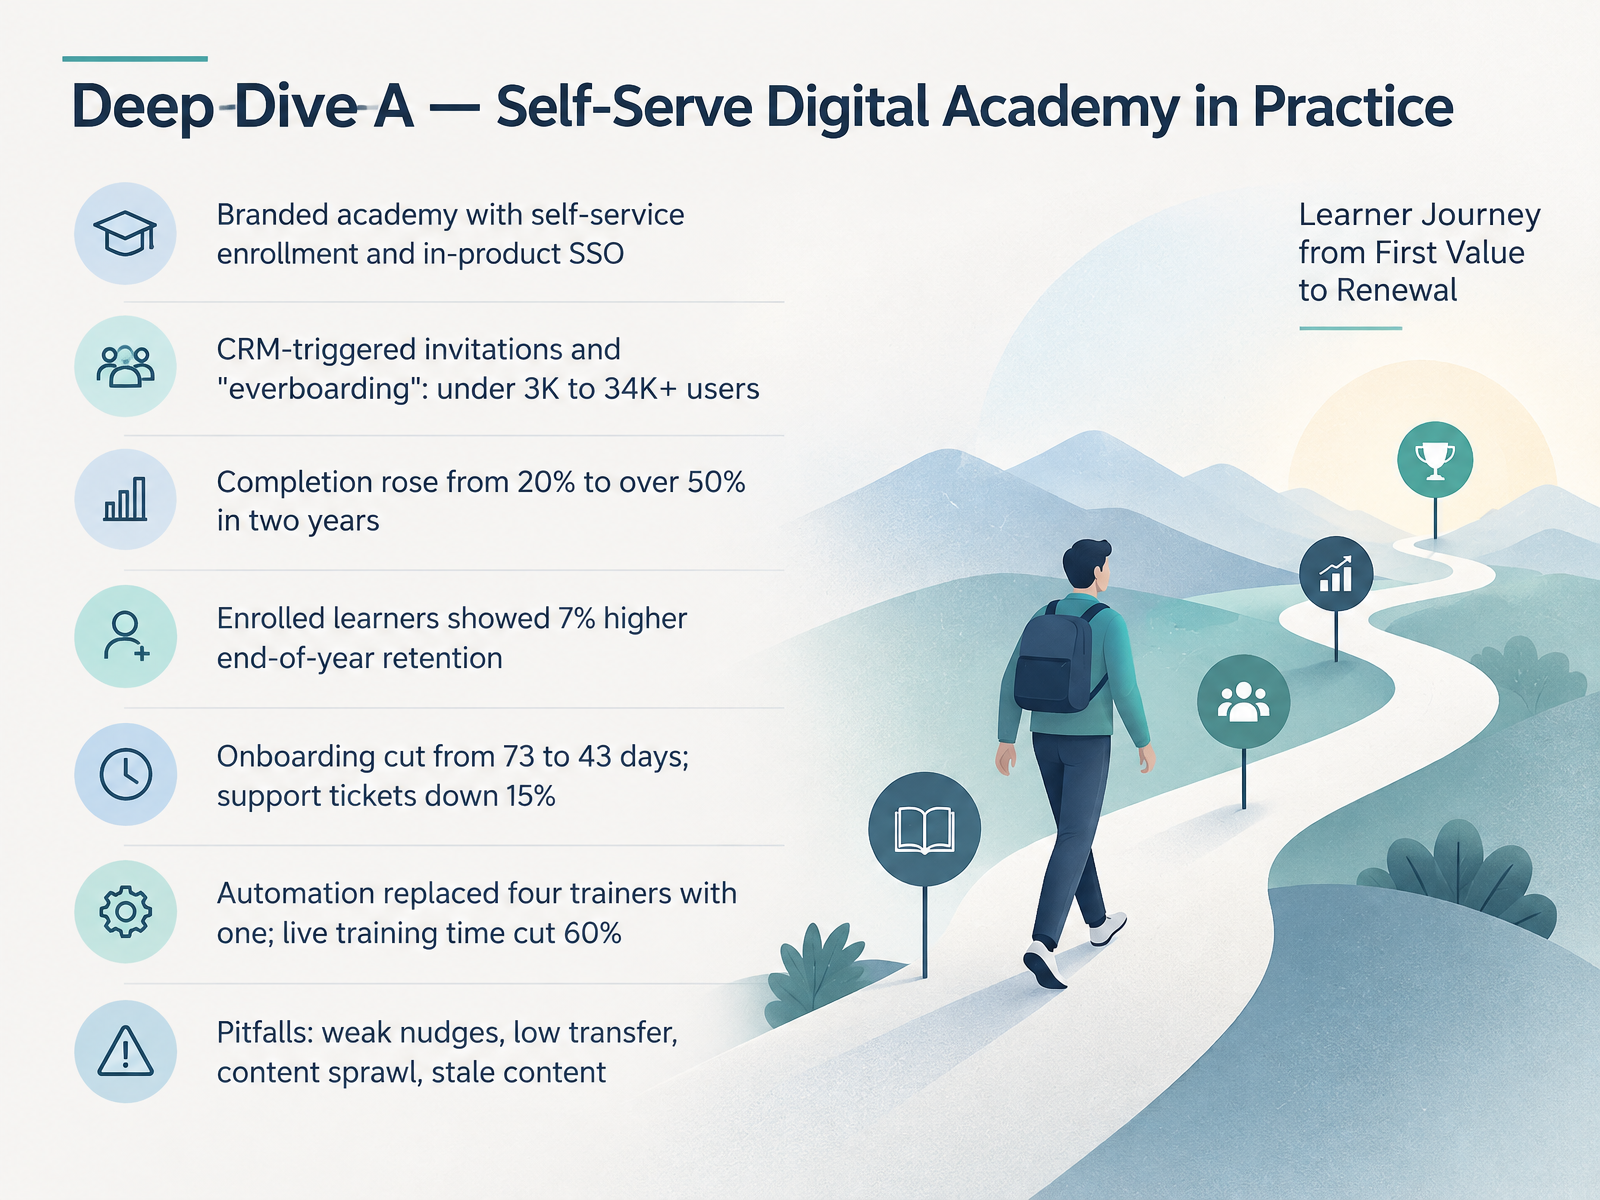
- 10Deep Dive A — Self-Serve Digital Academy in PracticeLet's look at our first real pattern: a self-serve digital academy. The setup is a branded academy with self-service enrollment and single sign-on inside the product. Invitations fire automatically from your customer relationship management system, and the program keeps going past onboarding, an everboarding model. That combination took this company from under three thousand users to more than thirty-four thousand. Completion climbed from twenty percent to over fifty percent in two years. Enrolled learners showed seven percent higher end-of-year retention. Onboarding dropped from seventy-three days to forty-three, and support tickets fell fifteen percent. Automation replaced four trainers with one, and live training time dropped sixty percent. Strong numbers, but note the trade-offs. Weak nudges, low transfer, content sprawl, and stale content all limit the payoff, and each one costs real implementation effort to fix. So before you copy this, ask which automation you can sustain and how you will keep content fresh. That leads us to a different model. Deep Dive B, live cohorts and partner certification academies.
 2 min
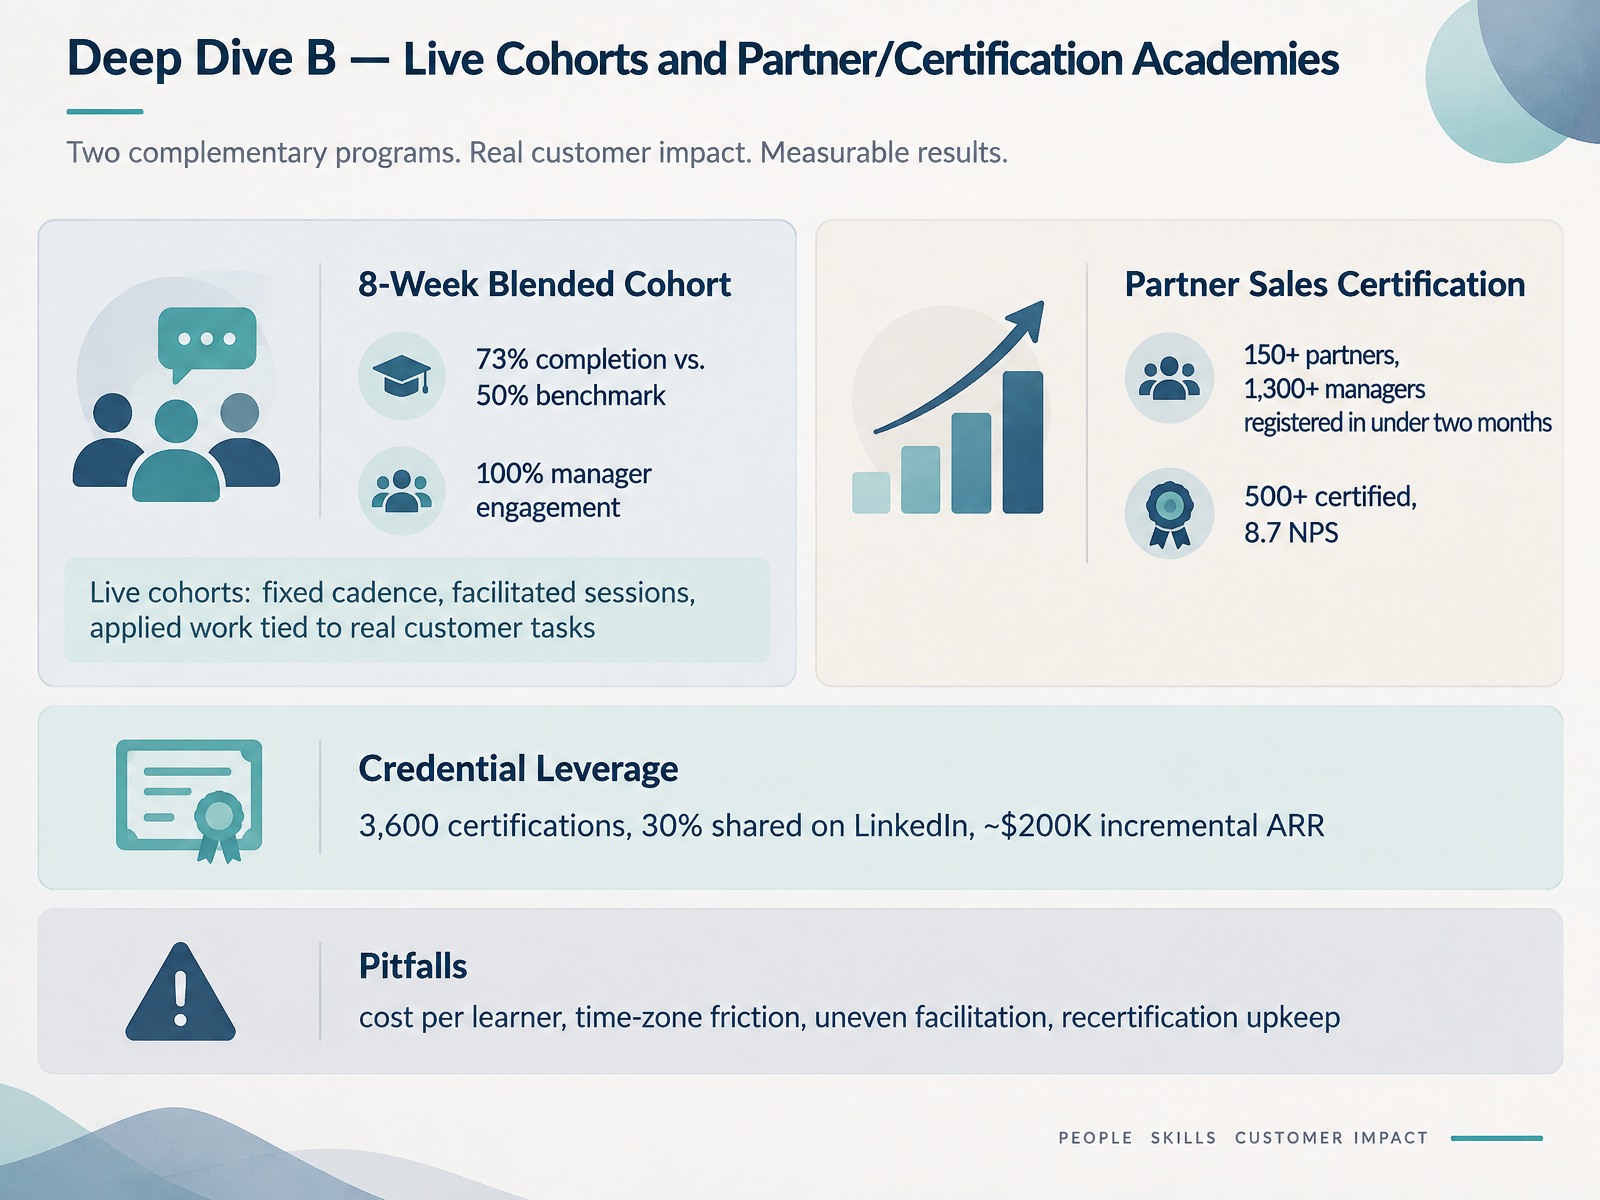
- 11Deep Dive B — Live Cohorts and Partner/Certification AcademiesLet us look at two live formats that consistently outperform self-paced options. The first pattern is the live cohort. You commit to a fixed cadence, you facilitate sessions, and you tie applied work to real customer tasks. One blended cohort ran for eight weeks and hit seventy three percent completion, against a fifty percent benchmark, with full manager engagement. That is a clear trade-off. High completion and real behavior change, in exchange for facilitation time and scheduling discipline. The second pattern is the partner and certification academy. A partner sales certification registered over one hundred fifty partners and more than one thousand three hundred managers in under two months. Credentials also carry leverage. Three thousand six hundred certifications, about thirty percent shared on LinkedIn, and roughly two hundred thousand dollars in incremental annual recurring revenue. But name the pitfalls directly. Cost per learner, time-zone friction, uneven facilitation, and recertification upkeep. So before you scale either format, decide which of those four you can realistically absorb. Now let us turn to the common pitfalls and failure modes to design against.
 2 min
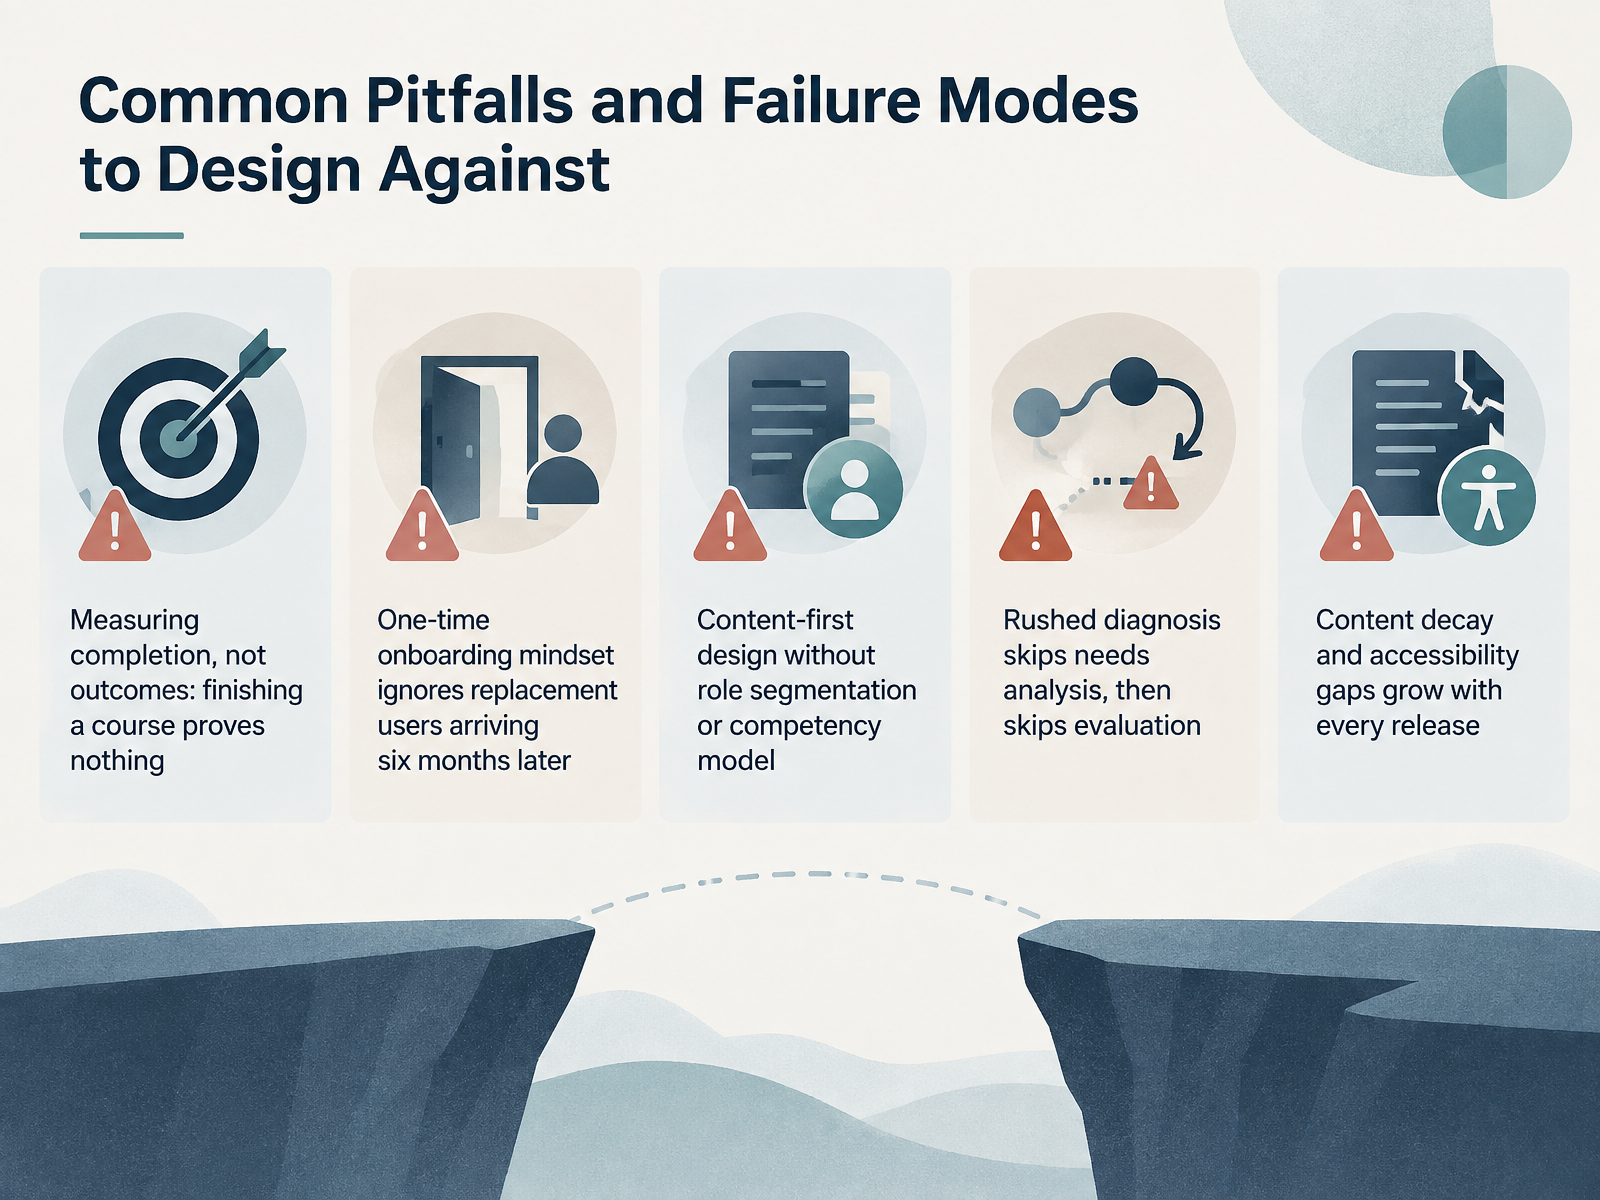
- 12Common Pitfalls and Failure Modes to Design AgainstLet's look at the failure modes worth designing against. First, measuring completion, not outcomes. Finishing a course proves nothing about behavior change. Track the skill, the task, or the business result instead. Second, the one-time onboarding mindset. If you train only new users, you ignore replacement users arriving six months later. Plan for continuous onboarding. Third, content-first design without role segmentation or a competency model. Generic content feels efficient, but it lands poorly for every role. Segment by what people actually do. Fourth, rushed diagnosis. When needs analysis gets skipped, evaluation gets skipped too. You cannot prove impact without a baseline. Fifth, content decay and accessibility gaps. They grow with every release. Build review cycles and accessibility checks into your process, not your backlog. Pick one of these five and fix it this quarter.
 1 min
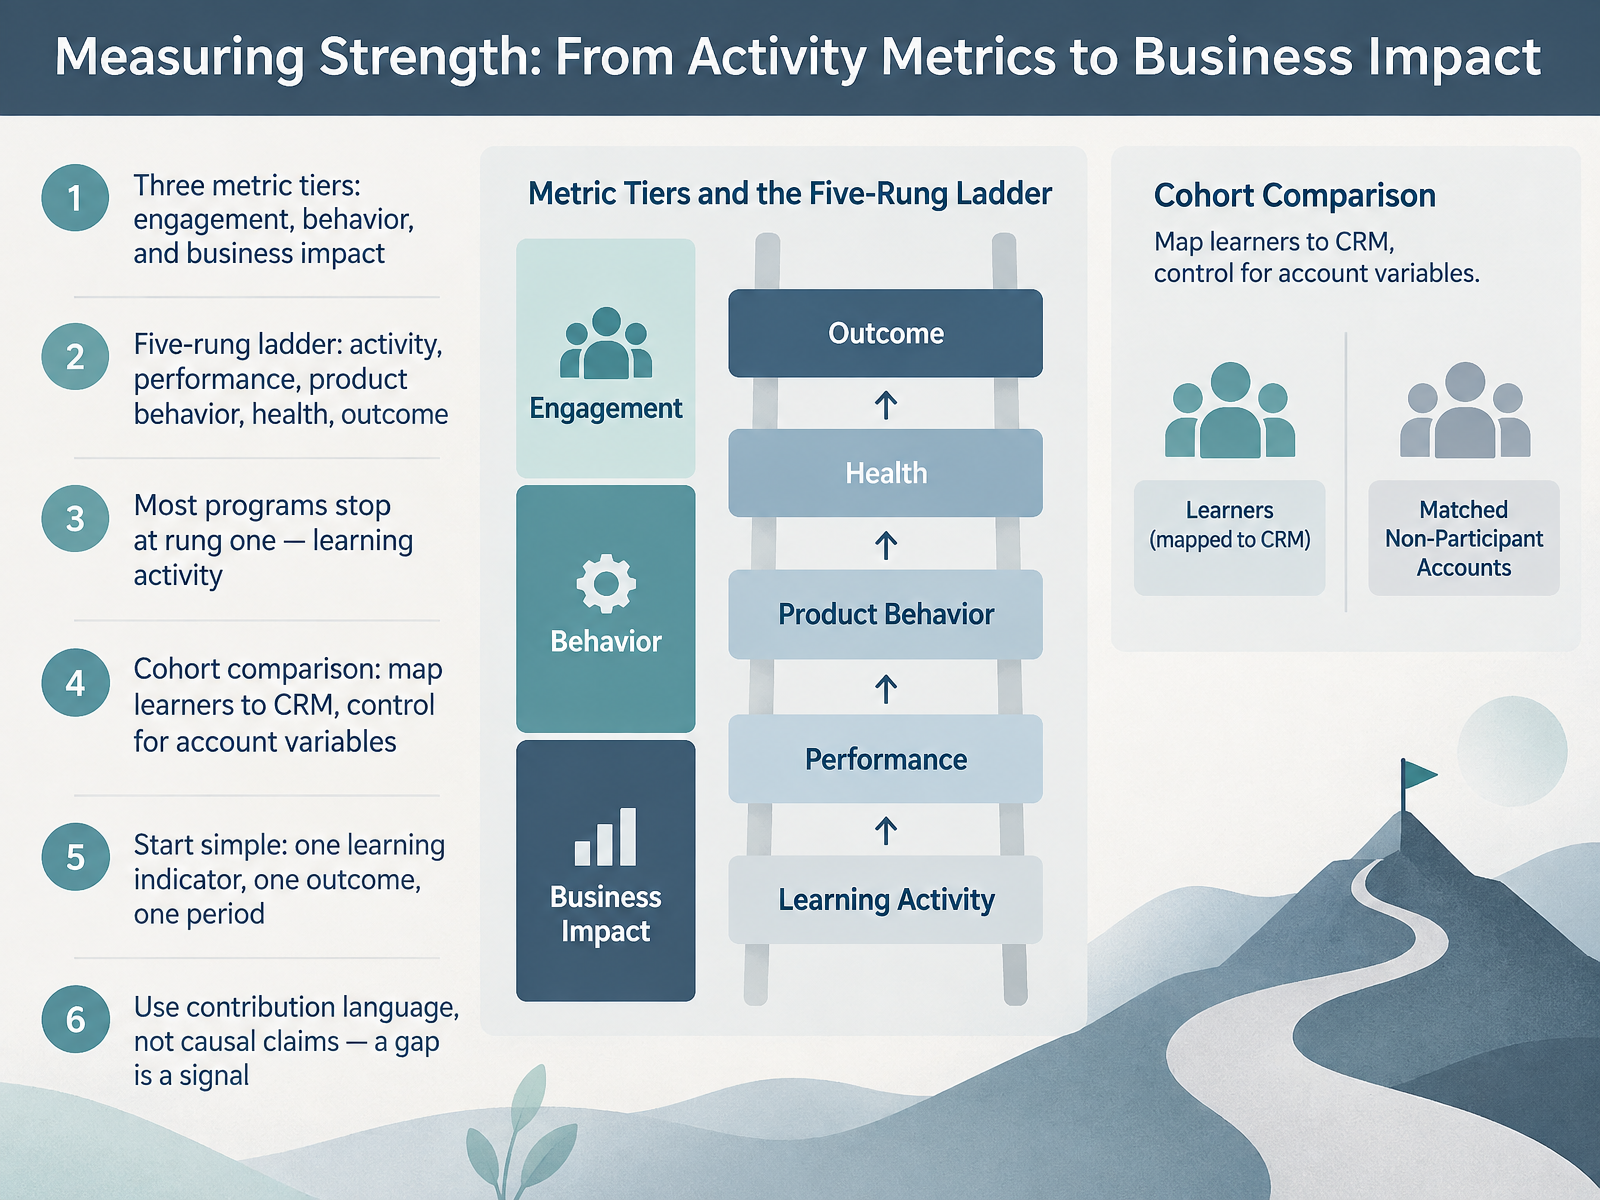
- 13Measuring Strength: From Activity Metrics to Business ImpactLet's move to measuring strength, from activity metrics to business impact. There are three metric tiers: engagement, behavior, and business impact. Think of a five-rung ladder: activity, performance, product behavior, health, and outcome. Most programs stop at rung one, learning activity. That tells you who showed up. It does not tell you what changed. A useful next step is cohort comparison. Map learners to your customer relationship management data, and control for account variables. Start simple. Pick one learning indicator, one outcome, and one period. Then use contribution language, not causal claims. A gap is a signal, not proof. Next, we will build your design workshop and thirty to ninety day action plan. Design Workshop and 30–90 Day Action Plan.
 1 min
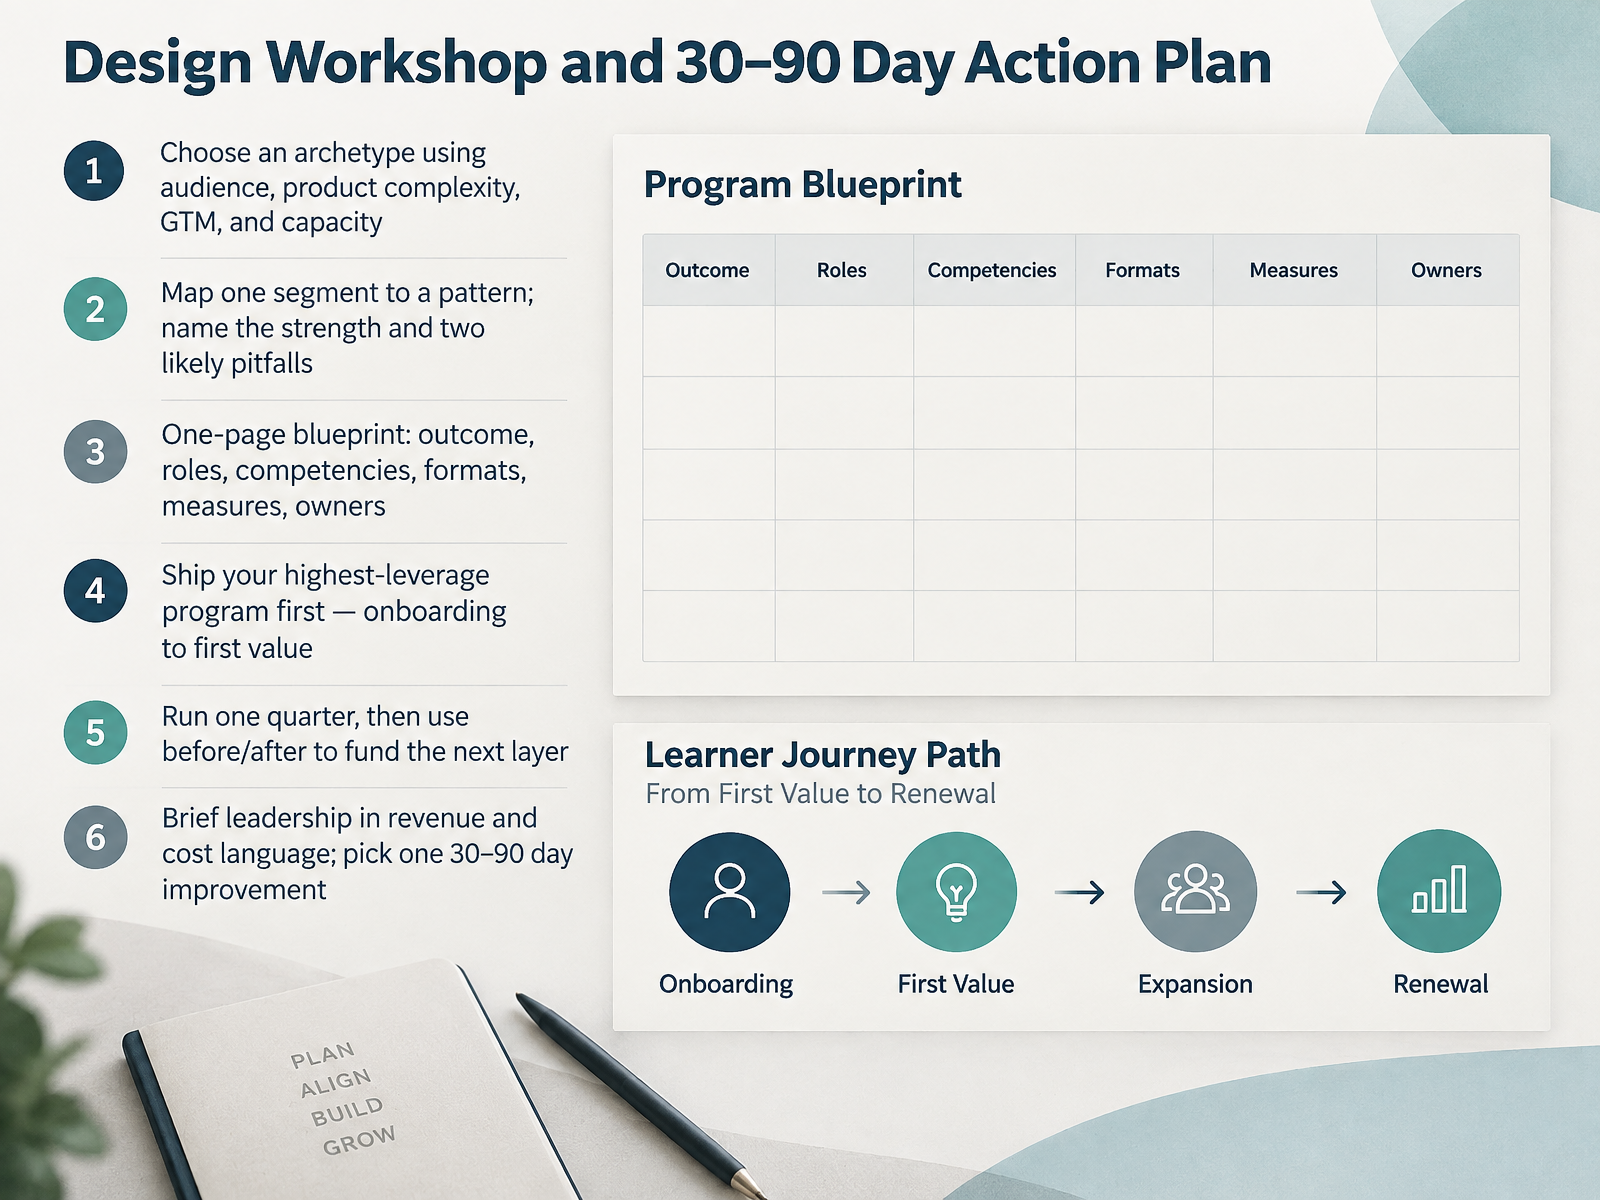
- 14Design Workshop and 30–90 Day Action PlanNow let's turn all of this into a plan you can actually run. Start by choosing an archetype. Match it to four things: your audience, product complexity, go-to-market motion, and team capacity. Next, pick one segment and map it to a pattern. Name the strength you expect, and two likely pitfalls. Then build a one-page blueprint covering outcome, roles, competencies, formats, measures, and owners. From there, ship your highest-leverage program first, usually onboarding to first value. Why? Because that's where you can show impact fastest. Run it for one quarter. Then use before and after results to fund the next layer. Brief leadership in revenue and cost language, and commit to one improvement in the next thirty to ninety days. Keep the scope small. One segment. One pattern. One measured outcome. That's how you build momentum. Thank you for working through this with me. You have the patterns and the pitfalls now. Go ship something real, learn from it, and let the results earn your next investment. You've got this.
 2 min
Take the deck with you
Download this course as a file — free, no sign-up needed.
- PDF handoutEvery slide page, ready to print or share.15 pages · 3.6 MBDownload
- Narrated PowerPointThe deck that presents itself — every slide carries the digital human's narration video.15 pages · 14.2 MBDownload
- PowerPoint slidesThe full deck as a .pptx — open it in PowerPoint, Keynote, or Google Slides.15 pages · 3.5 MBDownload
Free to use in your own training — please keep the PersonWise credit page at the end.
Have your own deck? Turn it into a course