Customer Service Strategy Essentials
Begin
14 pages · ~28 min
Customer Service Strategy Essentials
This training helps customer service professionals define strategic goals, evaluate choices, and manage constraints to improve service planning and decision-making.
What you’ll learn
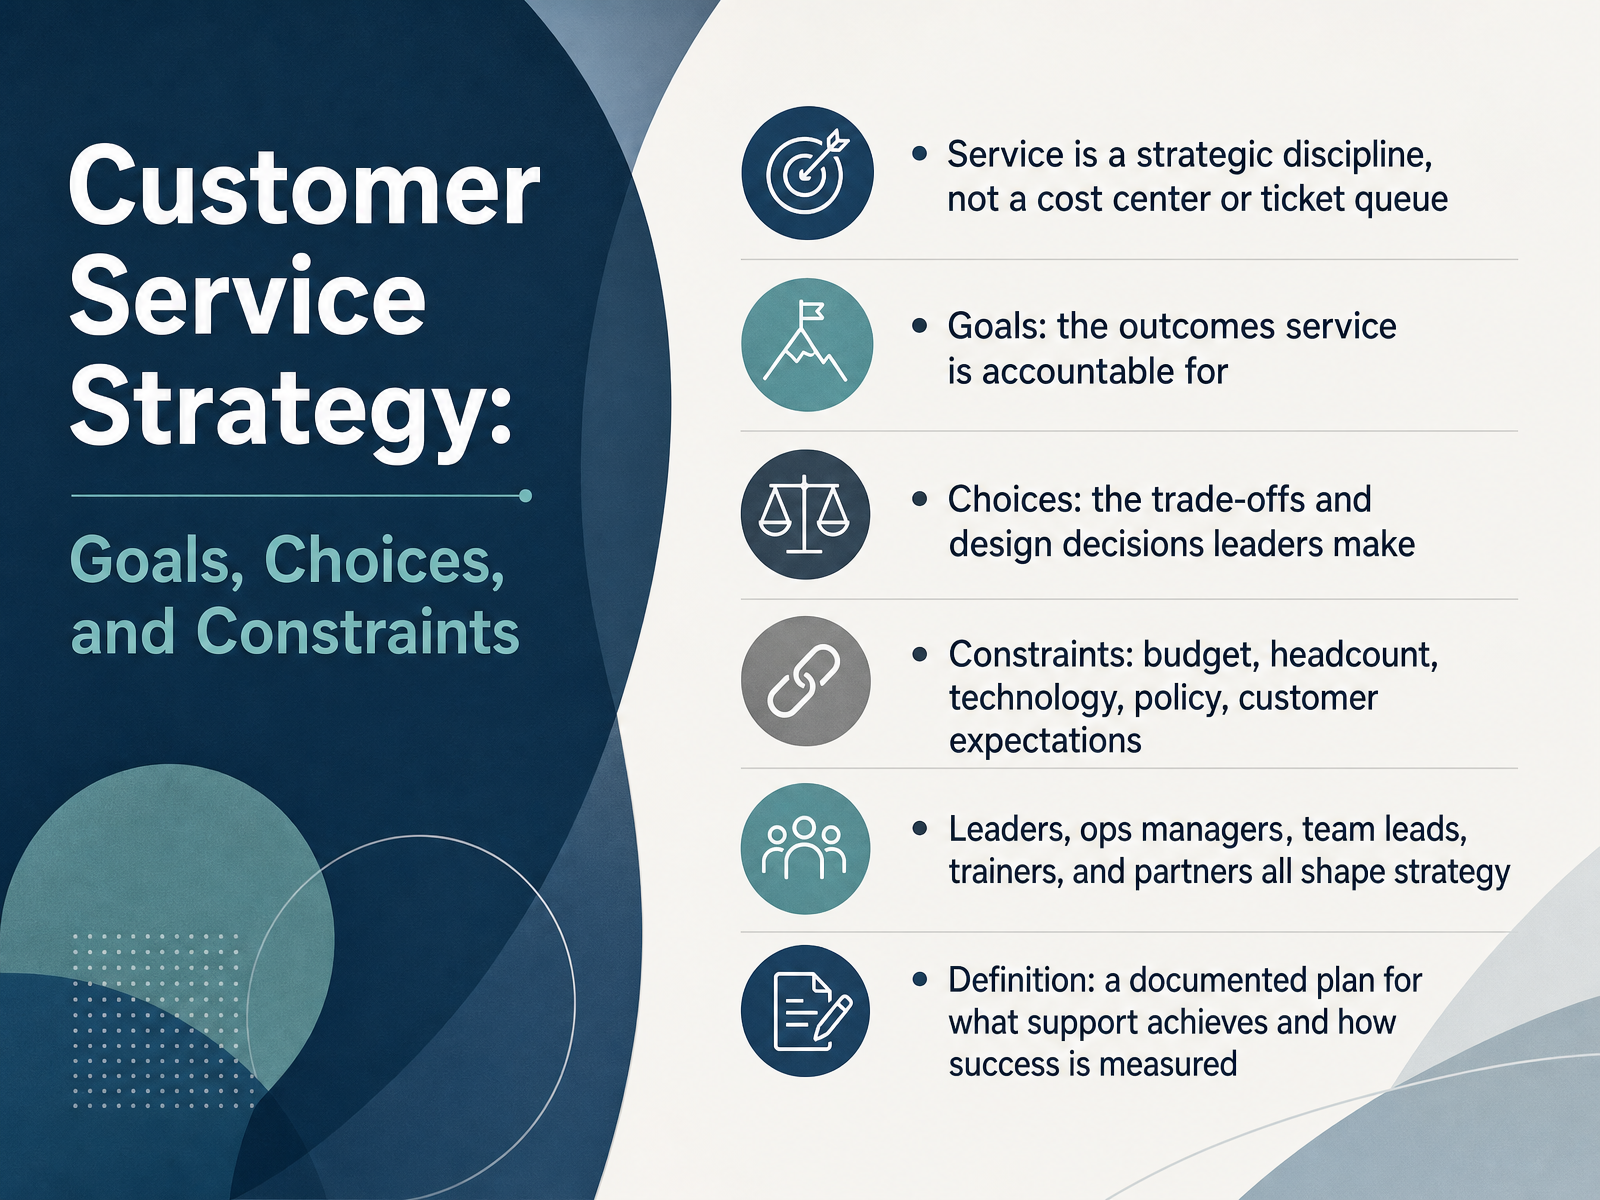
- 01Customer Service Strategy: Goals, Choices, and ConstraintsWelcome. This course is about customer service strategy, and we will treat it as a strategic discipline, not a cost center or a ticket queue. Our goal is practical: help you define what support is accountable for, make better trade-offs, and work within real constraints. Goals are the outcomes service owns, like resolution quality, response time, or retention. Choices are the design decisions you make, such as channel mix, staffing models, and escalation paths. Constraints are budget, headcount, technology, policy, and customer expectations. Leaders, operations managers, team leads, trainers, and cross-functional partners all shape strategy, so name the shared constraint explicitly, then state what each group can choose within it. A useful definition: strategy is a documented plan for what support achieves and how success is measured. Keep that plan short enough to guide daily decisions, and review it when handle time, backlog, or satisfaction trends shift. In the next section, we will look at why service strategy matters now.2 min
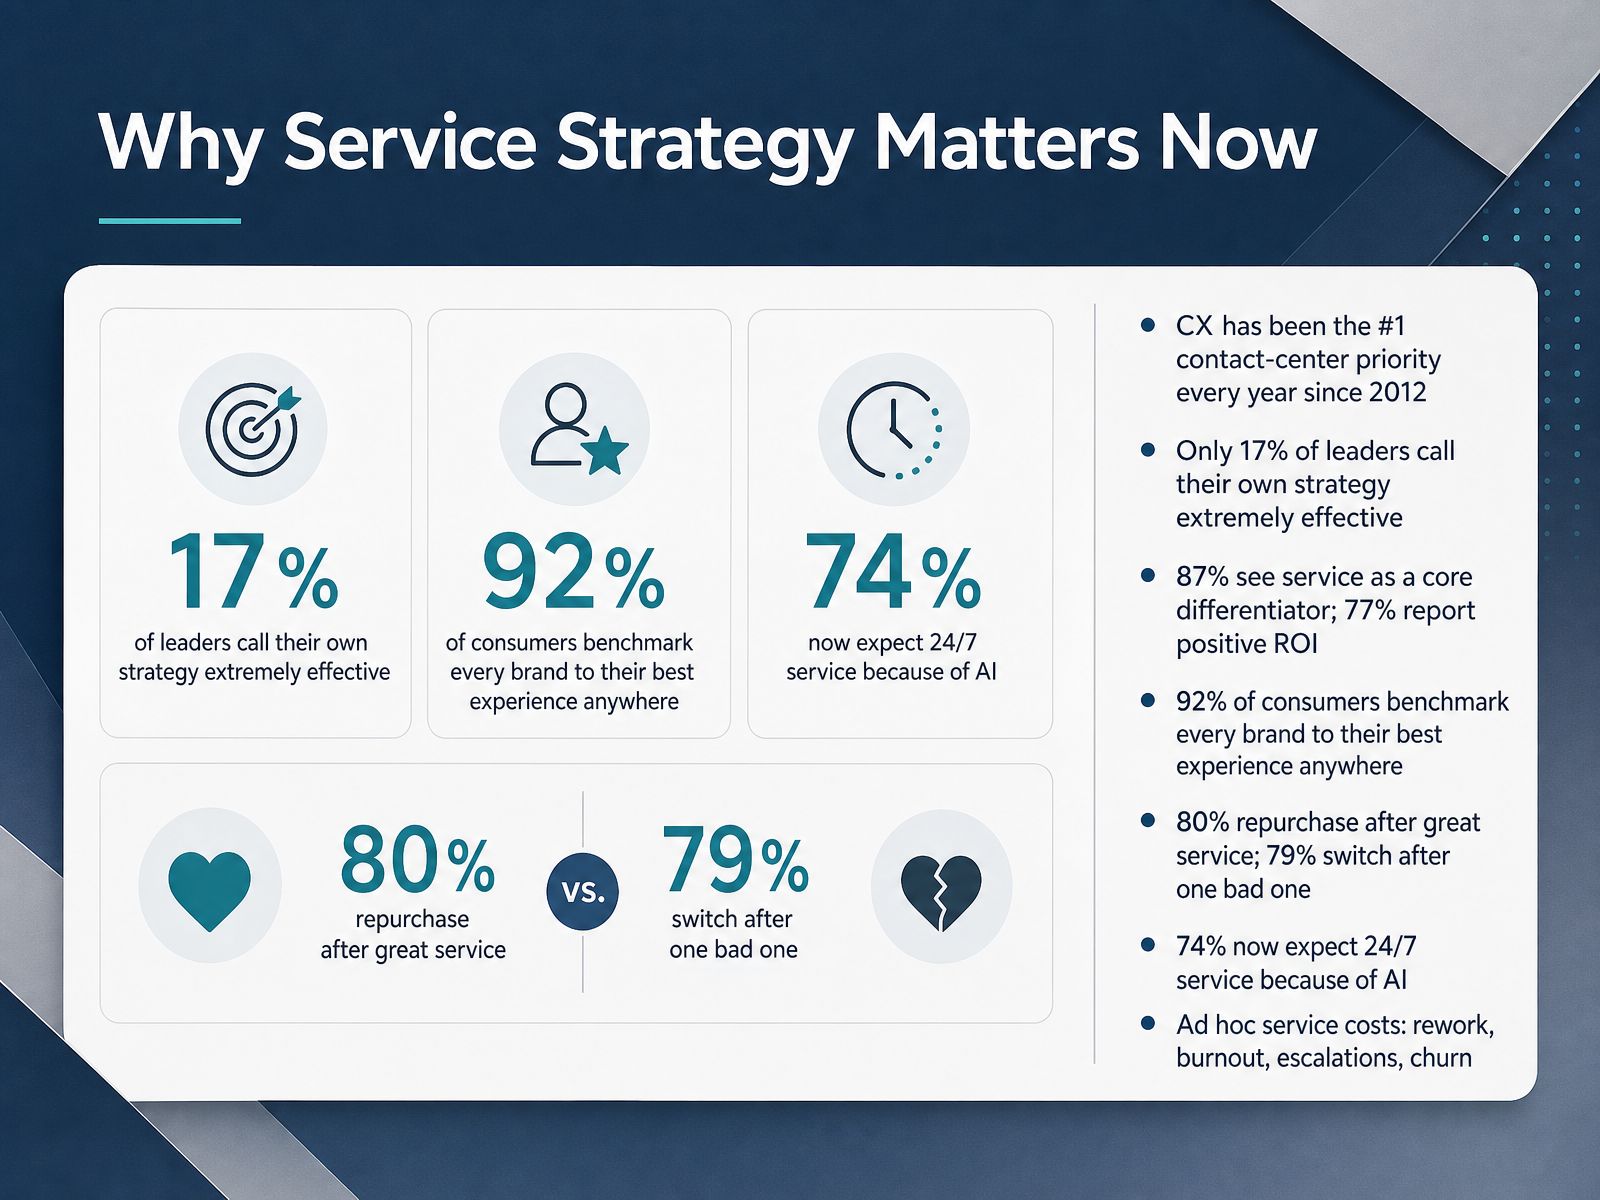
- 02Why Service Strategy Matters NowLet's look at why service strategy matters right now. Customer experience has been the top contact-center priority every year since two thousand twelve, so this is not a passing trend. Yet only seventeen percent of leaders call their own strategy extremely effective. That gap is the real problem, and it is where you make choices. Eighty-seven percent of executives see service as a core differentiator, and seventy-seven percent report positive return on investment. Meanwhile, ninety-two percent of consumers benchmark every brand against the best experience they have anywhere. That means your queue is compared to a retailer, an airline, a bank. The stakes are high. Eighty percent repurchase after great service, and seventy-nine percent switch after one bad experience. Seventy-four percent now expect round-the-clock service because AI has reset those expectations. So the cost of ad hoc service is concrete: rework, burnout, escalations, and churn. As you set goals, choose deliberately where to be excellent and where to be merely reliable. Next, we will examine the economic case and the cost of getting it wrong.
 2 min
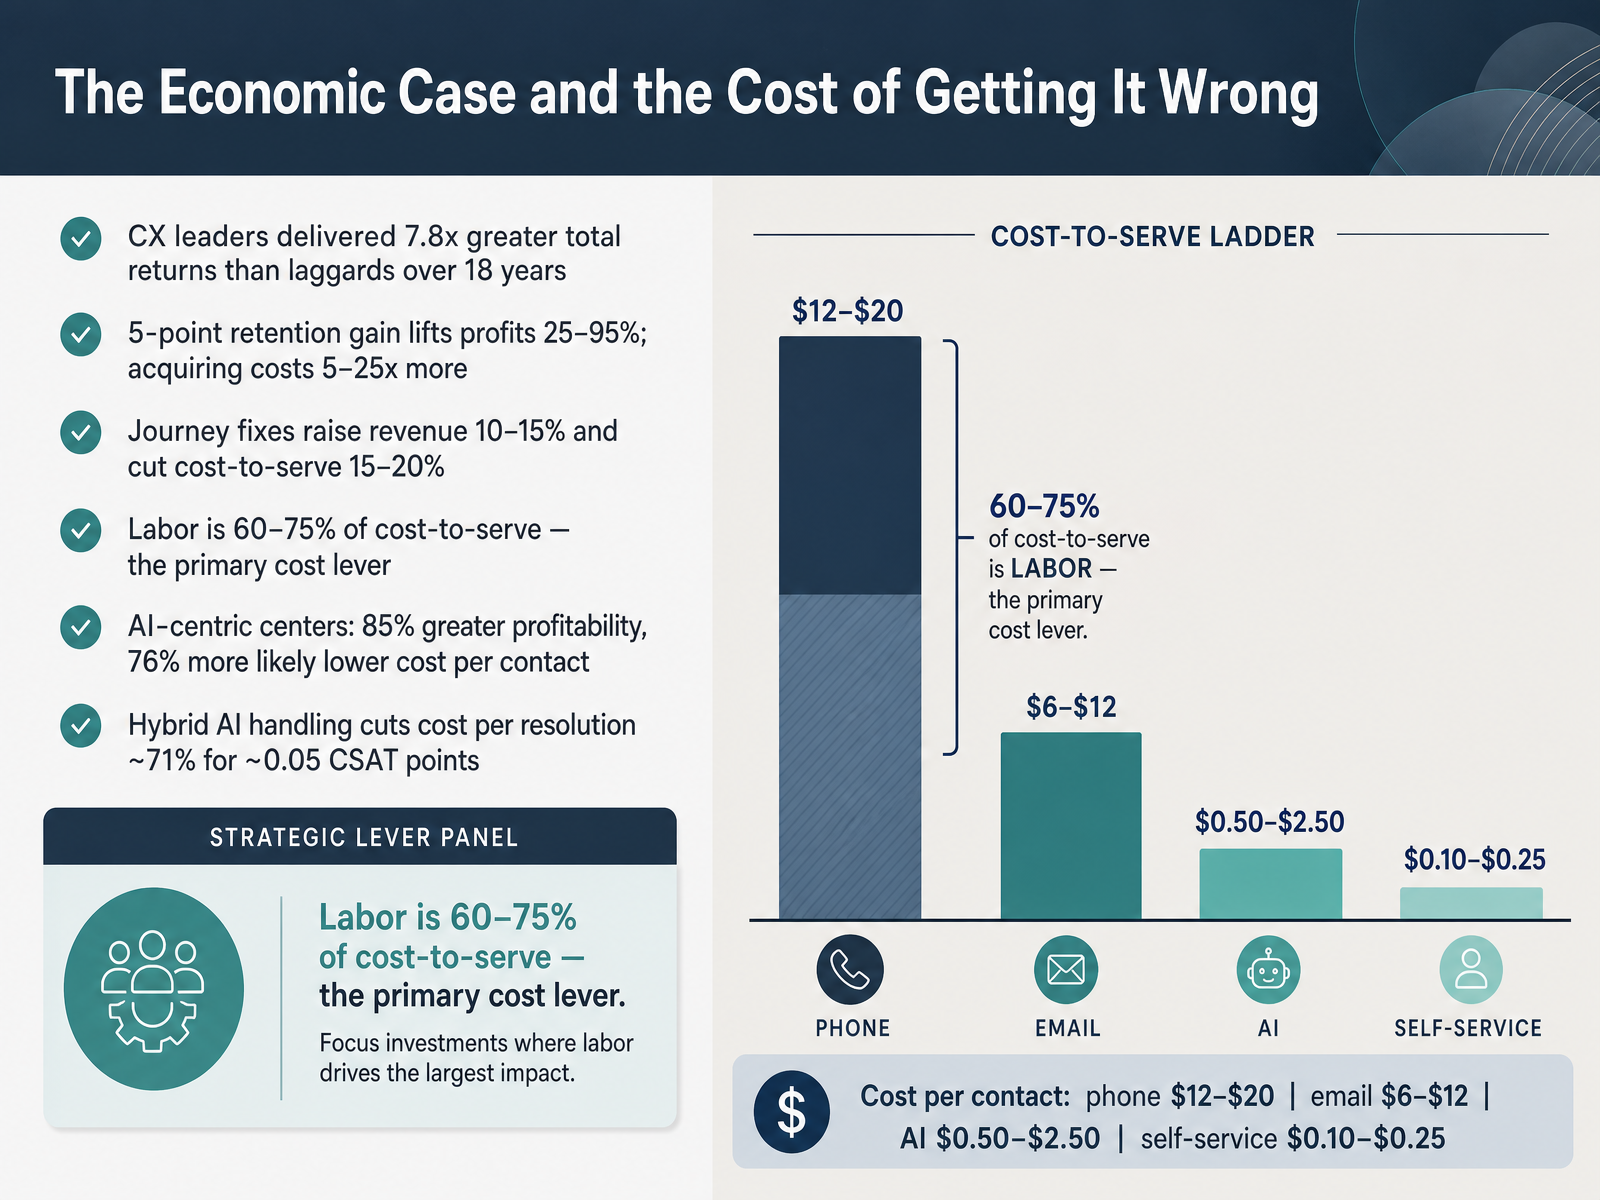
2 min - 03The Economic Case and the Cost of Getting It WrongLet's put the economic case on the table, because your budget conversations depend on it. CX leaders delivered seven point eight times greater total returns than laggards over eighteen years. A five point retention gain lifts profits twenty five to ninety five percent, and acquiring a customer costs five to twenty five times more than keeping one. Journey fixes raise revenue ten to fifteen percent and cut cost to serve fifteen to twenty percent. Here's where you have leverage: labor is sixty to seventy five percent of cost to serve. That's your primary cost lever. Now look at cost per contact. Phone runs twelve to twenty dollars. Email, six to twelve. AI, fifty cents to two dollars and fifty cents. Self service, ten to twenty five cents. AI centric centers show eighty five percent greater profitability, and hybrid AI handling cuts cost per resolution by roughly seventy one percent for about zero point zero five CSAT points. So when you weigh automation, protect resolution quality before you cut labor. Next, we'll look at setting service goals that drive business outcomes.
 2 min
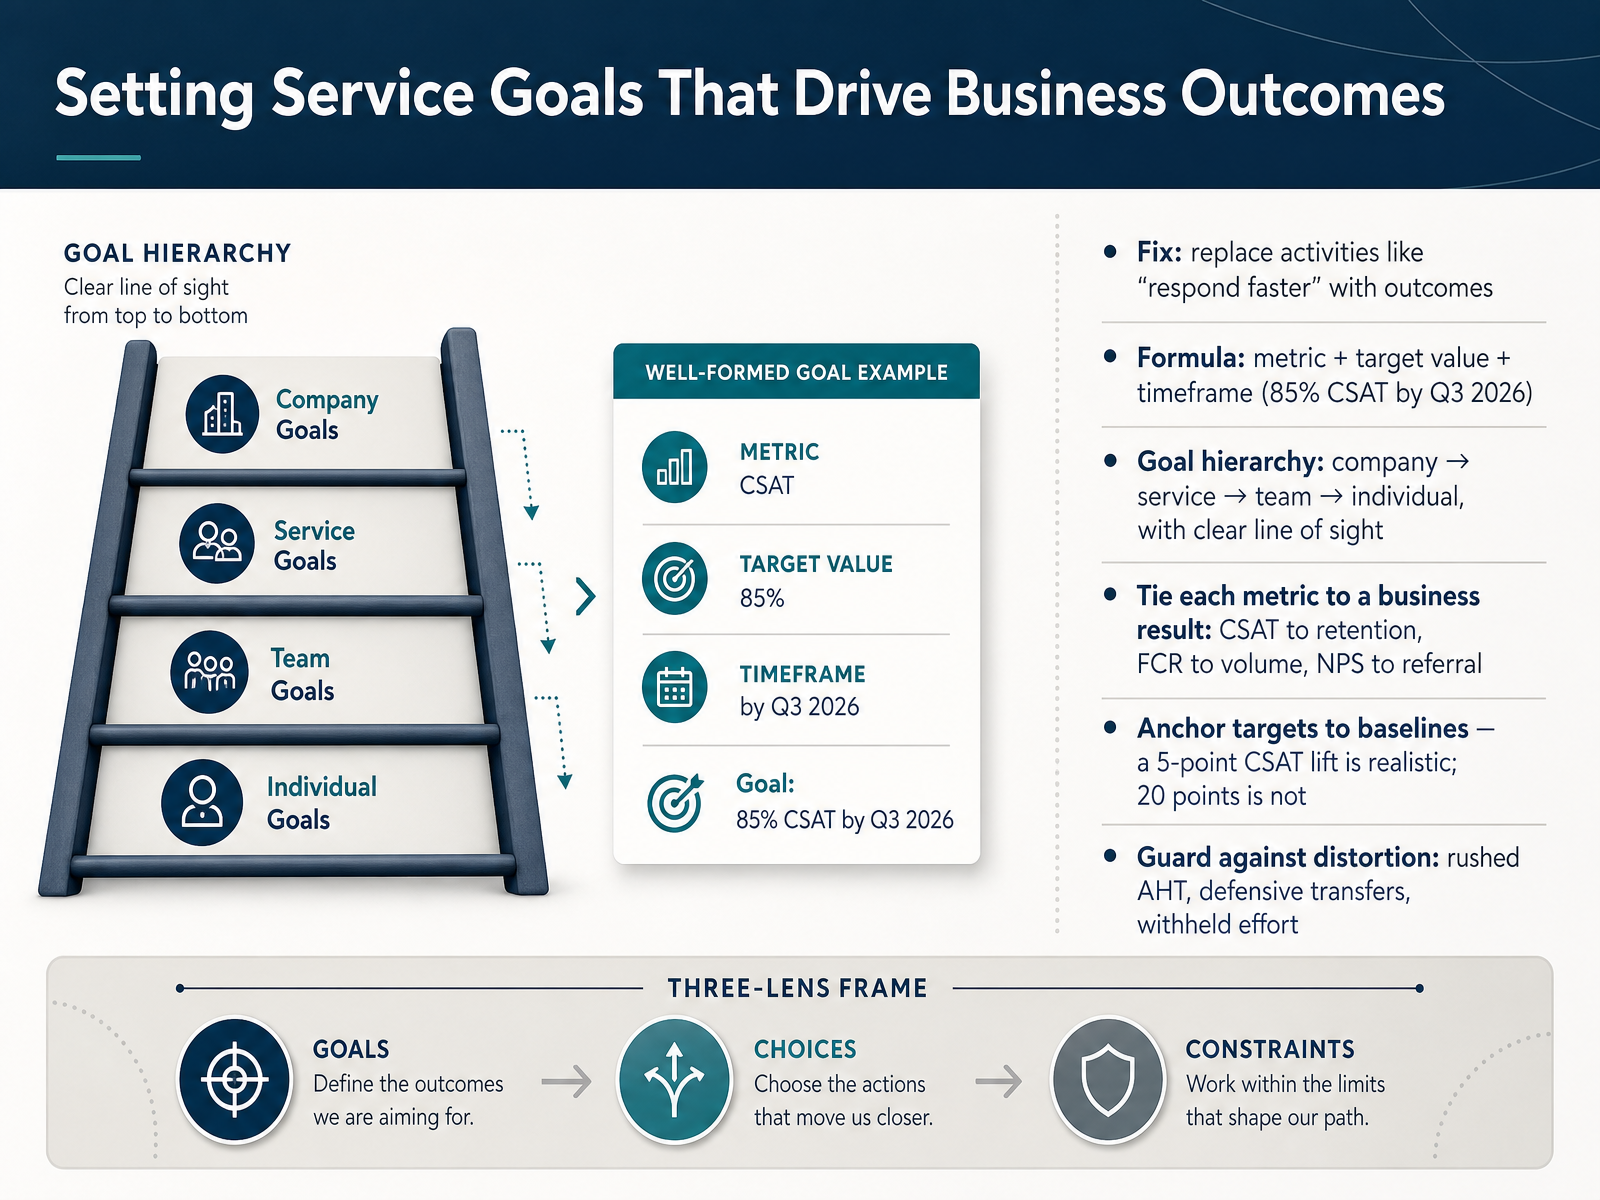
2 min - 04Setting Service Goals That Drive Business OutcomesLet's talk about setting service goals that actually drive business outcomes. Start by fixing the language. Replace activities like respond faster with outcomes you can measure. Use a simple formula: metric plus target value plus timeframe. For example, eighty five percent customer satisfaction by the third quarter of twenty twenty six. Then build a goal hierarchy from company to service to team to individual, with a clear line of sight at every level. Tie each metric to a business result. Customer satisfaction links to retention. First contact resolution links to volume. Net promoter score links to referral. Anchor your targets to baselines. A five point satisfaction lift is realistic. Twenty points is not. And guard against distortion. Rushed average handle time, defensive transfers, and withheld effort all show up when metrics pull against each other. When handle time rises, protect resolution quality before adding headcount. Next, we'll look at choosing the right metrics and avoiding metric distortion.
 2 min
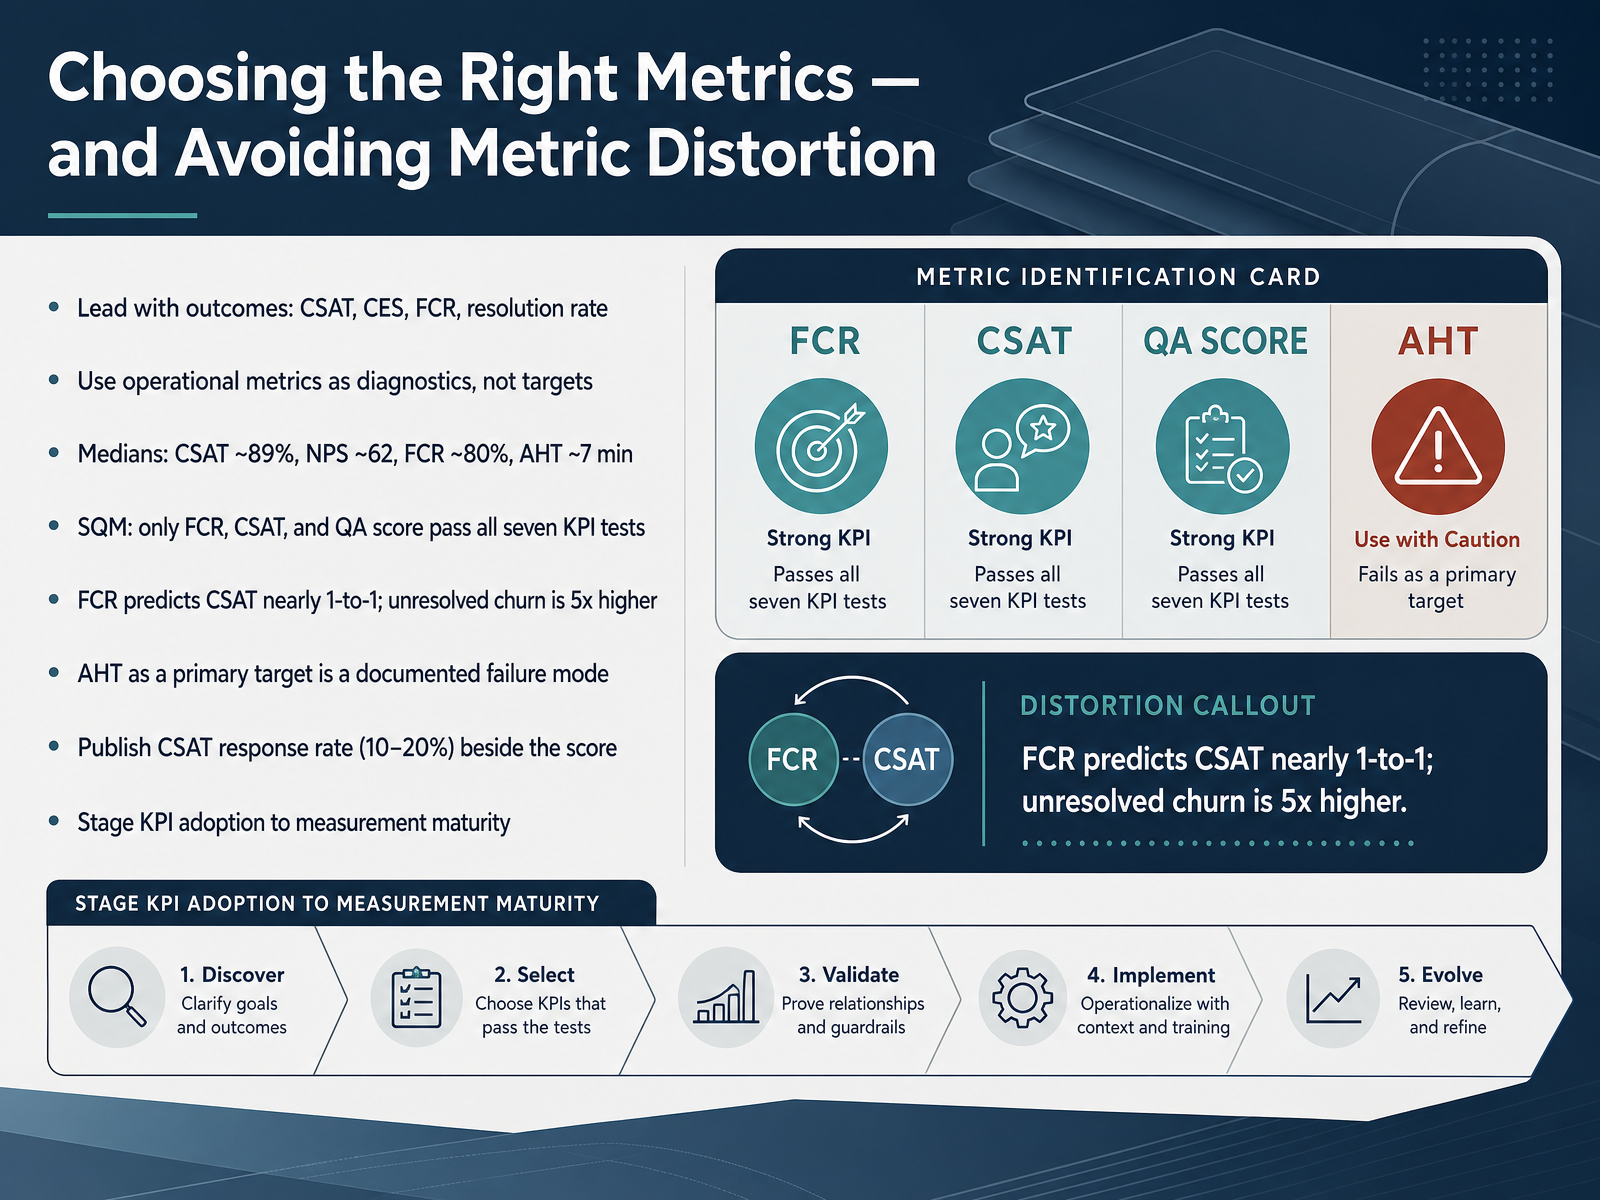
2 min - 05Choosing the Right Metrics — and Avoiding Metric DistortionLet's talk about metrics, because the right ones drive the right behavior, and the wrong ones quietly break your operation. Start by leading with outcomes: customer satisfaction, customer effort, first contact resolution, and resolution rate. Treat operational metrics like handle time or adherence as diagnostics, not targets. Here's the benchmark picture to orient your own numbers. Median CSAT sits around eighty-nine percent, NPS near sixty-two, FCR around eighty percent, and average handle time about seven minutes. But note this: only FCR, CSAT, and QA score pass all seven KPI tests under SQM. FCR predicts CSAT almost one to one, and unresolved issues are five times more likely to churn. Making AHT a primary target is a documented failure mode. When handle time rises, protect resolution quality before adding headcount. Also, publish your CSAT response rate, typically ten to twenty percent, right beside the score. And stage KPI adoption to match measurement maturity, so you don't chase metrics your data can't support. That keeps you honest and keeps your teams focused on what customers actually feel. Next, we'll look at understanding customer needs and segmenting service.
 2 min
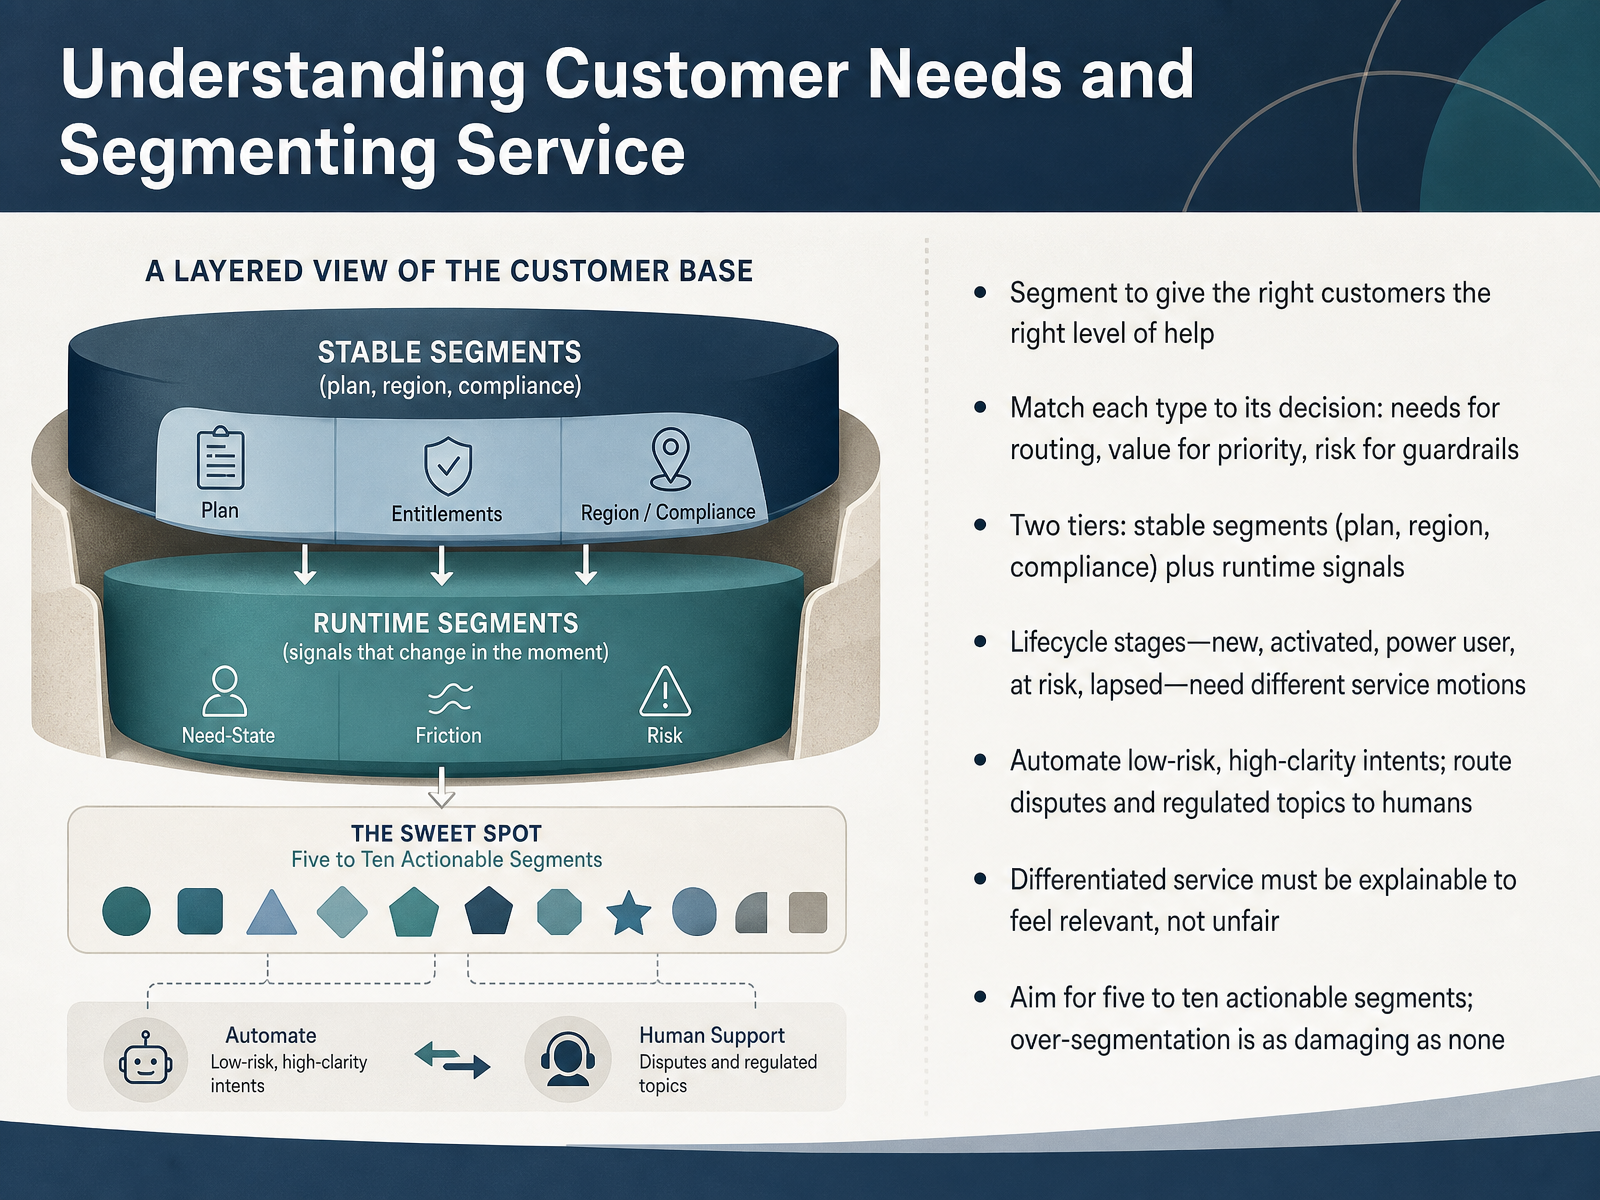
2 min - 06Understanding Customer Needs and Segmenting ServiceLet's talk about segmenting service so the right customers get the right level of help. Match each segment to the decision it drives. Needs guide routing. Value sets priority. Risk defines your guardrails. Then layer two things: stable segments like plan, region, and compliance, plus runtime signals that shift in the moment. Lifecycle matters too. New, activated, power user, at risk, and lapsed customers each need a different service motion. When handle time rises, protect resolution quality before adding headcount. Automate low-risk, high-clarity intents, and route disputes and regulated topics to humans. One shared constraint here: budget and system limits cap how many segments you can actually support. Within that, operations chooses routing rules, and cross-functional partners choose which data and policies feed them. Make differentiation explainable, so it feels relevant, not unfair. A customer on a premium plan can see why they get faster response. Aim for five to ten actionable segments. Over-segmentation is as damaging as none. That sets up our next question: Channel Portfolio and Delivery Choices.
 2 min
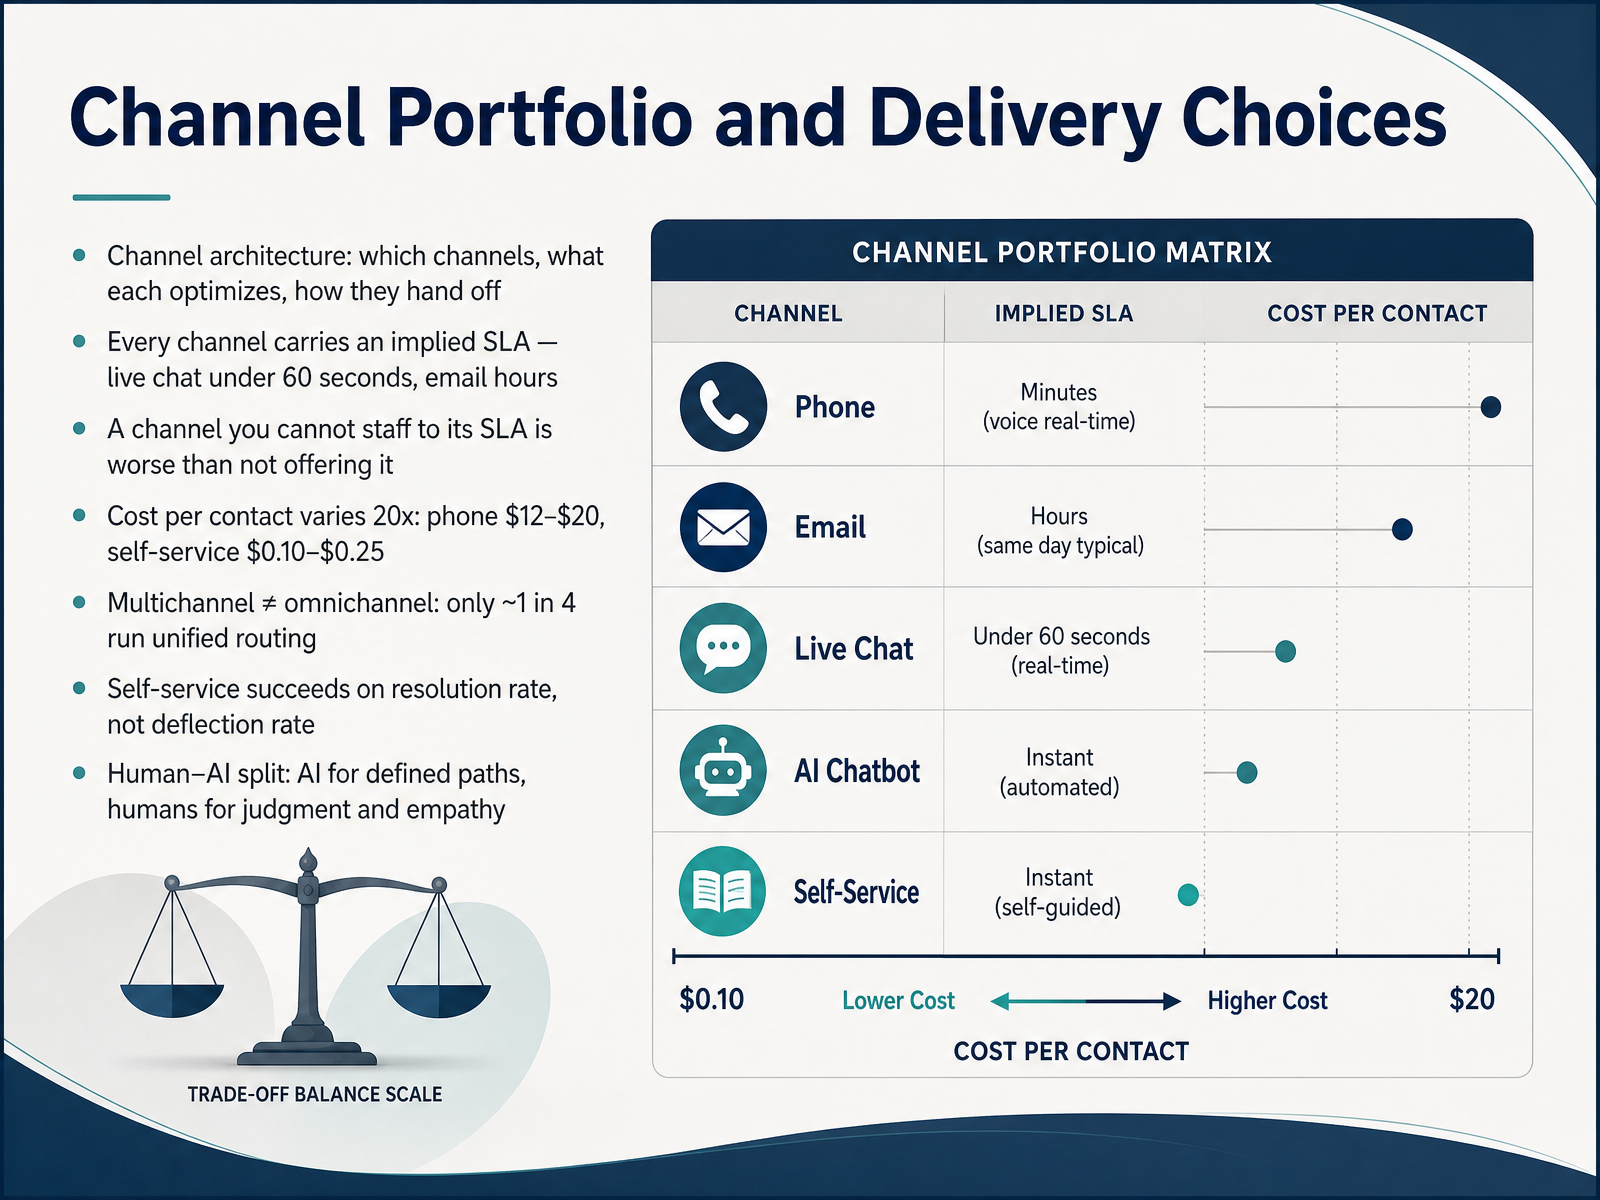
2 min - 07Channel Portfolio and Delivery ChoicesLet's move on to channel portfolio and delivery choices. Treat your channel architecture as a set of deliberate trade-offs: which channels you run, what each one optimizes, and how work hands off between them. Every channel carries an implied service level agreement. Live chat suggests under sixty seconds; email suggests hours. If you can't staff a channel to its promise, you're usually better off not offering it. Cost per contact also varies by roughly twenty times. Phone runs about twelve to twenty dollars per contact, while self-service sits near ten to twenty-five cents. Remember that multichannel is not omnichannel. Only about one in four operations run truly unified routing, so customers often repeat themselves. When you build self-service, measure resolution rate, not deflection rate. Deflection can look good while customers quietly give up. And for the human and AI split, put AI on defined paths and keep humans for judgment and empathy. Next, we'll look at the human and AI mix, where automation works and where it fails.
 2 min
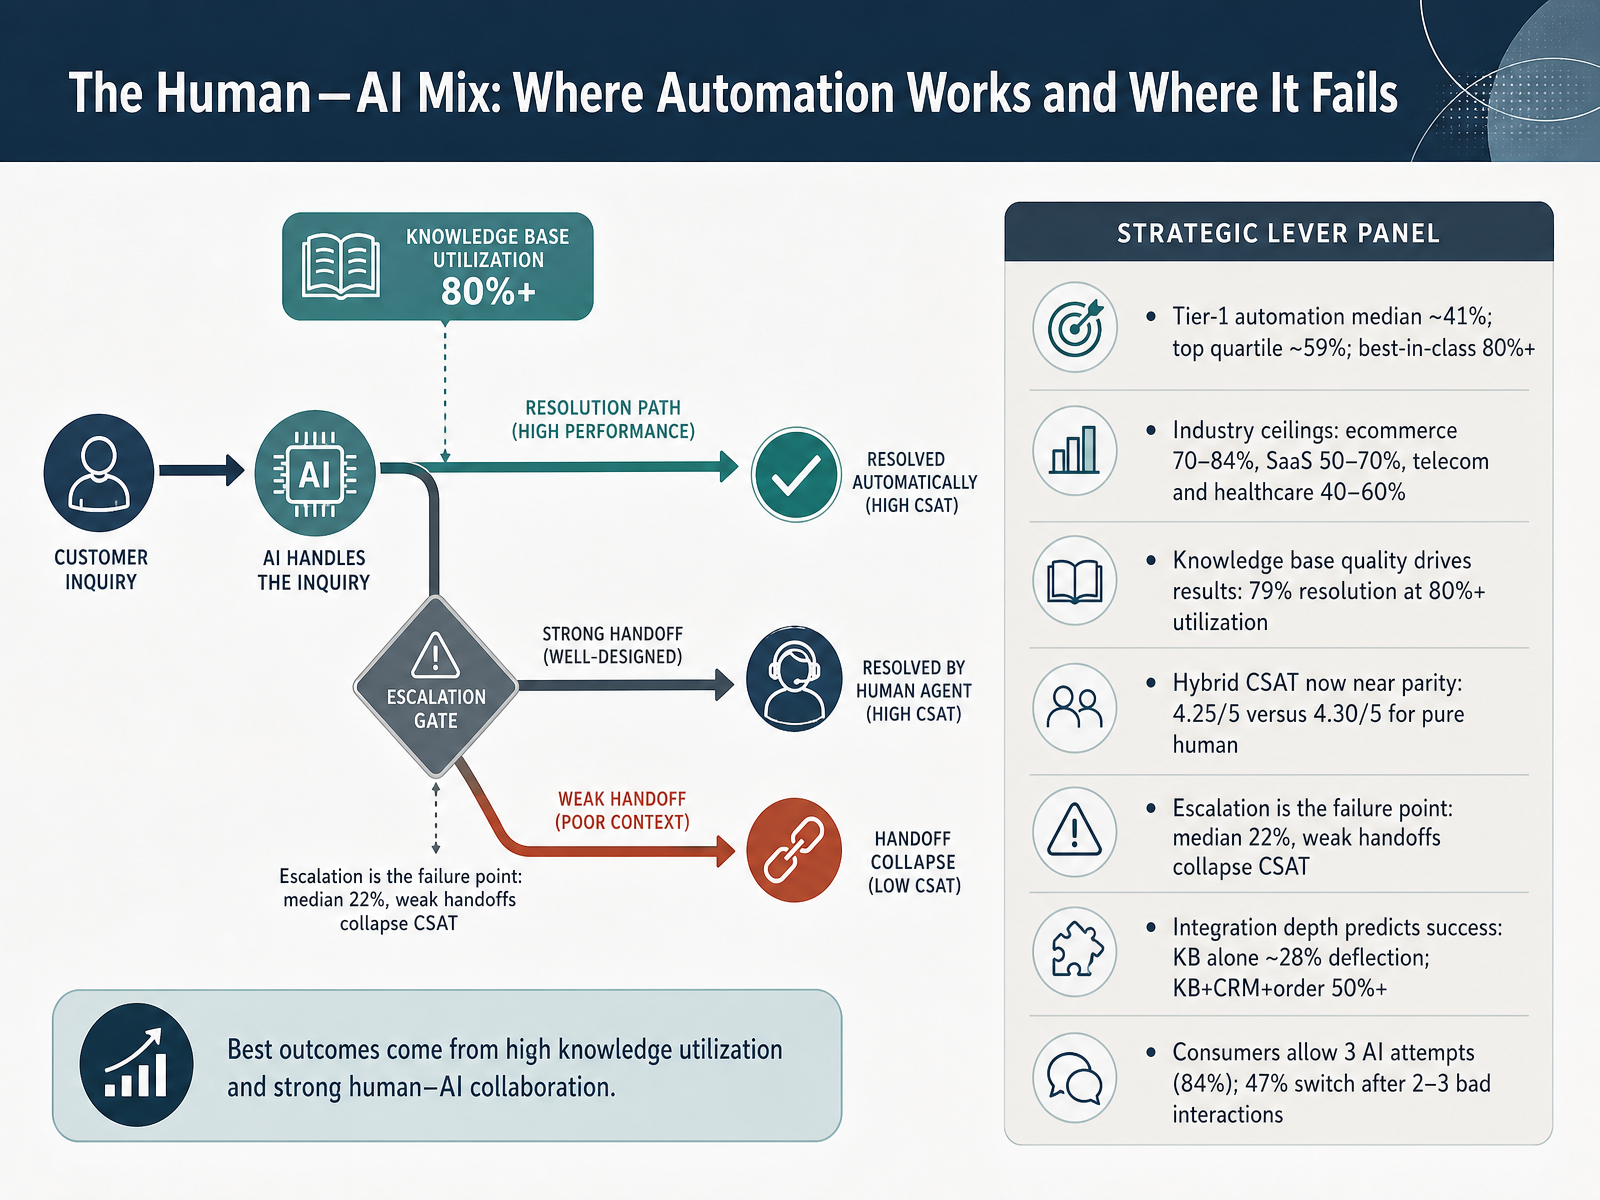
2 min - 08The Human–AI Mix: Where Automation Works and Where It FailsNow let's look at the human and AI mix, and where automation actually holds up. Tier-one automation sits around forty-one percent at the median. Top-quartile teams reach about fifty-nine percent, and best-in-class programs clear eighty percent. But context sets the ceiling. Ecommerce often lands between seventy and eighty-four percent. Software as a service sits around fifty to seventy. Telecom and healthcare are lower, often forty to sixty, because the work is regulated and exception-heavy. So choose your target based on domain, not ambition. Knowledge base quality is the biggest lever. At eighty percent or higher utilization, teams report about seventy-nine percent resolution. Hybrid service quality is now near parity: four point two five out of five, against four point three zero for pure human. The real failure point is escalation. The median escalation rate is twenty-two percent, and weak handoffs collapse satisfaction fast. Integration depth predicts success, too. Knowledge base alone gives roughly twenty-eight percent deflection. Add C R M and order data, and you clear fifty percent. And remember consumer patience: eighty-four percent will allow three AI attempts, but forty-seven percent switch after two or three bad interactions. Next, let's examine people, process, and technology constraints.
 2 min
2 min - 09People, Process, and Technology ConstraintsNow let us talk about the constraints that shape your service strategy: people, process, and technology. Start with people. Attrition runs thirty-eight to forty-five percent, and replacing one agent costs ten thousand to twenty thousand dollars. New agents need six to eight months to reach proficiency. The top drivers are burnout, below-market pay, and no career path. Flexible scheduling cuts turnover, while occupancy above eighty-five percent raises it. On process, low first-contact resolution is usually a knowledge base or routing problem, not an effort problem. On technology, the biggest barriers are AI pace and data readiness at forty-six percent each, and only thirty-one percent of CX infrastructure is fully cloud-based. Remember that labor is sixty to seventy-five percent of cost-to-serve, so budgets dominate. Your practical move is to map each constraint as fixed, negotiable, or removable. That tells you where you can actually choose. Next, we will pull this together in Designing the Service Operating Model.
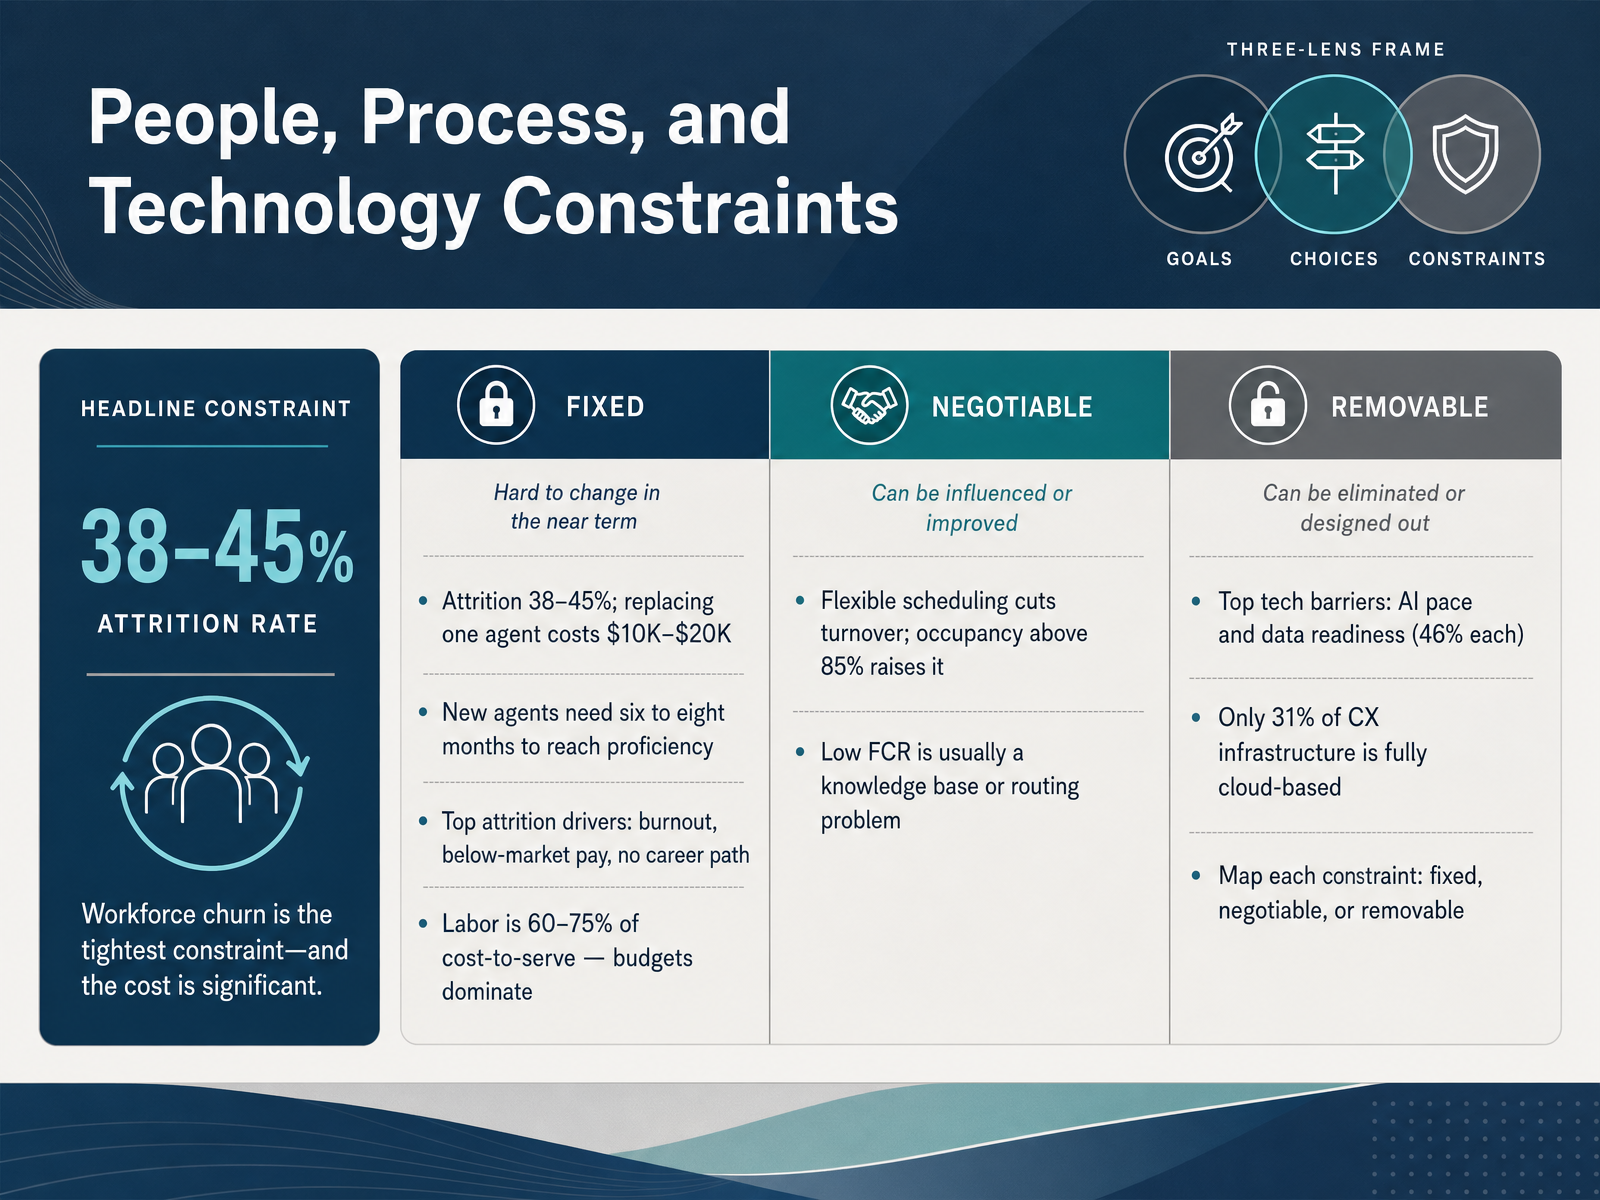 2 min
2 min - 10Designing the Service Operating ModelLet's move on to designing the service operating model. This is where you make the structure explicit, because the model decides who can change what. Start by settling five things: decision rights, the funding line, the operating cadence, journey owners, and measurement. Then choose a structure. Centralized gives you consistency and scale. Embedded or distributed puts teams close to the business, but standards drift. Hub-and-spoke is usually the practical middle: a central team owns standards, tooling, and reporting, while business units own delivery and local priorities. Next, define authority in three tiers. Local teams fix what is local. A cross-functional board resolves shared trade-offs across queues or products. Executive investment handles capacity, policy, and system change. Every escalation needs three things: a trigger, an owner, and a deadline. Without all three, issues sit in limbo. And the most common failure is governance without power. If a board can meet but cannot change capacity or policy, it becomes theater. So give your forum a real lever over budget, headcount, or rules. Otherwise, protect resolution quality first when handle time rises. Next, we'll look at measuring performance and making trade-offs explicit.
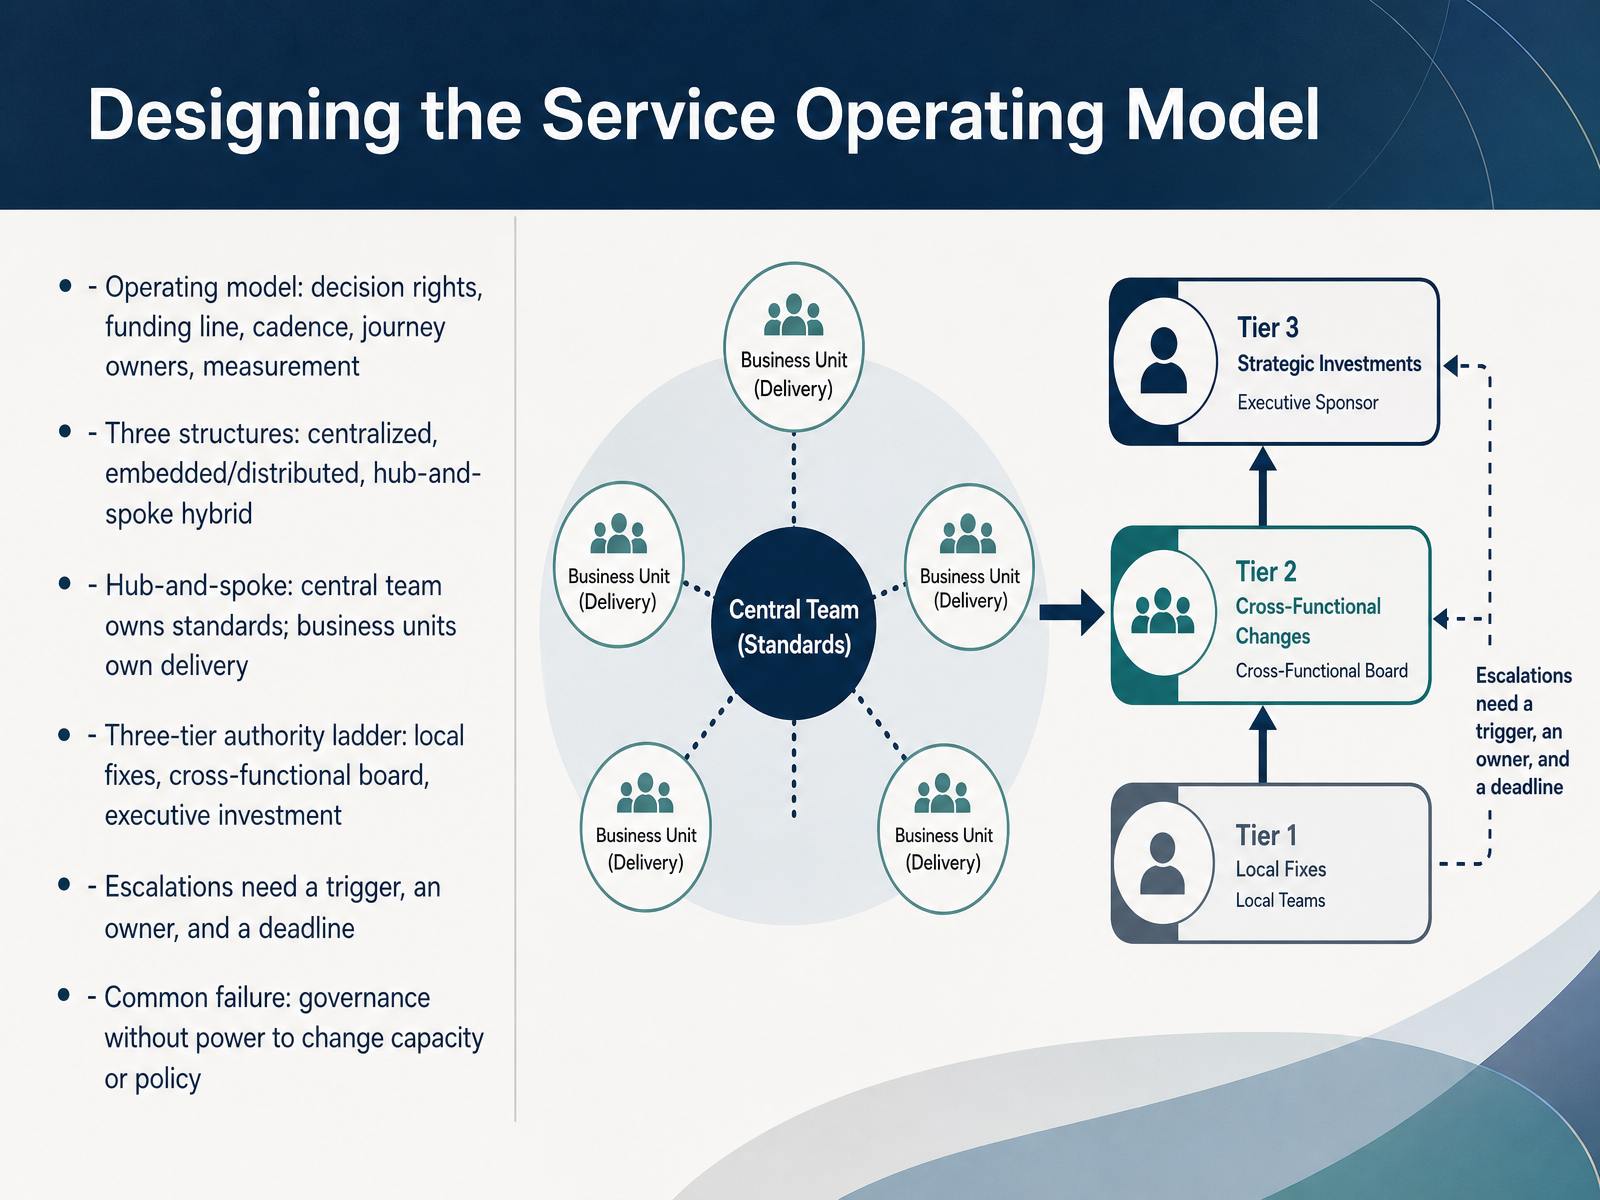 2 min
2 min - 11Measuring Performance and Making Trade-Offs ExplicitLet's make performance measurement useful by making trade-offs explicit. Build your dashboard in layers: customer, workflow, A I, and human views. Avoid blended scores. Each layer answers a different question, so blending them hides the cause. As A I absorbs routine work, human queues get harder. That is expected. Raise human benchmarks instead of punishing agents. Pair signals. If first response time falls while satisfaction rises, routing improved. Distinguish containment from true resolution. Deflection alone is vanity. And name the trade-offs: speed versus quality, coverage versus cost, personalization versus scale. For cross-functional partners, the shared constraint is budget or system limits. Within that, support can choose queue design, operations can choose coverage, and product can choose automation scope. Next, we'll look at governance, quality, and continuous improvement.
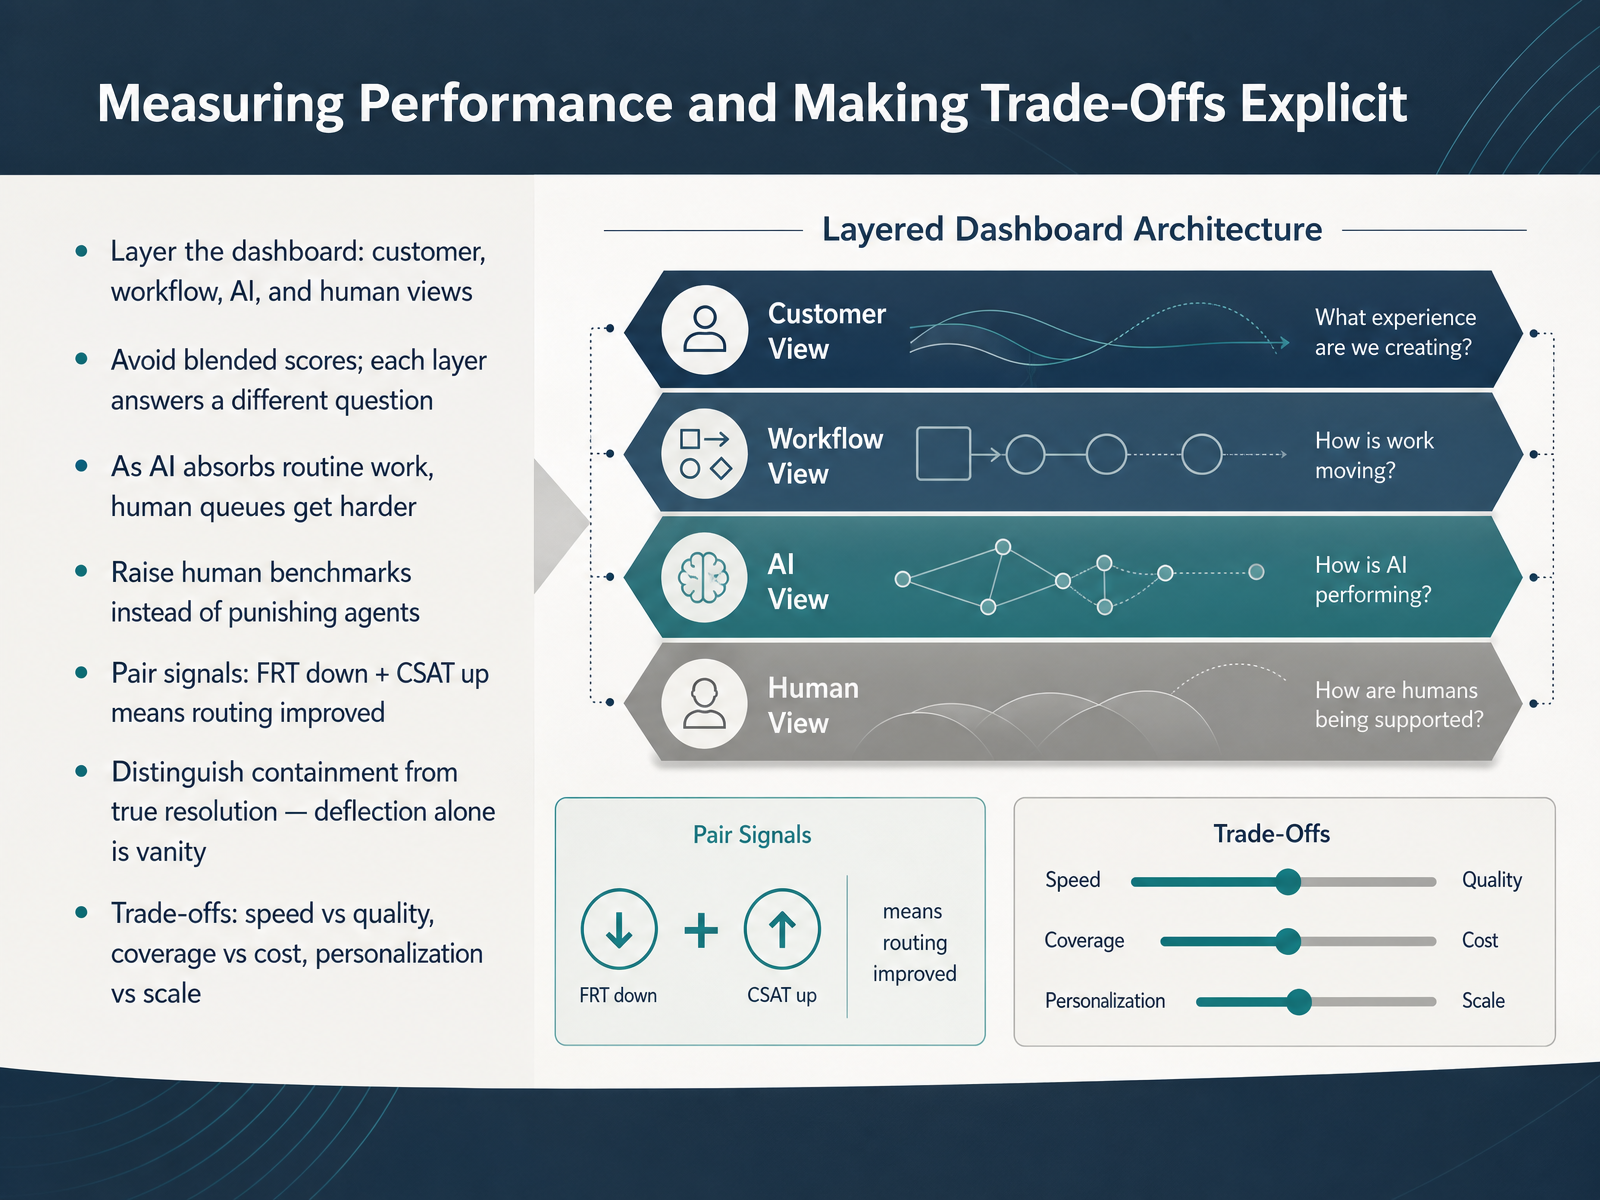 1 min
1 min - 12Governance, Quality, and Continuous ImprovementNow let's talk about governance, quality, and continuous improvement. Run three tempos. Weekly fixes for urgent defects. Monthly strategy for trends and priorities. Quarterly steering for direction and investment. Keep quality assurance lean. Eight to twelve criteria, calibrated reviewers, and a published rubric everyone can see. Book coaching before scores. One short monthly one-to-one per agent, focused on behaviors, not numbers. And keep QA scores for coaching only, never compensation. Apply the same discipline to AI quality assurance. Define restricted behaviors, set human-review triggers, and document an incident flow so issues get contained quickly. If you do one thing, protect coaching time and keep scores out of pay decisions. That keeps the system honest and improvement steady. Next, we'll turn this into action planning for your next ninety days.
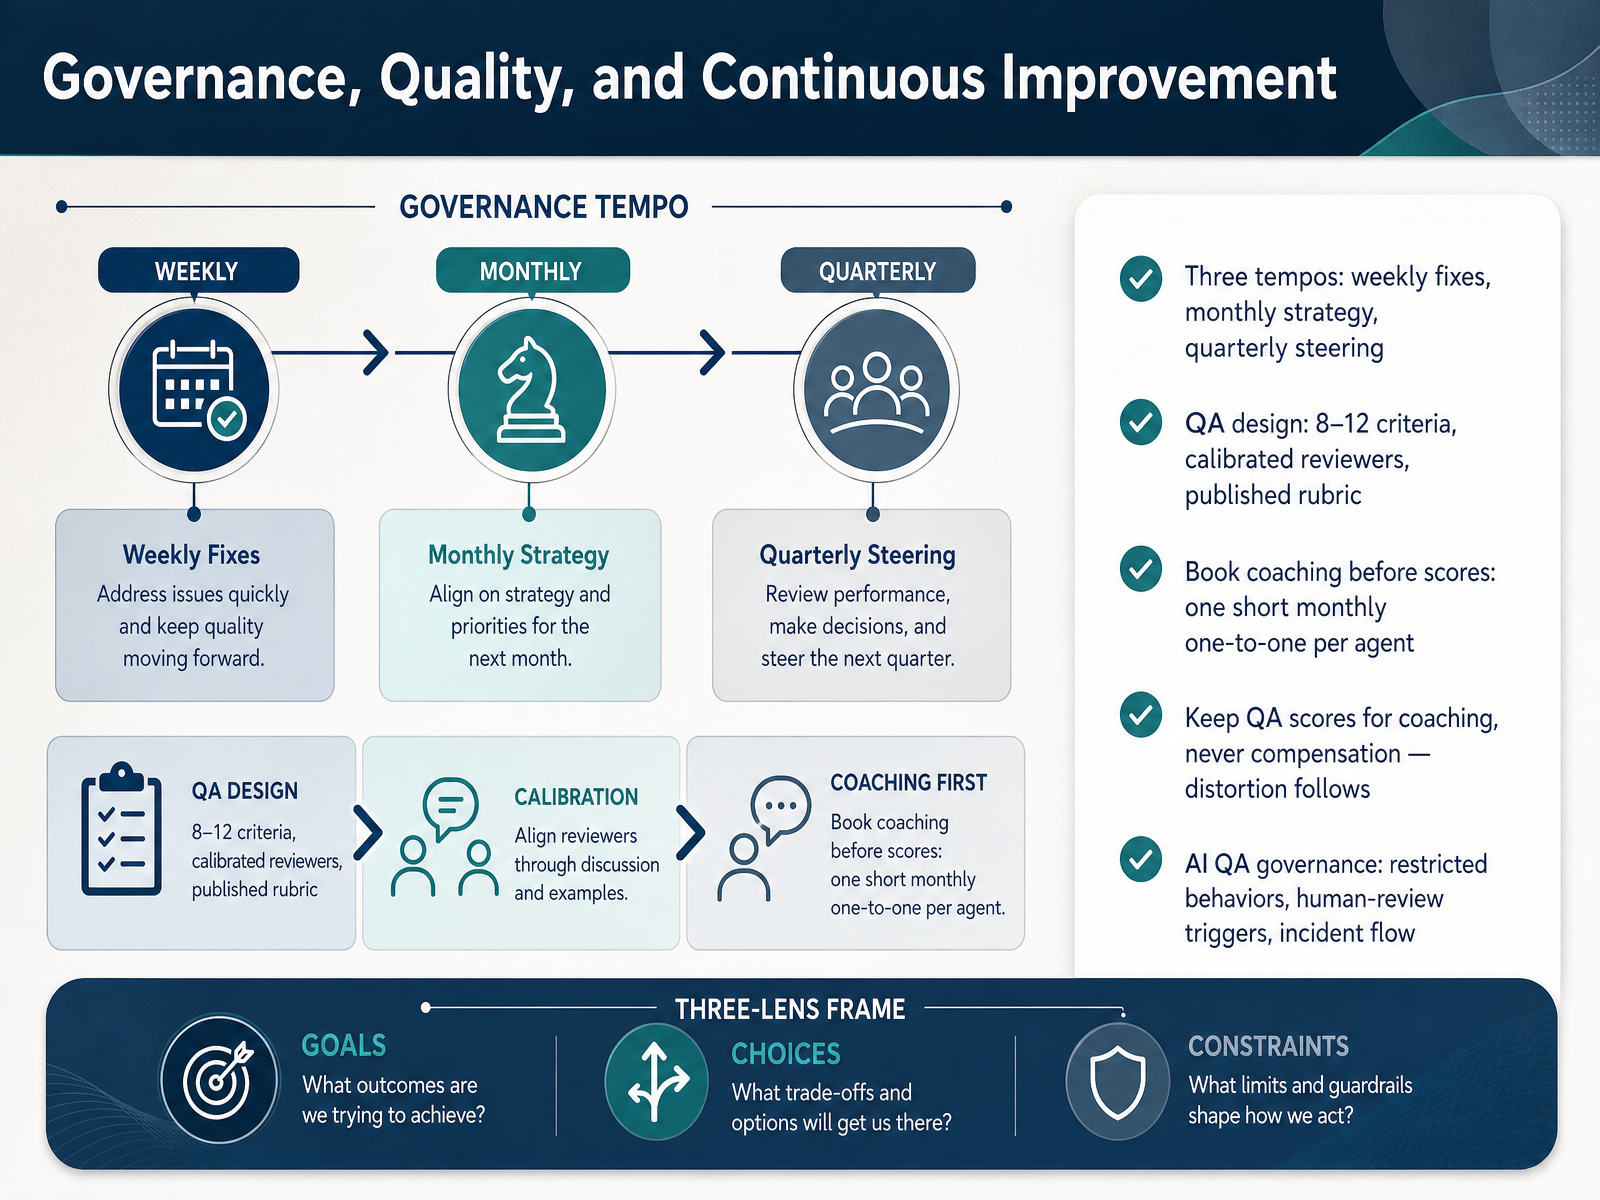 1 min
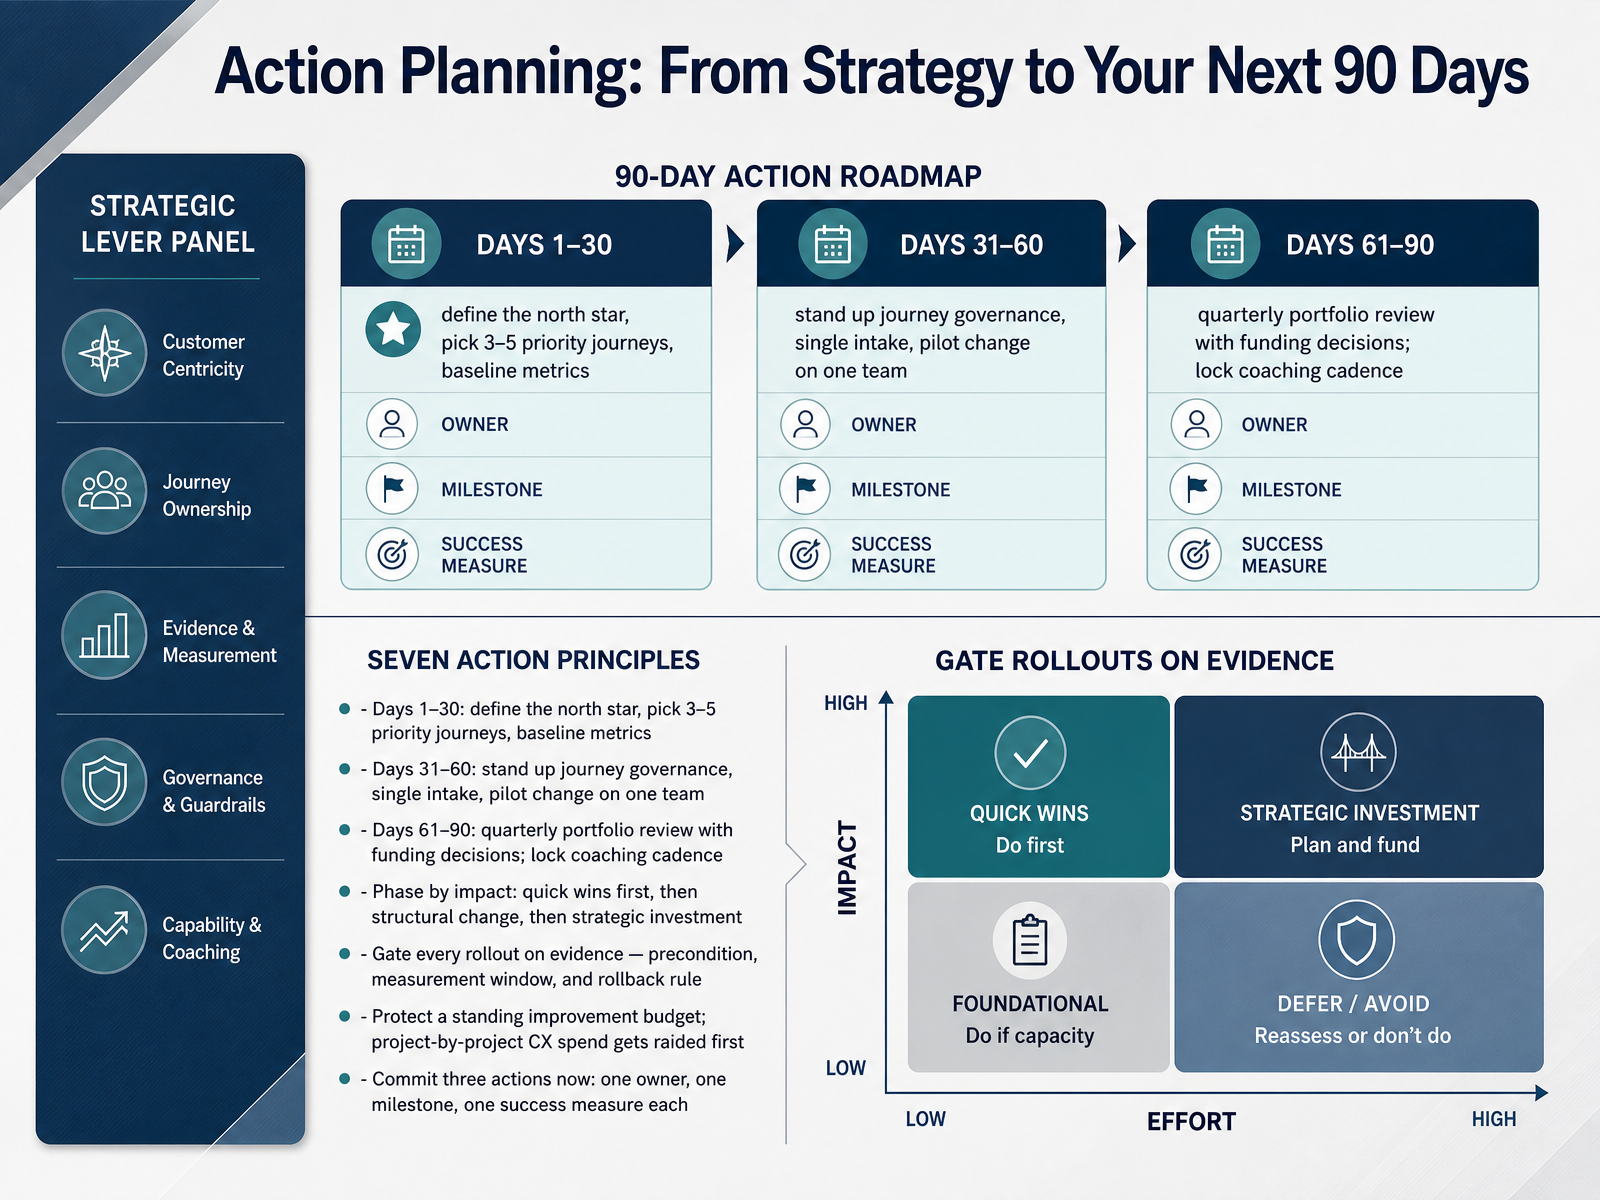
1 min - 13Action Planning: From Strategy to Your Next 90 DaysNow let's turn strategy into a plan you can actually run. Start with days one to thirty. Define your north star, pick three to five priority journeys, and baseline the metrics you'll be held to. For example, if billing disputes are your top journey, baseline volume, handle time, and first-contact resolution before you change anything. In days thirty-one to sixty, stand up journey governance, create a single intake for requests, and pilot change on one team. Phase by impact: quick wins first, then structural change, then strategic investment. Gate every rollout on evidence, including a precondition, a measurement window, and a rollback rule. And protect a standing improvement budget, because project-by-project customer experience spend gets raided first. Before we close, commit three actions now. One owner, one milestone, and one success measure each. Pick them while the details are still fresh. That's how the next ninety days move from intent to evidence. Next, we'll wrap up with your one-page strategy and immediate next steps.
 2 min
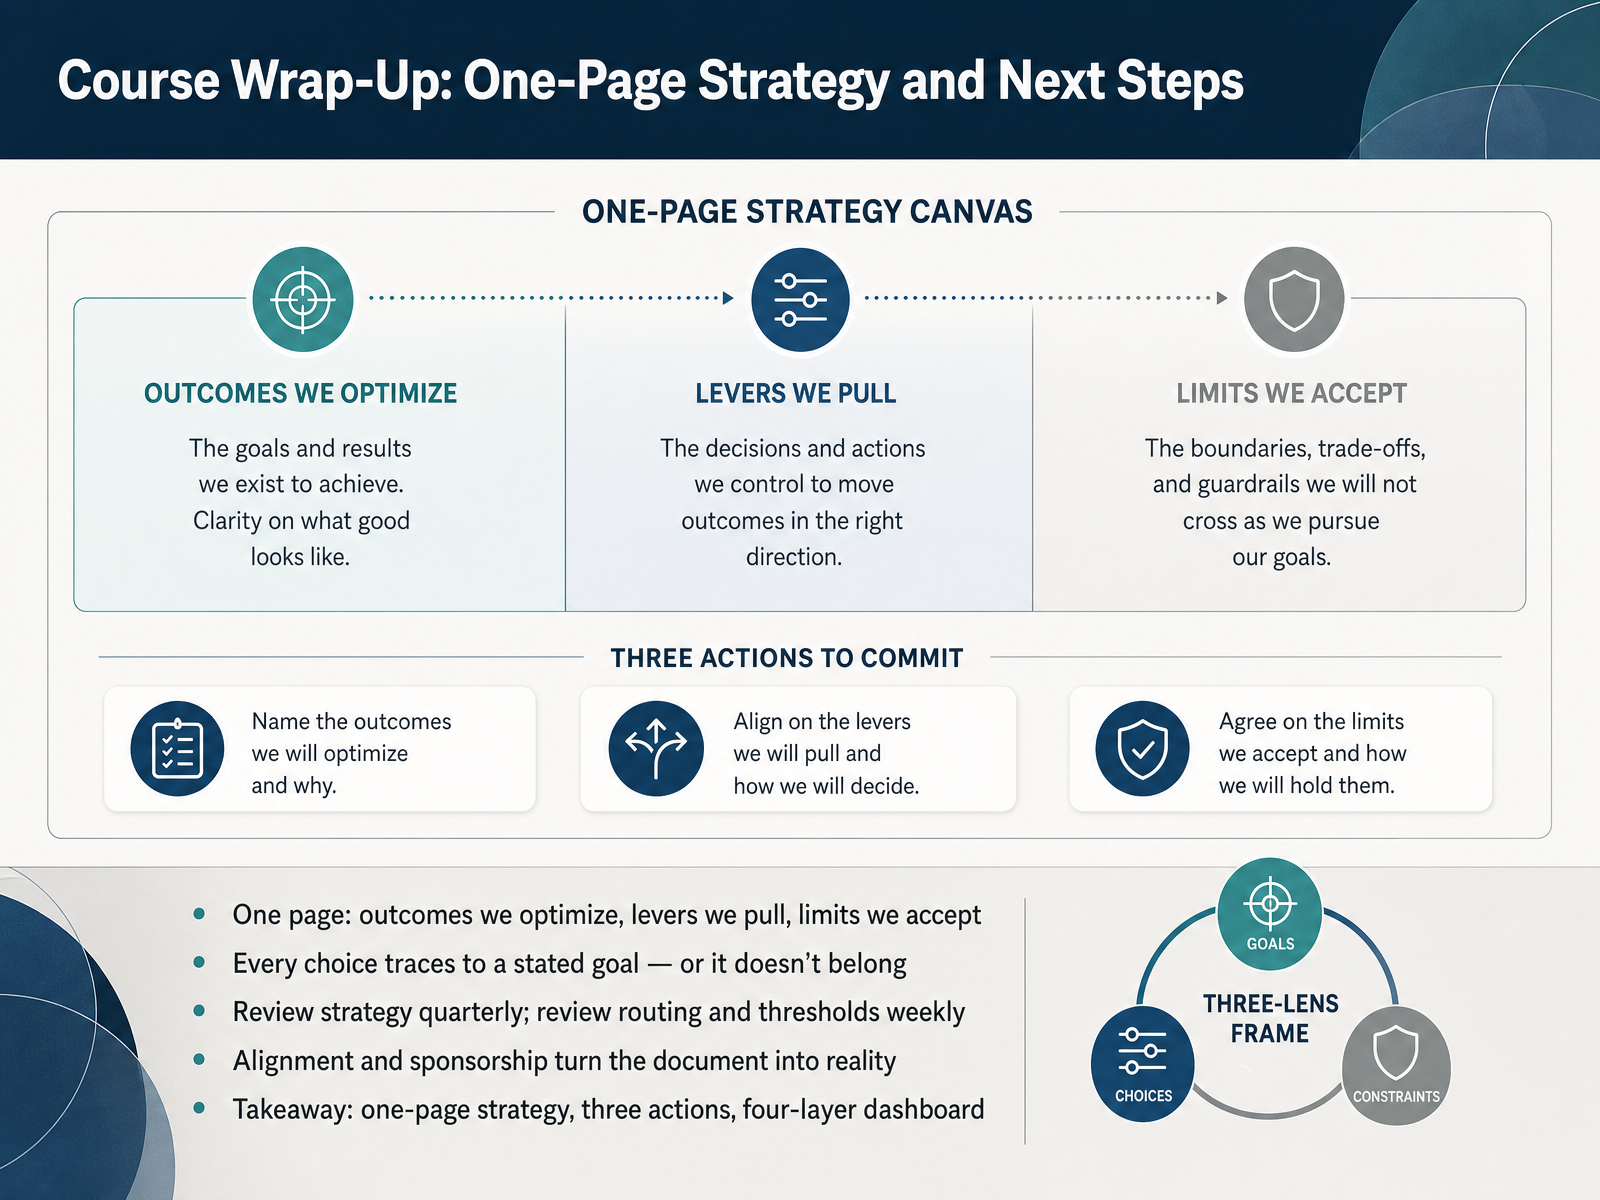
2 min - 14Course Wrap-Up: One-Page Strategy and Next StepsLet's bring this together. Your one-page strategy has three columns. Outcomes we optimize. Levers we pull. Limits we accept. Keep it that short, because a page you can argue over beats a deck nobody reads.
The test is simple. Every choice traces back to a stated goal, or it doesn't belong. If you cannot name the goal behind a new queue, a new report, or a new threshold, that is your answer. For example, when handle time rises, protect resolution quality before adding headcount, and make that trade-off explicit with finance and policy owners.
Then set your review rhythm. Strategy quarterly. Routing and thresholds weekly. Same document, different clocks.
Finally, alignment and sponsorship turn the document into reality. So your takeaway: one-page strategy, three actions, four-layer dashboard. Pick your first action this week. Thank you for the work you put into these sessions, and go make the next quarter measurable.
 2 min
2 min
Take the deck with you
Download this course as a file — free, no sign-up needed.
- PDF handoutEvery slide page, ready to print or share.15 pages · 3.8 MBDownload
- PowerPoint slidesThe full deck as a .pptx — open it in PowerPoint, Keynote, or Google Slides.15 pages · 3.7 MBDownload
Free to use in your own training — please keep the PersonWise credit page at the end.
Have your own deck? Turn it into a course