Operations and Supply Chain Management
Begin
14 pages · ~28 min
Operations and Supply Chain Management
This training covers operations and supply chain management essentials, helping professionals streamline processes, manage inventory, and improve end-to-end supply chain efficiency.
What you’ll learn
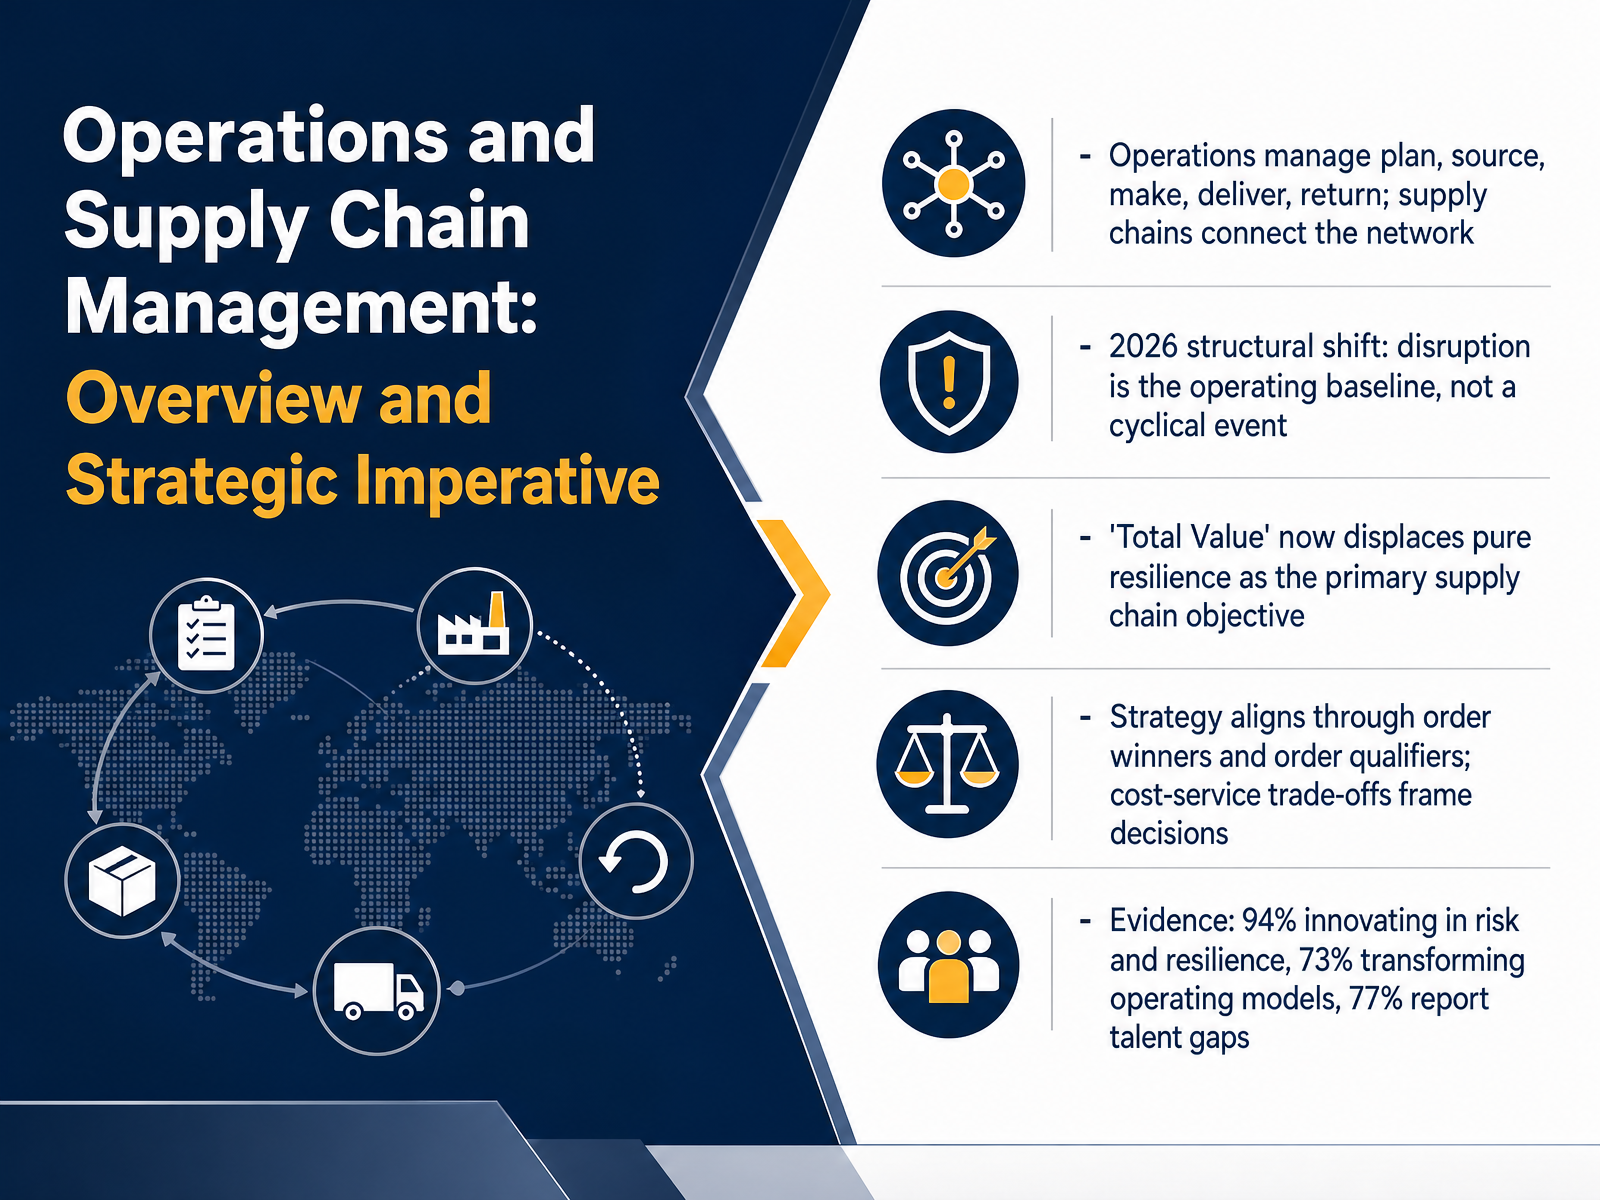
- 01Operations and Supply Chain Management: Overview and Strategic ImperativeWelcome. Let's open this course on Operations and Supply Chain Management with a working definition and a clear strategic frame. First, the language. Operations run five core flows: plan, source, make, deliver, and return. The supply chain is the network that connects them, from your suppliers to your customers. So when we say operations, we mean the work inside your four walls. When we say supply chain, we mean the whole connected system. Now the strategic shift. The 2026 evidence shows disruption is the operating baseline, not a cyclical event. Those of you on the floor already feel this. Randomness is normal, so design for it. That is why Total Value, not pure resilience alone, now leads the objective. Resilience protects service. Total Value adds cost, cash, and experience. Strategy then aligns through order winners and order qualifiers, and your cost-service trade-off frames every planning, procurement, and logistics choice. The numbers back it: ninety-four percent are innovating in risk and resilience, seventy-three percent are transforming operating models, and seventy-seven percent report talent gaps. So check your top three disruptions and know which of your decisions are order winners versus qualifiers. Next, The 2026 Operating Context: Disruption, Trade, and Energy Realities.kpmg.comkpmg.comefeso.com+22 min
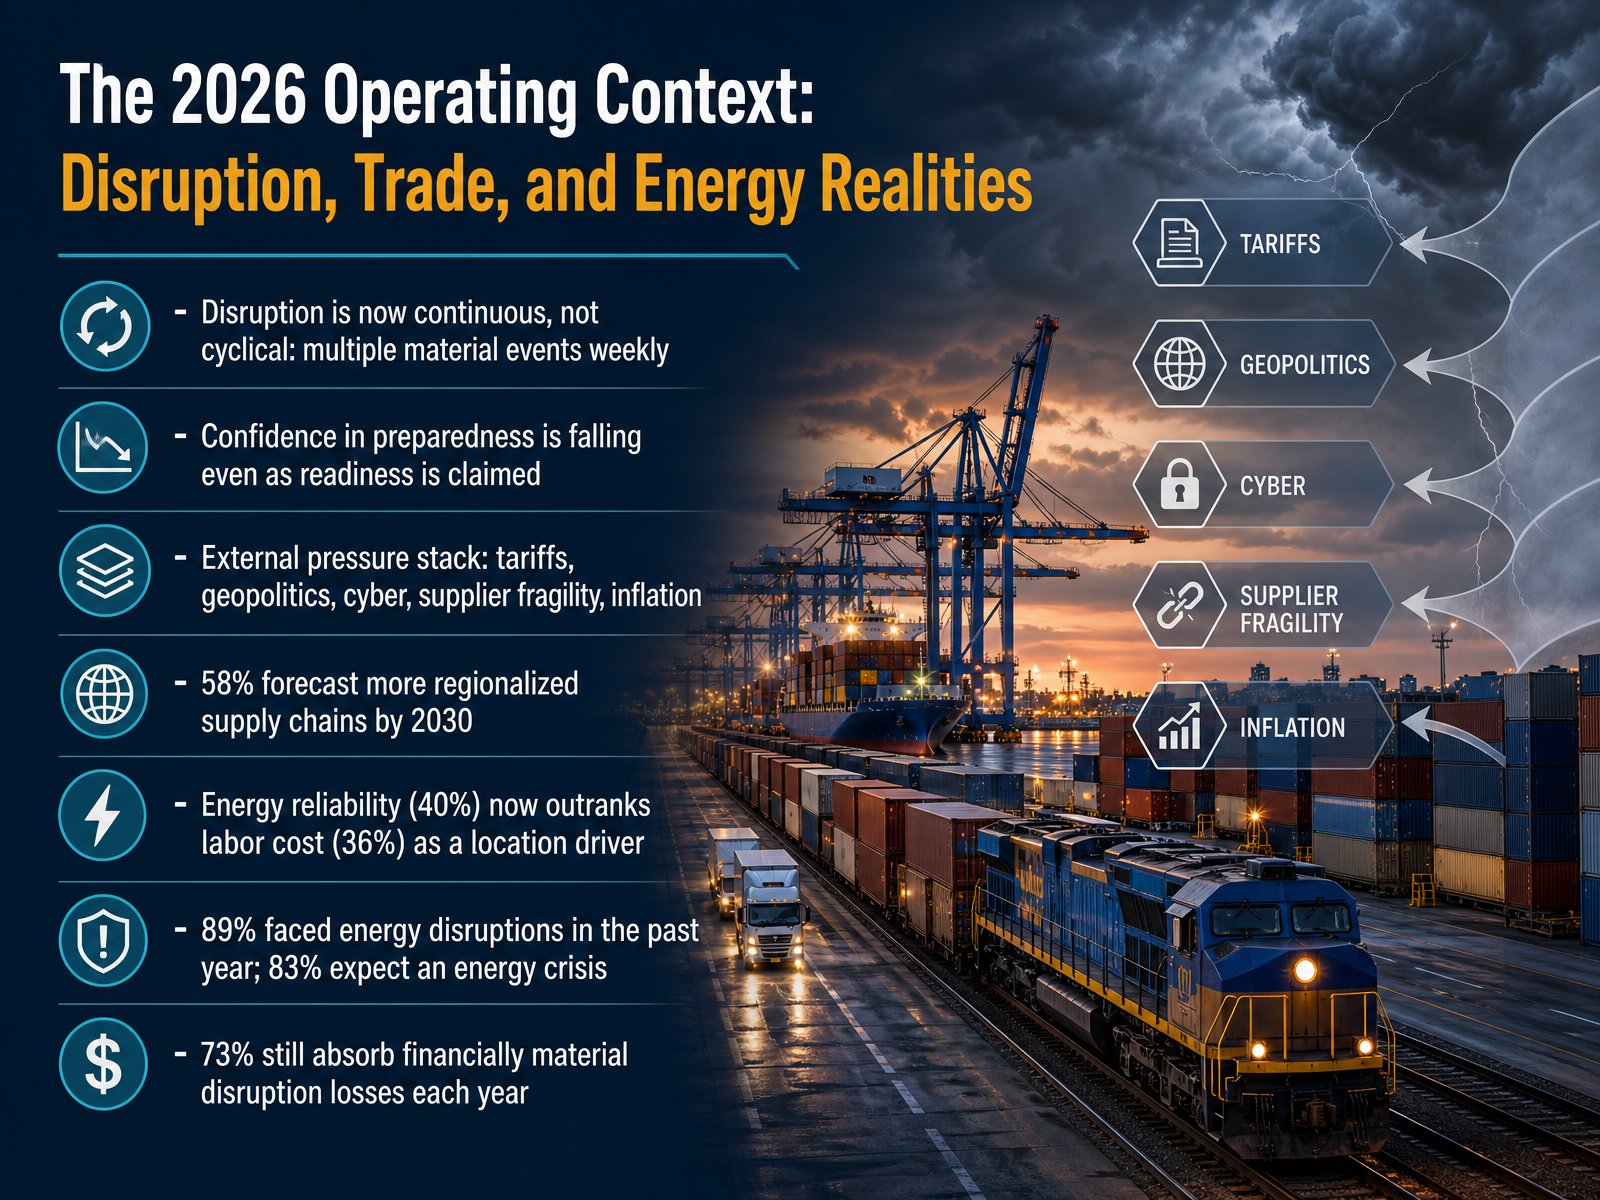
- 02The 2026 Operating Context: Disruption, Trade, and Energy RealitiesLet's look at the operating context you're planning into for 2026. The headline is simple. Disruption is now continuous, not cyclical. Instead of a few events a year, many teams are handling multiple material events every week. And here's the uncomfortable part. Confidence in preparedness is falling even as readiness is claimed. So leaders say they're ready, while losses keep showing up. The external pressure stack is familiar. Tariffs, geopolitics, cyber threats, supplier fragility, and inflation, all landing on the same planning cycle. On network design, the direction is clear. Fifty-eight percent forecast more regionalized supply chains by twenty thirty. And the location driver has shifted. Energy reliability, at forty percent, now outranks labor cost, at thirty-six percent. That's no longer a facilities question. It's a supply chain decision. The energy exposure is real. Eighty-nine percent faced energy disruptions in the past year, and eighty-three percent expect an energy crisis. Meanwhile, seventy-three percent still absorb financially material disruption losses every year. So your takeaway for this slide. Treat disruption as a baseline, not an exception. Build energy and trade scenarios into sourcing and location decisions, and track where losses actually occur, supplier by supplier. Next, we'll ground this in the fundamentals with Core Concepts: Process View, Flows, and the Value Chain.
 kpmg.comkpmg.comefeso.com+22 min
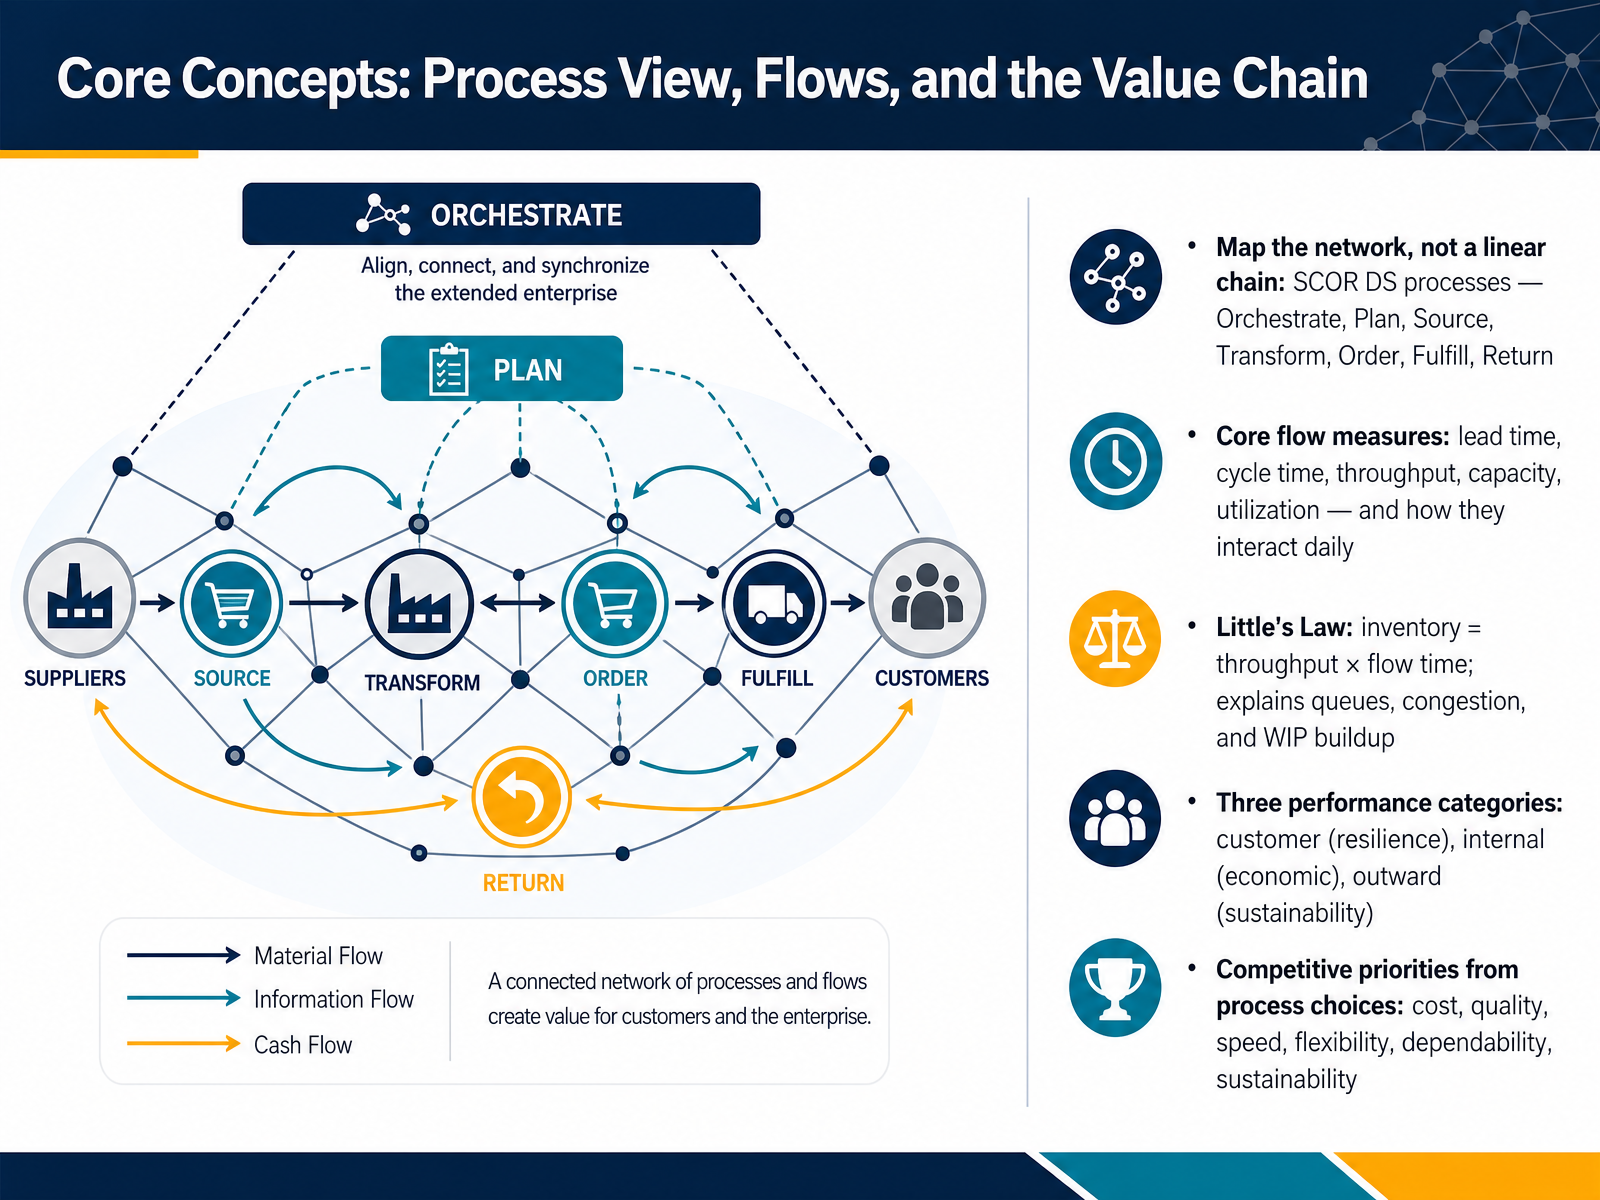
 - 03Core Concepts: Process View, Flows, and the Value ChainLet's look at the core concepts that hold everything together. First, stop thinking of your supply chain as a straight line. Map the network instead, using the SCOR Digital Standard processes: Orchestrate, Plan, Source, Transform, Order, Fulfill, and Return. Second, watch your flow measures daily. Lead time is how long a customer waits. Cycle time is how long one step takes. Throughput is how much you complete. Capacity is what you can handle. Utilization is how much of that capacity you actually use. Push utilization too high, and lead times climb. Third, remember Little's Law. Inventory equals throughput times flow time. That one relationship explains queues, congestion, and work in process buildup. If flow time rises while throughput holds, inventory grows. Fourth, balance three performance categories: customer resilience, internal economic results, and outward sustainability. Finally, your process choices set your competitive priorities: cost, quality, speed, flexibility, dependability, and sustainability. Pick your measures deliberately. Next, we'll connect these measures to the SCOR framework.
 scor.ascm.orgscor.ascm.orgascm.org+22 min
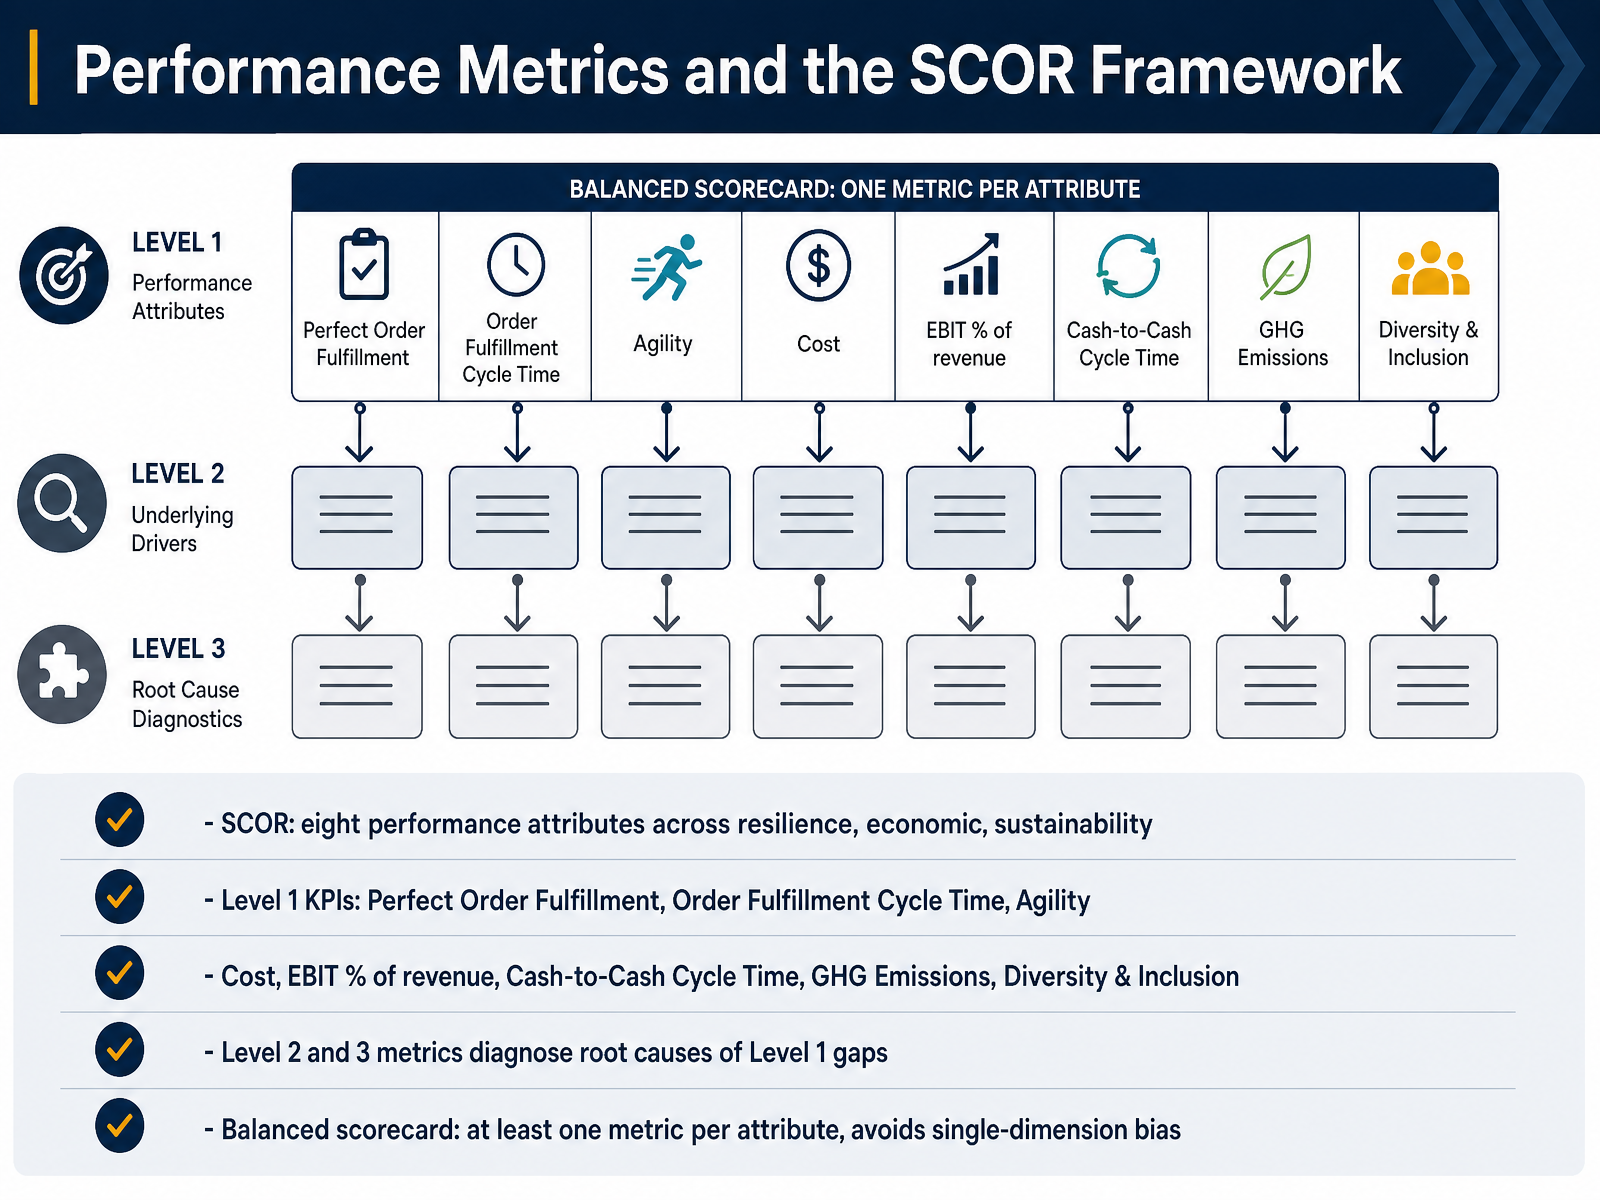
 - 04Performance Metrics and the SCOR FrameworkNext, let's talk about how we actually measure supply chain performance, using the S C O R framework. S C O R groups performance into eight attributes across three categories: resilience, economic, and sustainability. Resilience covers Reliability, Responsiveness, and Agility. Economic covers Cost, Profit, and Assets. Sustainability covers Environmental and Social. At Level One, these are your headline KPIs. Perfect Order Fulfillment, Order Fulfillment Cycle Time, Supply Chain Agility, Total Supply Chain Management Cost, EBIT as a percent of revenue, Cash-to-Cash Cycle Time, GHG Emissions, and Diversity and Inclusion. When one of those numbers misses target, you don't guess at the cause. You decompose it. Level Two and Level Three metrics are the diagnostics that explain why a Level One gap exists, like forecast accuracy, supplier on-time performance, or pick accuracy. One practical rule here: build a balanced scorecard with at least one metric per attribute. That prevents single-dimension bias, where you chase cost down and quietly damage service, cash, or resilience. So before your next review, check your scorecard covers all eight attributes. Next, we'll move into Demand Planning, Forecasting, and Integrated Business Planning.
 scor.ascm.orgscor.ascm.orgascm.org+22 min
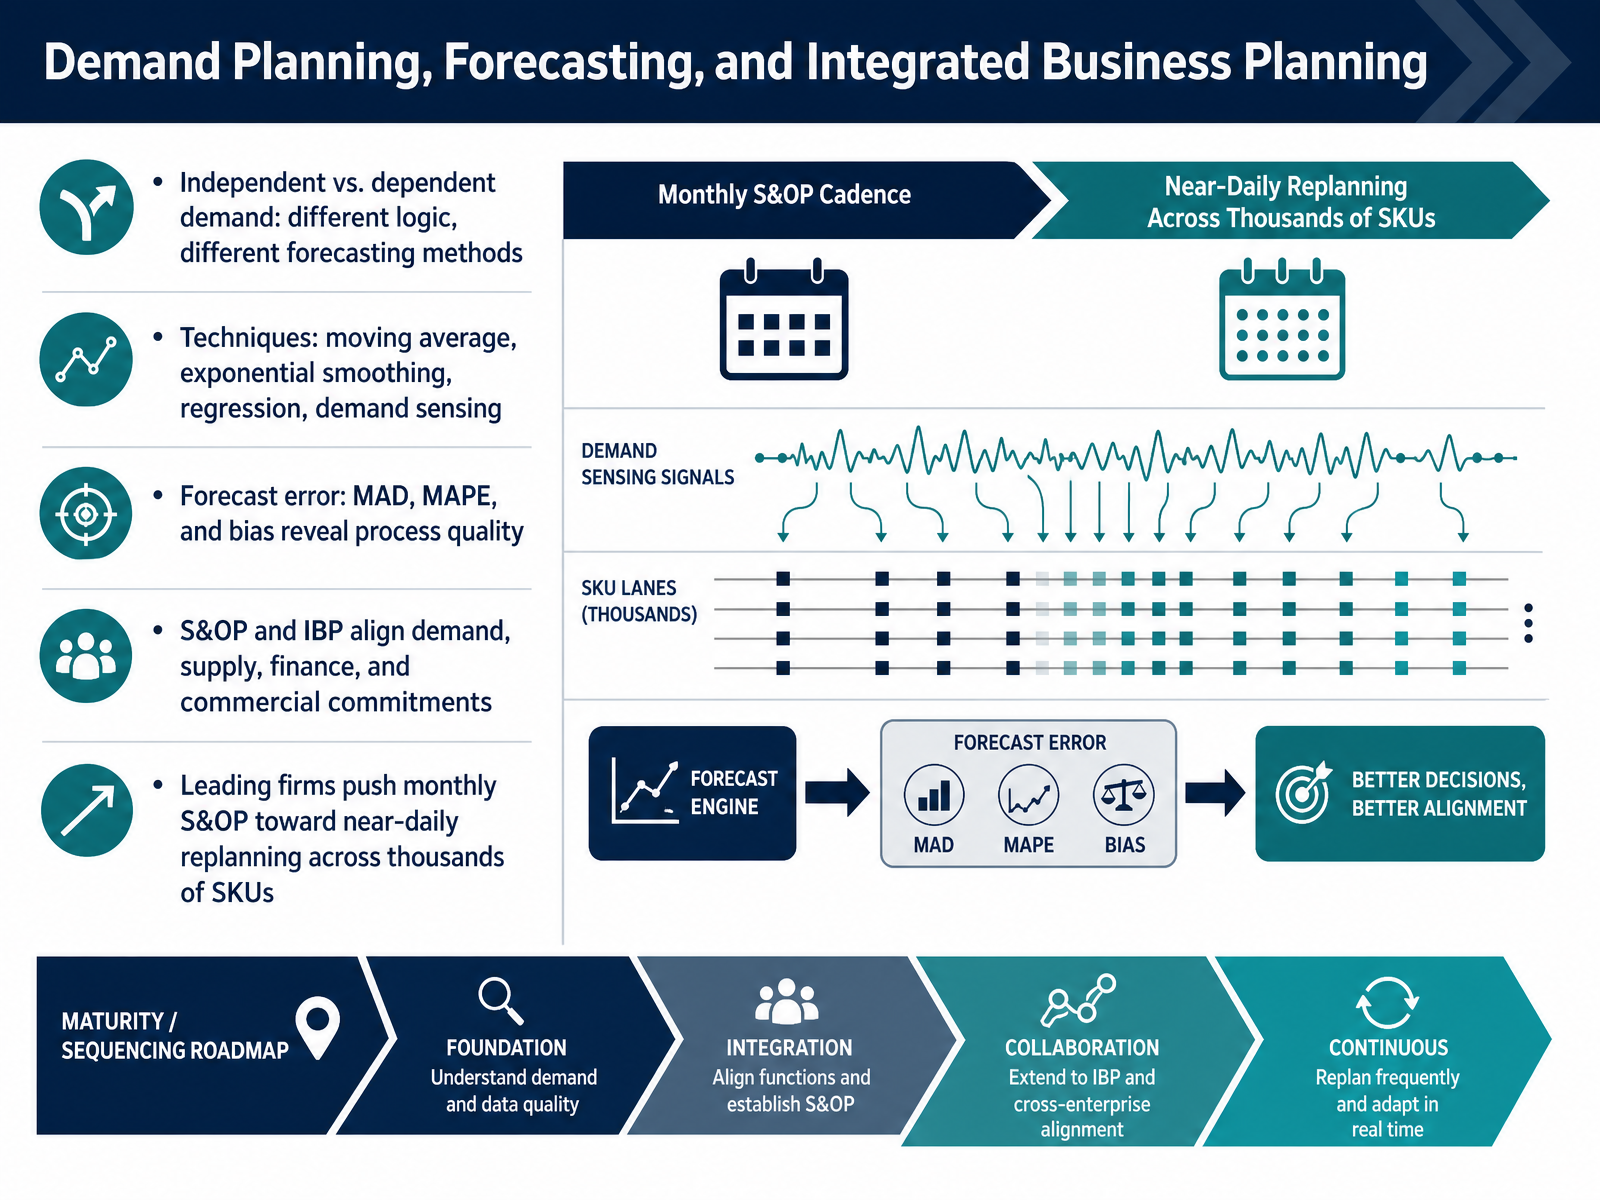
 - 05Demand Planning, Forecasting, and Integrated Business PlanningLet's talk about demand planning and forecasting. First, know what you're forecasting. Independent demand comes from the market, so you forecast it. Dependent demand is driven by another item, like components for a finished good, so you calculate it. Different logic, different methods. On techniques, a moving average smooths recent history, exponential smoothing weights recent periods more, regression ties demand to drivers like price, and demand sensing uses real-time signals. Now measure your error. Mean absolute deviation, or MAD, shows average miss size. Mean absolute percentage error, or MAPE, makes it comparable across products. Bias tells you if you're consistently over or under forecasting. Those numbers reveal process quality. This is where S and OP, sales and operations planning, and IBP, integrated business planning, come in. They align demand, supply, finance, and commercial commitments in one review. And leading firms are compressing monthly S and OP toward near-daily replanning across thousands of SKUs. So before your next planning cycle, check your forecast error and bias, not just the number. Next, we move into inventory management and working capital discipline.
 kpmg.comkpmg.comefeso.com+22 min
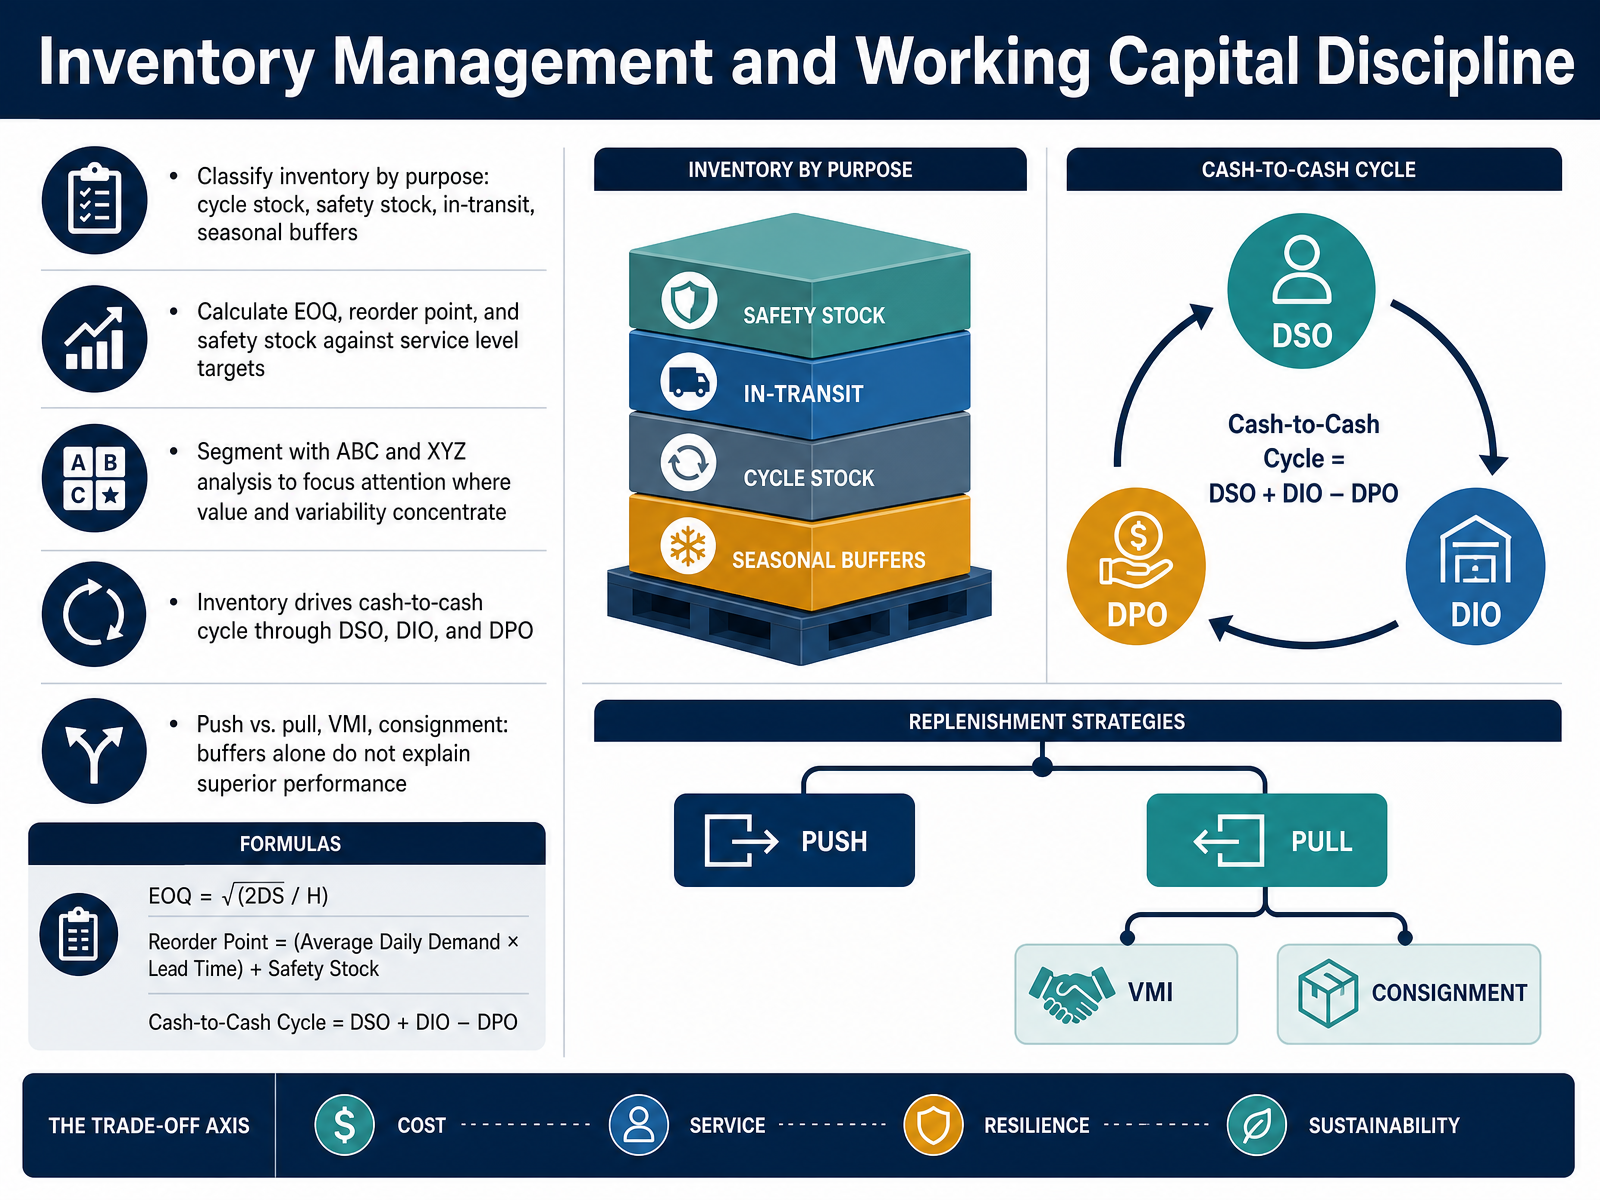
 - 06Inventory Management and Working Capital DisciplineLet's turn to inventory, because inventory is where cash and risk meet. Start by naming what each buffer is for. Cycle stock covers normal demand between orders. Safety stock protects your service level when demand or lead time jumps. In-transit stock is already committed, and seasonal buffers cover predictable peaks. Different purpose, different rule. Now the math that keeps it honest. Economic order quantity equals the square root of two times annual demand times ordering cost, divided by holding cost per unit. Reorder point equals average daily demand times lead time, plus safety stock. Raise the service level, and safety stock rises with it, so service is a deliberate cost decision, not a default. You cannot watch every item, so segment. A B C ranks items by value; X Y Z ranks them by demand variability. Put tight control where high value meets high variability. And remember the cash equation: cash-to-cash cycle equals days sales outstanding plus days inventory outstanding minus days payable outstanding. Push, pull, vendor managed inventory, consignment, none of these fix performance on their own. Buffers alone do not explain superior results. The action here is to classify your buffers, review your reorder points against service targets this quarter, and free cash by attacking your worst segment. Next, we look at procurement, sourcing, and supplier relationship management.
 kpmg.comkpmg.comefeso.com+22 min
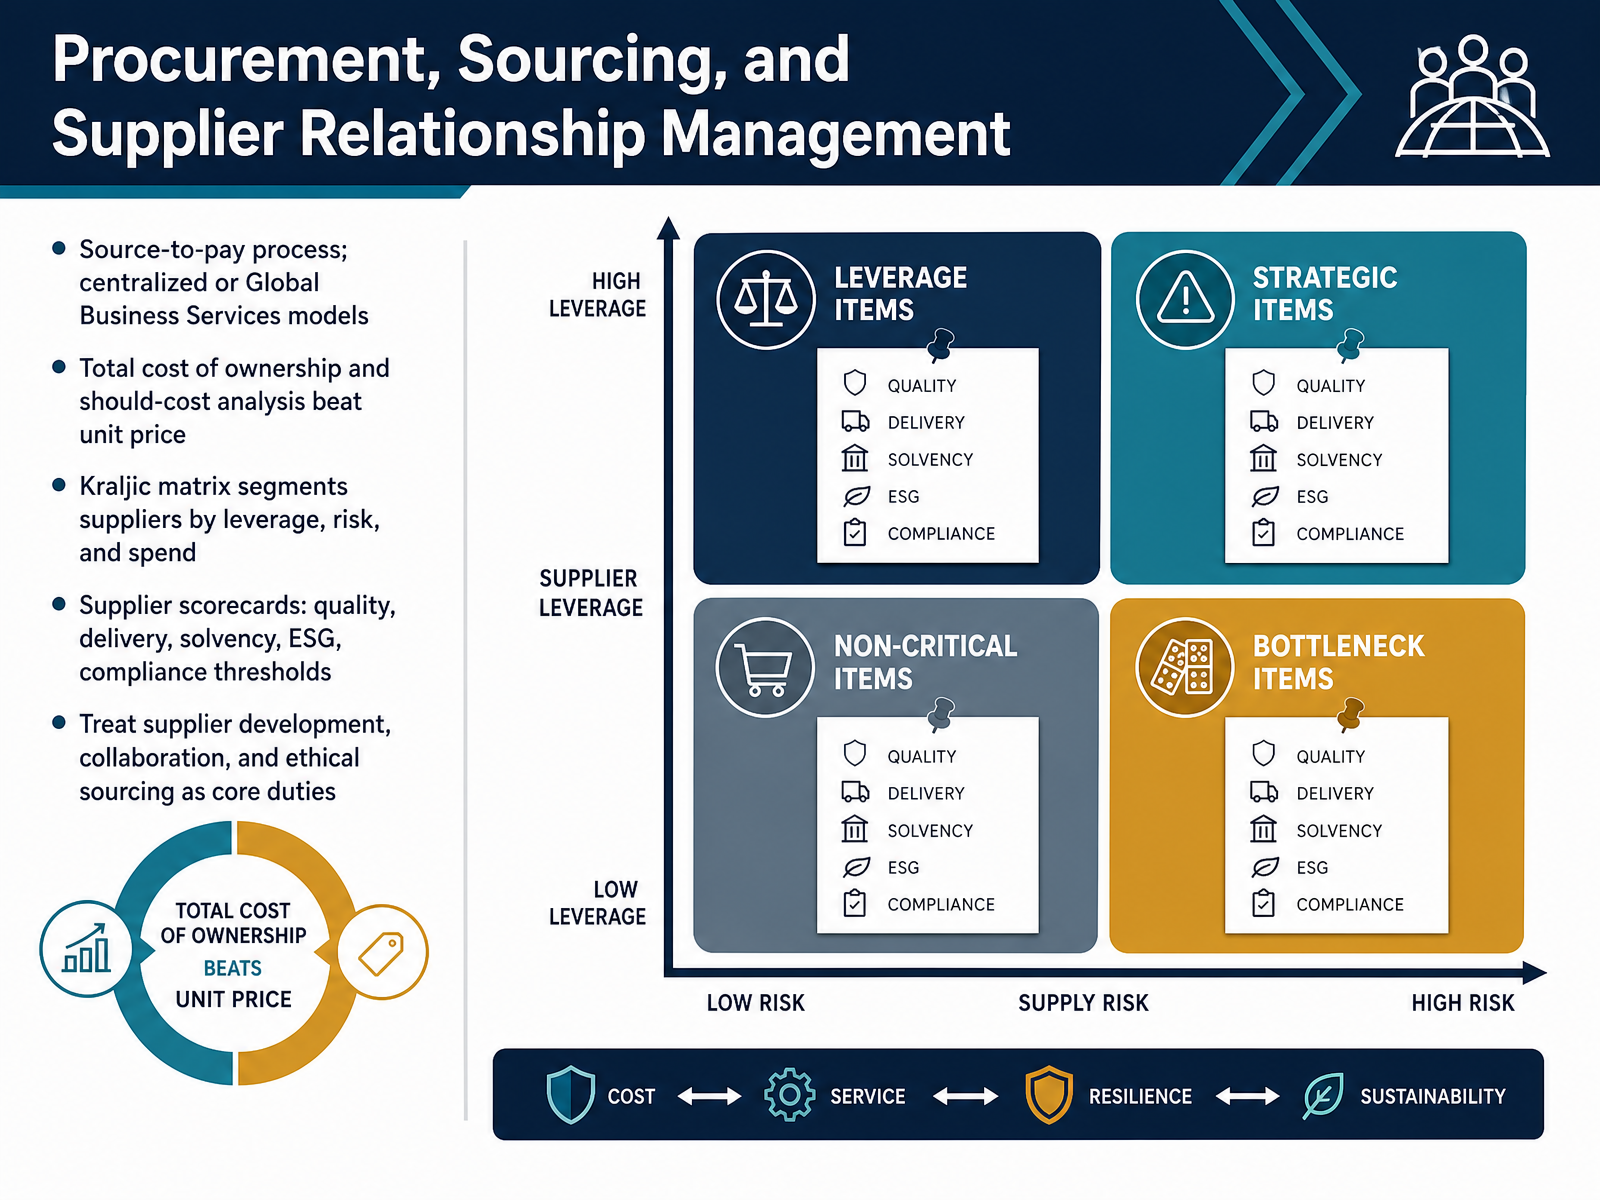
 - 07Procurement, Sourcing, and Supplier Relationship ManagementNow let's talk about procurement, sourcing, and supplier relationship management, because this is where cost, risk, and resilience get decided. It starts with the source-to-pay process, whether you run it centrally or through a Global Business Services model. Here's the key shift. Unit price is not the real number. Total cost of ownership and should-cost analysis capture freight, tariffs, quality failures, inventory, and switching risk. Then segment. The Kraljic matrix sorts suppliers by leverage, risk, and spend, so you know who to partner with and who to keep competitive. Use supplier scorecards that track quality, delivery, solvency, ESG, and compliance thresholds. Suppliers below your threshold go into a development plan, not automatic termination. One more thing. Treat supplier development, collaboration, and ethical sourcing as core duties, and embed ESG clauses and audit rights into contracts. The takeaway is simple. Score your top suppliers this quarter, know their true cost, and act on the risks. Next, we move into production planning, scheduling, and lean operations.
 hayot-expertise.frglobalcompact.atvoiceofenvironment.com+22 min
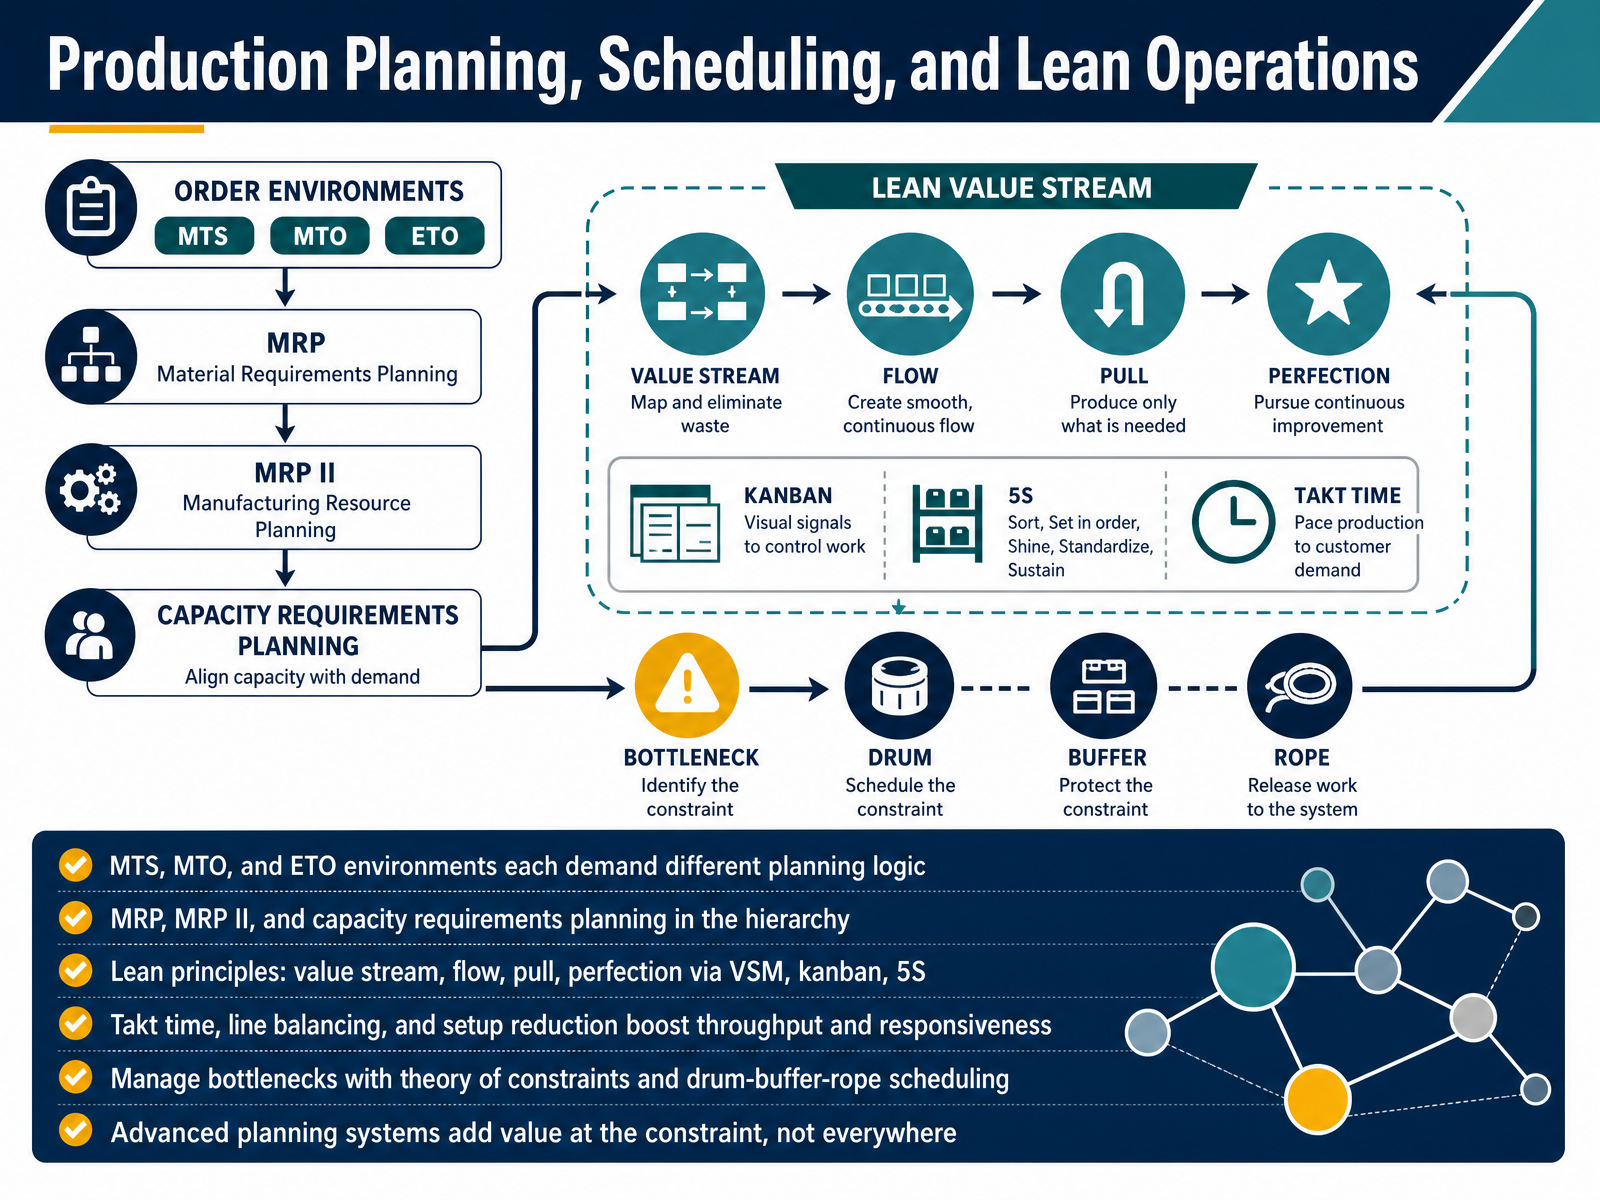
 - 08Production Planning, Scheduling, and Lean OperationsLet's move into production planning and scheduling, and how lean thinking fits. Start with the demand signal. Make to stock, make to order, and engineer to order each need different planning logic. Make to stock plans from forecast. Make to order plans from confirmed orders. Engineer to order plans from project milestones. Get that logic wrong, and you build the wrong inventory. Next, know your planning hierarchy. MRP, material requirements planning, explodes demand into component and material needs. MRP two adds capacity and finance. Capacity requirements planning checks whether you actually have the hours. Lean then asks a harder question. Where is value, and where is waste? A value stream map makes that visible. Kanban pulls work only when downstream consumption triggers it. Five S organizes the workplace. Takt time sets the pace the customer demands. Line balancing levels work across stations. And setup reduction lets you run smaller batches, which improves flow and responsiveness. Now, the constraint. Theory of constraints says throughput is limited by one bottleneck at a time. Drum-buffer-rope schedules around it. And here is the key point for your planning reviews. Advanced planning systems add the most value at the constraint, not everywhere. So pick your environment, pace to takt time, and protect the bottleneck. Coming up next, logistics, distribution networks, and last-mile economics.
 scor.ascm.orgscor.ascm.orgascm.org+22 min
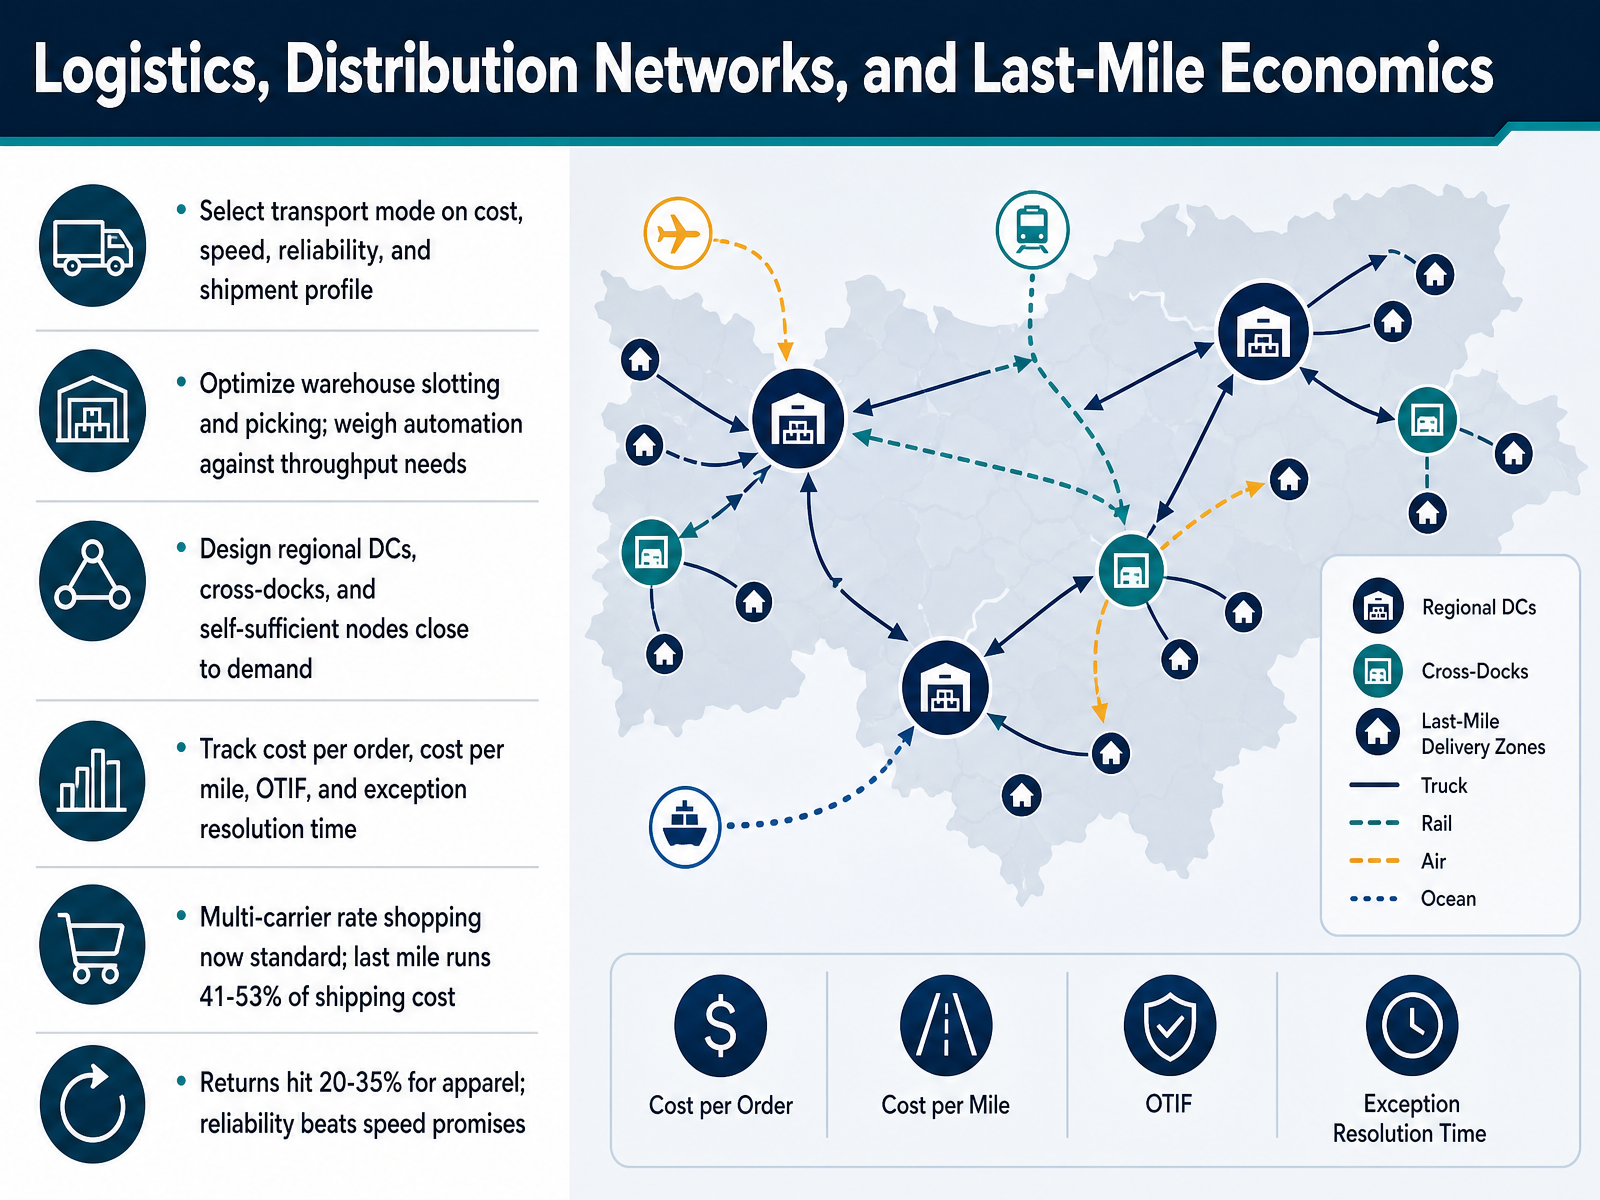
 - 09Logistics, Distribution Networks, and Last-Mile EconomicsNow let's focus on logistics and distribution networks, where the real cost lives.
First, mode selection. Pick transport mode on four things: cost, speed, reliability, and shipment profile. For heavy, slow-moving freight, an intermodal move may beat a truck. For urgent, small parcels, it won't. Match the mode to the order, not the other way around.
Inside the warehouse, optimize slotting and picking. Put your fastest movers in the golden zone, closest to pack stations. Then weigh automation against throughput needs. Robots only pay back when volume is stable and high. Below that, manual or semi-automated flows often win on flexibility.
Next, design your network. Place regional distribution centers, cross-docks, and self-sufficient nodes close to demand. A cross-dock moves product without storage; it exists to consolidate and re-ship fast. Get closer to the customer, and cost per order falls.
Track cost per order, cost per mile, OTIF, which means on-time in-full, and exception resolution time. Multi-carrier rate shopping is now standard practice. The last mile runs forty-one to fifty-three percent of shipping cost, so this is where margin is won or lost. And remember returns: apparel runs twenty to thirty-five percent. Reliability beats speed promises. A two-day window hit on time outperforms a one-day window that misses.
So the takeaway: audit your mode, node, and carrier mix, and republish realistic delivery promises. That discipline moves OTIF and protects margin.
Let's turn to risk, resilience, and continuity as an operating capability.
 scmr.comshopappy.comalixpartners.com+22 min
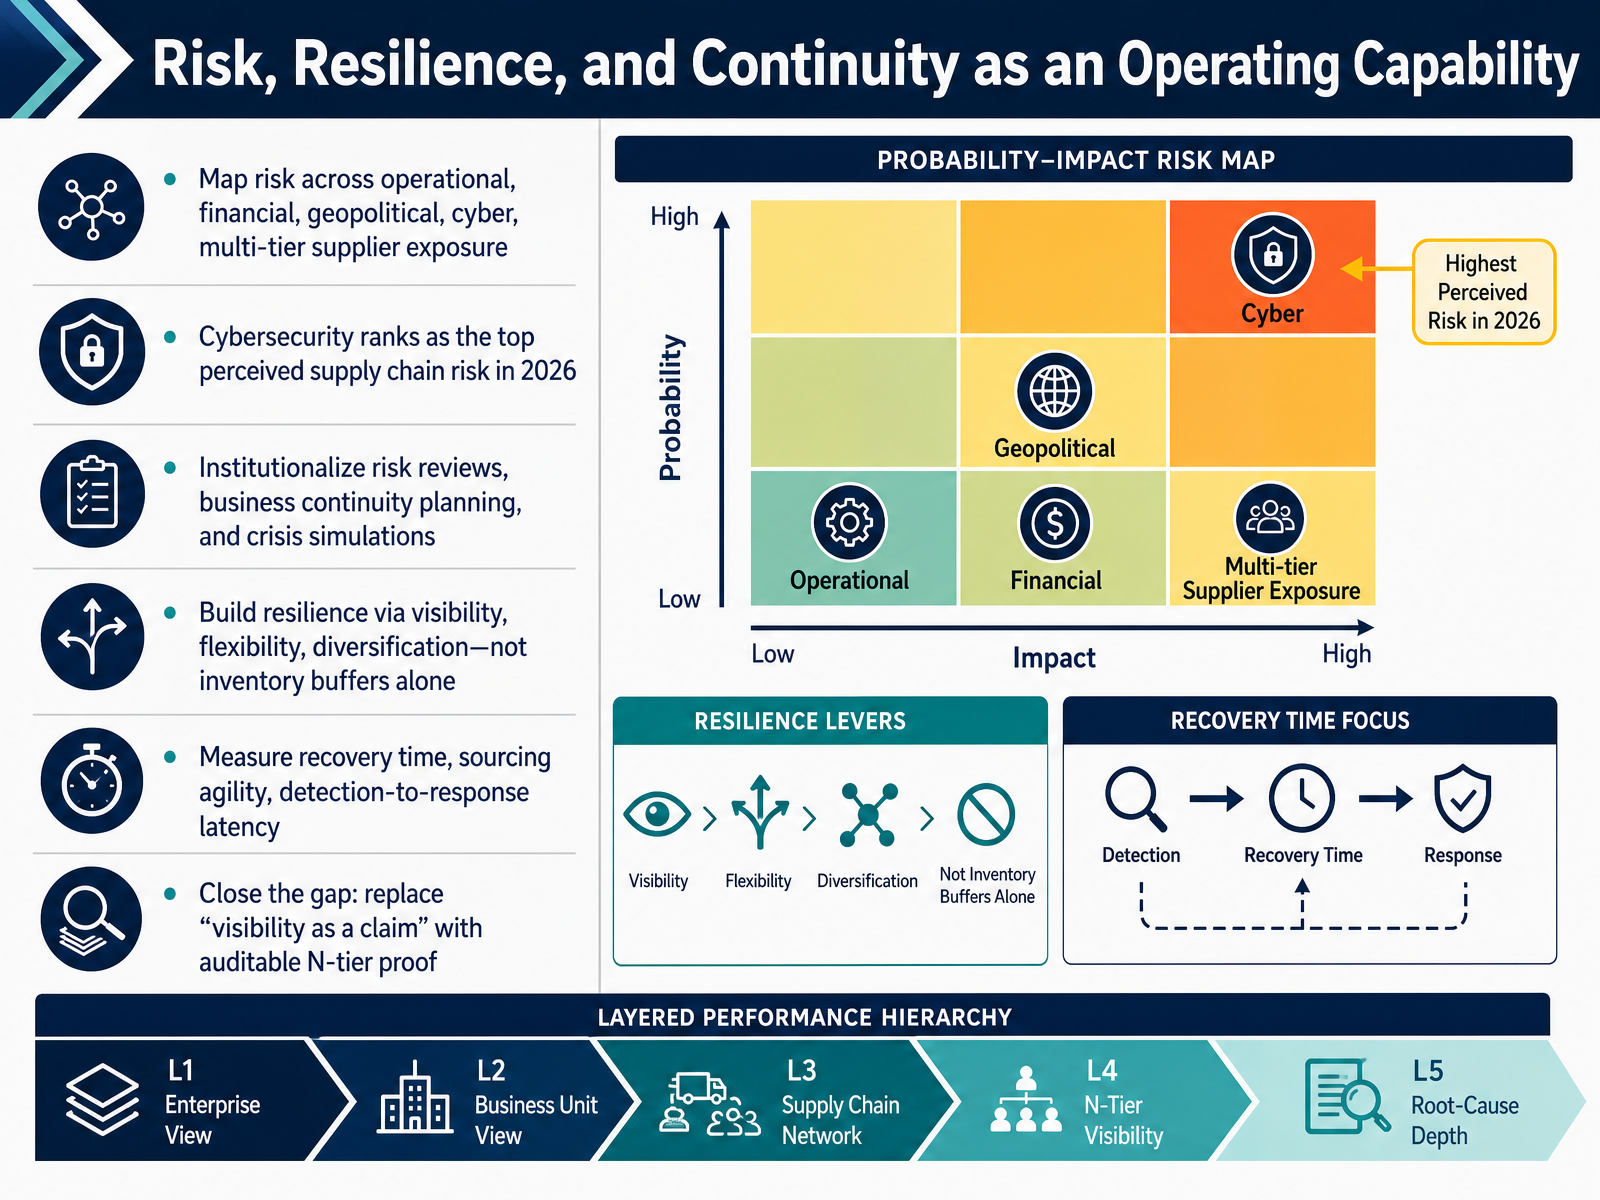
 - 10Risk, Resilience, and Continuity as an Operating CapabilityLet's talk about risk, resilience, and continuity as an operating capability, not a project. Start by mapping risk across five fronts: operational, financial, geopolitical, cyber, and multi-tier supplier exposure. Here's a signal worth pausing on. Cybersecurity now ranks as the top perceived supply chain risk for 2026, followed by multi-tier supplier exposure. So the threats are structural, not cyclical. That means we institutionalize the work. Regular risk reviews. Business continuity planning. Crisis simulations. Resilience comes from visibility, flexibility, and diversification, not inventory buffers alone. Buffers buy time. They don't create options. And measure what matters: recovery time after disruption, sourcing agility, and detection-to-response latency. If a supplier issue takes a week to surface, your response speed doesn't matter yet. One practical takeaway. Replace visibility as a claim with auditable N-tier proof. That means verifiable, continuously updated, traceable data past your tier one suppliers. Bring that proof to your next cross-functional risk review and challenge one assumption. Next, we move into digital transformation, AI, control towers, and digital twins.
 kpmg.comkpmg.comefeso.com+22 min
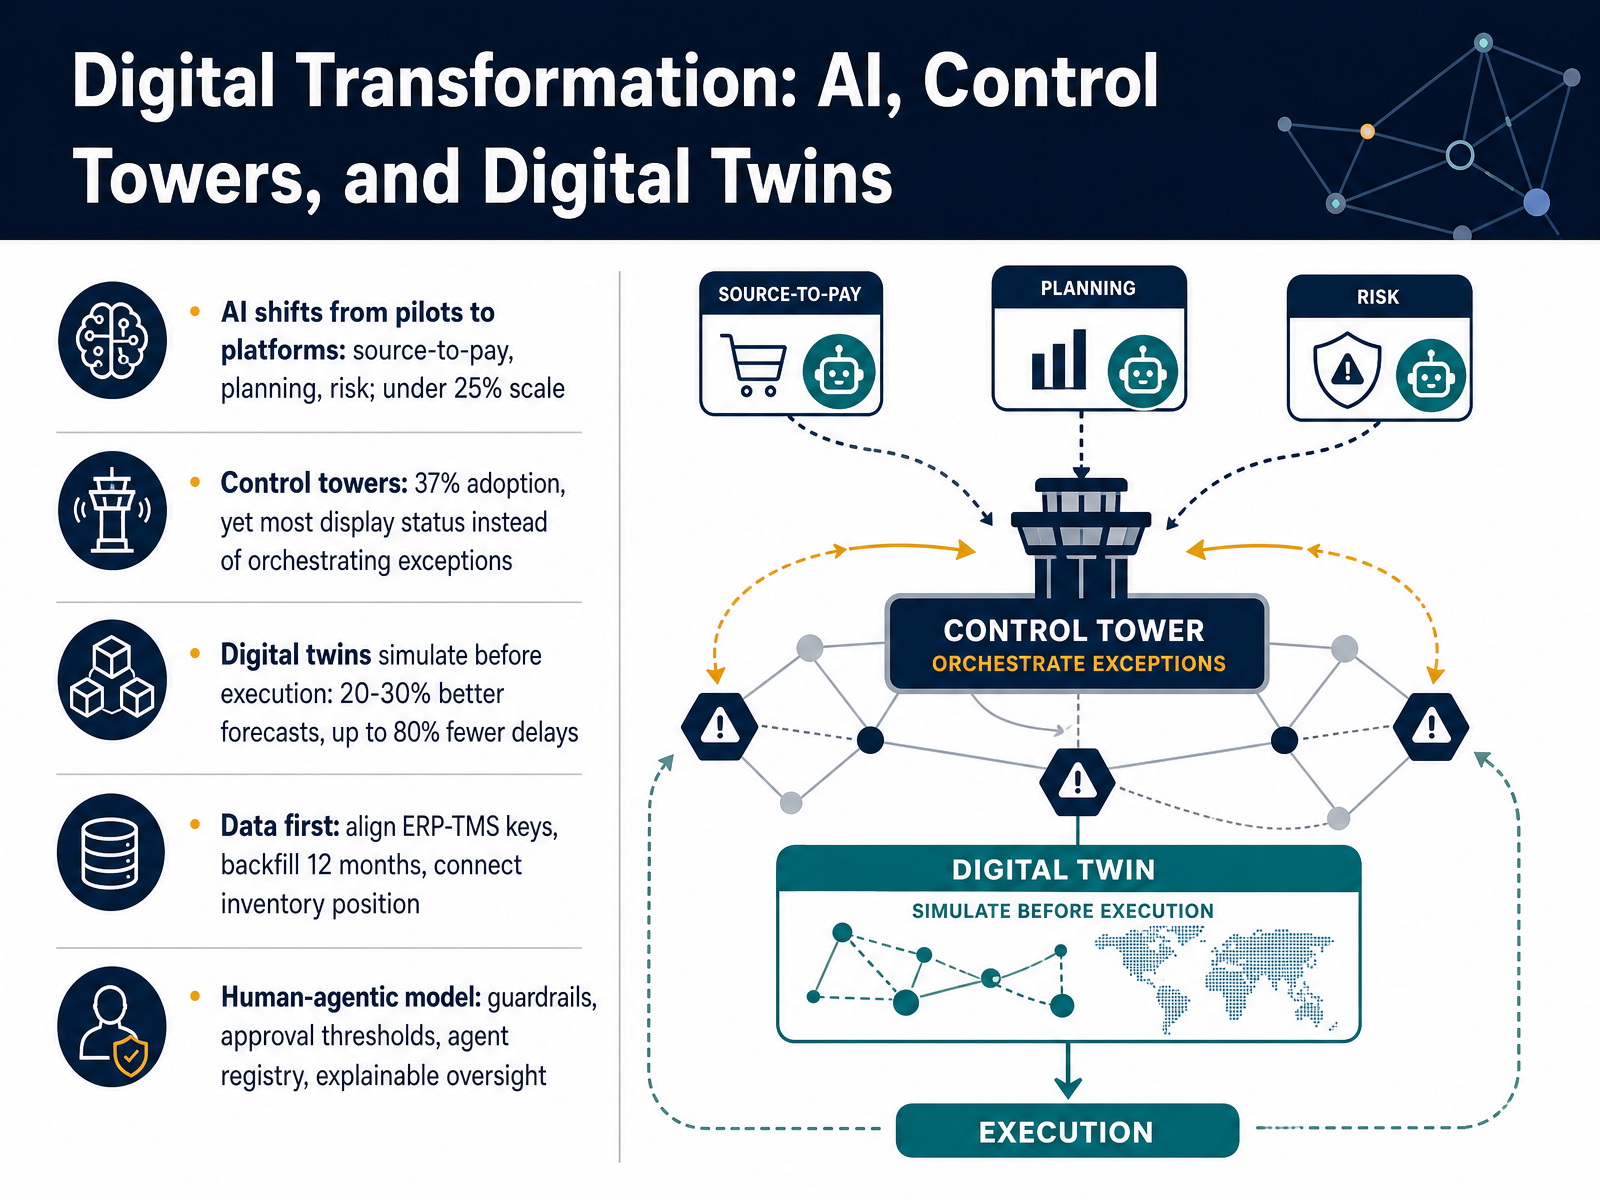
 - 11Digital Transformation: AI, Control Towers, and Digital TwinsLet's talk about digital transformation, and specifically where AI, control towers, and digital twins actually pay off for you. On AI, the shift is from pilots to platforms. We're seeing it in source-to-pay, planning, and risk. But here's the honest number: fewer than twenty five percent of companies have reached scale. So if you feel behind, you're in the majority. Control towers are a good example. Adoption hit thirty seven percent, yet most of them just display status. They show you the problem. They don't orchestrate the exception. That gap, between seeing and acting, is where the money leaks. Digital twins go one step further. They simulate before you execute, and early adopters report twenty to thirty percent better forecast accuracy, with up to eighty percent fewer delays. That's the prize. It starts with data. Align your E R P and T M S keys, backfill twelve months of history, and connect inventory position. Then run a human-agentic model, with guardrails, approval thresholds, an agent registry, and oversight you can explain.
 2 min
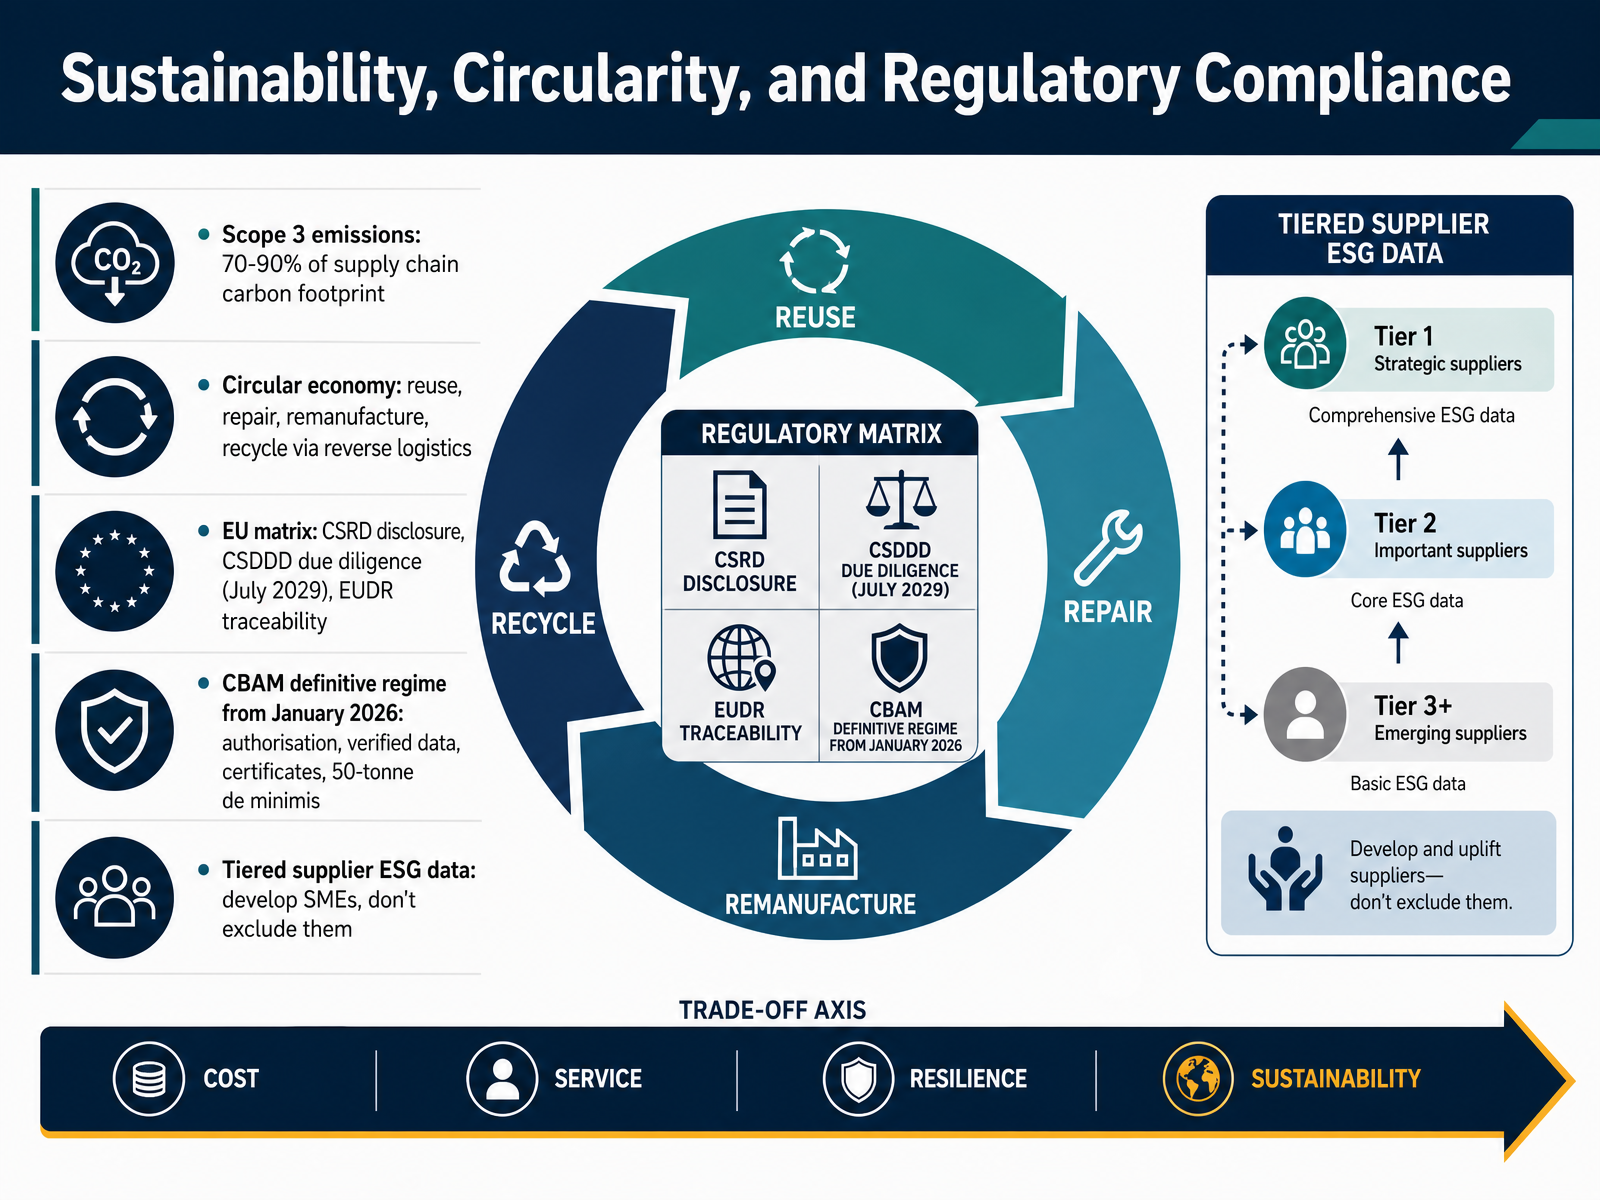
2 min - 12Sustainability, Circularity, and Regulatory ComplianceLet's talk sustainability, circularity, and regulatory compliance, because this is now a core operations issue, not a reporting side project. Start with your carbon footprint. Scope 3 emissions, meaning the indirect emissions across your value chain, typically run seventy to ninety percent of the total. Most of that sits with suppliers, so your carbon plan is really a supplier plan. On circularity, think reuse, repair, remanufacture, and recycle, all enabled by reverse logistics. That means designing returns, take-back, and recovery flows into your network from day one, not bolting them on later. Now, the EU matrix. CSRD drives disclosure. CSDDD drives due diligence, with compliance from July 2029. EUDR demands plot-level traceability to origin. And CBAM's definitive regime starts January 2026, requiring authorised declarants, verified emissions data, certificate purchases, and a fifty-tonne de minimis threshold for small importers. One practical warning. Don't exclude small and mid-sized suppliers for weak ESG data. Use tiered requests, and develop their capability. That keeps your supply base resilient. Next, we move into the Leadership, Governance, and Continuous Improvement Roadmap.
 hayot-expertise.frglobalcompact.atvoiceofenvironment.com+22 min
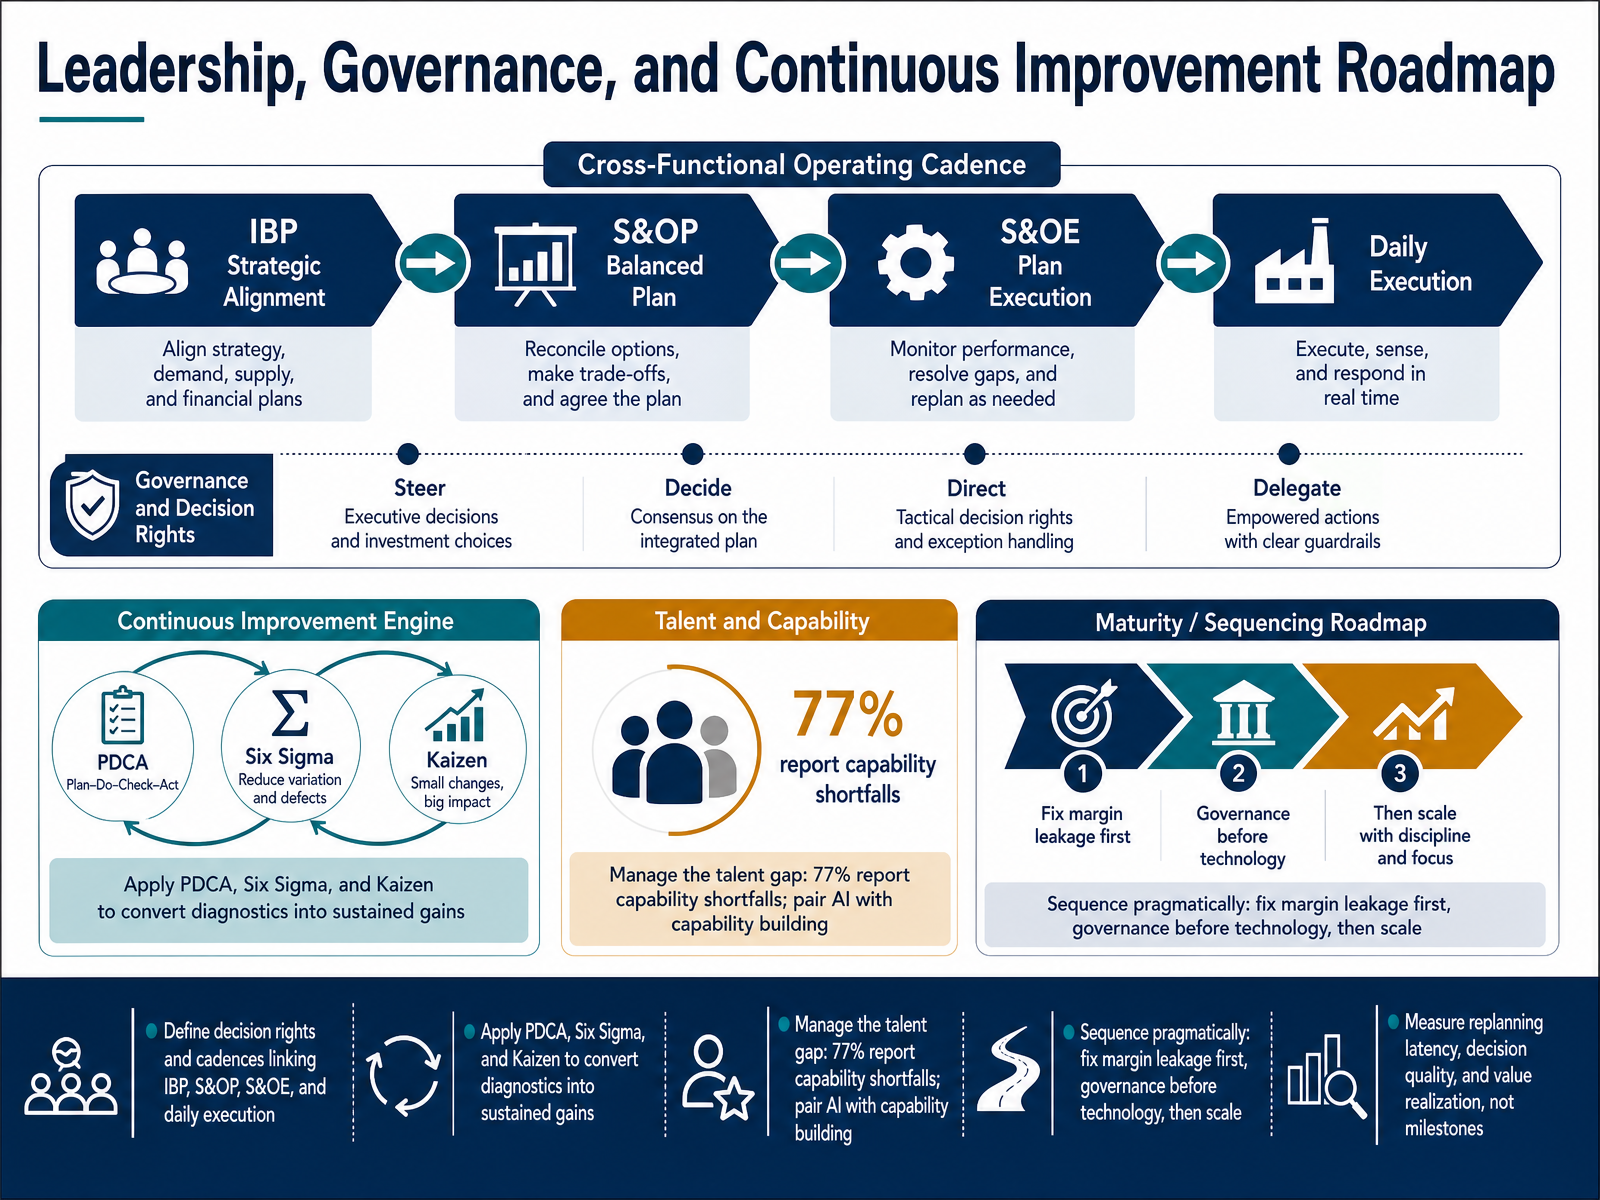
 - 13Leadership, Governance, and Continuous Improvement RoadmapNow let's talk about how you make all of this stick: leadership, governance, and a continuous improvement roadmap. First, define decision rights and cadences that link integrated business planning, sales and operations planning, sales and operations execution, and daily execution. Who owns the escalation when the plan breaks? Name it. Second, use structured methods, like plan-do-check-act, Six Sigma, and Kaizen, to turn diagnostics into sustained gains, not one-off projects. Third, close the talent gap. Seventy-seven percent report capability shortfalls, so pair AI with capability building, not instead of it. Fourth, sequence pragmatically. Fix margin leakage first, establish governance before technology, then scale. Finally, measure what matters: replanning latency, decision quality, and value realization, not milestones. When one workflow senses, decides, and acts faster, you buy the blueprint for the rest. Next, let's turn these ideas into action with Action Planning: From Assessment to Measurable Improvement.
 kpmg.comkpmg.comefeso.com+22 min
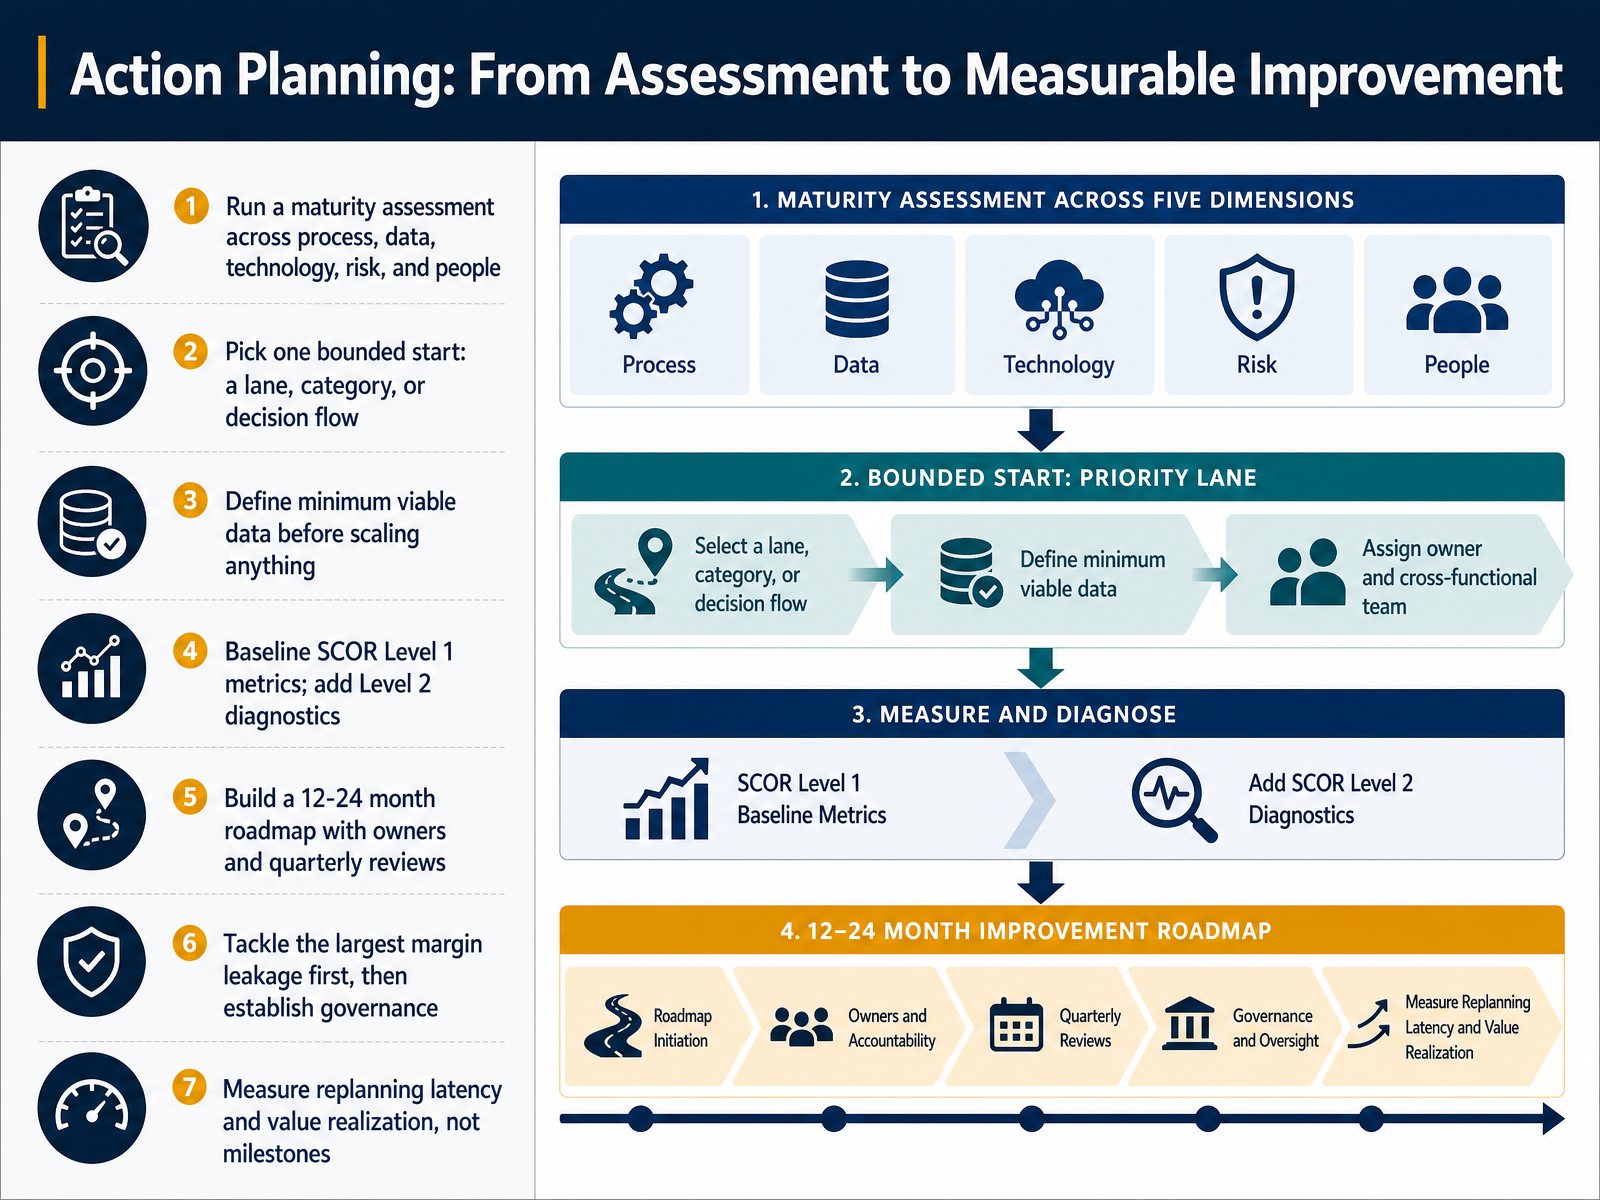
 - 14Action Planning: From Assessment to Measurable ImprovementLet's close with an action plan that actually moves the needle. First, run a maturity assessment across five dimensions: process, data, technology, risk, and people. That tells you where you stand before you spend a dollar. Next, pick one bounded start. One lane, one category, one decision flow. Not the whole network. Now define your minimum viable data before you scale anything. And baseline your SCOR Level 1 metrics first, then add Level 2 diagnostics to find root causes. Build a twelve to twenty-four month roadmap with named owners and quarterly reviews. Tackle the largest margin leakage first, then establish governance. And measure replanning latency and value realization, not milestones. That last point matters most. So here's your takeaway: start small, baseline honestly, and prove value fast. Thank you for your focus and engagement. You now have the framework, the discipline, and the tools to turn assessment into measurable improvement. Go make it happen.
 kpmg.comkpmg.comefeso.com+22 min
Take the deck with you
Download this course as a file — free, no sign-up needed.
- PDF handoutEvery slide page, ready to print or share.15 pages · 4.4 MBDownload
- Narrated PowerPointThe deck that presents itself — every slide carries the digital human's narration video.15 pages · 31.8 MBDownload
- PowerPoint slidesThe full deck as a .pptx — open it in PowerPoint, Keynote, or Google Slides.15 pages · 4.2 MBDownload
Free to use in your own training — please keep the PersonWise credit page at the end.
Have your own deck? Turn it into a course
Sources consulted
Web sources consulted while building this course.
- Supply Chain Trends 2026 | What Leaders Need to Prepare For — kpmg.com
- KPMG 2026 US Supply Chain Survey: Key Findings | KPMG — kpmg.com
- Global Supply Chain Survey 2026: How Resilience Drives Performance | EFESO Management Consultants — efeso.com
- The 2026 Supply Chain Risk Report — sphera.com
- Supply Chain Compass 2026 — edge.sitecorecloud.io
- SCOR Model — scor.ascm.org
- SCOR Digital — scor.ascm.org
- SCOR Digital Standard — ascm.org
- For Immediate Release: — ascm.org
- Measuring Supply Chain Performance as SCOR v13.0-Based in Disruptive Technology Era: Scale Development and Validation — ideas.repec.org
- Responsible procurement 2026: supplier ESG clauses — hayot-expertise.fr
- A CATALYST FOR SUSTAINABLE GROWTH & RESILIENCE — globalcompact.at
- ESG Supply Chain Compliance 2026: Requirements & Strategy — voiceofenvironment.com
- ERP Supplier Risk 2026: Scoring, CSDDD Compliance & Monitoring — erpimplementation.eu
- ESG Compliance 2026: EU Rules Reshaping Global Procurement — industrialarbitrage.com
- The final frontier: Navigating the last-mile paradox in 2026 - Supply Chain Management Review — scmr.com
- The 2026 last-mile delivery outlook for US retailers — shopappy.com
- 2026 Home Delivery Survey | AlixPartners — alixpartners.com
- Last Mile Delivery Trends 2026: Costs, Carrier Strategy, and Network Optimization — supplychain360.io
- How to Build a Last-Mile Delivery Strategy That Cuts Costs in 2026 – Ecommerce Times — ecommerce-times.com