SQL Database Monitoring Workflow Design
Begin
14 pages · ~28 min
SQL Database Monitoring Workflow Design
This training teaches database administrators how to select appropriate SQL monitoring tools and design effective monitoring workflows to optimize database performance and reliability.
What you’ll learn
- 01SQL Database Monitoring Tools: Selection and Workflow DesignWelcome. If you are responsible for keeping SQL databases running in production, you know that monitoring is not a side task. It is the foundation for incident response, query diagnostics, and infrastructure trust. Over the next few modules, we are going to treat tool selection and workflow design as one problem, because in practice they can never be separated. We will build a shared vocabulary for the signals that matter. We will map the landscape of tools, from engine-native views like PostgreSQL's cumulative statistics or SQL Server's Query Store, to full observability platforms. Then we will apply a selection framework based on your operational priorities, not vendor checklists. We will also cover cost control and workflow design so that your monitoring stack stays sustainable at scale. Expect concrete trade-offs and real scenarios throughout. By the end, you should be able to design a monitoring posture that supports rapid triage and long-term reliability. Let's get started. First, we need to align on what we mean by monitoring, observability, and telemetry, because that distinction drives every decision we will make.postgresql.orglearn.microsoft.comdev.mysql.com+22 min
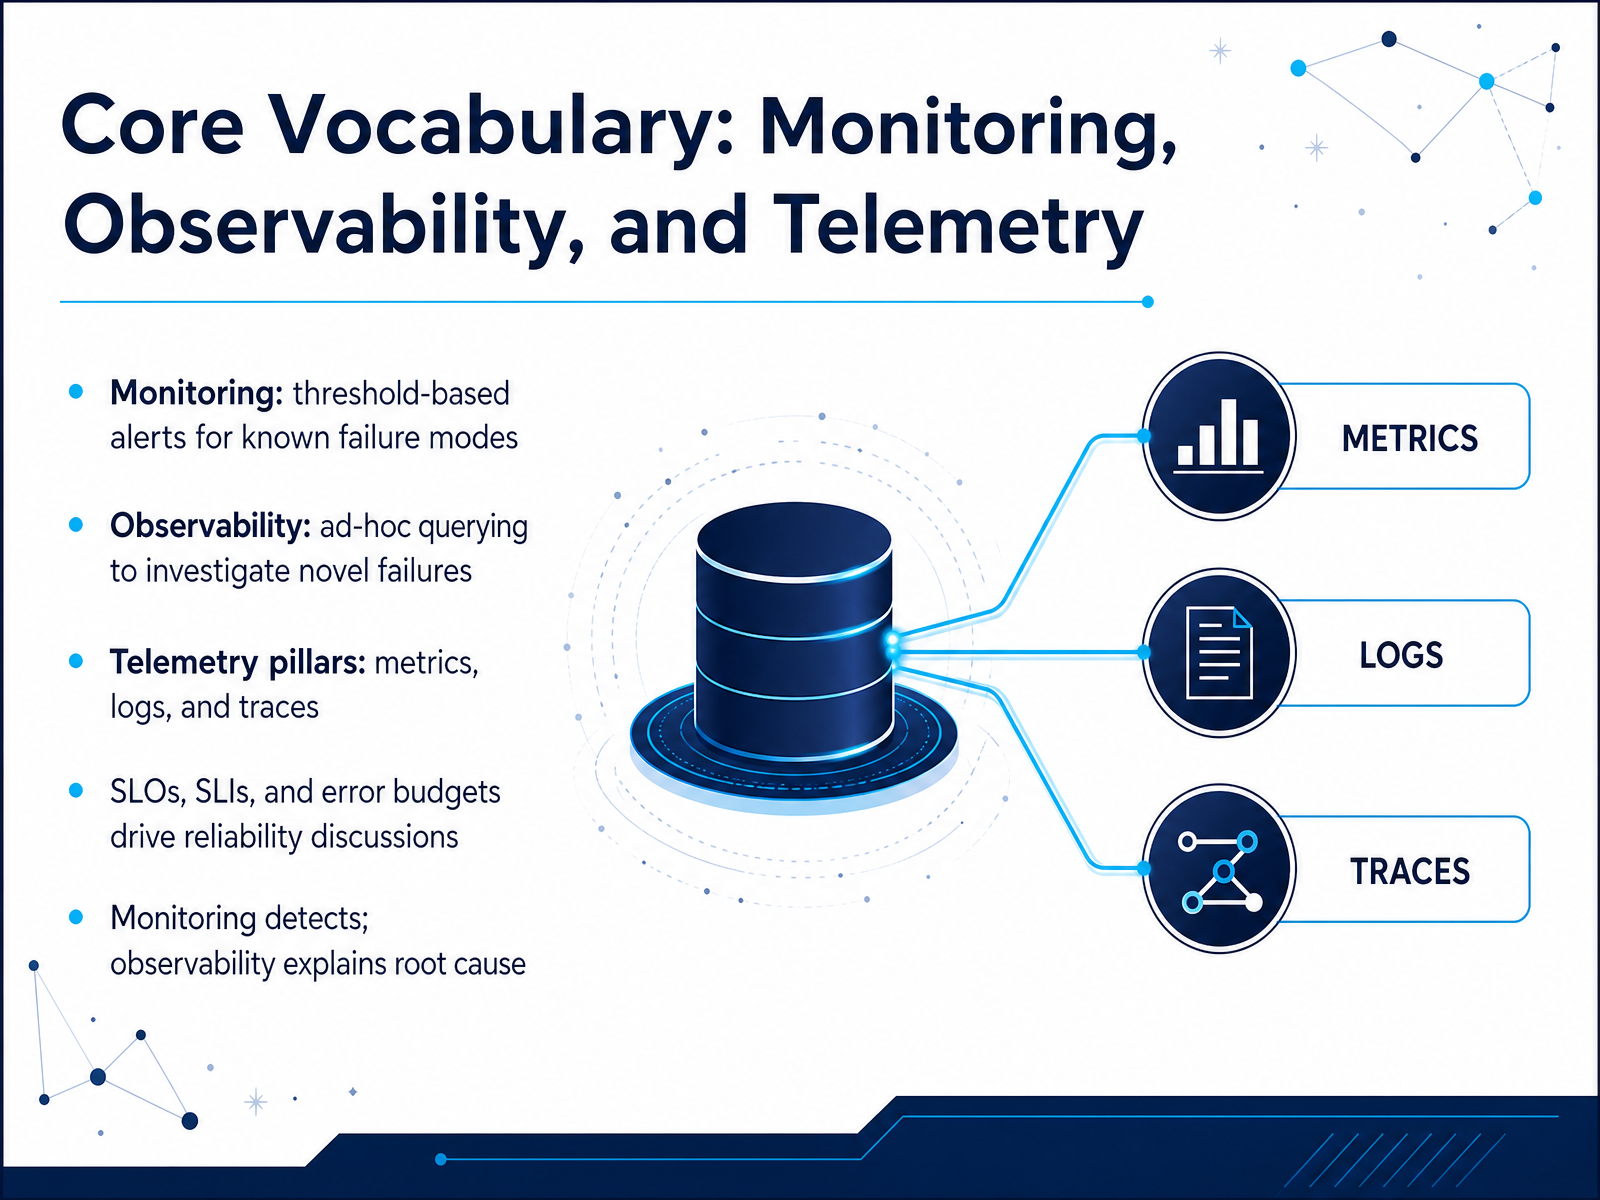
- 02Core Vocabulary: Monitoring, Observability, and TelemetryLet's anchor ourselves in the core terminology, because precision here directly shapes your operational workflows. Monitoring is threshold-based alerting for known failure modes, like paging a DBA when connection counts spike above ninety percent of the limit. It detects that something is wrong, effectively. Observability, on the other hand, enables ad-hoc querying to investigate novel failures. It answers why a specific query plan regressed, allowing you to correlate a latency spike with a specific table lock or a slow query log. This capability relies on telemetry from three pillars: metrics, logs, and traces. Metrics give you quantified measurements like query latency and cache hit ratios. Logs provide time-stamped event narratives, and traces follow a query’s full path across nodes and services. To frame these in reliability terms, SLOs and SLIs define your targets, while error budgets quantify acceptable failure windows, creating space for deliberate change. The practical distinction is simple: monitoring is your smoke alarm, observability is your structural engineer. Monitoring tells you the building is on fire, and observability points to the faulty wiring. Combined, they cover known issues and unknown unknowns. We will now examine which components of your SQL environments demand this level of instrumentation the most.
 milvus.iosixta.ainavicat.com+22 min
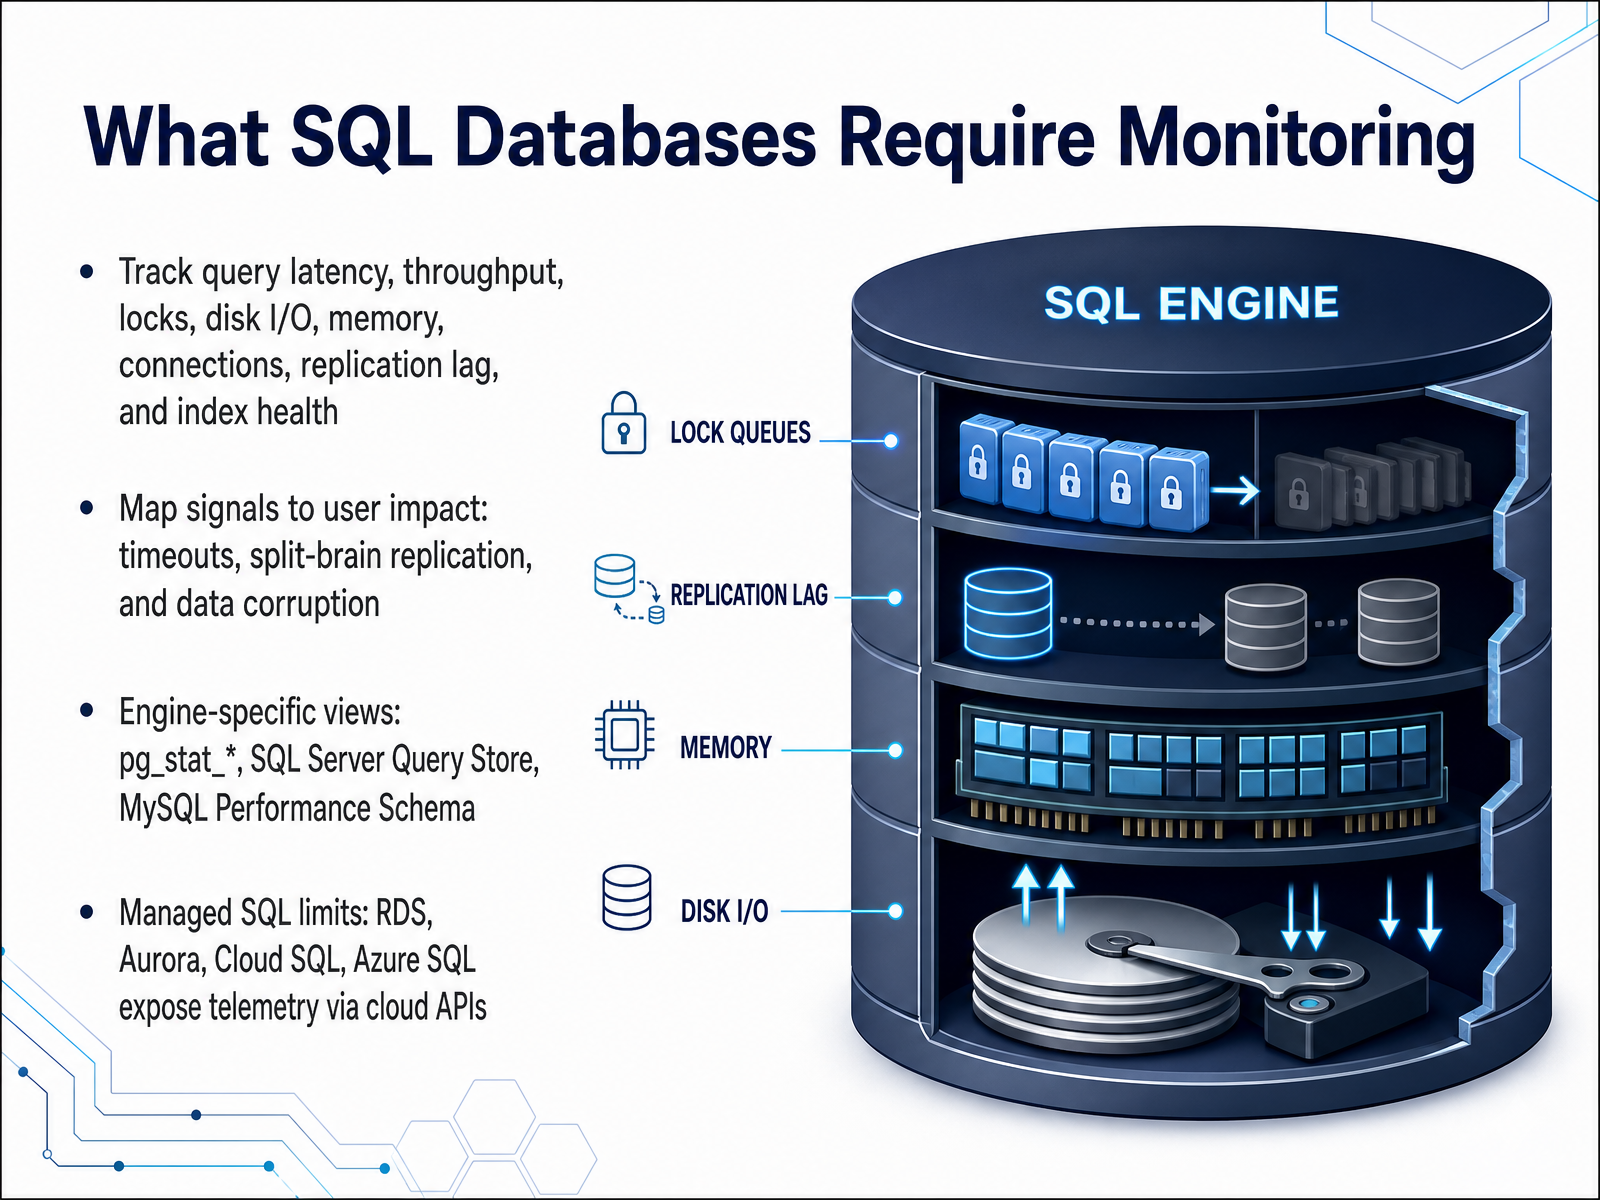
 - 03What SQL Databases Require MonitoringNow let's pin down what SQL databases actually require monitoring. The core signals are query latency and throughput, lock contention, disk I/O, memory pressure, connection counts, replication lag, and index health. But the key is mapping each signal to real user impact. A latency spike might mean timeouts for your application. Replication lag that goes unchecked can lead to split-brain scenarios or data corruption. So context matters as much as the metric itself. Each engine gives you native views to work with. PostgreSQL exposes the pg_stat set of views. SQL Server has its Query Store. MySQL provides the Performance Schema. Make sure you're comfortable pulling from these sources. And if you're on a managed platform like RDS, Aurora, Cloud SQL, or Azure SQL, remember that you are often limited to telemetry exposed through cloud APIs. You don't get direct OS-level access, so plan your monitoring strategy around what those APIs can deliver. Now that we know what to watch, the next question is which tool categories fit those needs in the 2026 landscape.
 postgresql.orglearn.microsoft.comdev.mysql.com+21 min
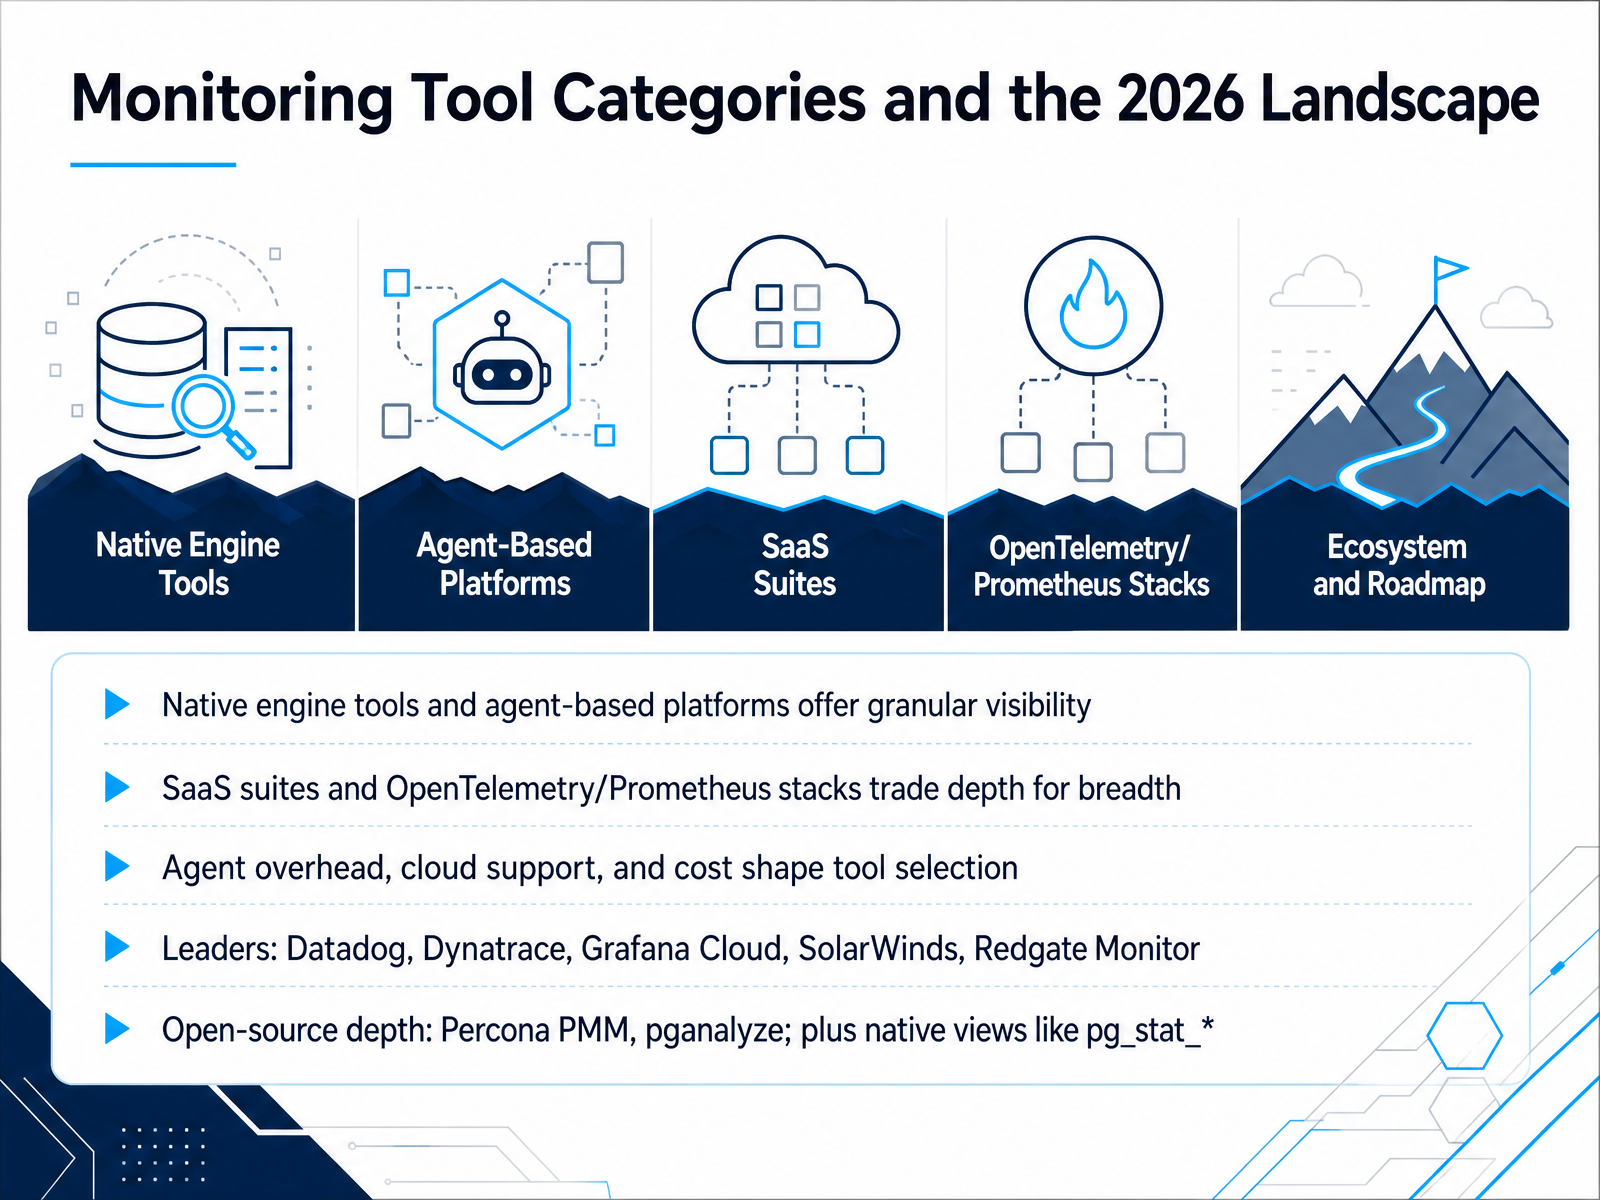
 - 04Monitoring Tool Categories and the 2026 LandscapeLet's map the monitoring tool landscape as it stands in 2026. The market splits into two broad camps. Native engine tools and agent-based platforms, like Redgate Monitor or Percona PMM, give you granular visibility into query plans, waits, and blocking chains. They trade breadth for depth. On the other side, SaaS observability suites such as Datadog, Dynatrace, and Grafana Cloud connect database telemetry to your application and infrastructure signals. That cross-stack correlation is invaluable during incident response. But agent overhead, cloud support, and cost models shape your decision just as much as feature depth. If you are already paying for Datadog across your stack, extending to the database is natural, but watch host-based pricing. For SQL Server and PostgreSQL specialists, Redgate Monitor remains the gold standard for diagnostics. Grafana Cloud gives OpenTelemetry-native teams a strong middle path. For open-source depth, Percona PMM is free but you own the infrastructure, and pganalyze is unmatched for PostgreSQL query analysis. Do not overlook native views like pg_stat_statements; sometimes the quickest path to answers sits inside the engine itself. The right tool balances diagnostic depth against operational fit. Next, let's turn that into a repeatable selection framework with concrete evaluation criteria.
 parseable.comgitnux.orgtop-5-solutions.com+21 min
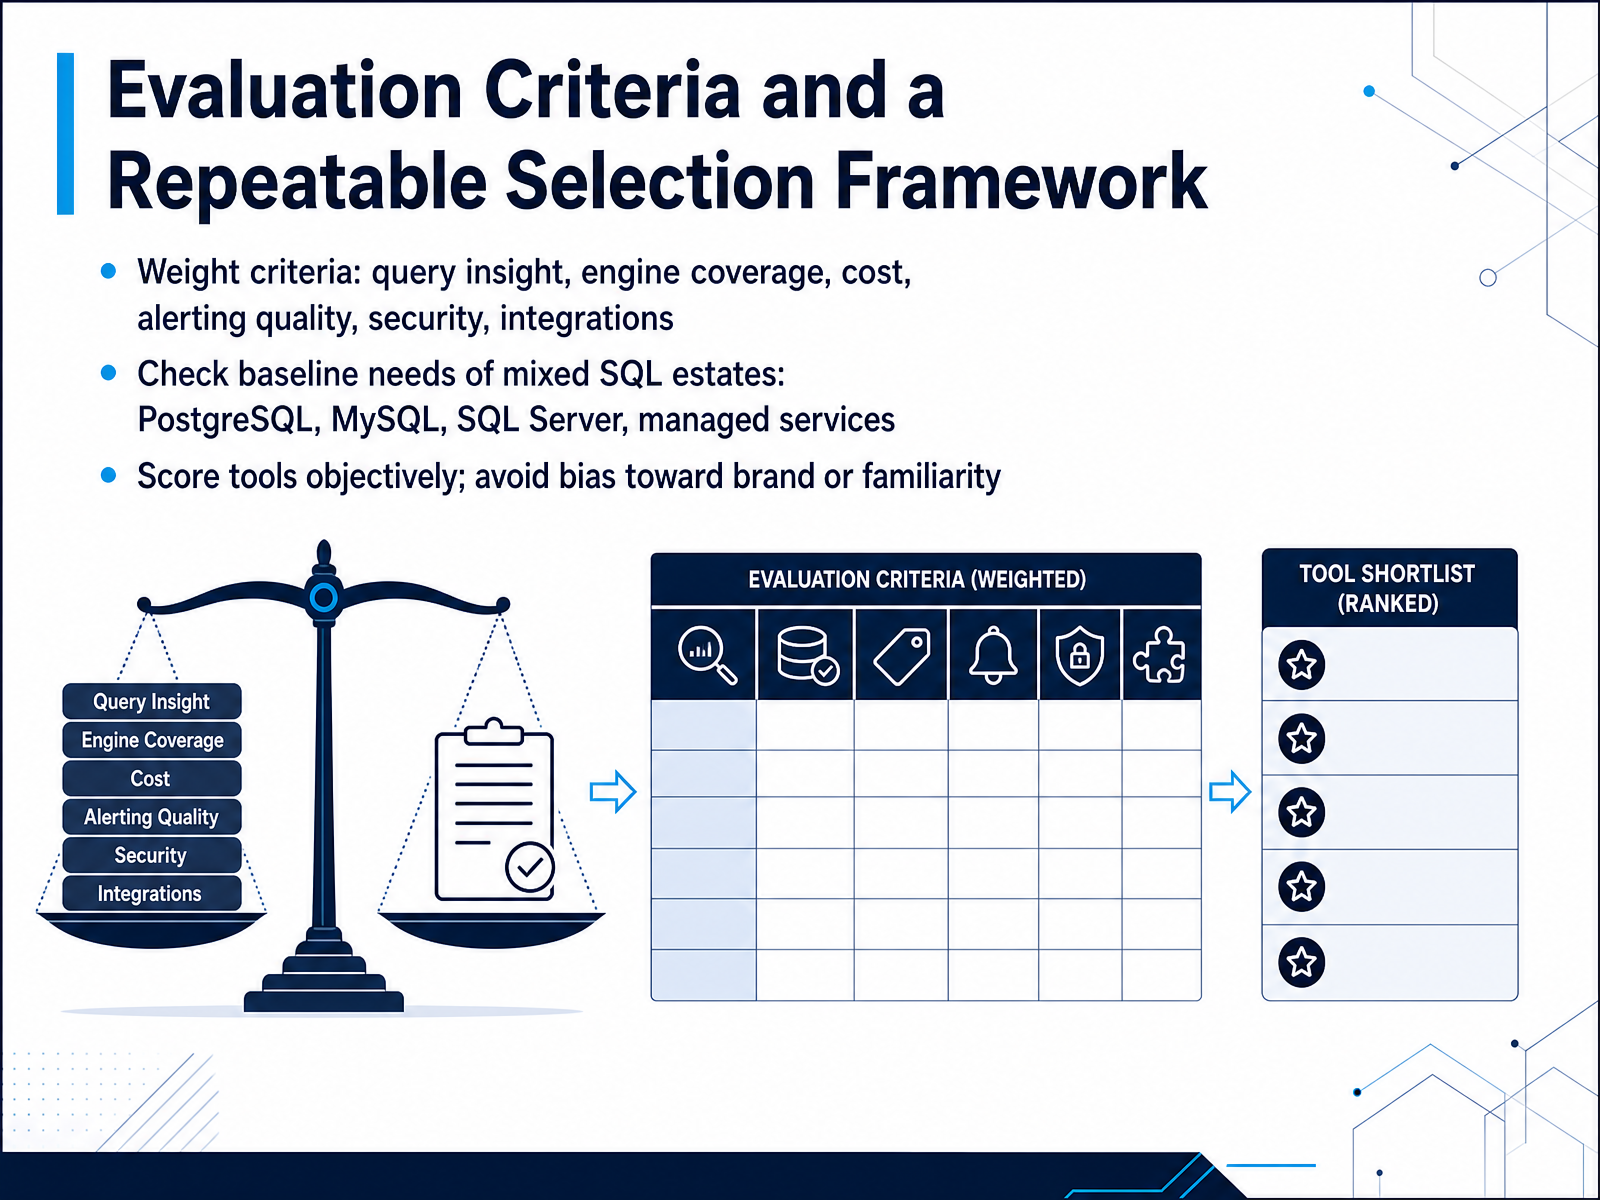
 - 05Evaluation Criteria and a Repeatable Selection FrameworkLet’s move into the evaluation criteria and a repeatable selection framework. Start by weighting what matters most for your environment. Query insight should top the list — execution plans, wait states, and plan regressions matter far more than dashboard aesthetics. Engine coverage, alerting quality, security, integrations, and total cost follow. Ask every stakeholder to assign weights before you score anything. Then assess your baseline. Most estates run a mix of PostgreSQL, MySQL, SQL Server, and managed services like Aurora or Azure SQL. A tool that’s exceptional for one engine may leave gaps in another. Finally, score tools objectively against those weighted criteria. Resist brand bias or familiarity; a demo environment is not your production reality. Run a proof of concept on your own slow queries and incident patterns. If you’re weighing pganalyze against Datadog, decide whether you need PostgreSQL depth or cross-stack correlation. For a mixed estate, Percona PMM is a strong open-source baseline, while SolarWinds DPA brings consistent wait-time analysis across engines. There is no single right answer, but a disciplined framework will get you to the right one for your team. Next, we’ll architect the monitoring workflow that puts that tool to work.
 parseable.comgitnux.orgtop-5-solutions.com+22 min
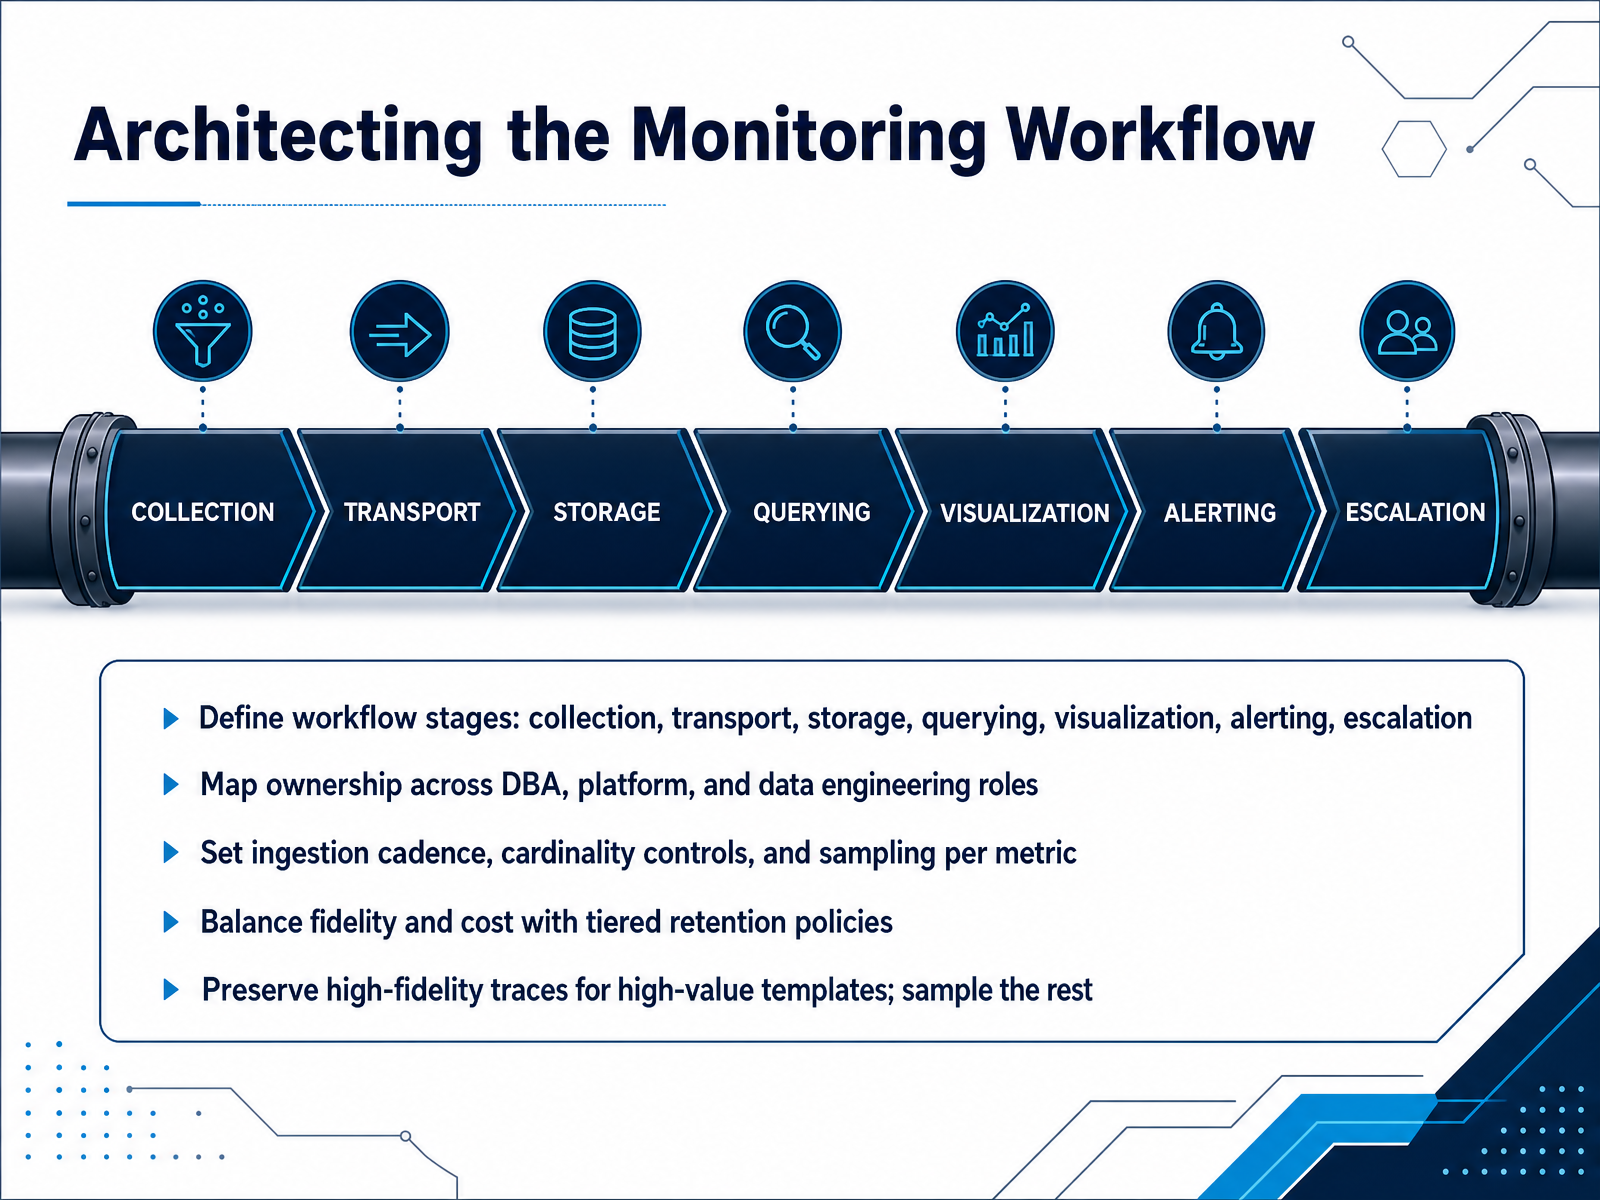
 - 06Architecting the Monitoring WorkflowLet's move into architecting the monitoring workflow itself. The key is to think of it as a pipeline, not a collection of dashboards. Start with collection, then transport, storage, querying, visualization, alerting, and finally escalation. Each stage needs a clear owner. DBAs typically own query-level detail and alert tuning, platform engineers handle transport and storage, and data engineers define the cardinality and sampling rules. Speaking of which, set your ingestion cadence per metric type. Business-critical write paths might need ten-second granularity, while stable dev instances can sit at sixty seconds and still give you the trend lines you need. And remember, cardinality controls are your friend. High-cardinality dimensions can balloon storage costs fast. This is where tiered retention comes in. Keep high-fidelity traces for your high-value query templates, the ones tied to revenue or core SLAs, and sample everything else aggressively. That balances diagnostic power against cost. And when in doubt, baseline before you alert. Two to four weeks of normal data makes your thresholds meaningful. So, in short, map each stage to an owner, tune granularity by criticality, and preserve fidelity only where it earns its keep. With that pipeline defined, next we can talk about designing alerts for SLOs, not noise.
 cloudzero.comqueries.clouddatabricks.cloud+21 min
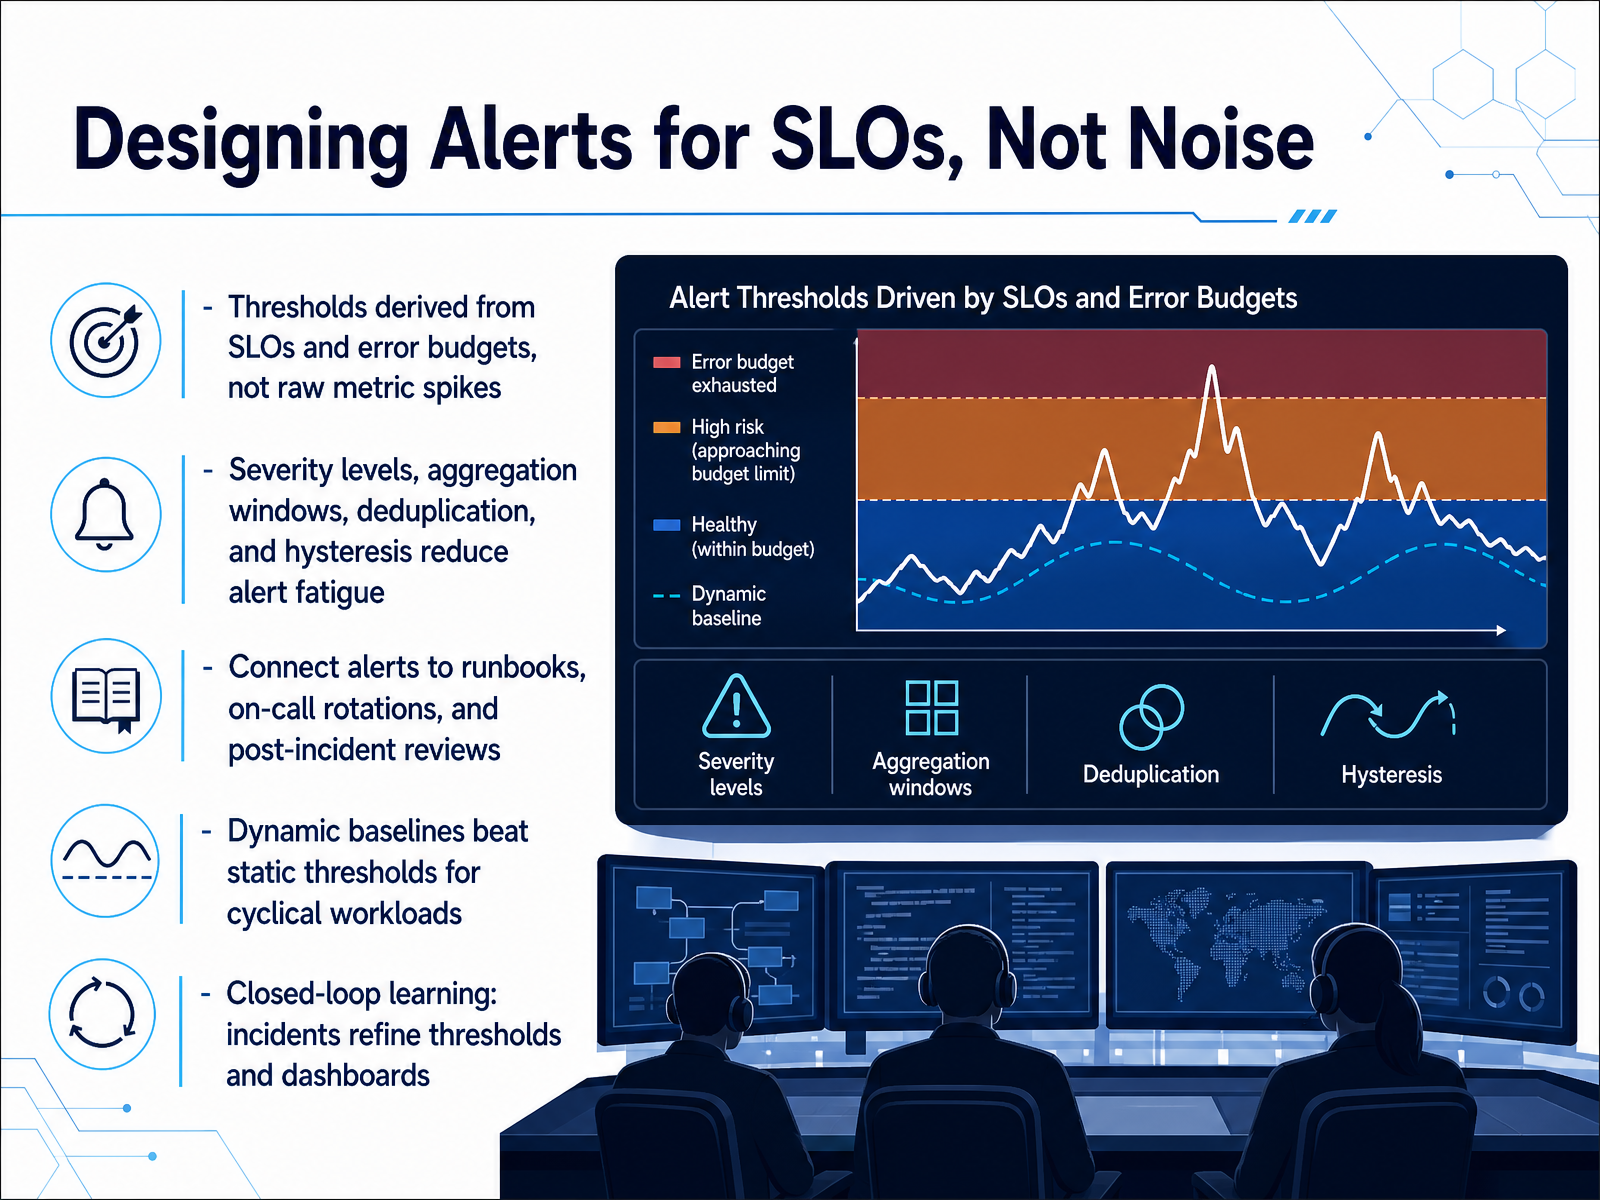
 - 07Designing Alerts for SLOs, Not NoiseLet's move to alert design. The goal is to build alerts that mean something operationally, not just alarms that fire at three a.m. for a spike that self-resolves. Start with thresholds derived from your SLOs and error budgets. If your budget allows forty minutes of downtime a month, an alert that pages someone should reflect meaningful budget consumption over an aggregation window, not a five-minute CPU blip. Severity levels, deduplication, and hysteresis all exist to filter noise. Hysteresis, requiring the metric to recover and stay recovered, prevents flapping. For cyclical workloads, like end-of-month reporting or nightly batch jobs, static thresholds are a liability. Dynamic baselines that learn from rolling historical patterns will outperform fixed numbers every time. Every alert you create needs a runbook behind it, an owner in the on-call rotation, and a place in your post-incident review. If an alert fires and no one knows what to do, you have not designed an alert, you have designed a distraction. And finally, close the loop. Every incident should inform your thresholds and your dashboards. If a page was a false positive, tune it. If a real problem went undetected, add coverage. SLO-based alerting is a feedback system, not a one-time configuration. Keep it honest, and your on-call team will trust it. Up next, we'll cover security, compliance, and access controls for your telemetry pipeline.
 milvus.iosixta.ainavicat.com+22 min
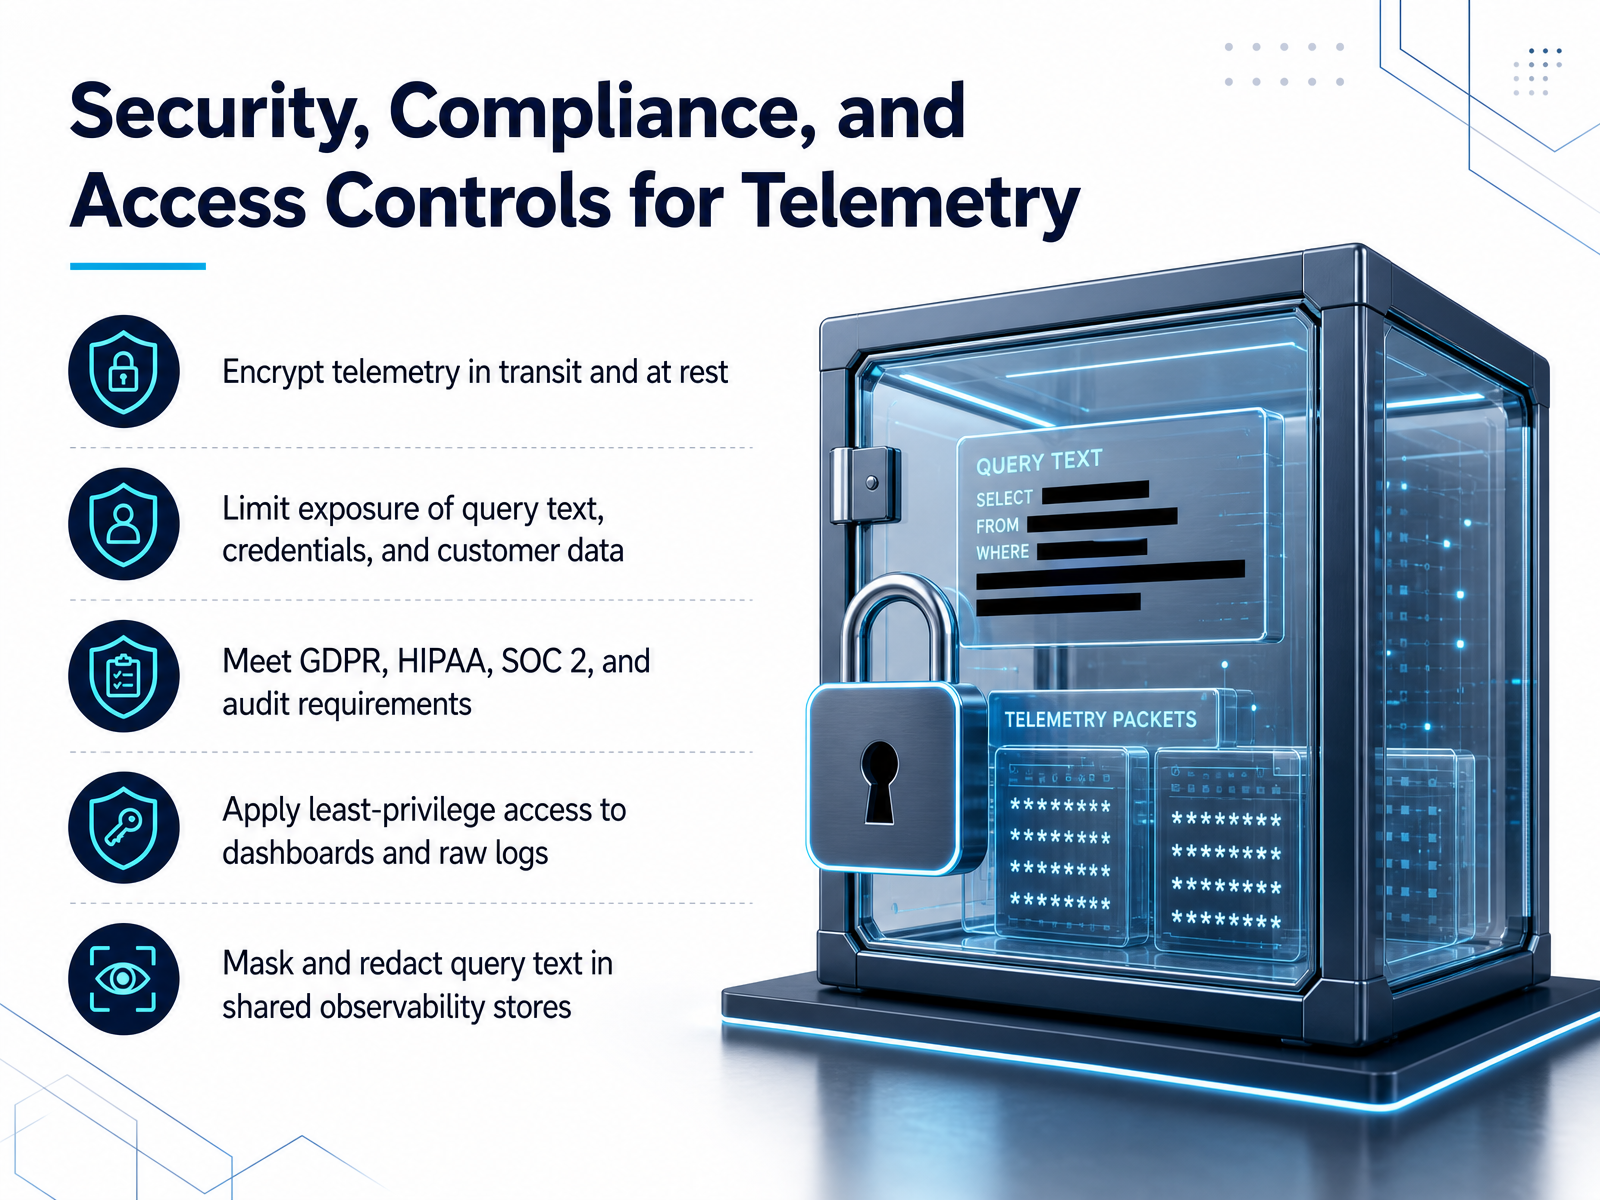
 - 08Security, Compliance, and Access Controls for TelemetryNow let's talk about securing our telemetry pipeline, because observability data is sensitive by nature. First, encrypt everything, both in transit and at rest. That's non-negotiable. Next, limit exposure. Query text can contain credentials or customer data, so we need strict access controls on both dashboards and raw logs. Apply least-privilege access consistently, and mask or redact query text in shared observability stores. This is also critical for compliance. Think GDPR, HIPAA, SOC 2. Audit requirements demand that we know who accessed what, and when. So build this into your design from day one, not as an afterthought. A quick example: if you're sending slow query logs to a central SIEM, make sure the ingestion pipeline strips out any PII before it lands. And remember, encryption and access controls are not just security best practices; they're what keep your monitoring data from becoming the next breach headline. Up next, we'll walk through the implementation and rollout strategy.
 cloudzero.comqueries.clouddatabricks.cloud+21 min
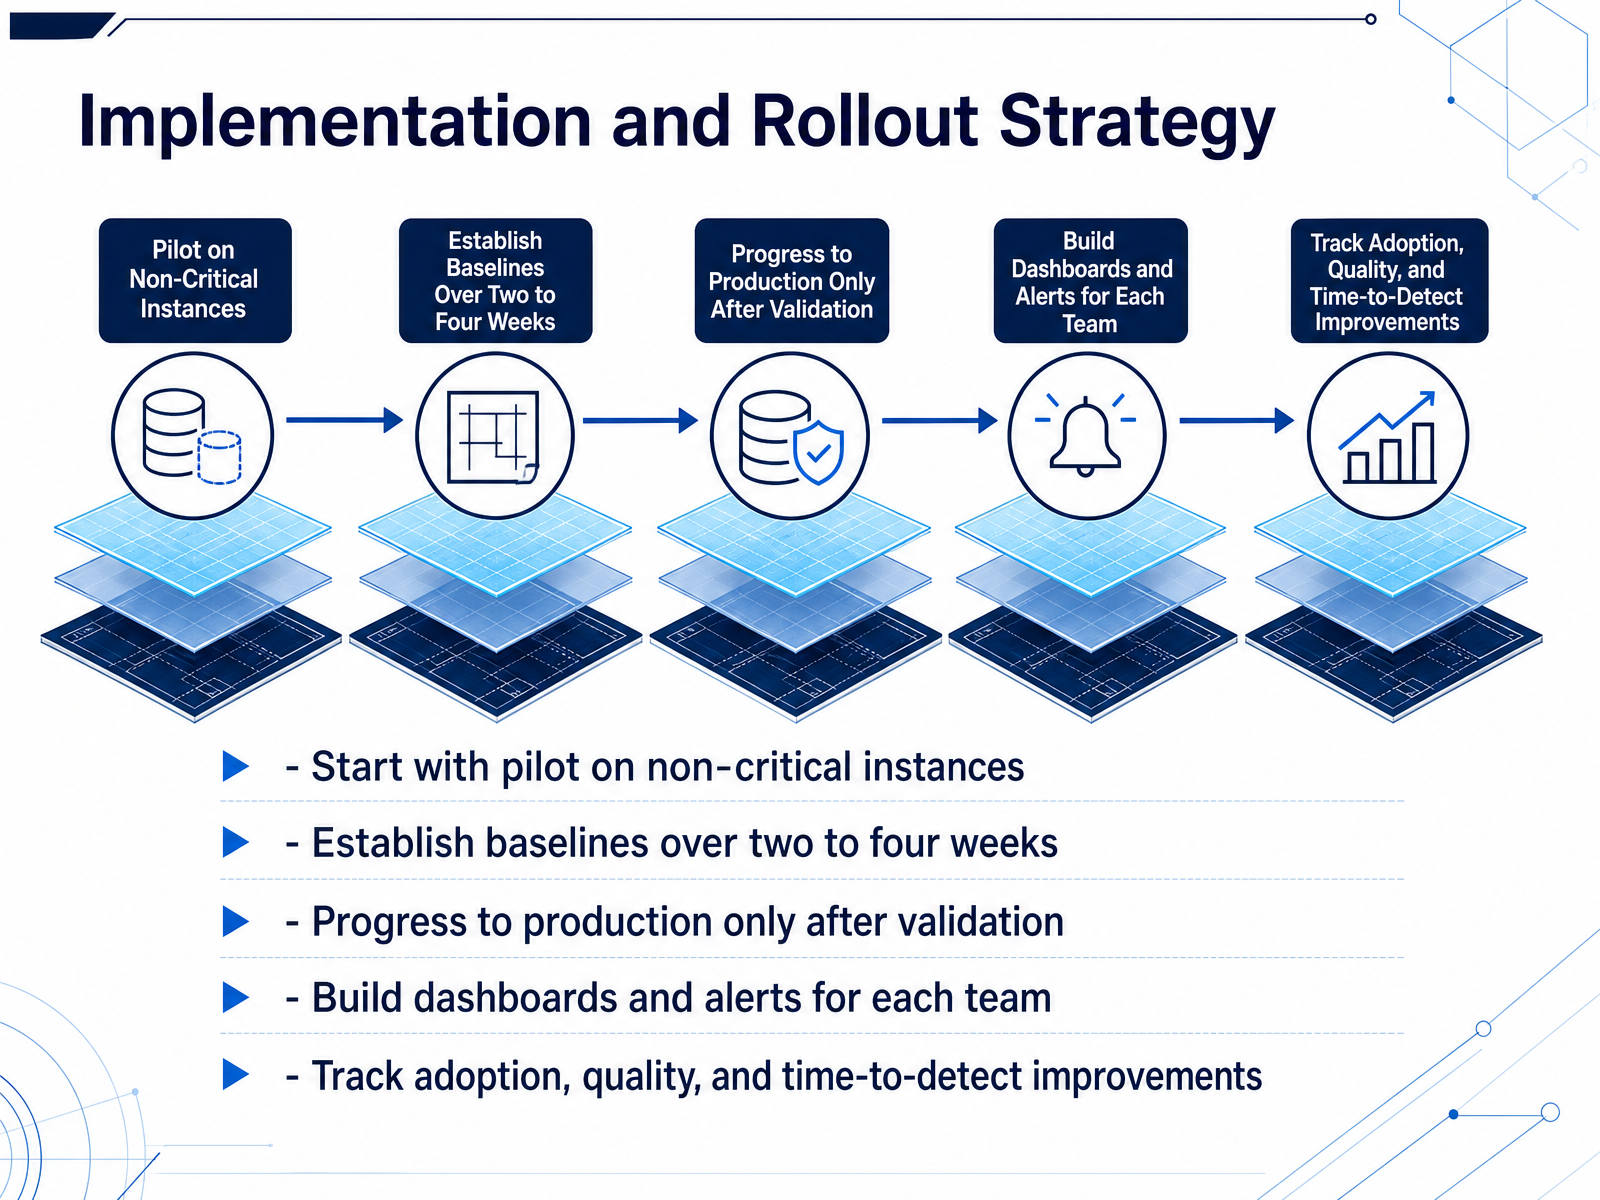
 - 09Implementation and Rollout StrategyNow let’s talk about rollout, because even the best tool fails if the deployment is rushed. Start with a pilot on non-critical instances. Pick a staging environment or a low-traffic replica where mistakes are cheap. Run it for two to four weeks to establish baselines. That’s your normal—latency, throughput, connection counts, error rates. You can’t set meaningful alerts until you know what normal looks like. Only after validation do you move to production. Then, build dashboards and alerts with each team, not for them. Involve them early so the metrics match their operational reality. Finally, track adoption, alert quality, and time-to-detect improvements. Measure whether incidents surface faster and whether teams actually use the tool. One caution: baseline before you alert. Absolute thresholds age badly as workloads shift. Deviation from baseline is your real signal. This phased approach keeps risk low and buy-in high. Next, we’ll tackle cost control and cardinality management.
 cloudzero.comqueries.clouddatabricks.cloud+22 min
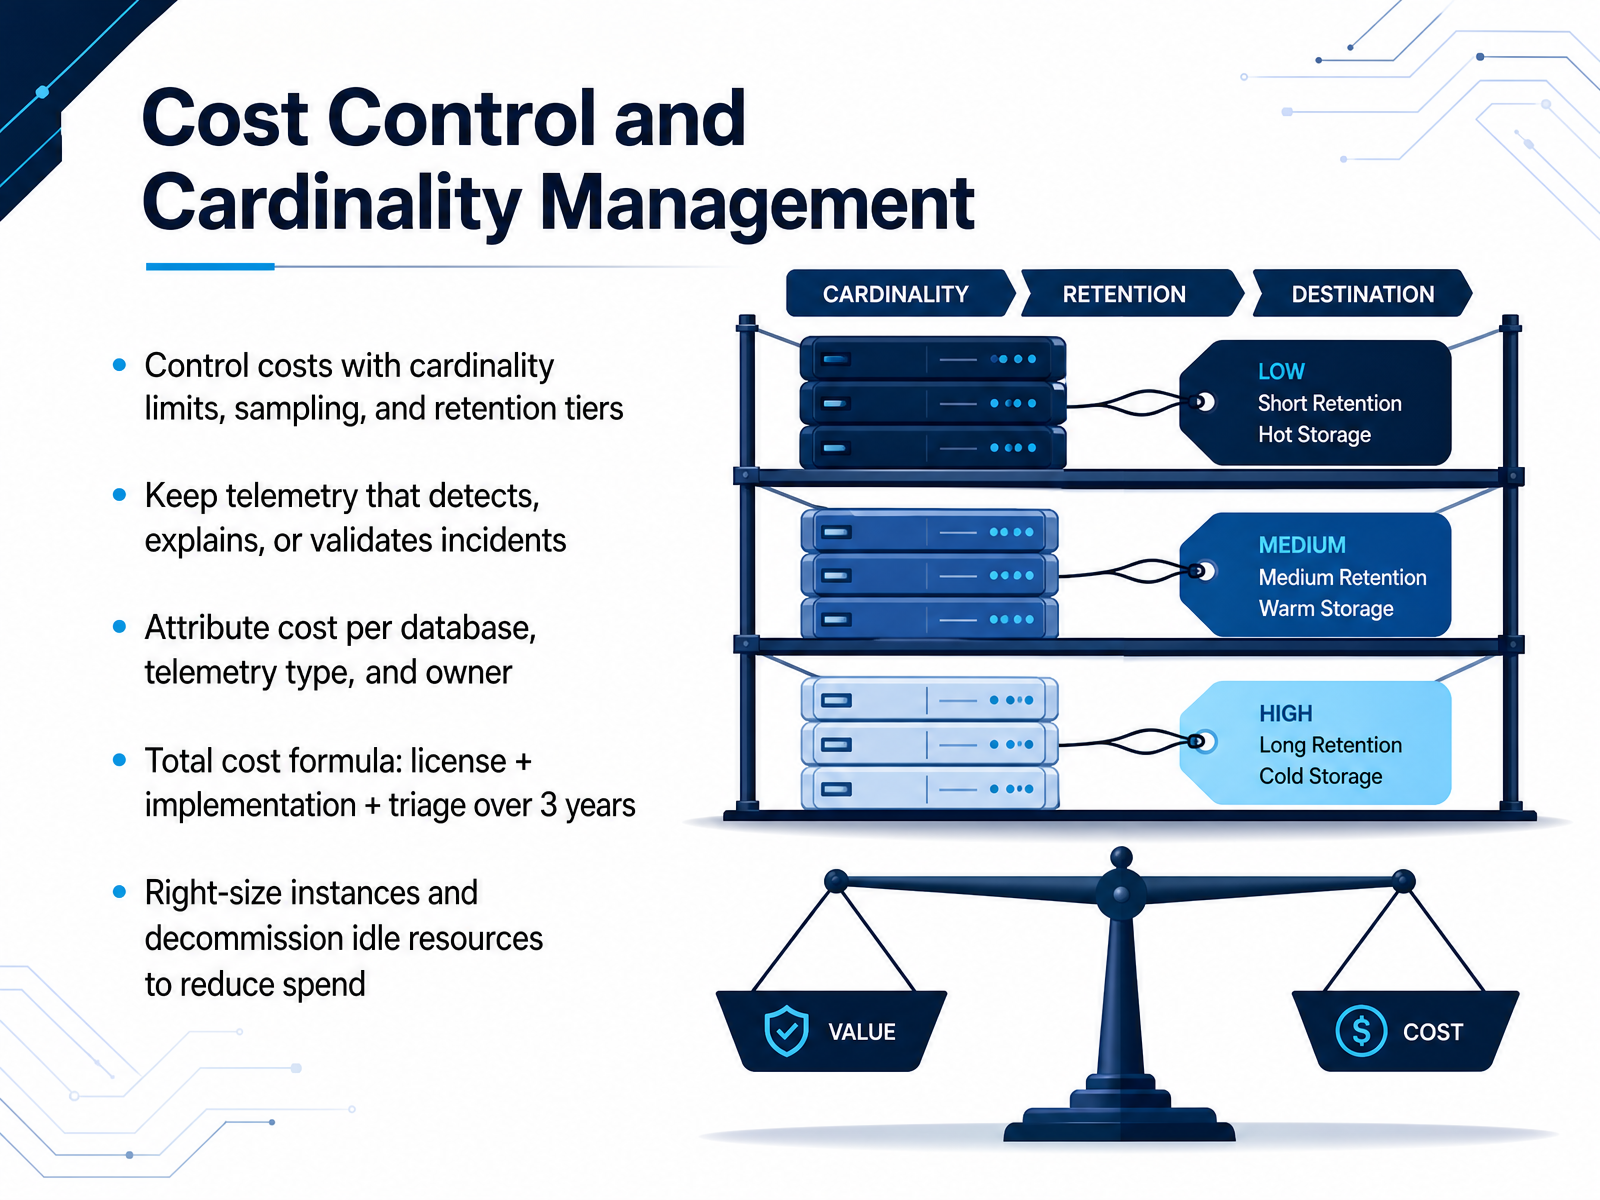
 - 10Cost Control and Cardinality ManagementNow let’s talk about cost control and cardinality management. This is where monitoring strategies often break down — not because of technical limits, but because of uncontrolled telemetry volume. The solution is to constrain cardinality from the start. Apply limits on high-dimensional data, use sampling for lower-priority paths, and tier your retention so that raw detail lives only where it earns its keep. A good rule of thumb: keep telemetry that detects, explains, or validates incidents. Everything else is a candidate for reduction. You should also tag your telemetry by database, type, and owner from day one. That gives you clean cost attribution, which turns vague budgets into actionable conversations. When you evaluate tools, don't compare list prices alone. Run the total cost formula over three years: license, implementation, and triage effort. Open-source often wins on license but can quietly lose on engineering time. Metrics are only part of the equation. Remember to right-size instances and decommission idle resources — that's the fastest, most direct lever on spend. So, the practical takeaway: control cardinality, keep only purposeful signals, attribute costs clearly, and model the real multi-year total. Next, we’ll move into operationalizing monitoring — covering dashboards, runbooks, and clear ownership.
 cloudzero.comqueries.clouddatabricks.cloud+22 min
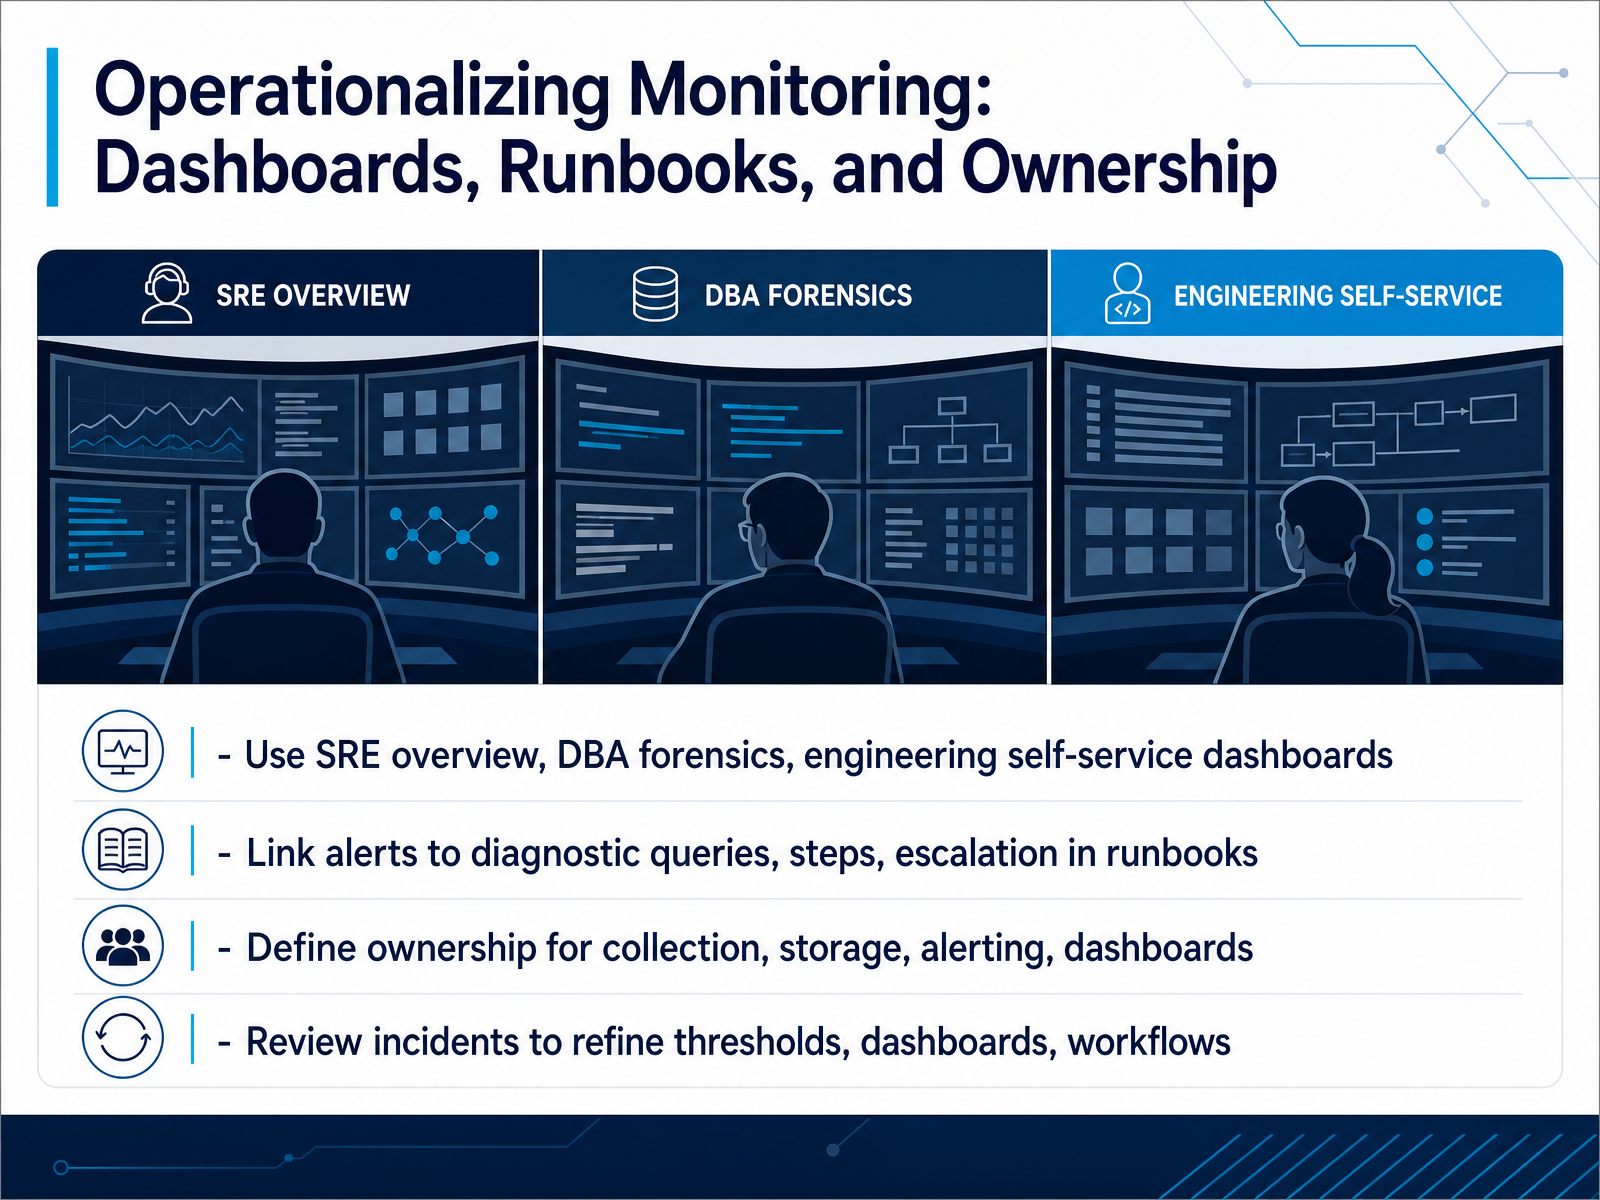
 - 11Operationalizing Monitoring: Dashboards, Runbooks, and OwnershipNow let’s move from tool selection into operationalization—how monitoring actually works day to day. This is where many SQL monitoring projects stall. The fix is to segment your dashboards by audience. You want an SRE overview for service health, a DBA forensics view for deep diagnostics, and a self-service layer for engineering teams. One size fits none. Next, wire alerts to runbooks. An alert that doesn’t link to a diagnostic query, a troubleshooting step, or an escalation path is just noise. The runbook must tell the on-call engineer exactly what to check and who to contact if it gets worse. Ownership is equally critical. Define who owns collection, storage, alerting, and dashboards. If that ownership gets fuzzy, you get duplicate alerts and stale dashboards. After every incident, review what fired and what didn’t, then refine your thresholds and workflows. Your monitoring investment only pays off when the feedback loop is closed. So don’t treat dashboards as the finish line—treat them as the starting point. That ongoing refinement is what sets the stage for the future, and we’ll explore those trends next.
 milvus.iosixta.ainavicat.com+22 min
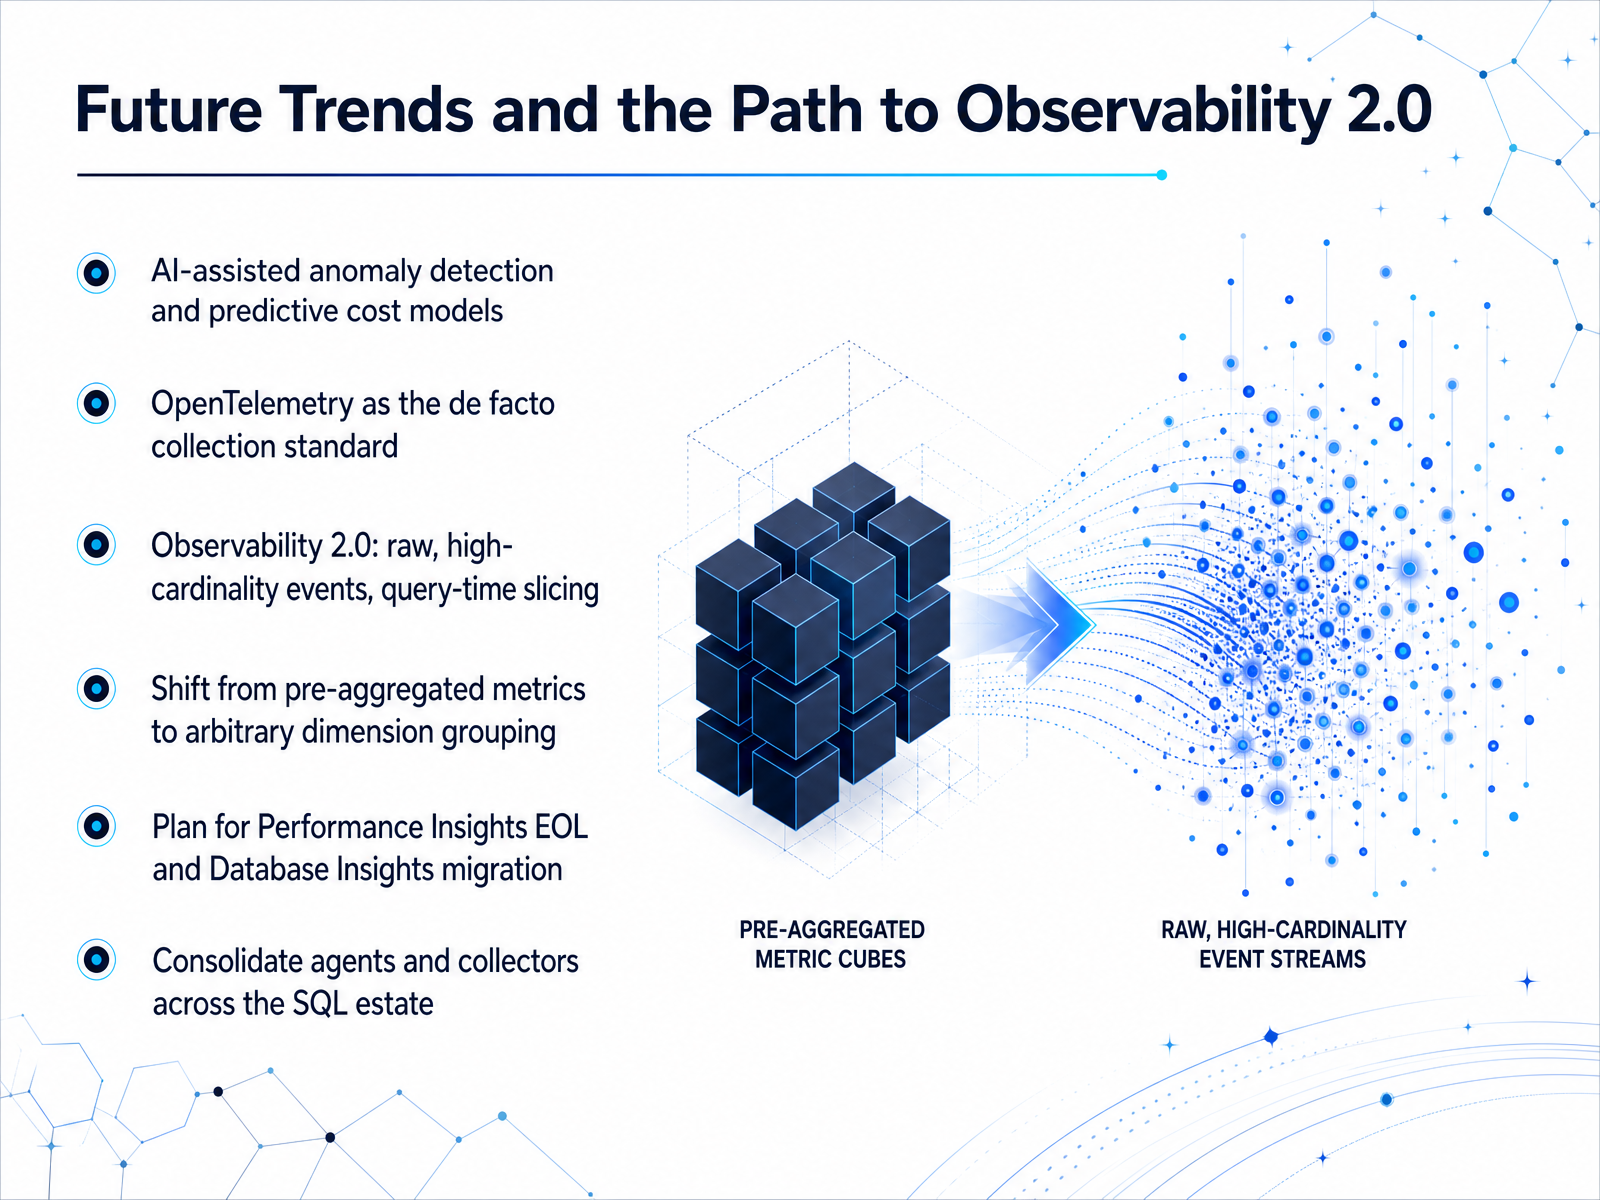
 - 12Future Trends and the Path to Observability 2.0Let's look ahead to where this space is heading, because the decisions you make today need to survive contact with tomorrow. The big shift is Observability 2.0. Instead of pre-aggregated metrics that lock in your questions at write time, we're moving to raw, high-cardinality events. That means you can slice by any dimension at query time. Want to group by query hash, connection pool, and user ID for a specific five-minute window after a deploy? You can, even if you didn't anticipate that question when you instrumented the system. On the intelligence side, AI-assisted anomaly detection and predictive cost models are becoming table stakes, helping you catch spend spikes before they hit the invoice. And OpenTelemetry is solidifying as the de facto collection standard, which makes consolidating agents across your SQL estate a real option. One practical move you need on your radar: plan for the Performance Insights end-of-life on July thirty-first, 2026. You'll need to migrate to CloudWatch Database Insights, so build a dated inventory and validate the full telemetry chain, because the new advanced mode carries its own ingestion and storage costs. The through-line here is to instrument with semantics, not just raw metrics. That sets you up to ask the right questions later. In our next session, we'll put this into practice with a workshop on scoring your current monitoring stack.
 cloudzero.comqueries.clouddatabricks.cloud+22 min
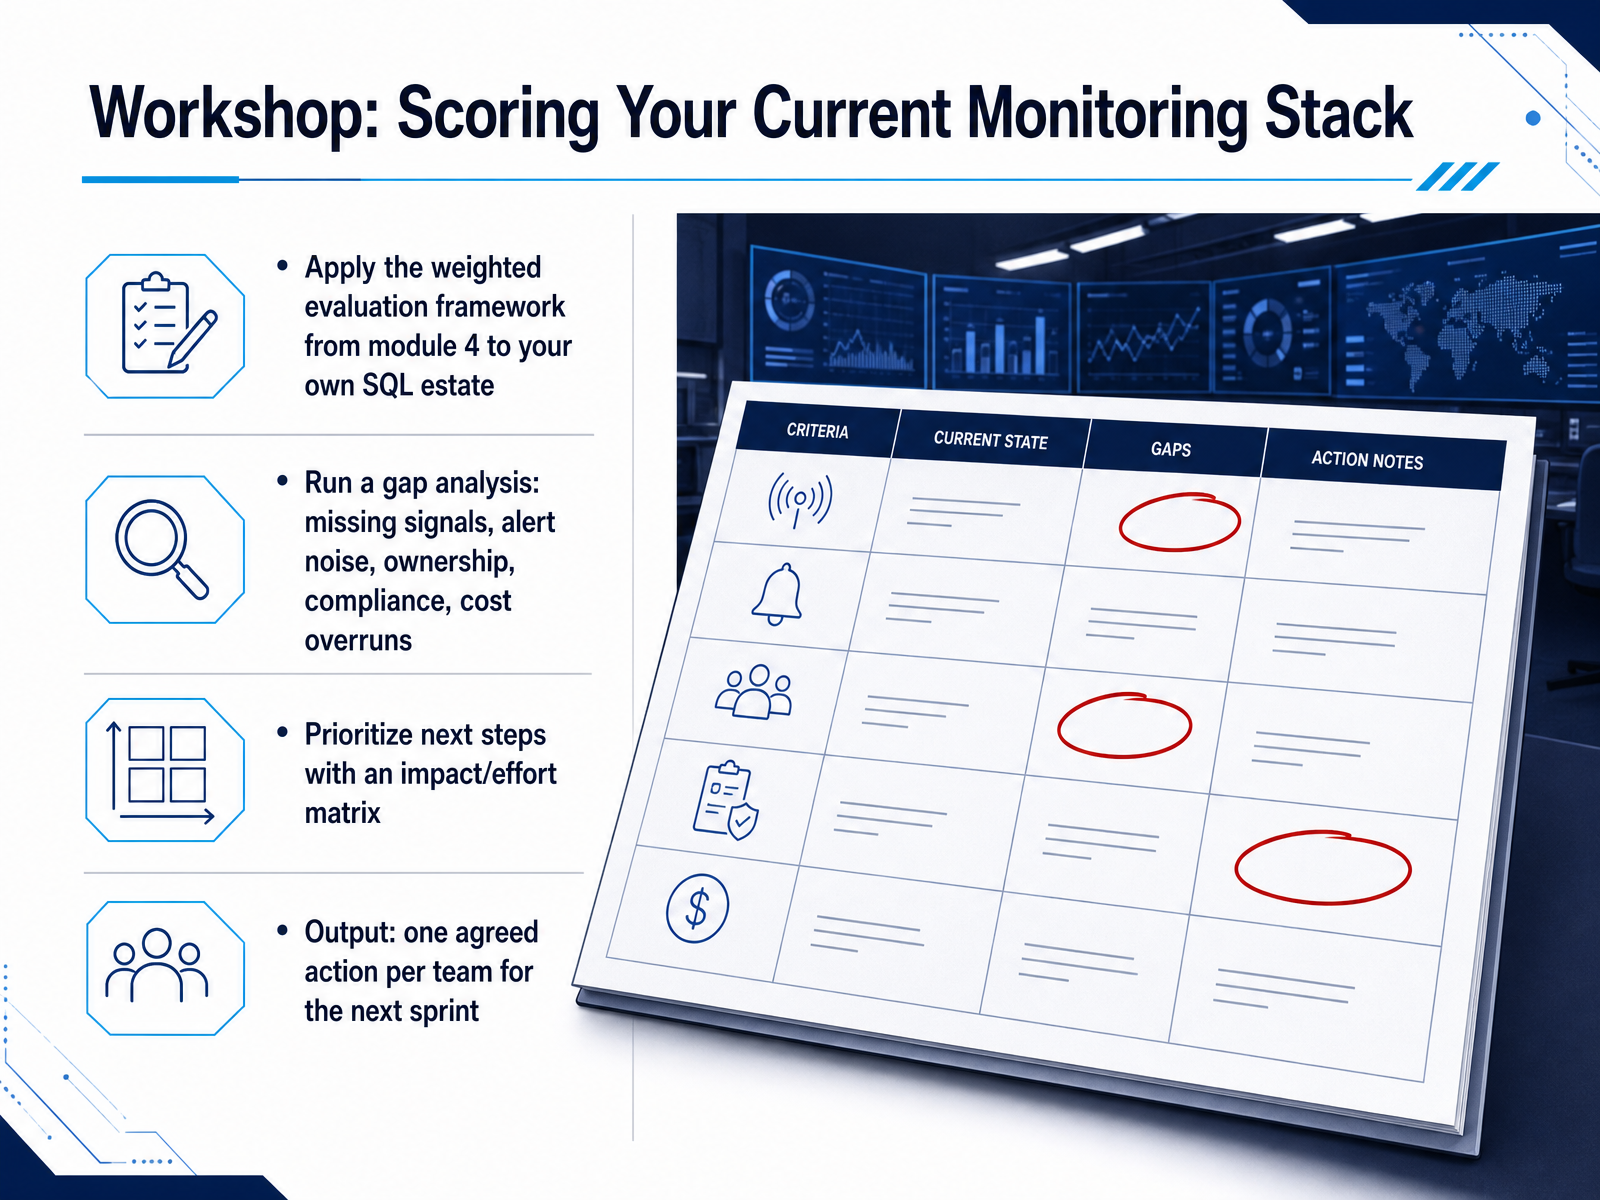
 - 13Workshop: Scoring Your Current Monitoring StackNow it’s time to put this into practice. Let’s score your current monitoring stack. Use the weighted framework we covered earlier and apply it to your own estate. Start with a gap analysis. Where are the missing signals? Where is the alert noise costing your team time? Who actually owns each of the critical dashboards? And are you catching compliance blind spots, or watching cloud spend creep upward? Once you have that picture, map everything on an impact versus effort matrix. Focus your next moves on the high-impact changes that won’t burn your sprint. The output here is one agreed action per team for the next sprint. Nothing more. That keeps the work concrete and the momentum real. Before we close, let’s pull together the key takeaways and the recommended next steps.
 parseable.comgitnux.orgtop-5-solutions.com+21 min
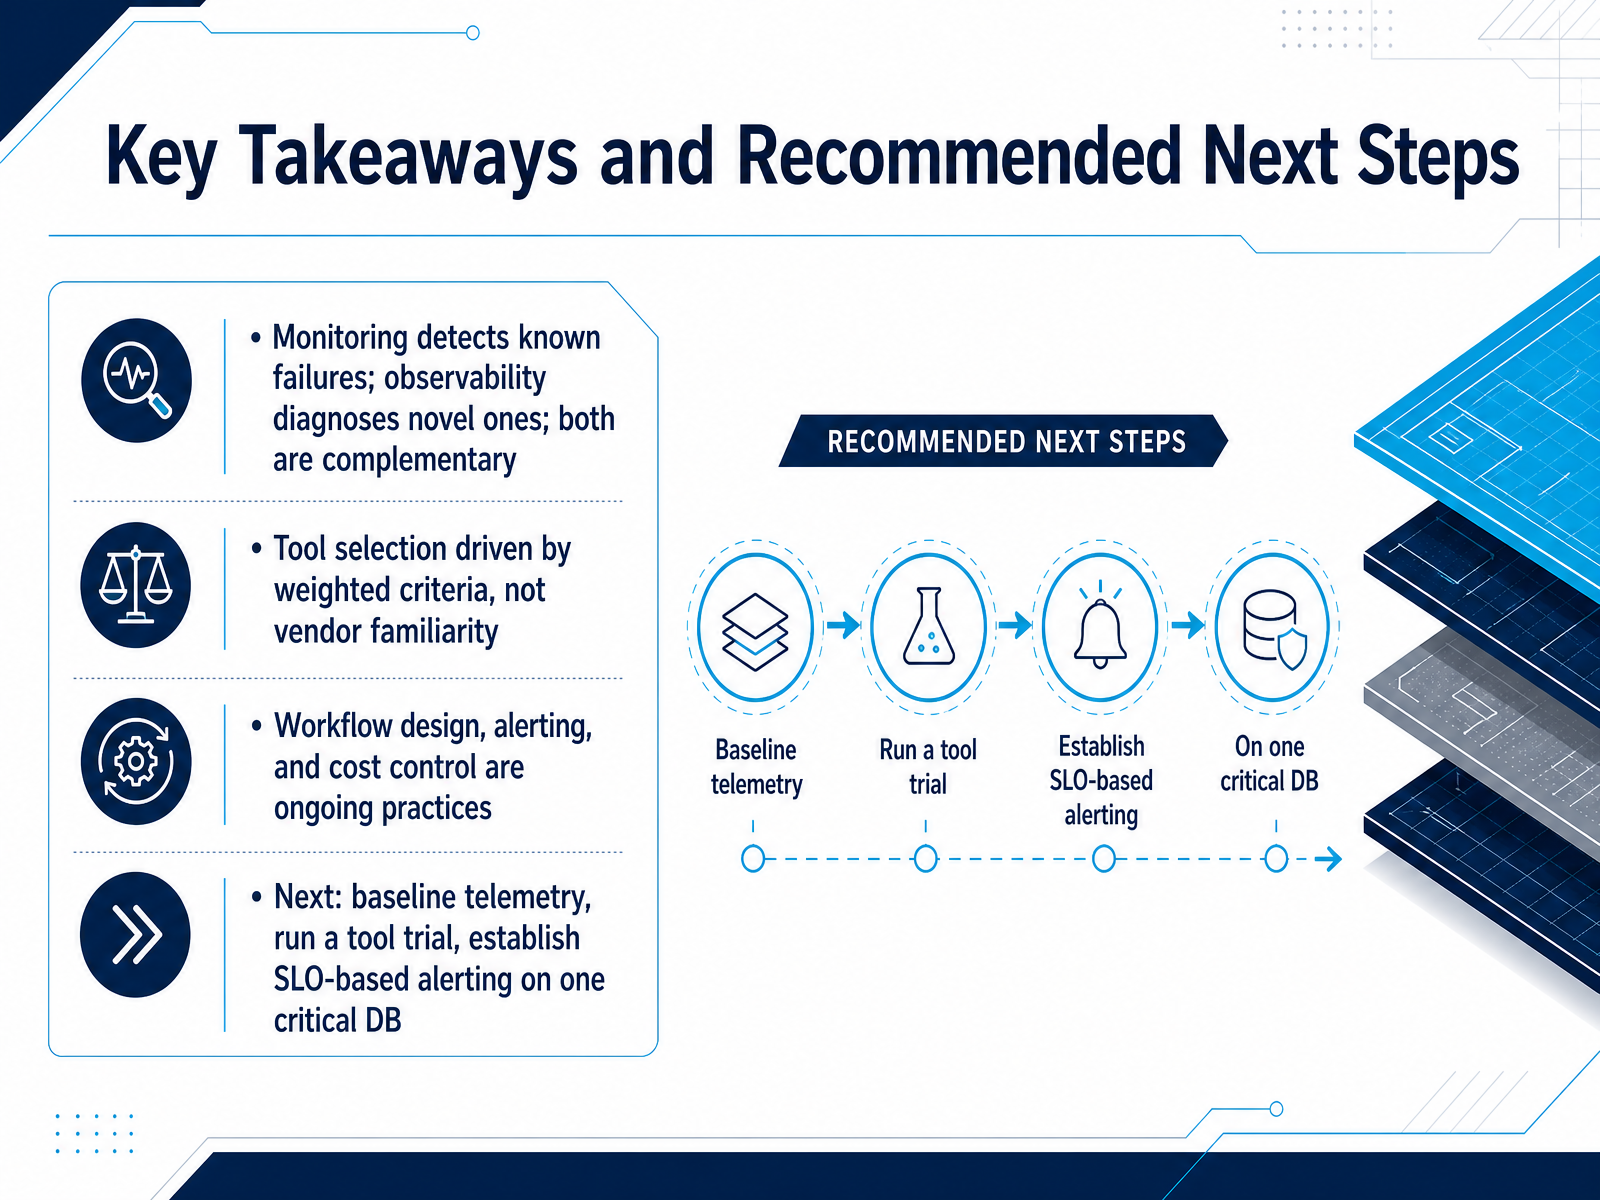
 - 14Key Takeaways and Recommended Next StepsLet's close with the essentials. Monitoring detects known failures; observability diagnoses novel ones. Treat them as complementary, not competing. Choose tools based on weighted criteria that match your operational priorities, not just vendor familiarity. Alerting, workflow design, and cost control are ongoing practices, not one-time setups. Your next steps: baseline your telemetry, run a focused tool trial, and establish SLO-based alerting on one critical database. Start small, measure impact, and scale from there. Thank you for your time, and good luck building a monitoring practice that truly serves your team.
 postgresql.orglearn.microsoft.comdev.mysql.com+21 min
Take the deck with you
Download this course as a file — free, no sign-up needed.
- PDF handoutEvery slide page, ready to print or share.15 pages · 3.9 MBDownload
- Narrated PowerPointThe deck that presents itself — every slide carries the digital human's narration video.15 pages · 28.6 MBDownload
- PowerPoint slidesThe full deck as a .pptx — open it in PowerPoint, Keynote, or Google Slides.15 pages · 3.8 MBDownload
Free to use in your own training — please keep the PersonWise credit page at the end.
Have your own deck? Turn it into a course
Sources consulted
Web sources consulted while building this course.
- PostgreSQL: Documentation: 18: 27.2. The Cumulative Statistics System — postgresql.org
- Performance Monitoring and Tuning Tools - SQL Server - Microsoft Learn — learn.microsoft.com
- MySQL :: MySQL 8.4 Reference Manual :: 35.4.3 Server Metrics — dev.mysql.com
- MySQL :: MySQL 26.7 Reference Manual :: 7.1.10 Server Status Variables — dev.mysql.com
- Database- and cluster-level metrics | PostgresAI — v2.postgres.ai
- How does database observability differ from monitoring? — milvus.io
- Database Observability vs Monitoring: Why Dashboards Aren't Enough | SIXTA — sixta.ai
- Database Observability vs. Monitoring — navicat.com
- Database Monitoring and Observability: Metrics, Alerts, and Diagnostics | Database Systems Authority — databasesystemsauthority.com
- How Database Observability and integrations differ | Grafana Labs — grafana.com
- 10 Best Database Monitoring Tools in 2026 - Parseable — parseable.com
- Top 10 Best SQL Monitoring Software | 2026 Edition — gitnux.org
- Top 5 SQL Performance Monitoring Solutions in 2026 — top-5-solutions.com
- Best Database Monitoring Tools in 2026: A Comprehensive Guide | by Philip McClarence | Medium — medium.com
- Best SQL Monitoring Software (2026) — worldmetrics.org
- Database monitoring: metrics, tools, and cost — cloudzero.com
- Query Observability in 2026: From Alerts to Autonomy — queries.cloud
- Observability-First Lakehouse: Cost-Aware Governance 2026 — databricks.cloud
- Unlocking Database Cost Savings Through DBmarlin Observability | DBmarlin Blog — dbmarlin.com
- AI Database Observability, Monitoring, and Telemetry Cost Optimization | Datrick — datrick.com