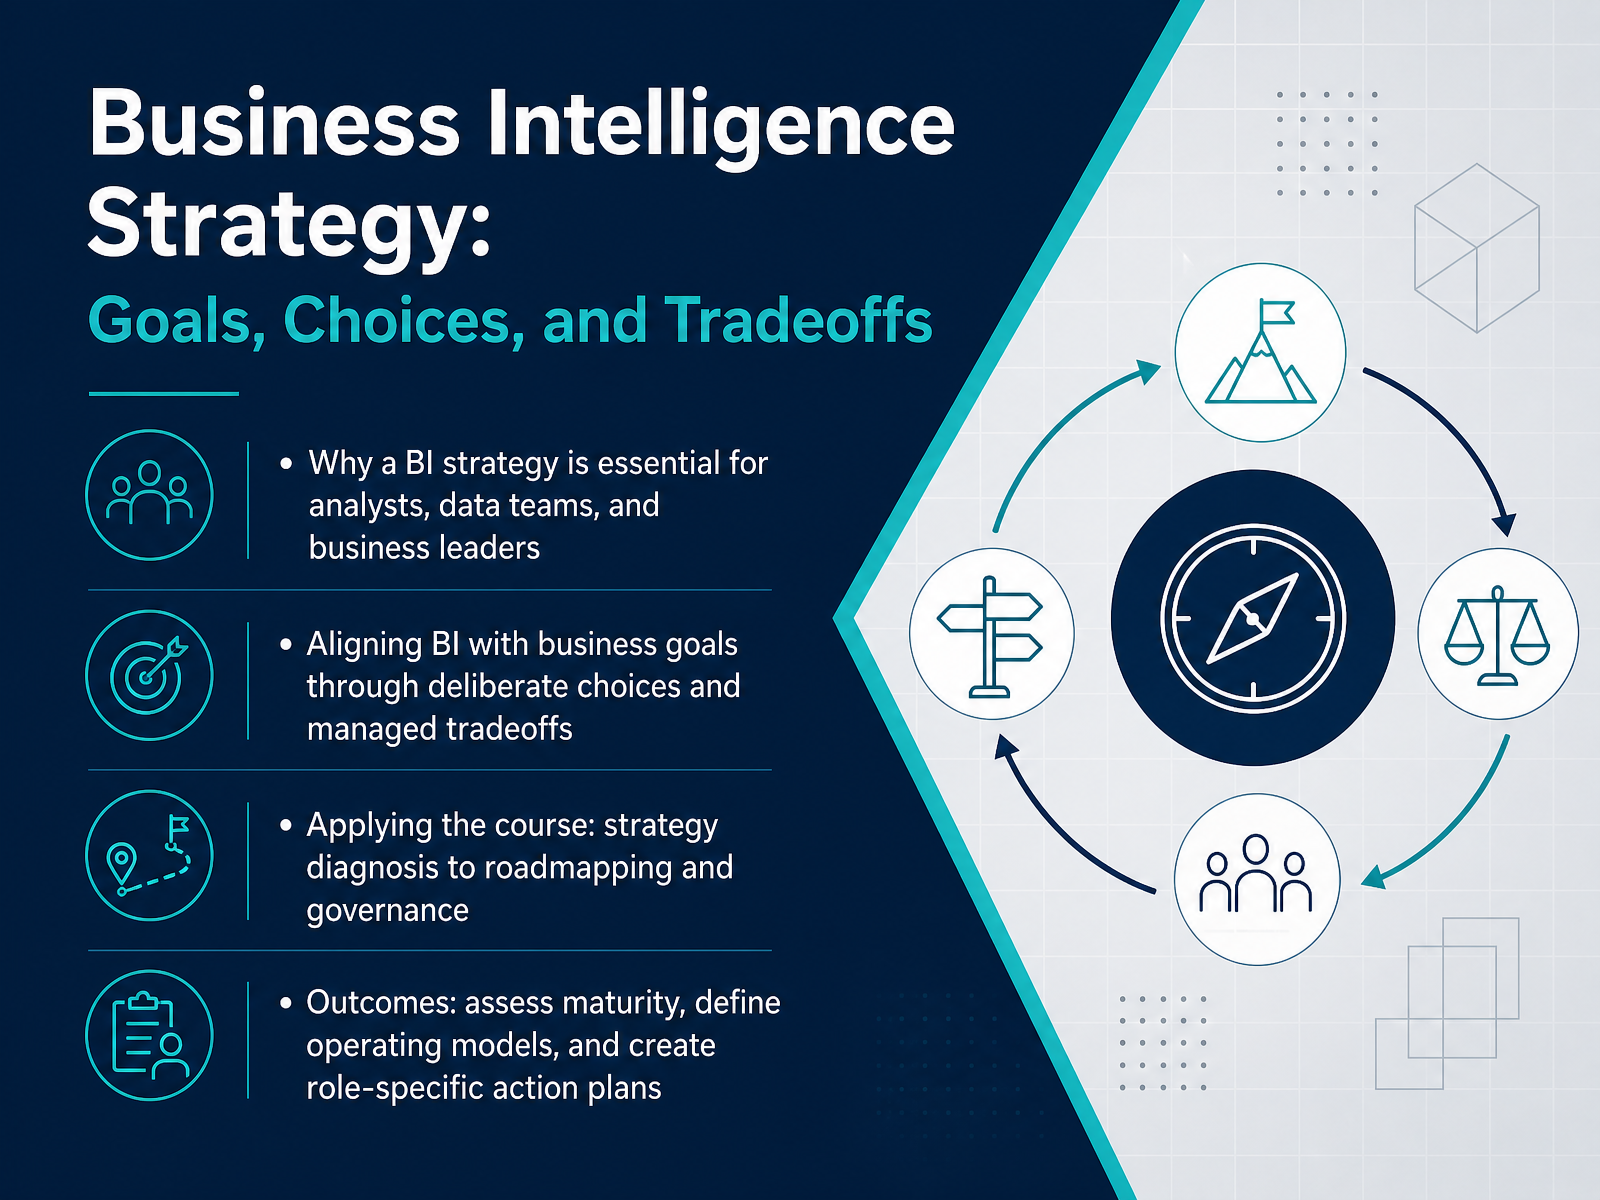
Business Intelligence Strategy: Tradeoffs
Begin
14 pages · ~28 min
Business Intelligence Strategy: Tradeoffs
Learn to define a business intelligence strategy by setting goals, making key choices, and managing tradeoffs for effective BI outcomes.
What you’ll learn
- 01Business Intelligence Strategy: Goals, Choices, and TradeoffsWelcome. If you're here, you've likely felt the pain of dashboards that don't drive decisions, or metrics that differ from one team to another. That's what this course is about: turning Business Intelligence from a reporting function into a strategic capability. We'll move beyond tools and talk about the deliberate choices—and the tradeoffs—that connect BI to your organization's real goals. We'll cover how to diagnose where you stand, define a clear operating model, and build a roadmap with governance that enables rather than blocks. By the end, you'll have practical frameworks to assess your maturity and create role-specific action plans that drive adoption and trust. Let's begin by exploring what a BI strategy actually is, and where it sits within your broader data landscape.zoho.comdomo.comtechtarget.com+21 min
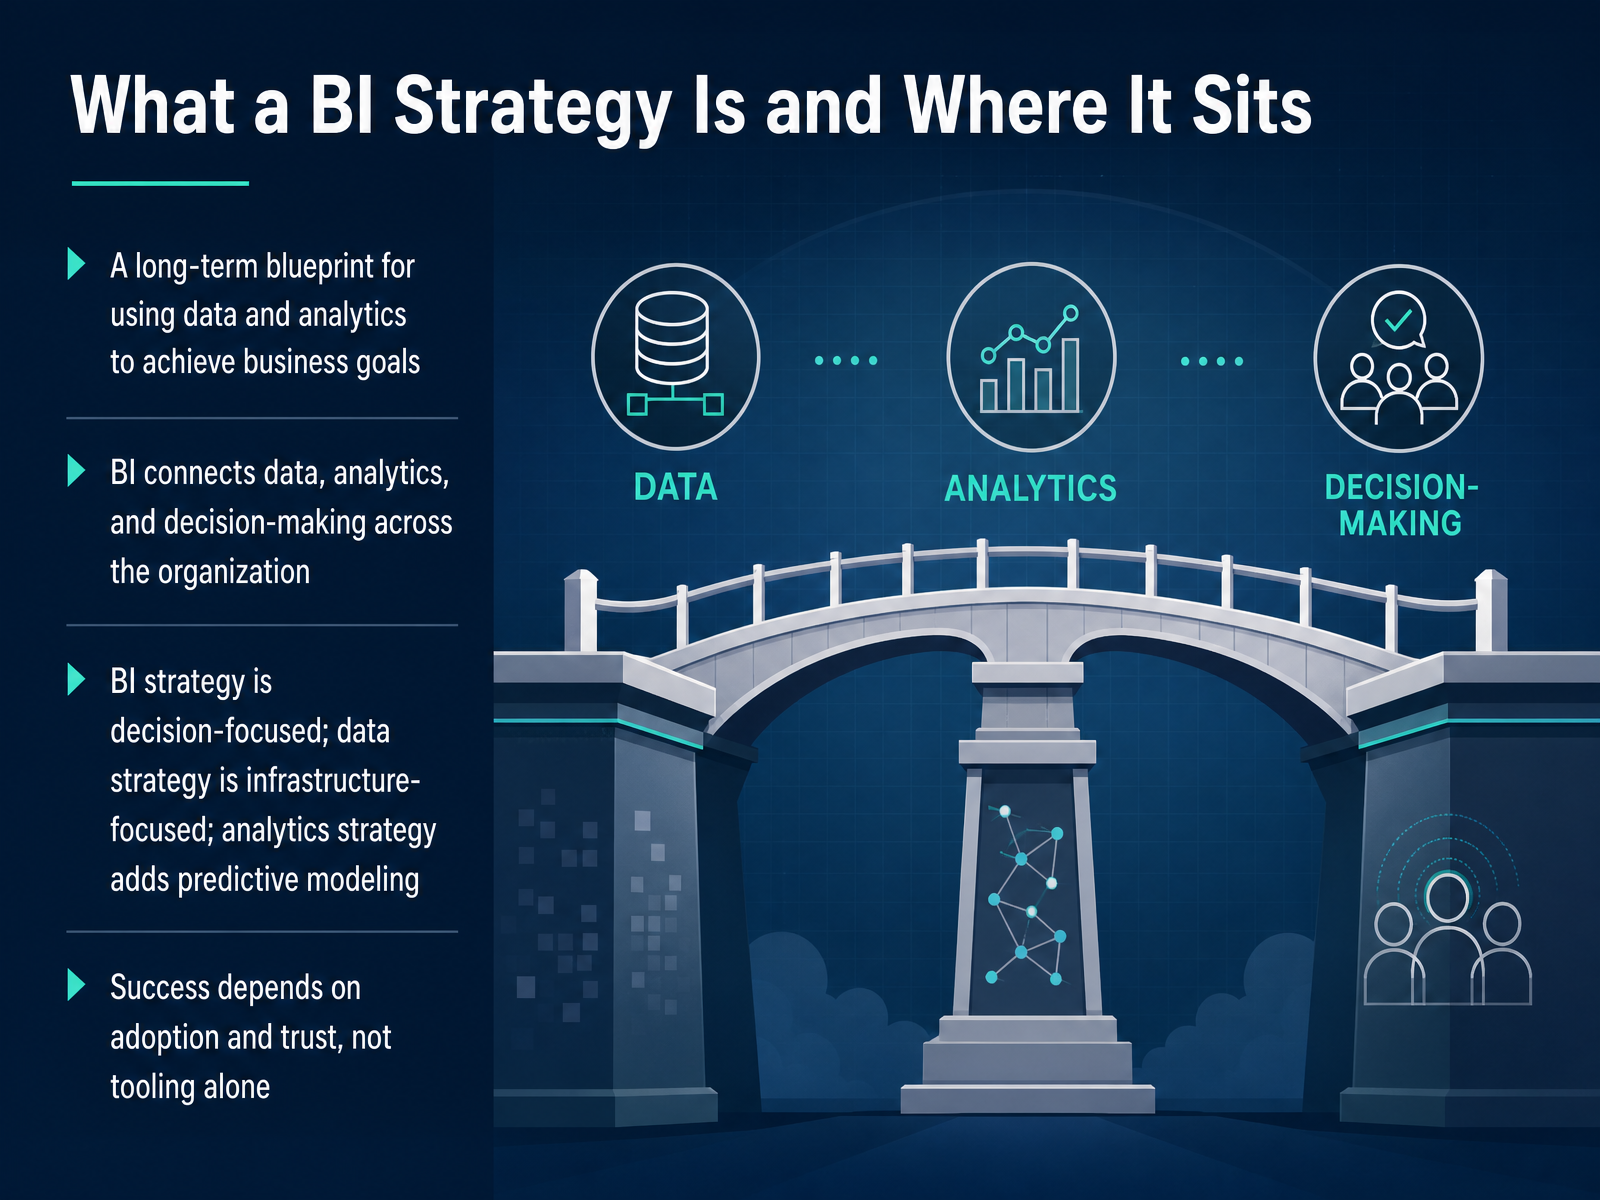
- 02What a BI Strategy Is and Where It SitsLet's ground ourselves in what a BI strategy actually is, and where it fits alongside the other strategies you're likely juggling. A BI strategy is a long-term blueprint for using data and analytics to achieve business goals. It's how you connect data, analytics, and decision-making across the organization, turning raw information into consistent, repeatable insight. Now, it's easy to blur the lines here, so let's be precise. A data strategy is infrastructure-focused; it covers how you collect, store, and govern data. An analytics strategy goes further, adding predictive modeling and machine learning. Your BI strategy sits in between. It is decision-focused. It's the layer that defines how business users actually turn data into decisions. And here's the critical point: success depends on adoption and trust, not just tooling. The most sophisticated platform will sit unused if teams don't trust the numbers or know how to act on them. As we move forward, we'll explore why this distinction matters and how to build a strategy that people actually use.
 zoho.comdomo.comtechtarget.com+21 min
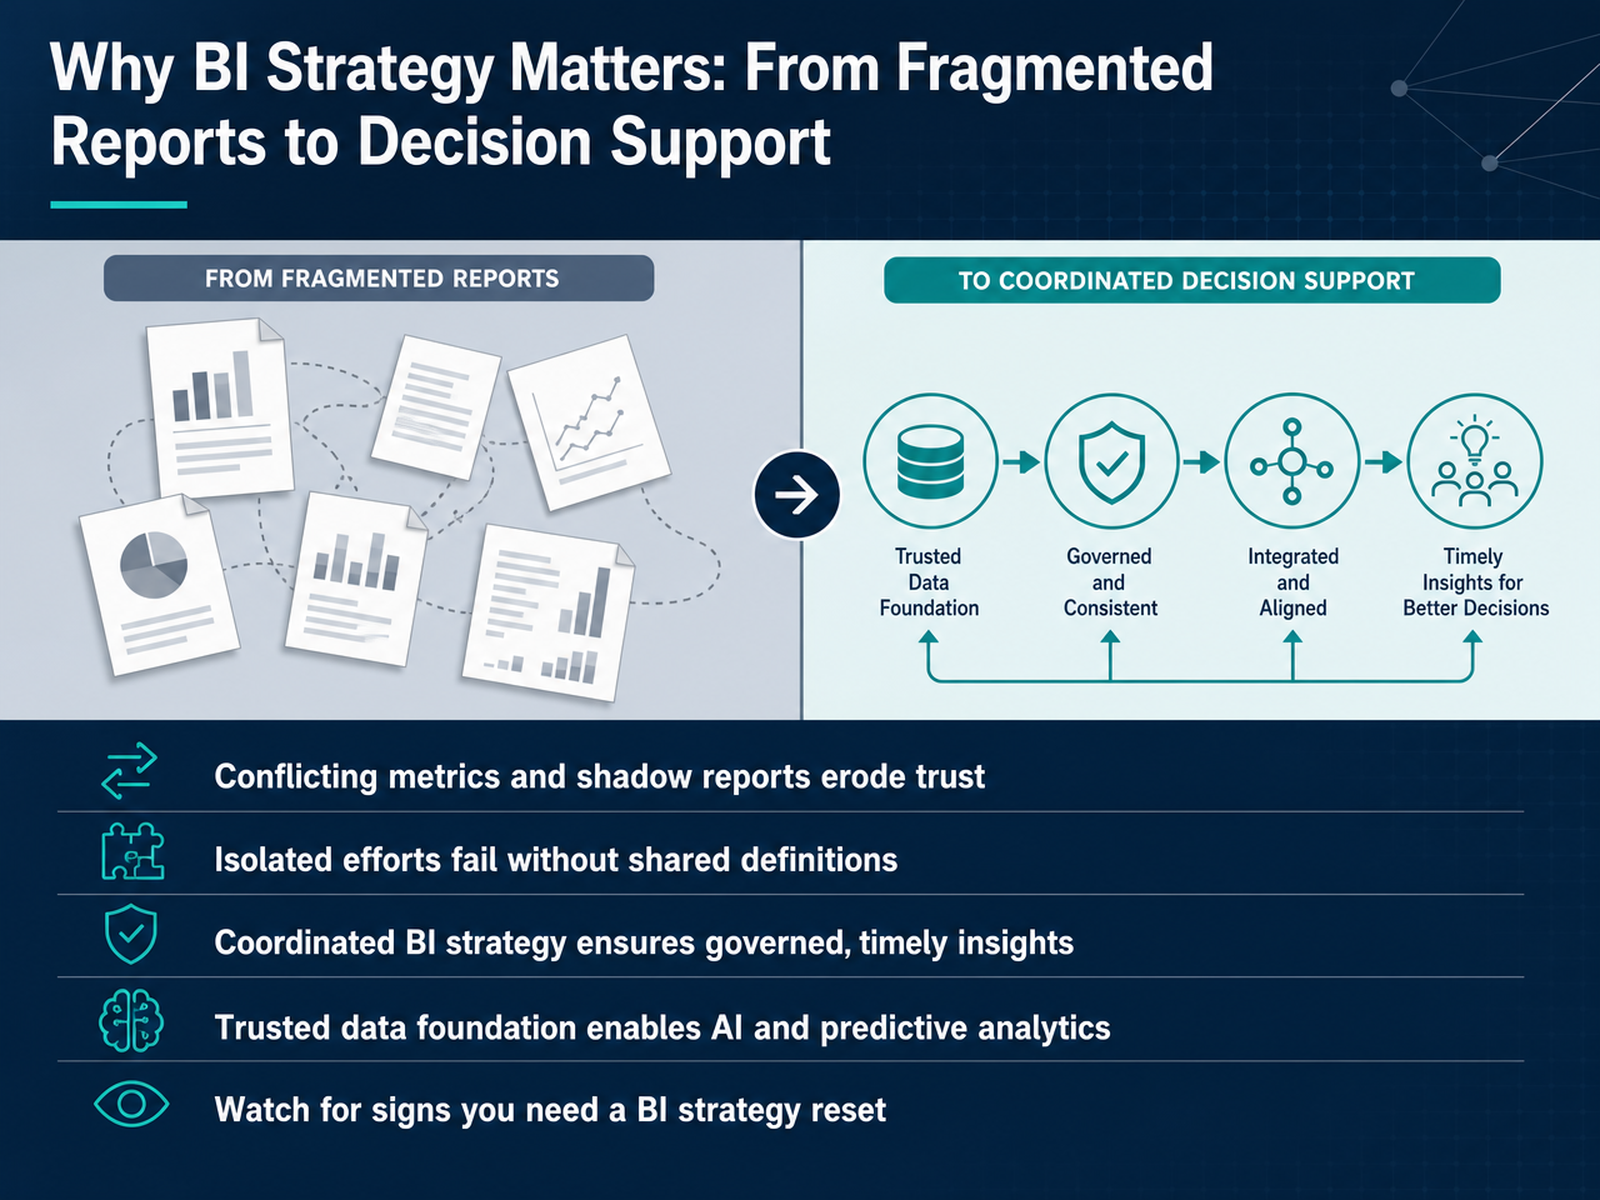
 - 03Why BI Strategy Matters: From Fragmented Reports to Decision SupportLet's get concrete about why this matters. Without a coordinated strategy, we see the same data story told differently in every department. Sales and finance both report revenue, but the numbers don't match. That erodes trust fast, and when trust is gone, people build their own shadow reports. Isolated efforts fail because they don't share common definitions, so we end up debating whose number is right instead of deciding what to do. A coordinated BI strategy fixes this by enforcing consistent metrics and governed, timely insights. It moves us from fragmented reporting to real decision support. And it builds the trusted data foundation we need for AI and predictive analytics, because models built on inconsistent data just amplify the noise. If you're seeing conflicting numbers, duplicate dashboards, or leadership questioning the data, those are clear signs you need a BI strategy reset. Let's look at what the core goals of that strategy should be.
 zoho.comdomo.comtechtarget.com+22 min
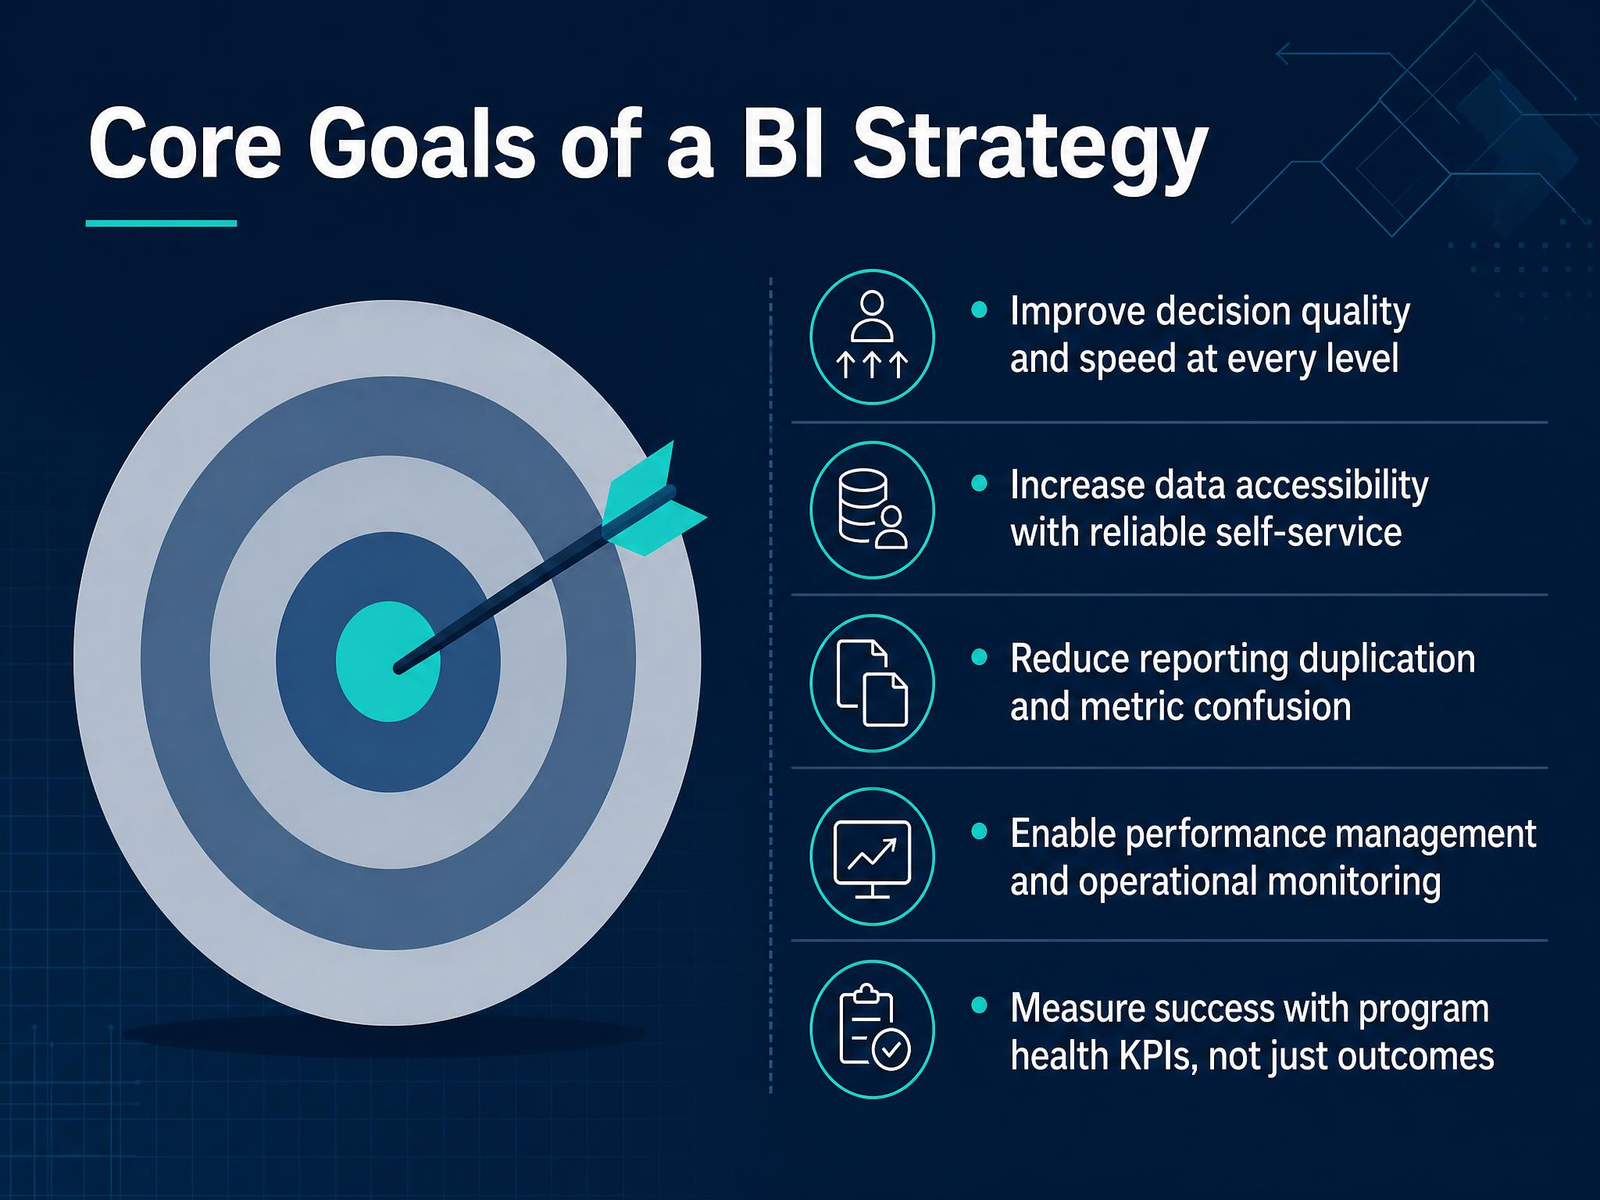
 - 04Core Goals of a BI StrategyLet’s talk about what a business intelligence strategy is actually trying to achieve. We’re not just building dashboards for the sake of it. We’re aiming to improve decision quality and speed at every level of the organization. That means the right person gets the right answer at the right time, without waiting on a backlog. Alongside that, we want reliable self-service, so people can explore data confidently without constantly needing an analyst. But self-service without governance creates metric confusion and duplicated reports. So a core goal is to reduce that duplication by establishing one trusted version of the truth. We also need to support operational monitoring and performance management, making sure day-to-day work stays on track. And here’s a point that often gets missed: we have to measure the health of the BI program itself, not just business outcomes. Track adoption rates, dashboard usage, data freshness. If we only look at the results, we won’t see problems coming until it’s too late. The takeaway? A BI strategy is about balancing speed, trust, and sustainability. That balance leads us directly to our next topic: BI operating models, and whether to centralize, decentralize, or go hybrid.
 techtarget.comdomo.comdomo.com+22 min
 - 05BI Operating Models: Centralized, Decentralized, or HybridNow let's talk about the operating model — how your BI team is actually structured. This isn't a technology decision; it's an organizational one, and it directly impacts data trust, speed to insight, and cost. The centralized model puts one team in charge of everything. Why does that matter? You get control and consistency — one version of the truth for core metrics — but you pay for it with speed. Every new question becomes a ticket in the backlog, and business teams wait days or weeks for a simple change. The decentralized model flips that. Business units build and own their reports. Speed and agility improve dramatically, but without guardrails, you get metric drift. Sales defines revenue one way, Finance defines it another, and suddenly nobody trusts the numbers. Then there's the hybrid — central governance with distributed report creation. This is where the central team owns and certifies the core data models, security, and standards, while business teams build reports on top of those trusted datasets. It gives you the speed of self-service without sacrificing consistency. So which do you choose? Base it on your maturity, your regulatory pressure, your team size, and how fast your decisions need to be made. Mature teams with strong data literacy can handle more decentralization. Regulated industries need more central control. There's no perfect model — just the right one for your context. Next, let's look at the strategic choices you'll need to make around scope, prioritization, and technology.
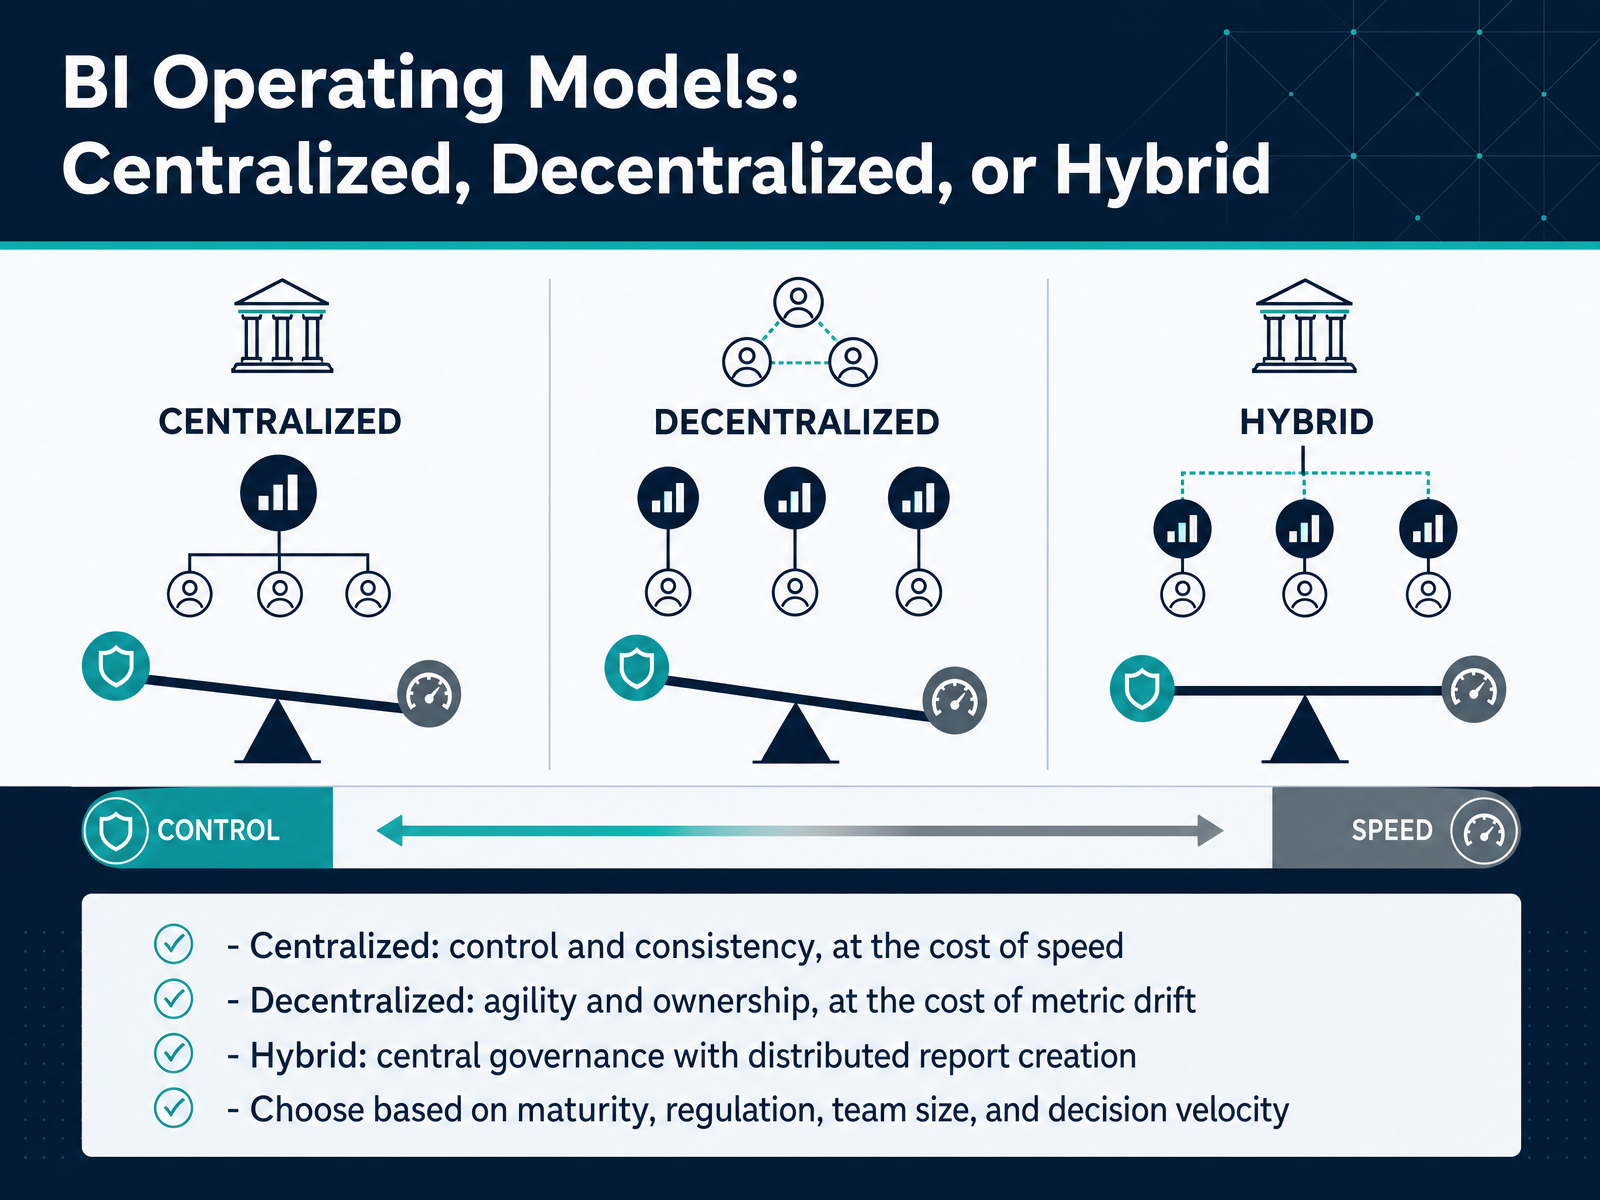 c-sharpcorner.comgoanalyticsbi.comepcgroup.net+22 min
 - 06Strategic Choices: Scope, Prioritization, and TechnologyNow let's get into the strategic choices that will shape your BI program. First, build a decision inventory. List the specific decisions that need better data, who makes them, and how often. For example, the CMO approves the quarterly marketing budget and needs campaign ROI and pipeline velocity. This inventory becomes your foundation. Then, prioritize BI use cases by business impact and readiness. Don't chase every opportunity. Focus on the few that move your key metrics. When it comes to platform selection, look beyond the feature lists. Evaluate self-service capability, governance support, and how well the tool integrates with your existing data sources. A simpler tool that people actually use beats a powerful one that gets abandoned. Finally, make deliberate staffing choices. A dedicated BI team gives you control and consistency, but can become a bottleneck. Embedded analysts move faster but risk inconsistency. A hybrid model where a central team owns certified datasets while business teams build reports on top of them often works best. The key is to match your choices to your current maturity and decision needs. Next, we'll look at the key tradeoffs in BI strategy.
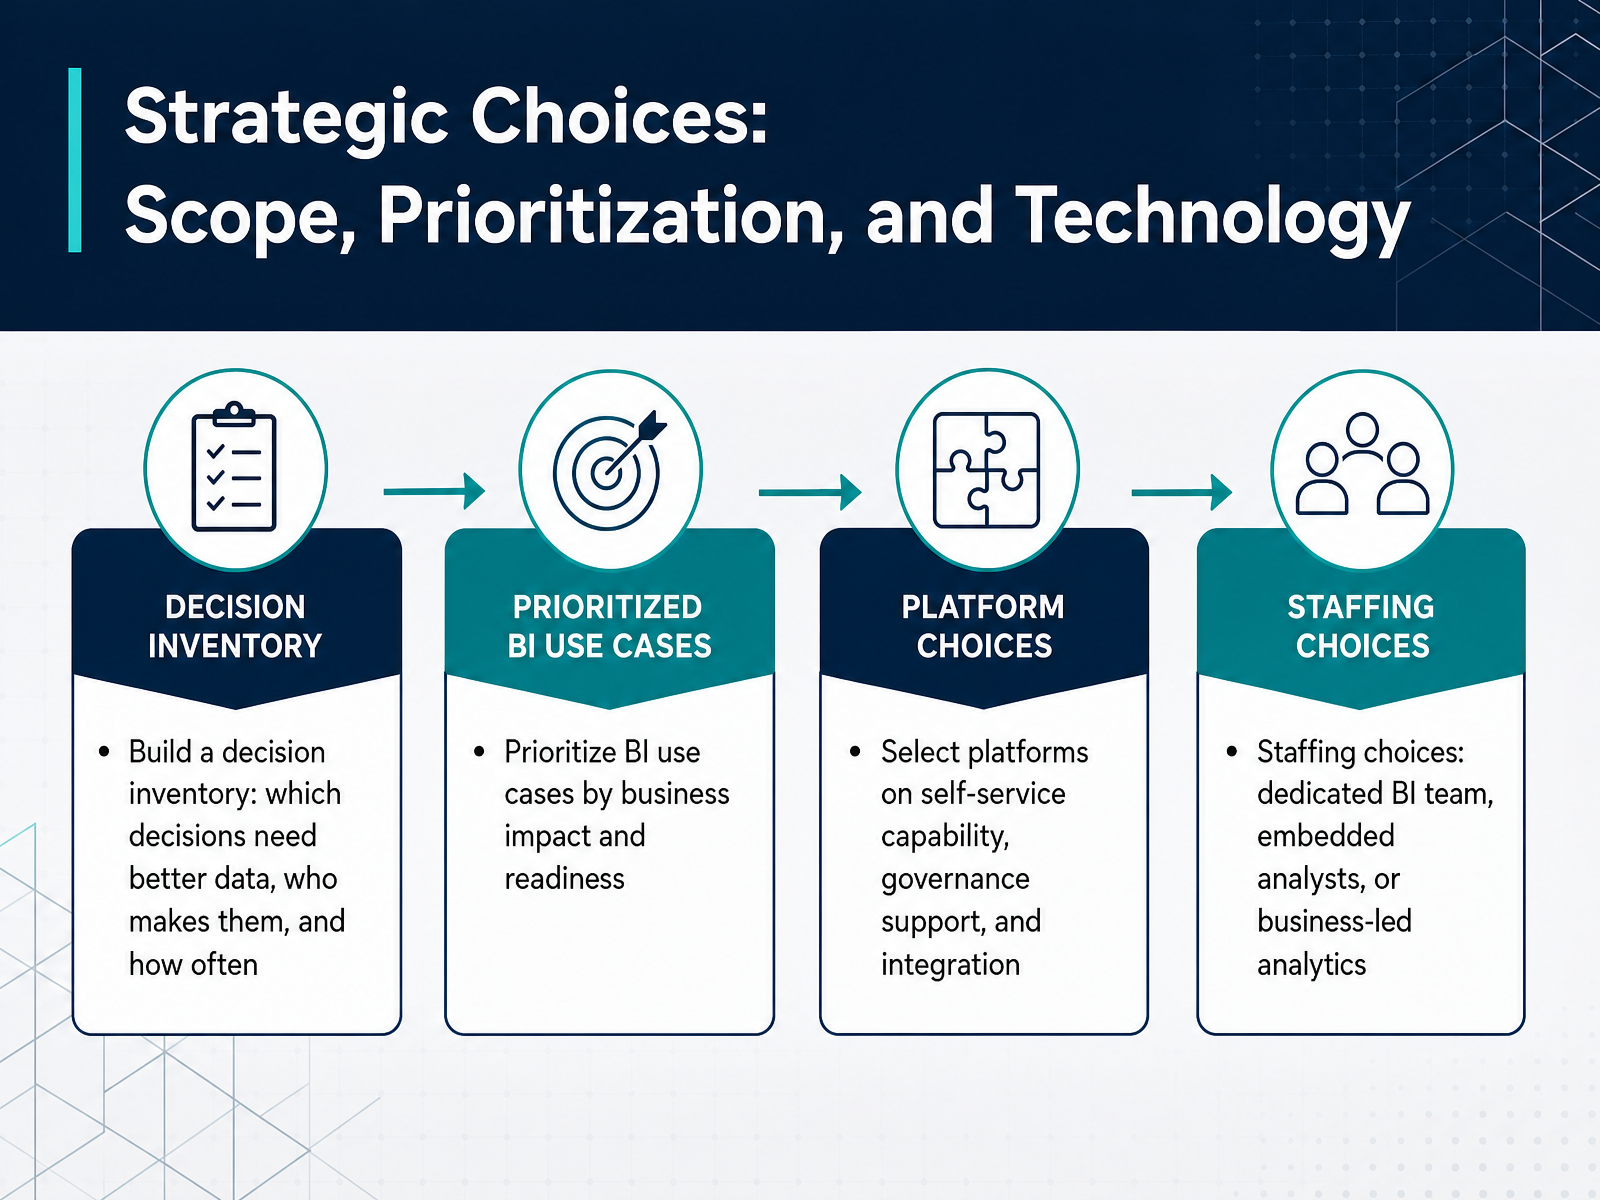 techtarget.comdomo.comdomo.com+22 min
 - 07Key Tradeoffs in BI StrategyLet's talk about the tradeoffs that define your BI strategy. These are not compromises. They are deliberate choices with consequences. First, speed of delivery versus data quality and governance. Ship fast, and you risk inconsistent metrics and eroded trust. Govern heavily, and you become the bottleneck. Second, self-service flexibility versus standardized metrics. Give everyone freedom, and definitions drift. Lock everything down, and users retreat to spreadsheets. Third, immediate wins versus the long-term data foundation. Quick dashboards build momentum, but skip the foundation and you'll rebuild them later. Fourth, cost efficiency versus scalability. Cutting compute costs today often means slow queries tomorrow. The key is to frame each tradeoff intentionally. Ask what you're optimizing for, and what you're willing to give up. When you're deliberate, you can shift the balance as needs evolve. Next, we'll look at how metrics alignment and the semantic layer resolve many of these tensions.
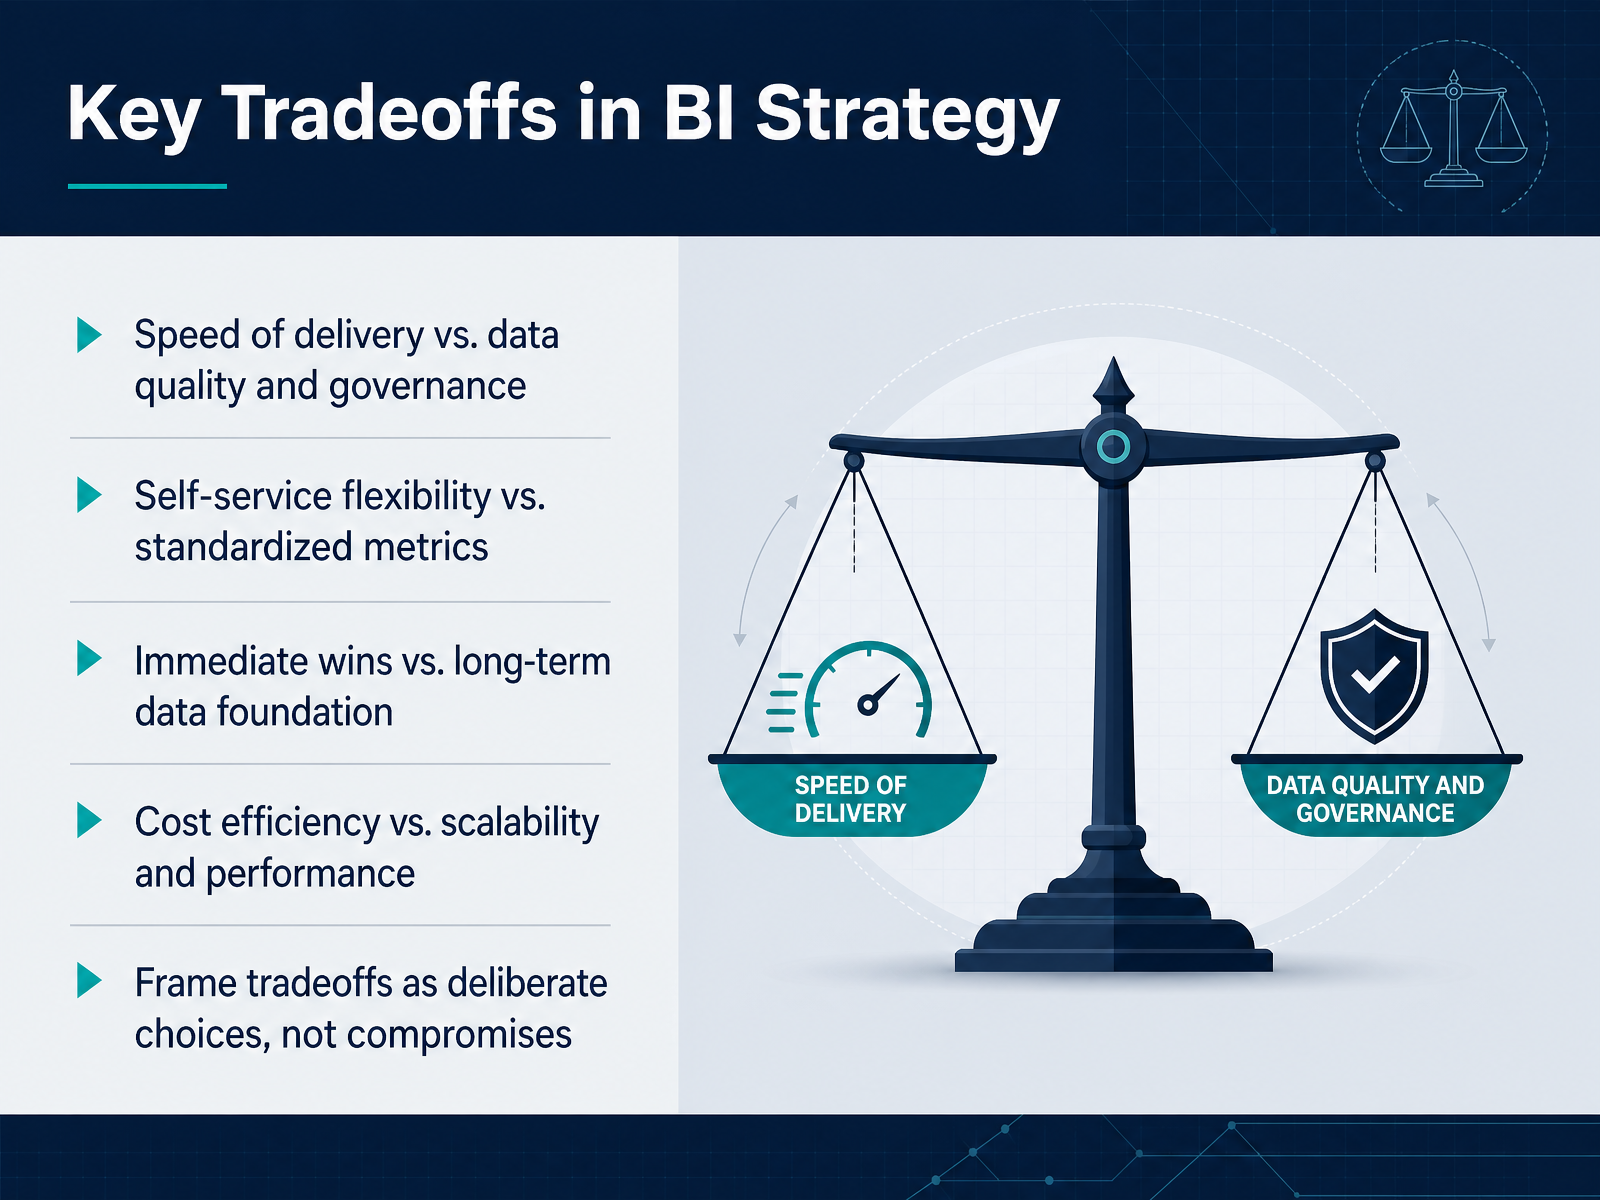 tandfonline.comtechtarget.compromethium.ai+22 min
 - 08Metrics Alignment and the Semantic LayerNow let's talk about metric alignment and the semantic layer. When finance and sales disagree on the revenue number, the problem is rarely bad data. It's fragmented definitions. A semantic layer fixes this by defining revenue once, centrally, so every dashboard, notebook, and AI agent resolves to the same number. But where should that layer live? In the BI tool, it's fast and easy, but the definition stays trapped inside that tool. In the warehouse, you get consistency across everything, but every change becomes a slower analytics-engineering job. A headless layer gives portability, but adds infrastructure and complexity. There's no universal right answer. The right choice depends on which inconsistency hurts you most. Here's a practical starting point: pick three to five disputed KPIs, like revenue or churn, and define them once, centrally. Prioritize consistency over speed. And test the definitions themselves, not just the tables. Run range and reconciliation checks so a wrong metric can't silently reach the business. The goal isn't perfect coverage on day one. It's proving you can make two teams agree on one number. That wins trust faster than any architecture diagram. Next, we'll look at how data quality and governance tradeoffs play into this.
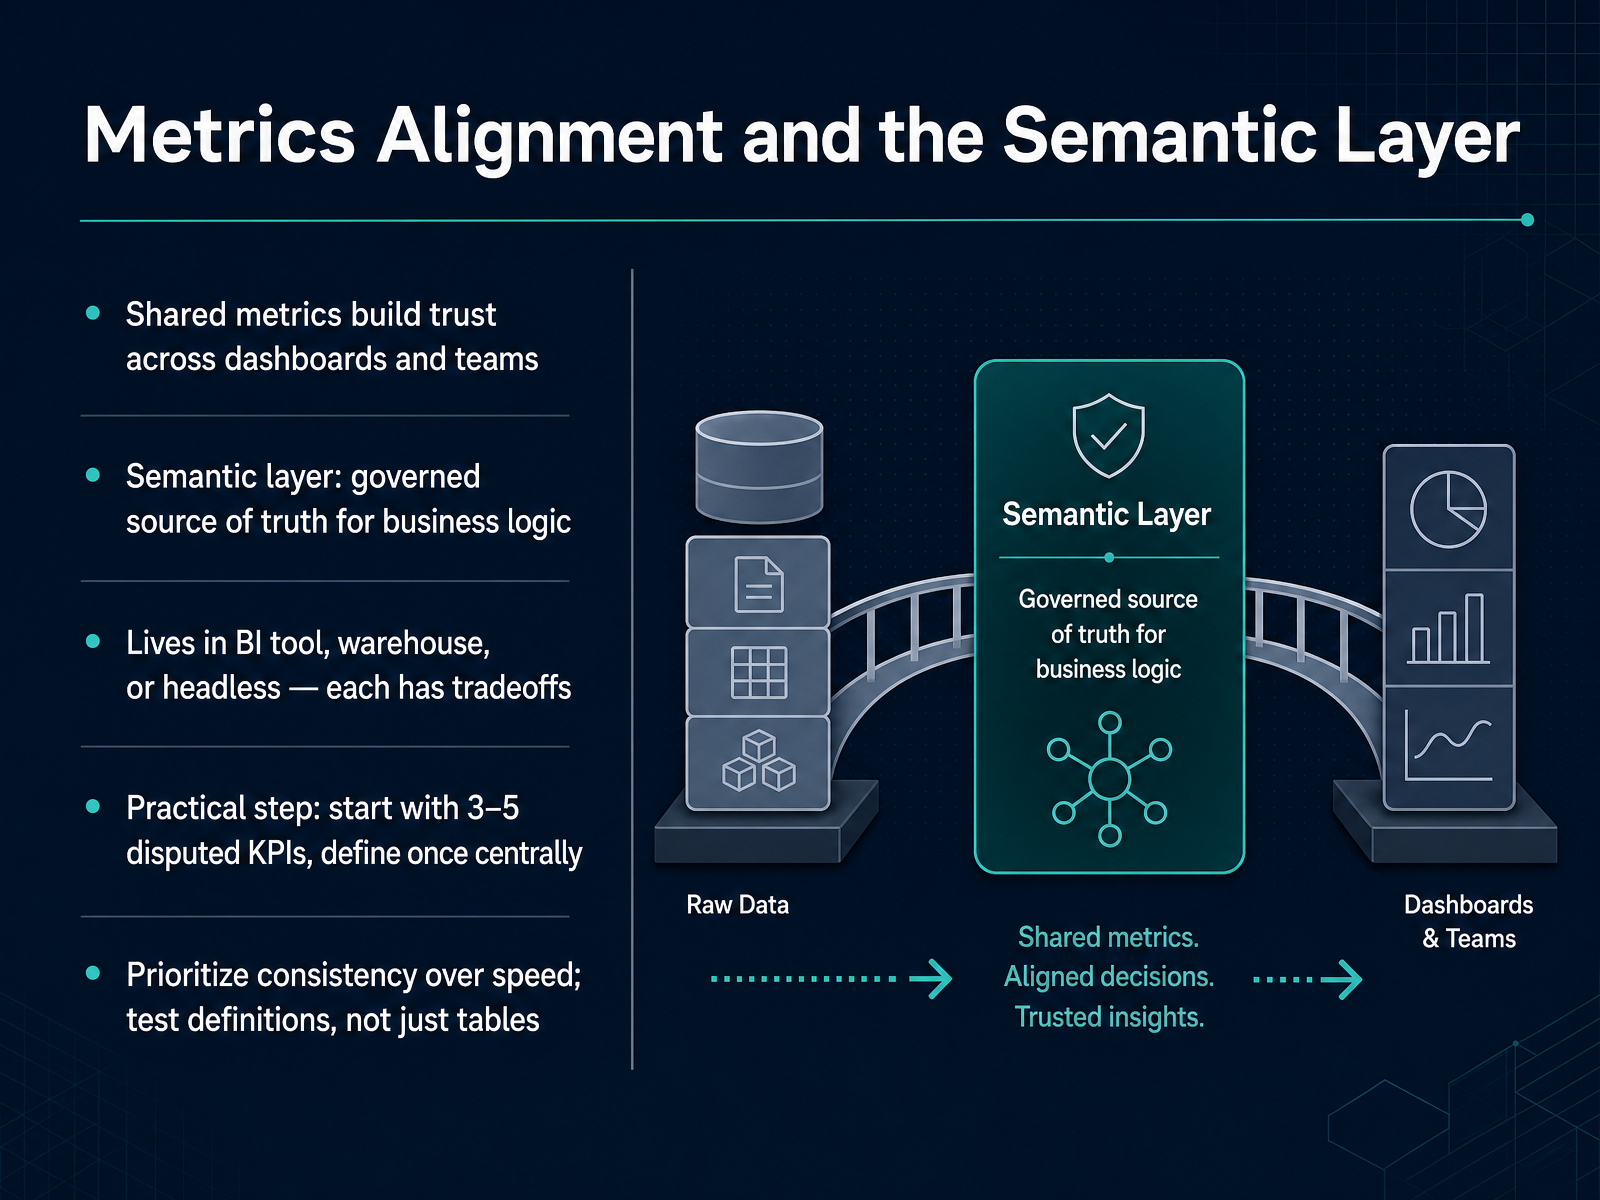 productphilosophy.comcoginiti.co2 min
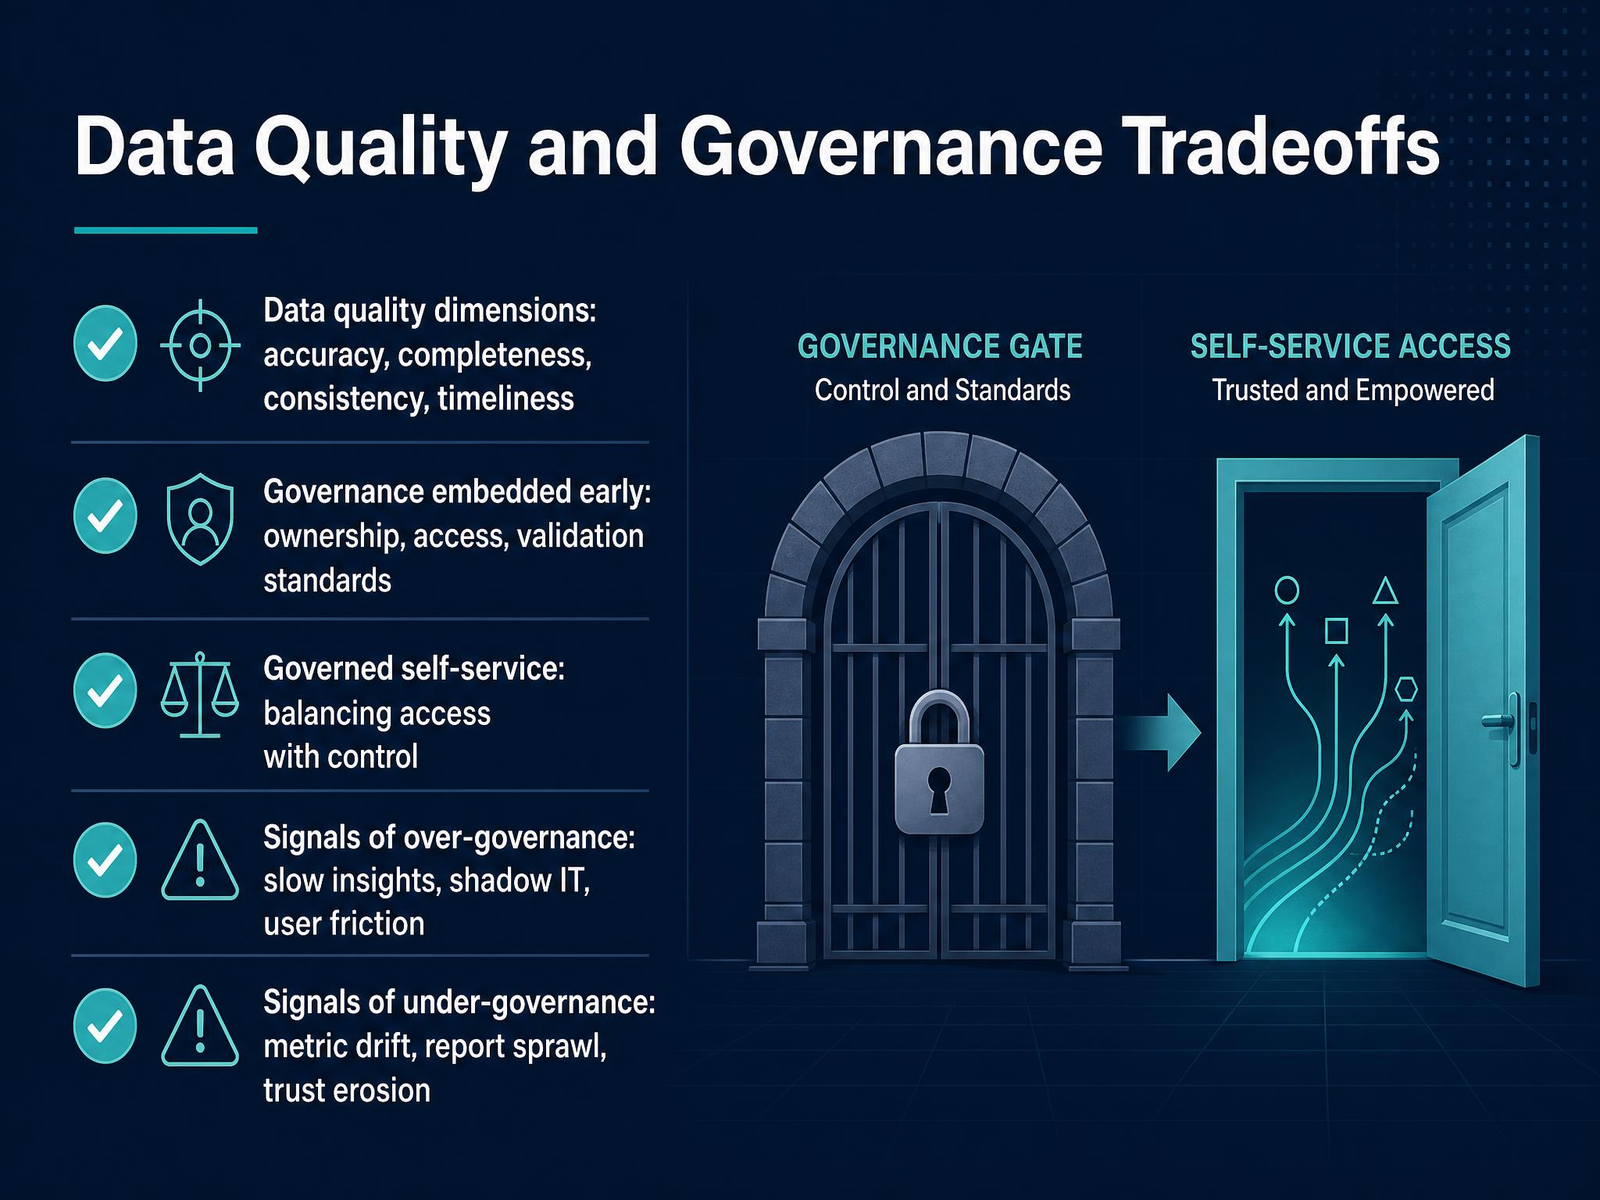
 - 09Data Quality and Governance TradeoffsLet’s talk about the tradeoff that defines most BI programs: data quality and governance. We all want accurate, consistent, and timely data. But the way we govern that data determines whether we get it. Governance is not about locking things down. It is about deciding where control lives, and where it does not. If we over-govern, we see the signals quickly: slow insights, people building shadow IT in spreadsheets, and real user friction. If we under-govern, we see metric drift, report sprawl, and a slow erosion of trust. Neither extreme is acceptable. The goal is governed self-service. That means we embed ownership, access rules, and validation standards early, inside the semantic layer, not in approval workflows. When definitions are clear and certified, users get speed and consistency at the same time. When they are not, every dashboard becomes its own opinion. So, the practical move is to govern the core metrics and definitions centrally, and let exploration happen freely around them. Get that balance right, and you scale trust. Now, let’s look at how to roadmap your BI capabilities without overbuilding.
 tandfonline.comtechtarget.compromethium.ai+22 min
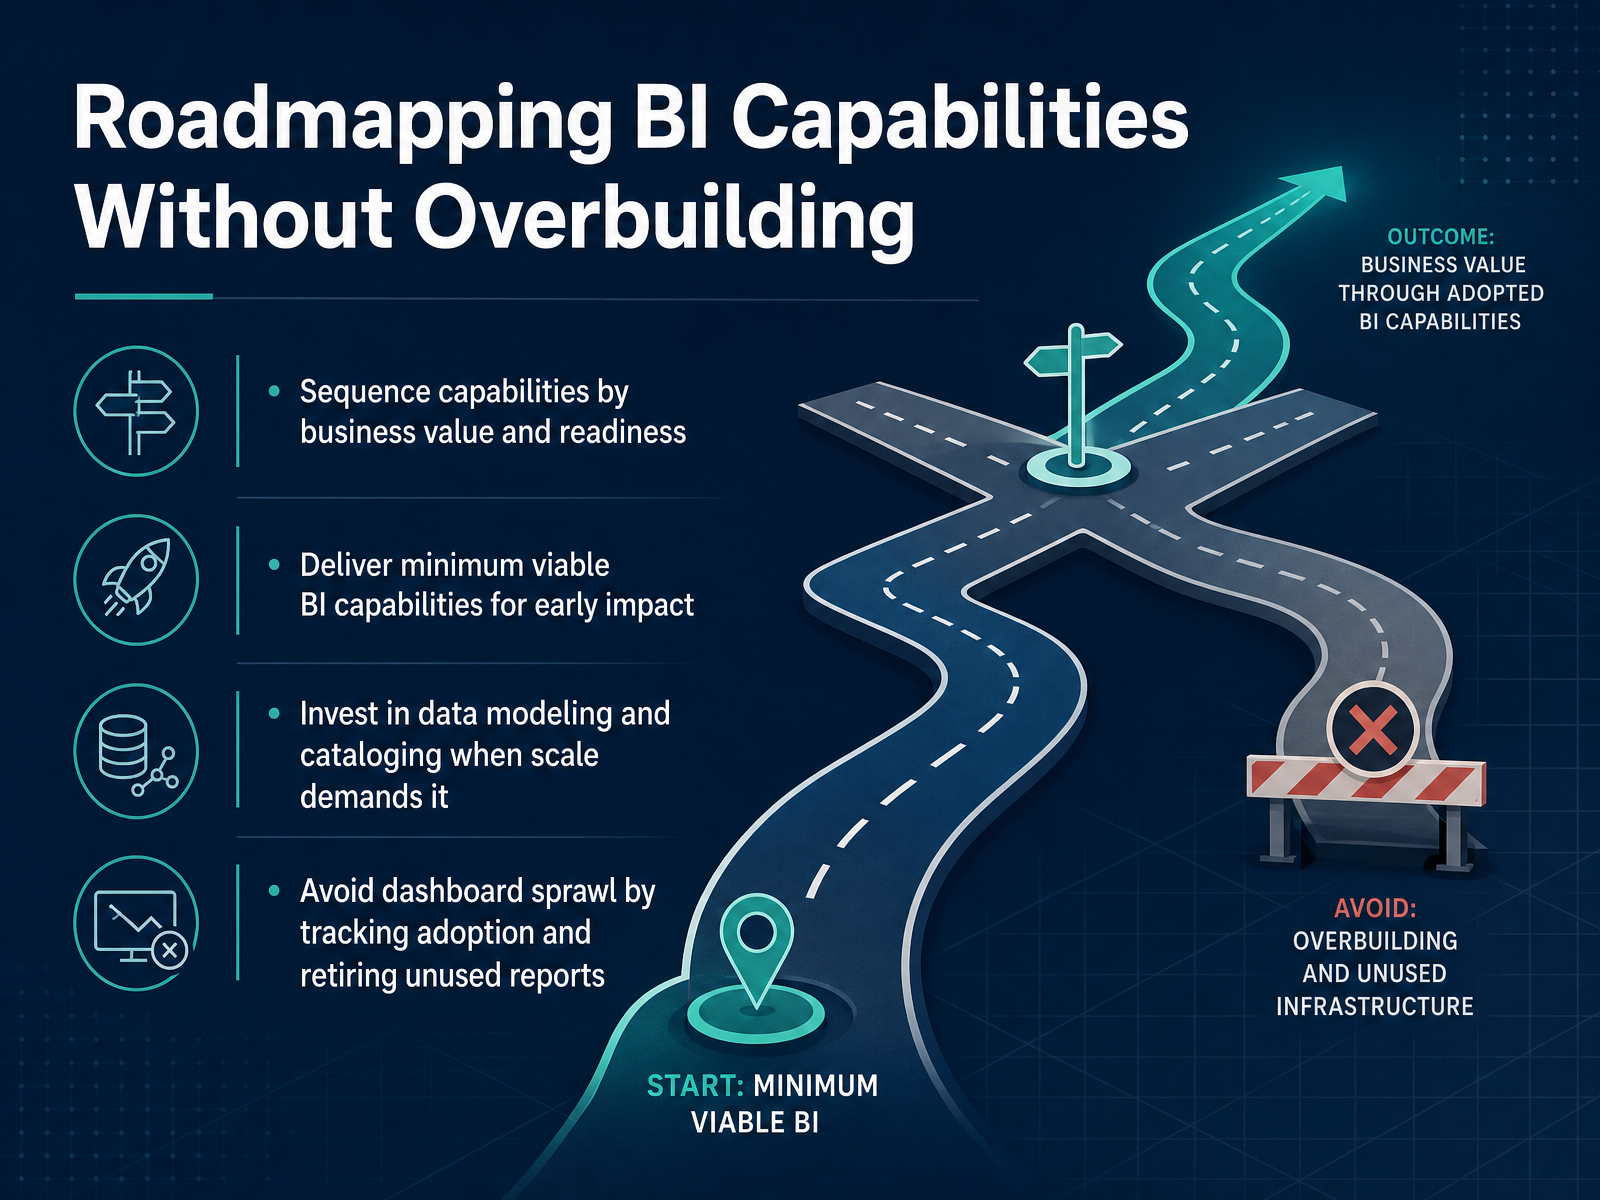
 - 10Roadmapping BI Capabilities Without OverbuildingNow let's talk about how we actually sequence the work without falling into the trap of overbuilding. The principle is simple: match investment to readiness. We start by ranking capabilities by business value and organizational readiness. A quick win for one team might be a heavy lift for another, so we prioritize where the impact is highest and the data is already trustworthy. Next, we deliver minimum viable BI capabilities. This is about getting something useful into users' hands quickly, building momentum, and proving value before we scale. We invest in formal data modeling and cataloging when the scale demands it, not before. That means we hold off on heavy governance until we see consolidation needs or cross-team dependencies. And finally, we actively manage dashboard sprawl. We track adoption, retire unused reports, and we're disciplined about it. If a dashboard isn't viewed or acted on, it's not adding value. The goal is a lean, high-value portfolio that grows with demand, not with inertia.
 techtarget.com2 min
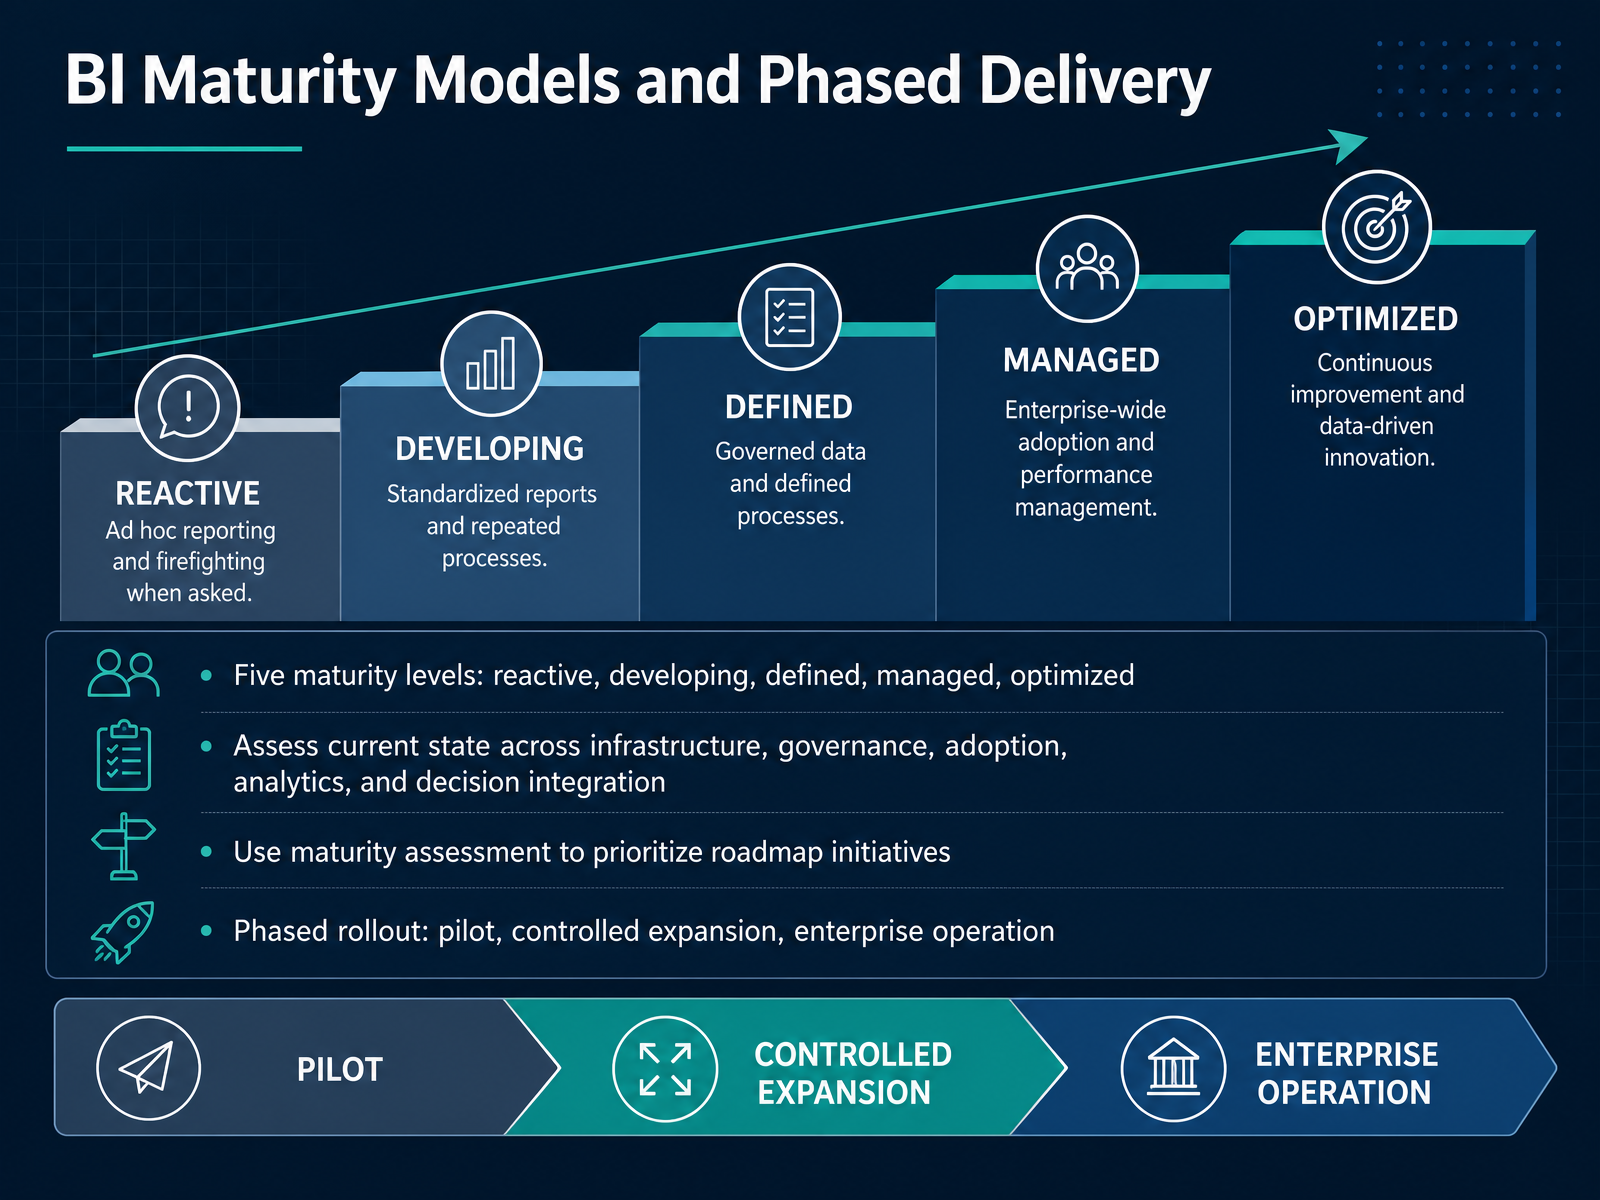
 - 11BI Maturity Models and Phased DeliveryLet's talk about maturity models and why they matter for your roadmap. Most frameworks describe five levels, from reactive reporting to optimized, decision-driven analytics. At level one, data lives in spreadsheets and reports are built on request. By level five, predictive and prescriptive analytics are embedded in daily workflows. The key is to assess your current state honestly across five dimensions: infrastructure, governance, adoption, analytics capability, and decision integration. That assessment is not a grade; it's a starting point. Use it to prioritize initiatives that close the biggest gaps first. Then roll out in phases. Start with a narrow pilot in one business unit, prove value, measure usage and business outcomes, and fix friction before expanding. Move to controlled expansion in waves, then enterprise operation. Resist the urge to skip ahead. It's always faster to fix issues in a pilot of two hundred users than in a rollout of twenty thousand. So, assess, prioritize, and phase your delivery. Next, let's look at governance, adoption, and organizational change.
 1 min
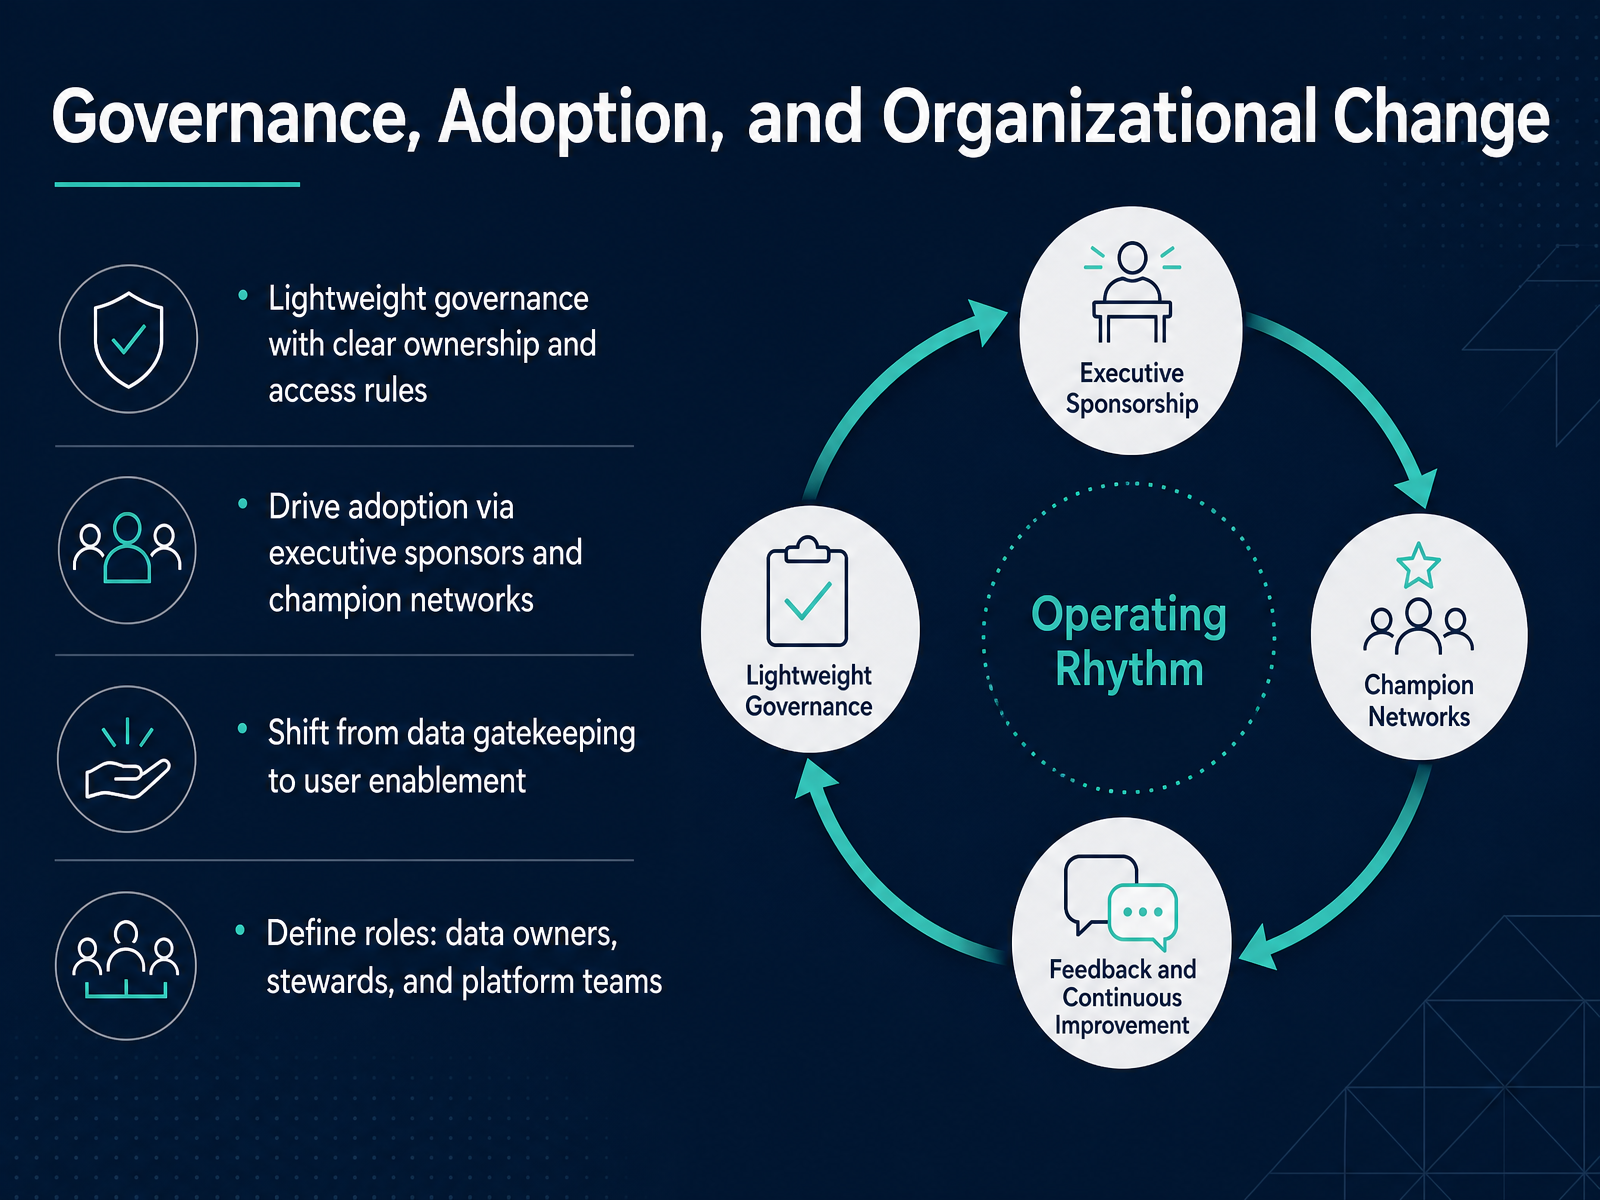
1 min - 12Governance, Adoption, and Organizational ChangeLet's talk about the part that determines whether any of this actually works in practice: governance, adoption, and organizational change. The principle we keep coming back to is lightweight governance. That means clear ownership and simple access rules, not a heavy approval bureaucracy. If users have to wait three weeks for access, they will quietly go back to their spreadsheets. So define who owns each critical dataset, who can certify a metric, and who can edit a published report. Then move on. The second piece is adoption. And adoption is not a training course. It is a campaign. You need a visible executive sponsor who asks for the dashboard in meetings, and you need a champion network, roughly five to ten percent of your users, who are the Excel gurus in their departments. Give them early access, teach them first, and let them pull their peers along. Third, shift your mindset from data gatekeeping to user enablement. Your job is not to protect data from the business; it is to give the business the data they need, with guardrails that make self-service safe. That means certified datasets the whole company can trust, along with promoted and personal workspaces for exploration. Finally, assign the three roles explicitly: data owners own the meaning of a metric, stewards maintain quality day to day, and the platform team handles the infrastructure. When those roles are ambiguous, every data question becomes a political argument. When they are clear, governance becomes invisible and adoption follows naturally. Next, we will look at how this all comes together into an operating rhythm.
 tandfonline.comtechtarget.compromethium.ai+22 min
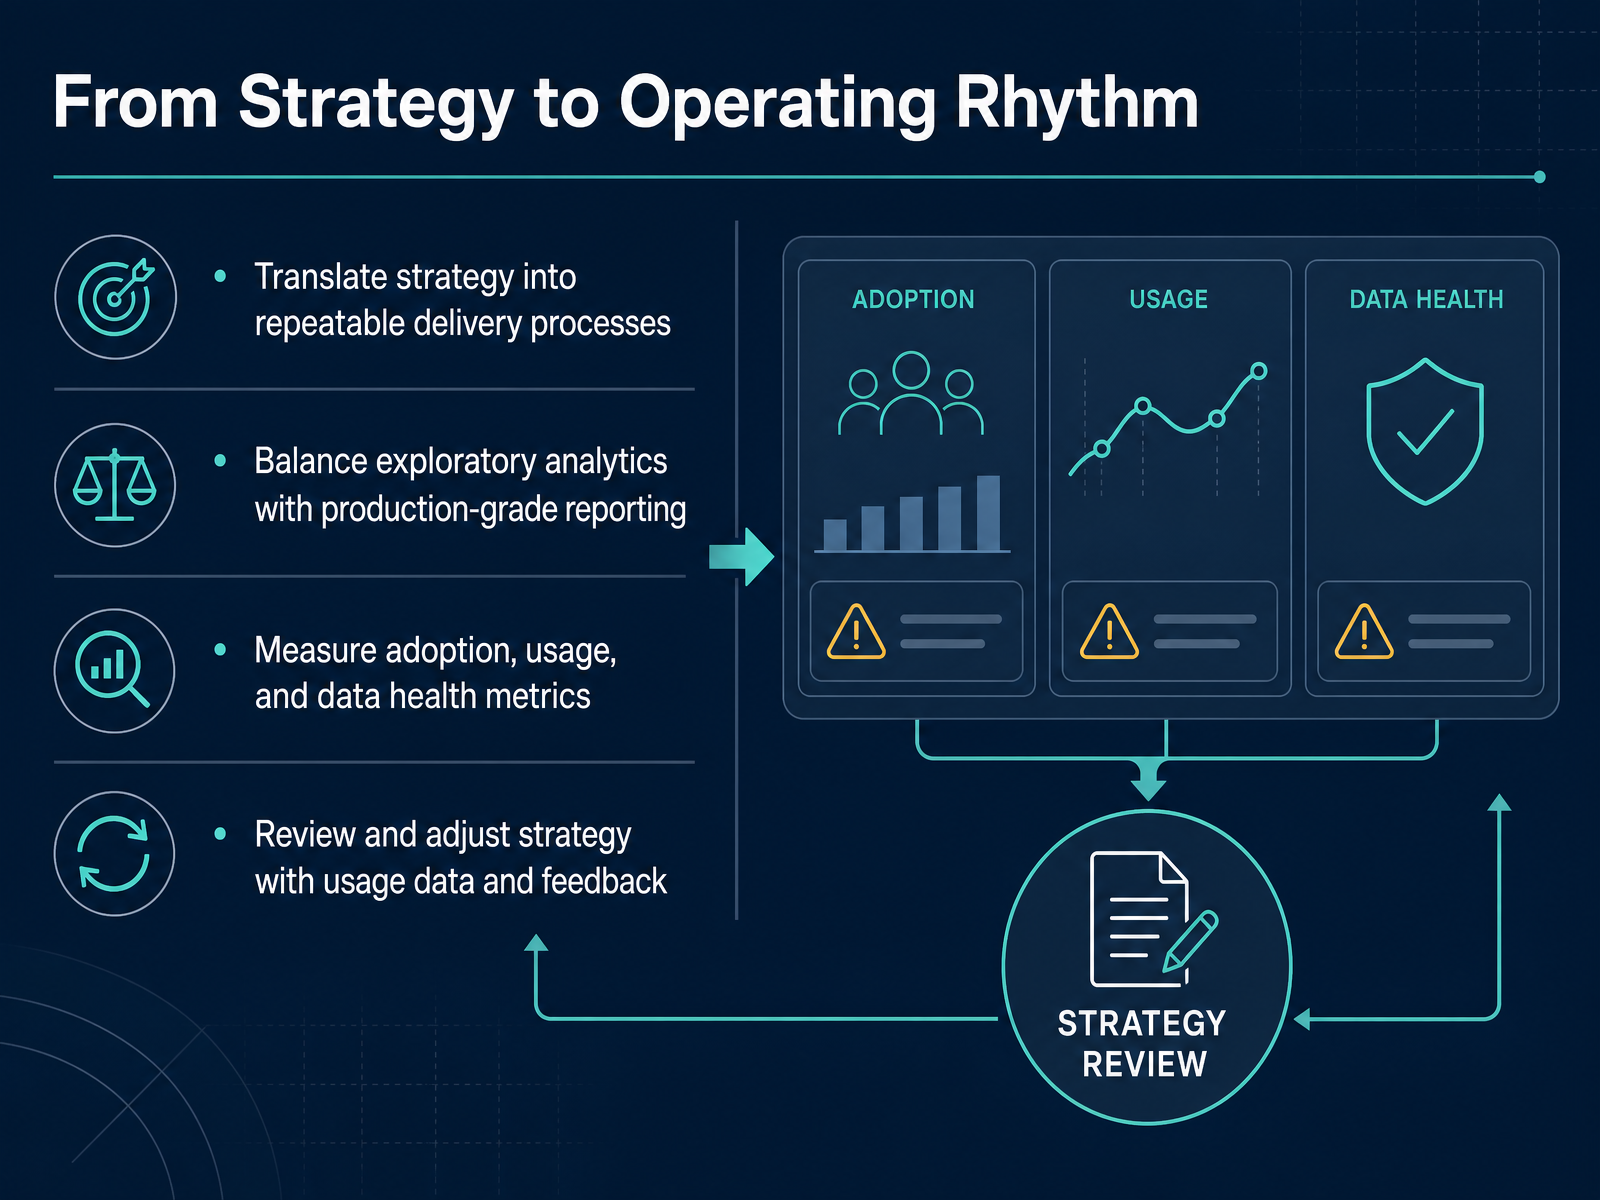
 - 13From Strategy to Operating RhythmNow, let's talk about turning strategy into a steady operating rhythm. A strategy that stays on paper won't change anything. It has to become the way we deliver, measure, and improve analytics work. First, we translate our choices into repeatable processes. That means a defined path from request to release, with clear ownership at each step. Second, we balance two kinds of work. Exploratory analytics needs room to test ideas, but production reporting demands consistency. Without that balance, we either get chaos or a bottleneck. Third, we measure what matters. Track adoption through returning users and actions taken, not just logins. Track data health through freshness, accuracy, and SLA performance. These signals tell us where trust is strong and where it's breaking. Fourth, and this is critical, we review and adjust. Use usage data and direct feedback to decide what to expand, fix, or retire. The operating rhythm is your strategy in motion. It keeps the team aligned with business priorities and prevents the platform from drifting into a report-request queue. Next, we'll look at practical next steps for analysts, data teams, and business leaders.
 techtarget.comdomo.comdomo.com+22 min
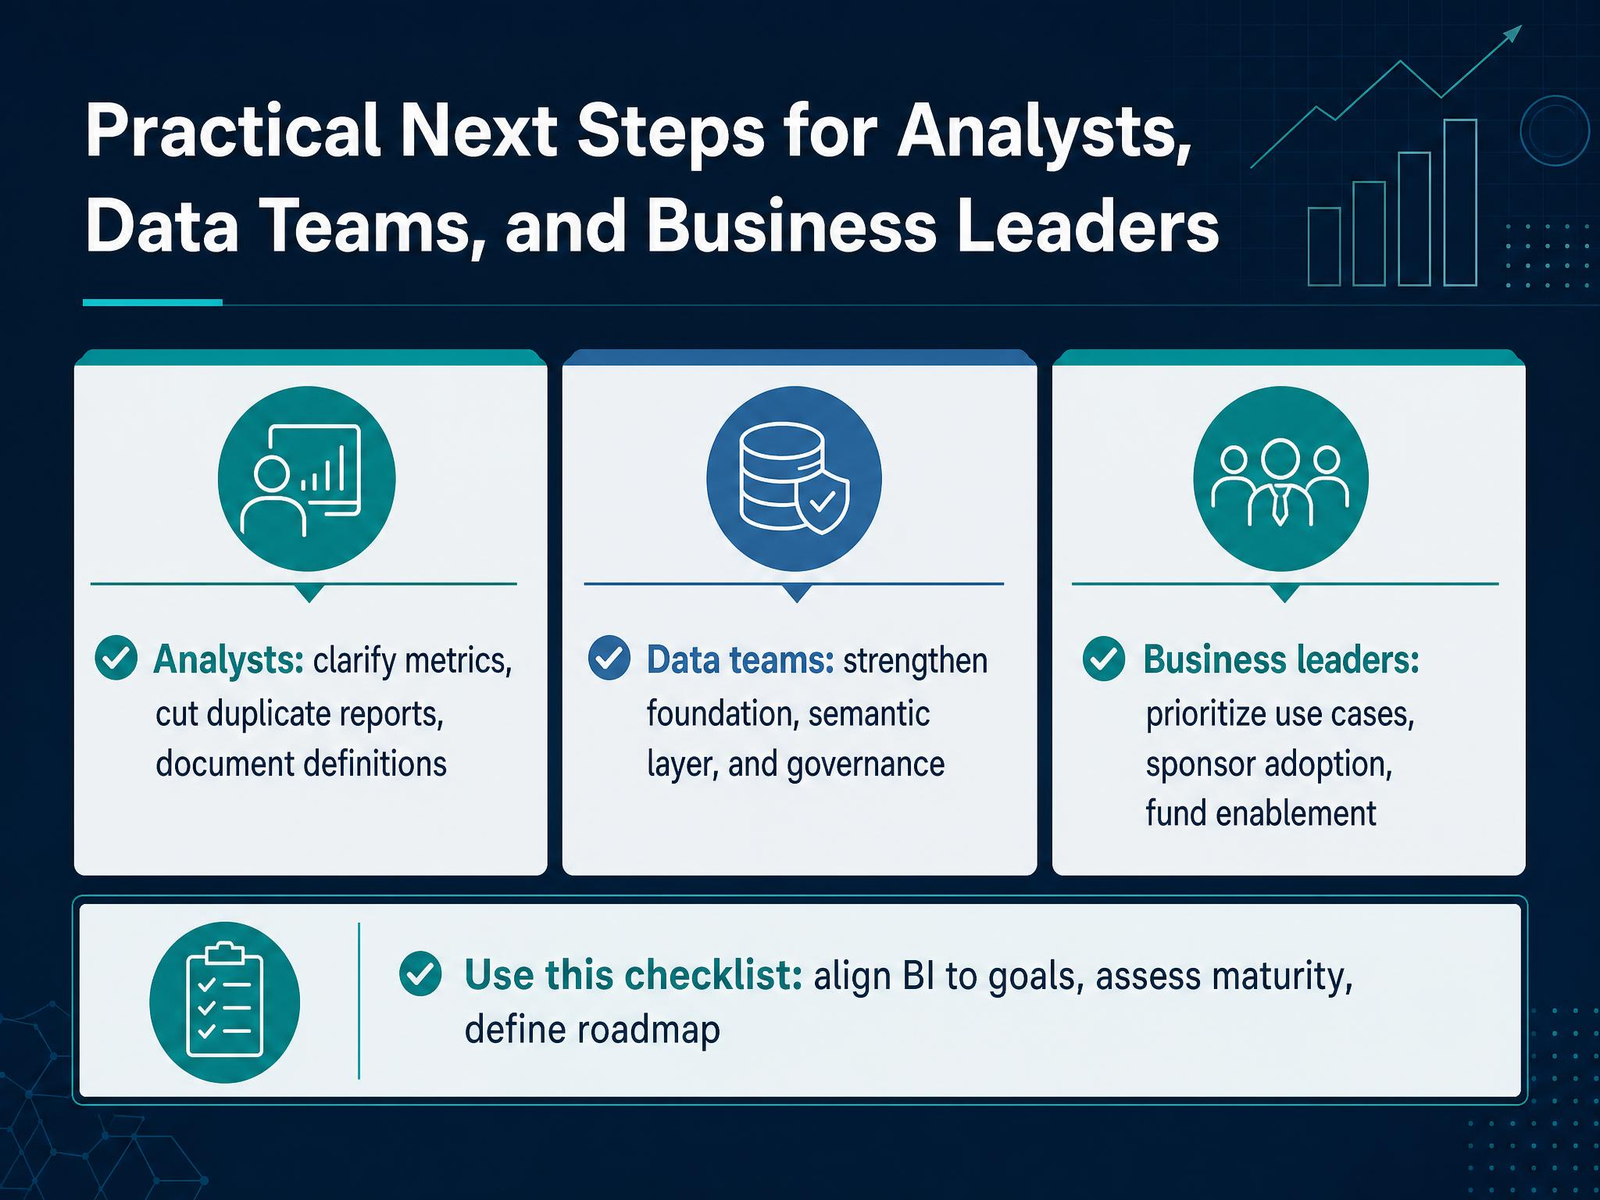
 - 14Practical Next Steps for Analysts, Data Teams, and Business LeadersSo here's how we turn this strategy into action. For analysts, start with the basics: clarify the metrics that matter most, retire duplicate reports that create confusion, and document every definition so the numbers mean the same thing to everyone. For data teams, strengthen the foundation. Invest in a solid semantic layer and governance framework that makes trusted data easy to access. And for business leaders, your role is prioritization and sponsorship. Pick the use cases with the highest return, actively sponsor adoption, and fund the training that makes people confident using the tools. As you begin, use this simple checklist: align your BI efforts to business goals, assess your current maturity honestly, and define a realistic roadmap with milestones. Start small, pick one high-value decision, and prove the value. Thank you for your time today, and good luck building a BI strategy that truly delivers.
 techtarget.com2 min
Take the deck with you
Download this course as a file — free, no sign-up needed.
- PDF handoutEvery slide page, ready to print or share.15 pages · 3.3 MBDownload
- Narrated PowerPointThe deck that presents itself — every slide carries the digital human's narration video.15 pages · 15.2 MBDownload
- PowerPoint slidesThe full deck as a .pptx — open it in PowerPoint, Keynote, or Google Slides.15 pages · 3.2 MBDownload
Free to use in your own training — please keep the PersonWise credit page at the end.
Have your own deck? Turn it into a course
Sources consulted
Web sources consulted while building this course.
- What Is a Business Intelligence Strategy? | Zoho Analytics — zoho.com
- Business Intelligence Strategy: 10 Steps & Examples - Domo — domo.com
- How to Build an Effective Business Intelligence Strategy | TechTarget — techtarget.com
- Developing a Business intelligence Strategy | Tableau — tableau.com
- Business Intelligence Strategy: Steps, Benefits, and more — thoughtspot.com
- How to Build an Effective Business Intelligence Strategy | TechTarget — techtarget.com
- How KPIs Drive Performance in Business Intelligence — domo.com
- How to measure BI performance? 20 KPIs that matter — celonis.com
- Power BI Operating Model for Large Organizations — c-sharpcorner.com
- Centralized vs. Distributed Power BI: And Why Most Organizations End Up Hybrid – Go Analytics — goanalyticsbi.com
- Analytics Operating Model: Fabric Hub-and-Spoke Blog — epcgroup.net
- Right BI Governance Model | Differ — differ.blog
- BI Governance for Enterprises: Centralized vs Decentralized — perceptive-analytics.com
- A framework for governing responsibilities in self-service ... — tandfonline.com
- Data governance for self-service analytics best practices | TechTarget — techtarget.com
- Self-Service Data Products: Governance Framework for Enterprise Teams — promethium.ai
- Seven tips for creating a self-service BI governance strategy — sas.com
- Across the Enterprise — cdn2.hubspot.net
- Data Warehouse to BI Layer Arbitration Patterns: Where the Semantic Layer Should Live | Product Philosophy — productphilosophy.com
- Testing Meaning, Not Just Rows: Data Quality at the Semantic Layer | Coginiti Blog — coginiti.co