Begin
14 pages · ~28 min
Practical Business Analytics Learning Workflow
This training teaches a practical workflow for learning business analytics, helping aspiring analysts and professionals build skills to analyze data and drive business decisions.
A digital instructor presents all 14 pages. Hold “Ask” at any point and ask out loud — the answer comes from this course. No sign-up needed.
What you’ll learn
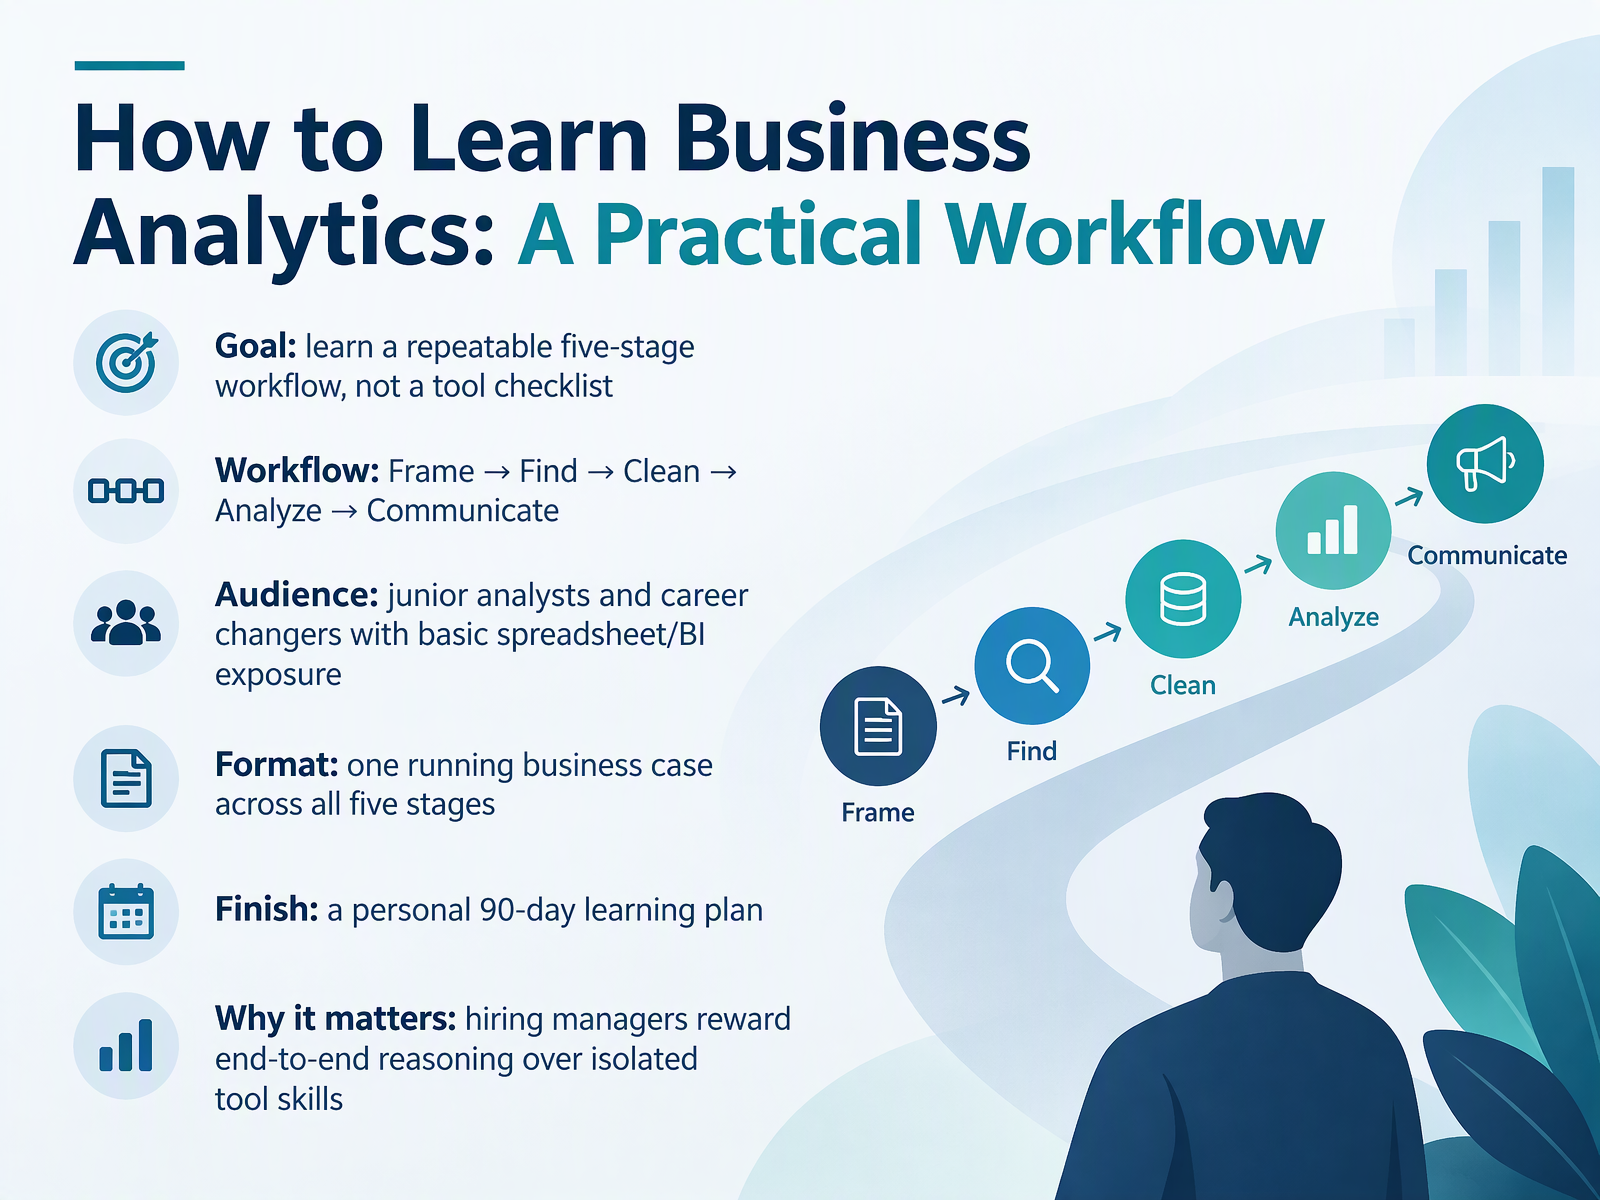
- 01How to Learn Business Analytics: A Practical WorkflowWelcome. This course is about learning business analytics as a practical workflow. Our goal is simple. You will learn a repeatable five-stage process, not a checklist of tools. The stages are Frame, Find, Clean, Analyze, and Communicate. Frame means defining the business question. Find means locating the right data. Clean means fixing errors and gaps. Analyze means turning data into insight. Communicate means explaining what it means and what to do next. This is built for junior analysts and career changers who already have basic spreadsheet or BI exposure. We will use one running business case across all five stages, so you see how each step connects to the next. By the end, you will have a personal ninety-day learning plan. Why does this matter? Hiring managers reward end-to-end reasoning over isolated tool skills. They want to see how you think from question to recommendation. Next, we will look at what business analysts actually do day to day.2 min
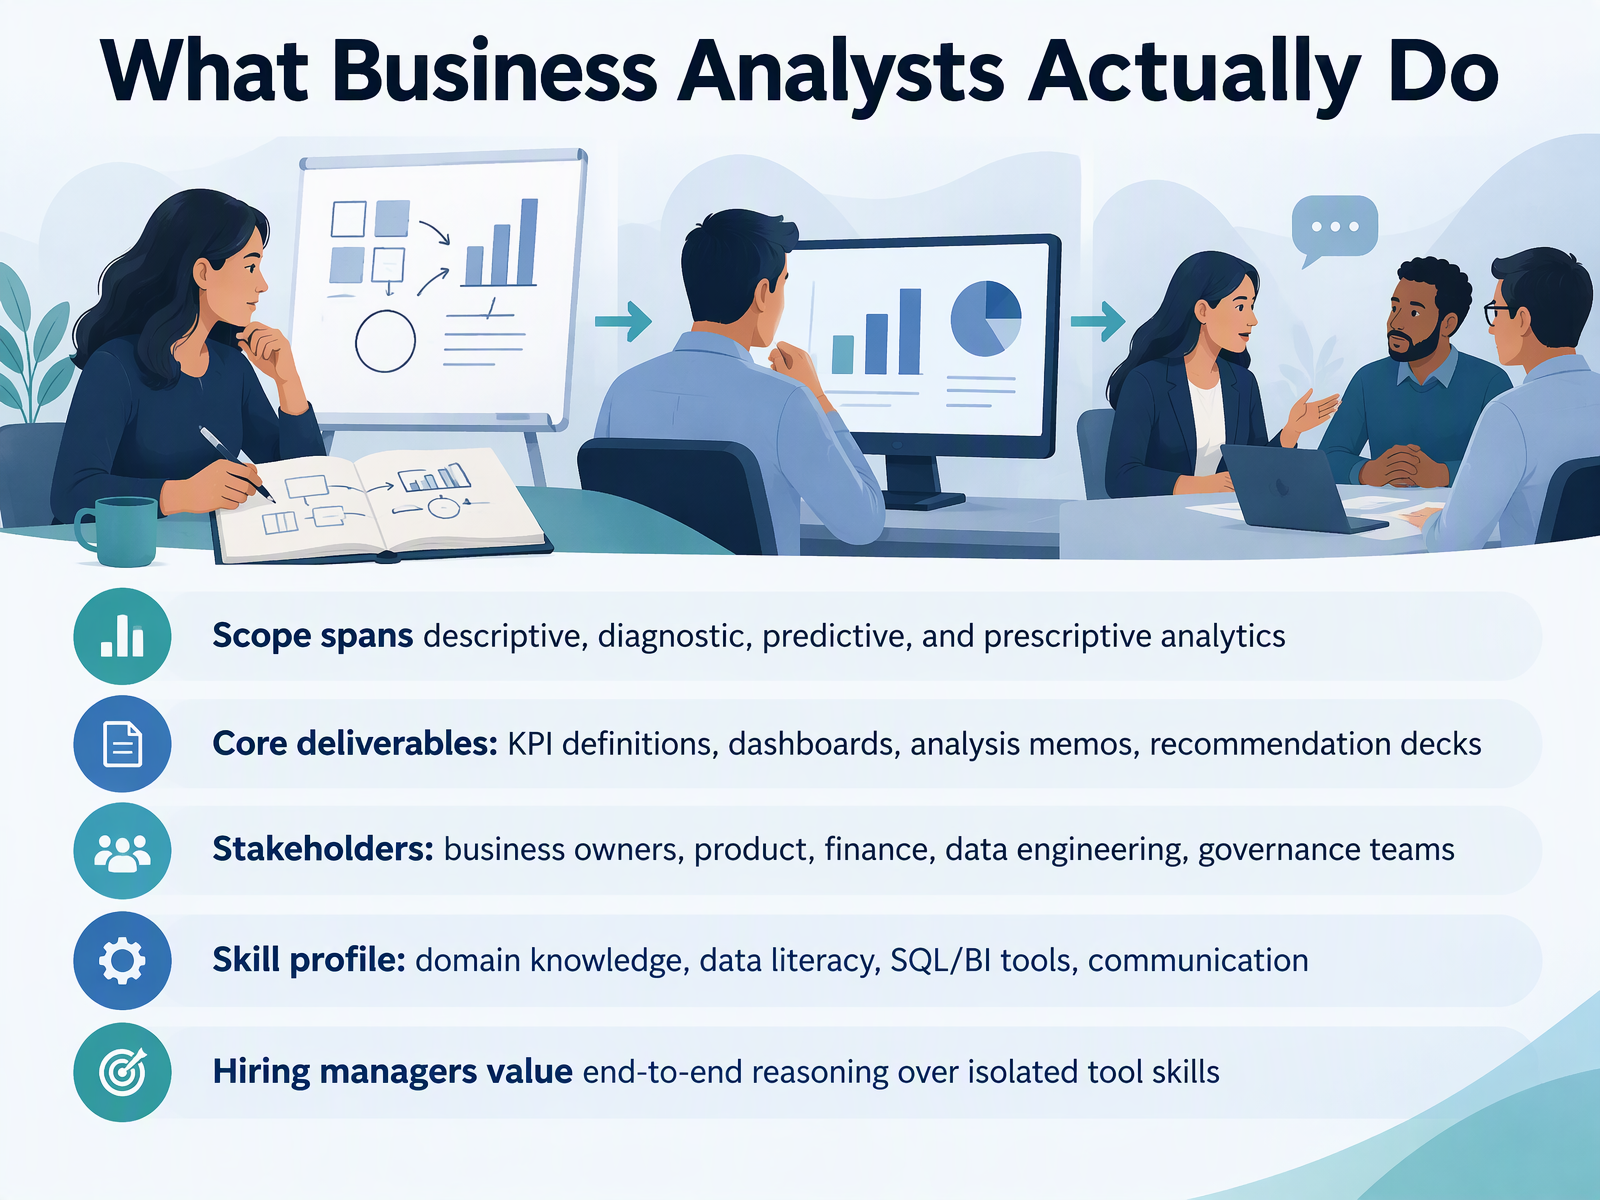
- 02What Business Analysts Actually DoLet's get concrete about the role itself. Business analysts work across four types of analytics: descriptive, which explains what happened; diagnostic, which explains why; predictive, which forecasts what's likely next; and prescriptive, which recommends an action. In practice, that means producing KPI definitions, dashboards, analysis memos, and recommendation decks. KPI simply means key performance indicator, the metric a business tracks. For example, a memo might define active customer and show how it moved last quarter. You'll partner with business owners, product, finance, data engineering, and governance teams. The skill profile combines domain knowledge, data literacy, SQL and BI tools, and communication. When the numbers don't line up, check the source first. That's normal. Hiring managers look for end-to-end reasoning, not isolated tool skills. Next, we'll sort out the analyst titles.
 2 min
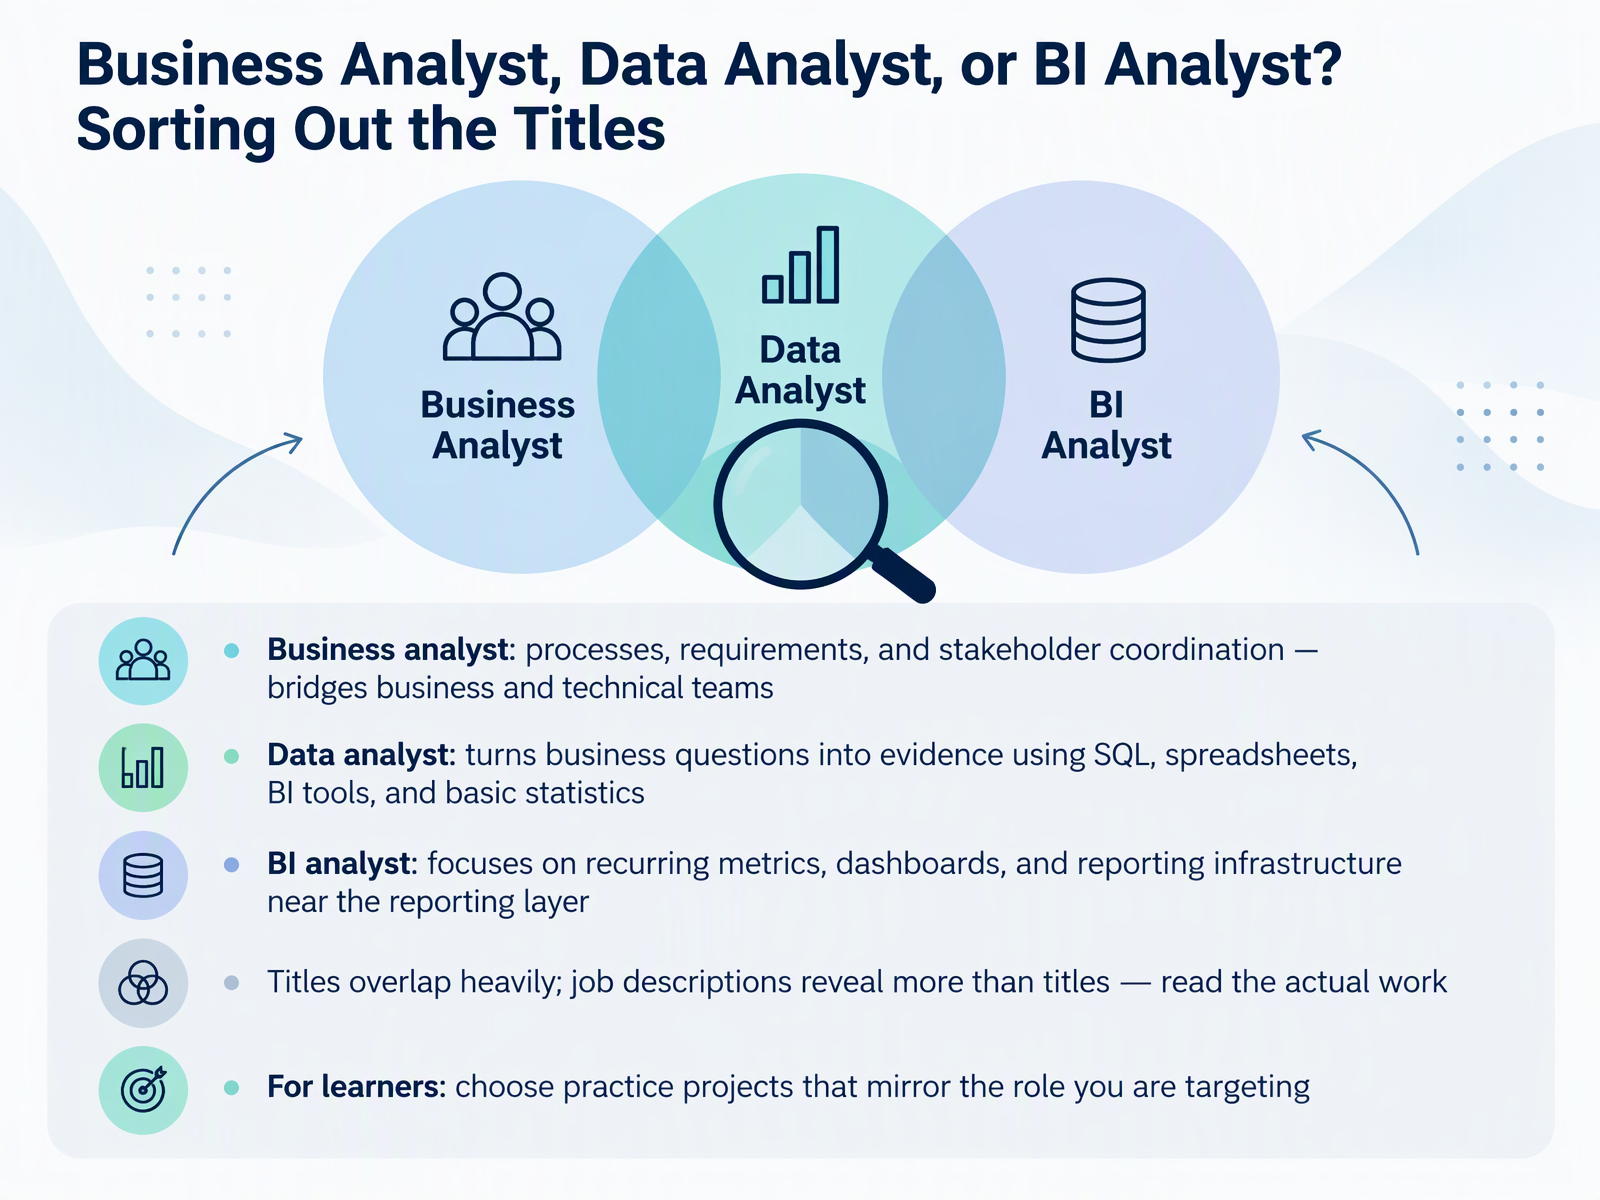
- 03Business Analyst, Data Analyst, or BI Analyst? Sorting Out the TitlesLet's clear up something that trips up a lot of people early on: the job titles. A business analyst works on processes, requirements, and stakeholder coordination. Think of them as the bridge between business and technical teams. A data analyst turns business questions into evidence, using SQL, spreadsheets, BI tools, and basic statistics. SQL, by the way, is the query language used to pull data from databases. And a BI analyst focuses on recurring metrics, dashboards, and reporting infrastructure, close to the reporting layer. Here's the practical part. These titles overlap heavily. Job descriptions reveal more than titles do. So read the actual work. For your practice projects, choose ones that mirror the role you're targeting. If you want BI work, build a dashboard with a recurring refresh. If you want data analysis, start from a question and prove it with a query. Next, we'll look at the workflow itself. The Five-Stage Workflow at a Glance.
 2 min
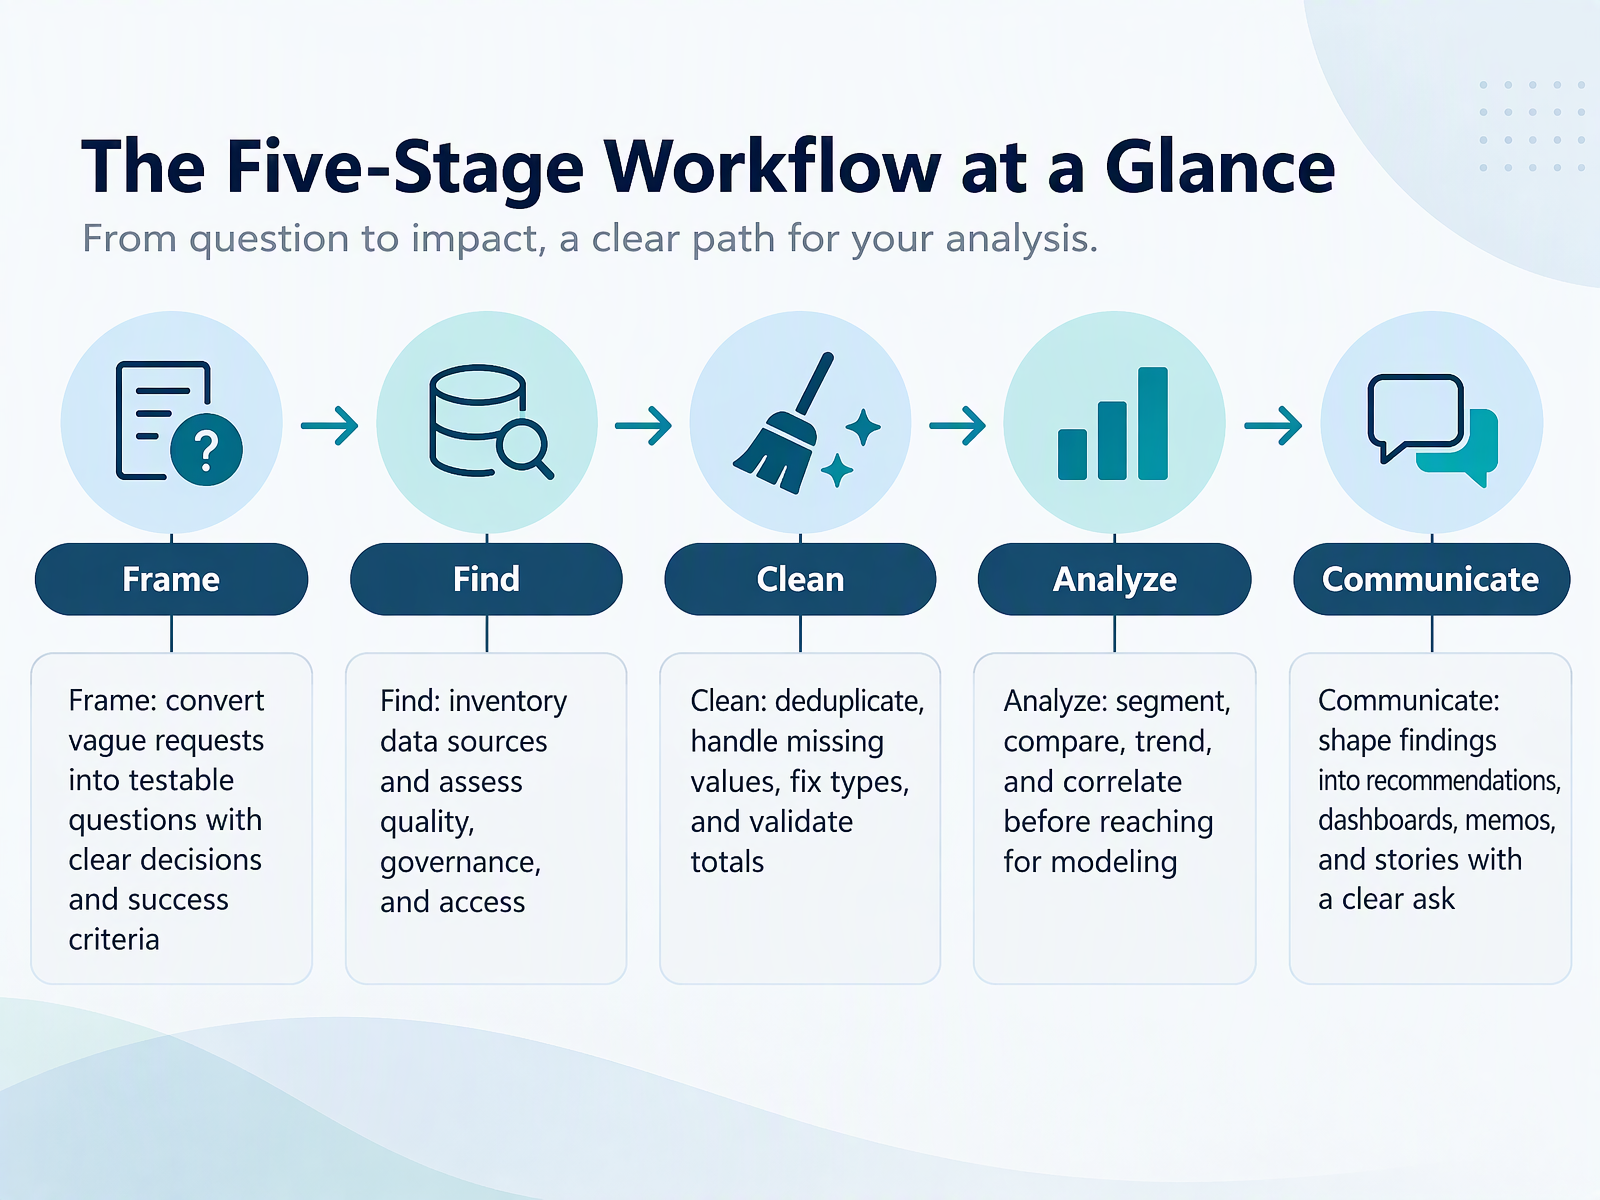
- 04The Five-Stage Workflow at a GlanceLet's walk through the full workflow at a glance. There are five stages, and they build on each other. First, Frame. You convert a vague request into a testable question. That means defining the decision it supports and your success criteria. For example, instead of 'look at sales,' ask whether discounting in the West region is increasing revenue per unit. Second, Find. You inventory your data sources. Then you assess quality, governance, and access before you trust anything. Third, Clean. You deduplicate rows, handle missing values, fix data types, and validate totals against a known source. When the numbers don't line up, check the source first. Fourth, Analyze. You segment, compare, trend, and correlate before reaching for modeling. Simple comparisons often answer the question. Fifth, Communicate. You shape findings into recommendations, dashboards, memos, and stories with one clear ask. Keep this map in mind. The stages are sequential, but you will often loop back. Next, we start with Stage one, Frame the Business Question First.
 2 min
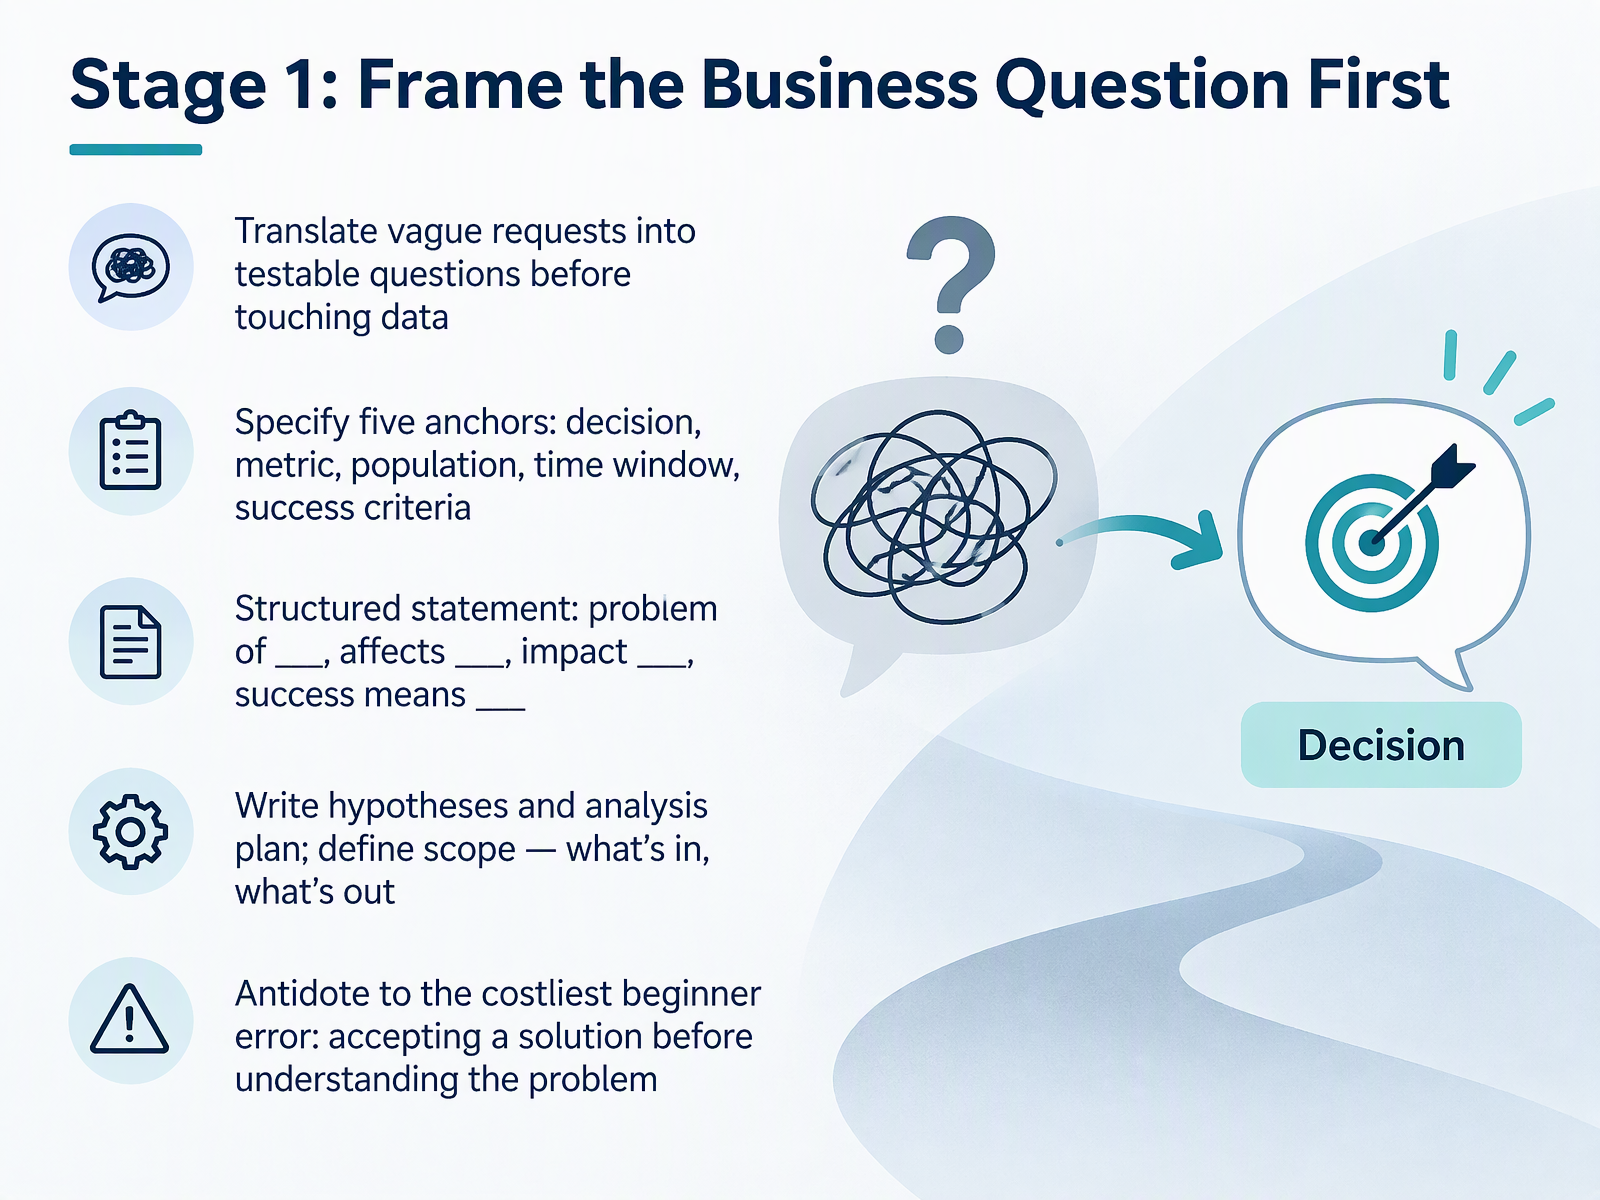
- 05Stage 1: Frame the Business Question FirstNow let's start with framing the business question before you touch any data. A stakeholder says, we need better reporting. That's vague. Your first job is to translate it into a testable question. What decision will this reporting change? Then pin down five anchors: the decision, the metric, the population, the time window, and the success criteria. Write it as a structured statement: problem of blank, affects blank, impact blank, success means blank. For example, problem of slow refunds, affects online customers, impact is lost repeat purchases, success means cutting refund time by two days. Next, write your hypotheses and an analysis plan. Define scope clearly, what's in and what's out. This prevents the costliest beginner error, accepting a solution before you understand the problem. When the numbers don't line up later, you'll have a clear question to check against. With a solid question in hand, we move on to Stage 2: Find and Evaluate Data Sources.
 1 min
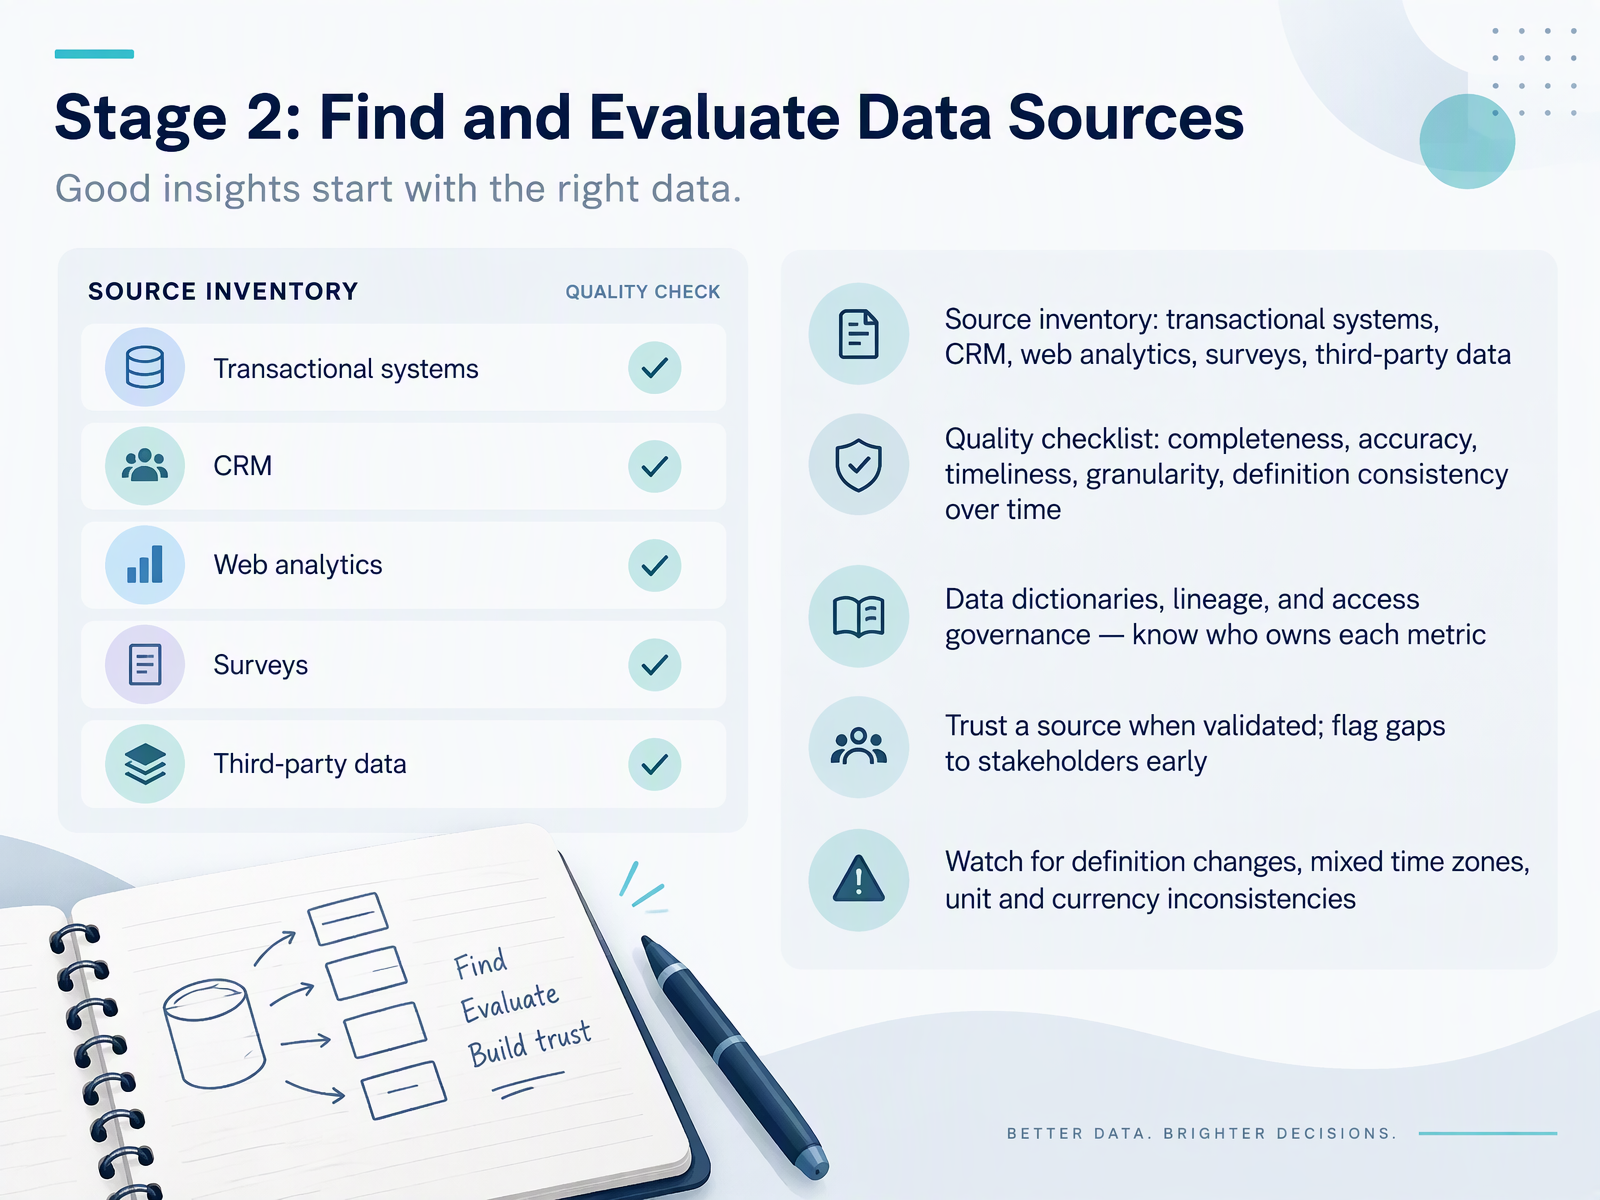
- 06Stage 2: Find and Evaluate Data SourcesNow let's move to Stage Two: find and evaluate data sources. First, build a source inventory. List where your data actually lives. Transactional systems hold orders and payments. Your CRM holds customer records. Web analytics tracks site behavior. Surveys capture feedback. Third-party data fills gaps. Next, run a quality checklist. Check completeness, accuracy, timeliness, granularity, and definition consistency over time. A data dictionary defines each field. Lineage shows where it came from. Access governance tells you who owns each metric. Trust a source once it has been validated. When the numbers don't line up, check the source first. Flag gaps to stakeholders early. Watch for definition changes, mixed time zones, and unit or currency inconsistencies. For example, a revenue field may switch from dollars to euros mid-year. That will distort any trend. Once sources are clear, we move to Stage Three: Clean, Prepare, and Validate Data.
 2 min
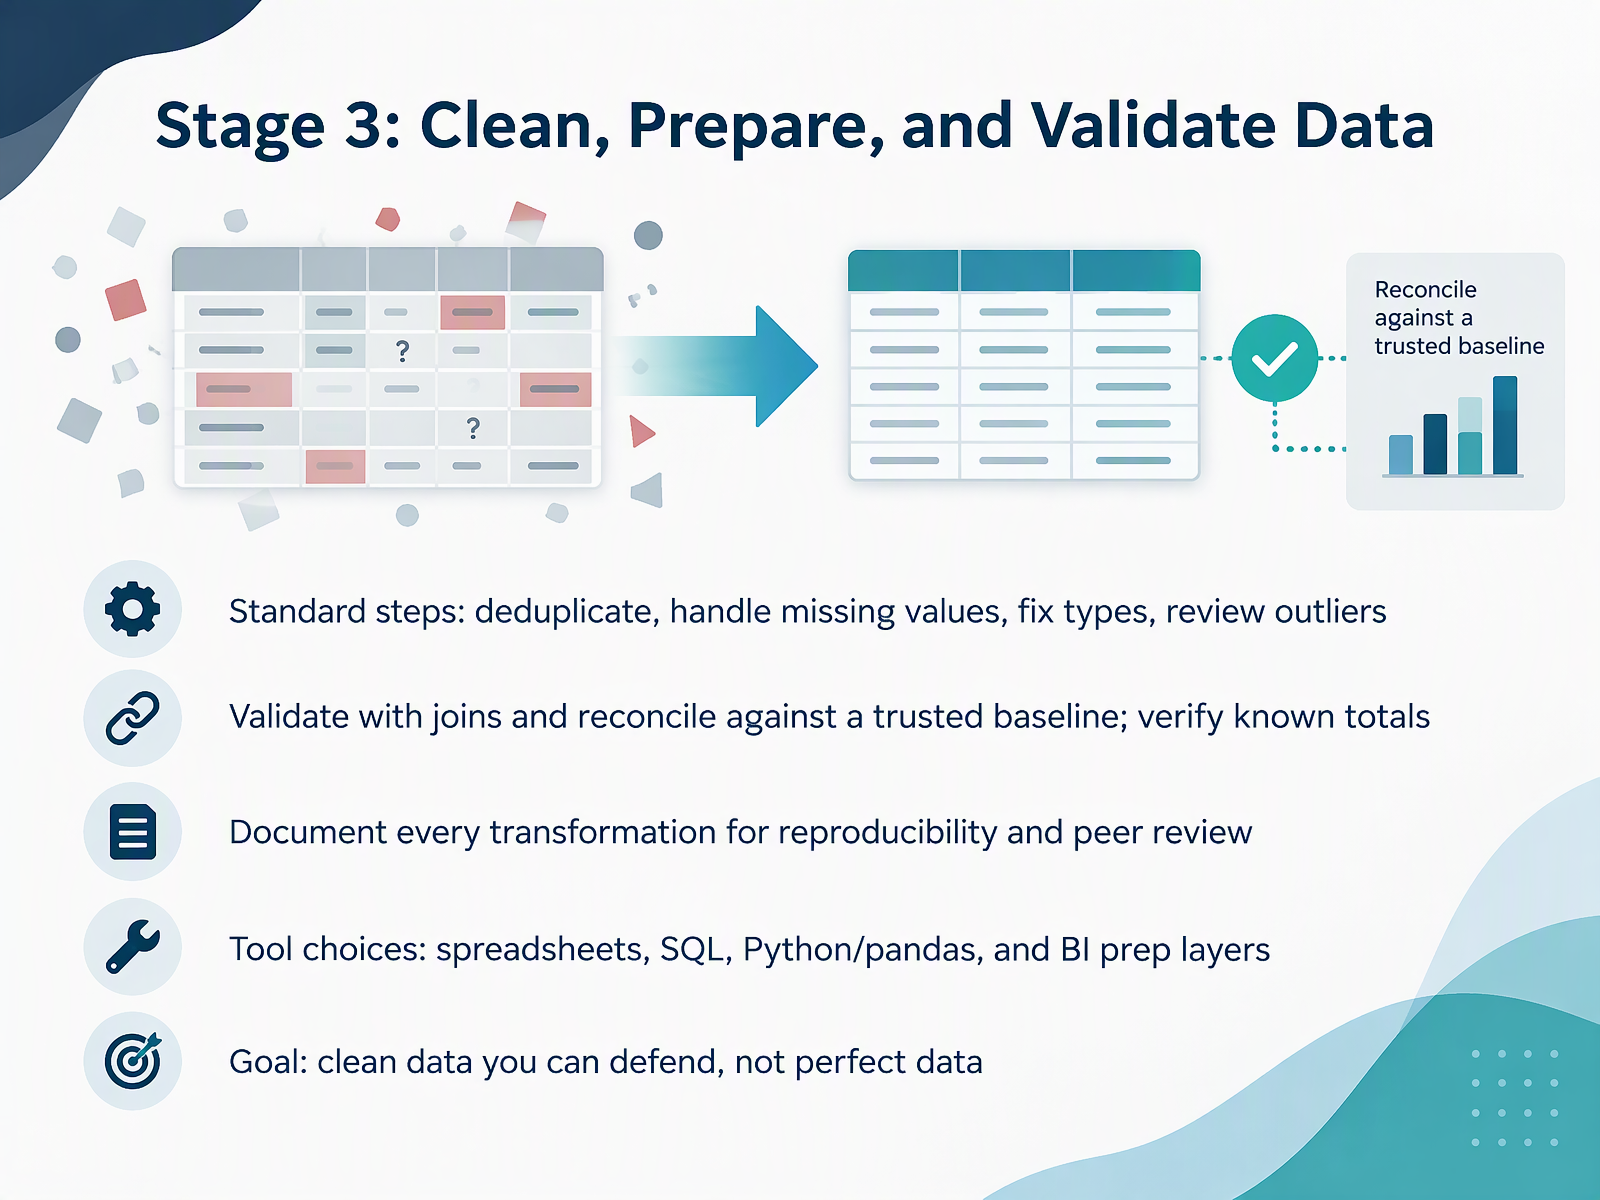
- 07Stage 3: Clean, Prepare, and Validate DataNow we move into Stage Three: clean, prepare, and validate the data. Start with the standard steps. Deduplicate rows, so one event isn't counted twice. Handle missing values, by deciding whether to drop, fill, or flag them. Fix data types, like dates stored as text. Then review outliers, because a single extreme value can pull an average off course. For validation, use joins to cross-check records and reconcile totals against a trusted baseline. For example, compare your monthly revenue total to the finance ledger. When the numbers don't line up, check the source first. Document every transformation, so a colleague can reproduce and review your work. Tool choice depends on the task: spreadsheets for quick checks, SQL for large tables, Python with pandas for repeatable rules, and business intelligence prep layers for shared pipelines. Your goal is clean data you can defend, not perfect data. That sets up the next stage, where we analyze with the right method.
 2 min
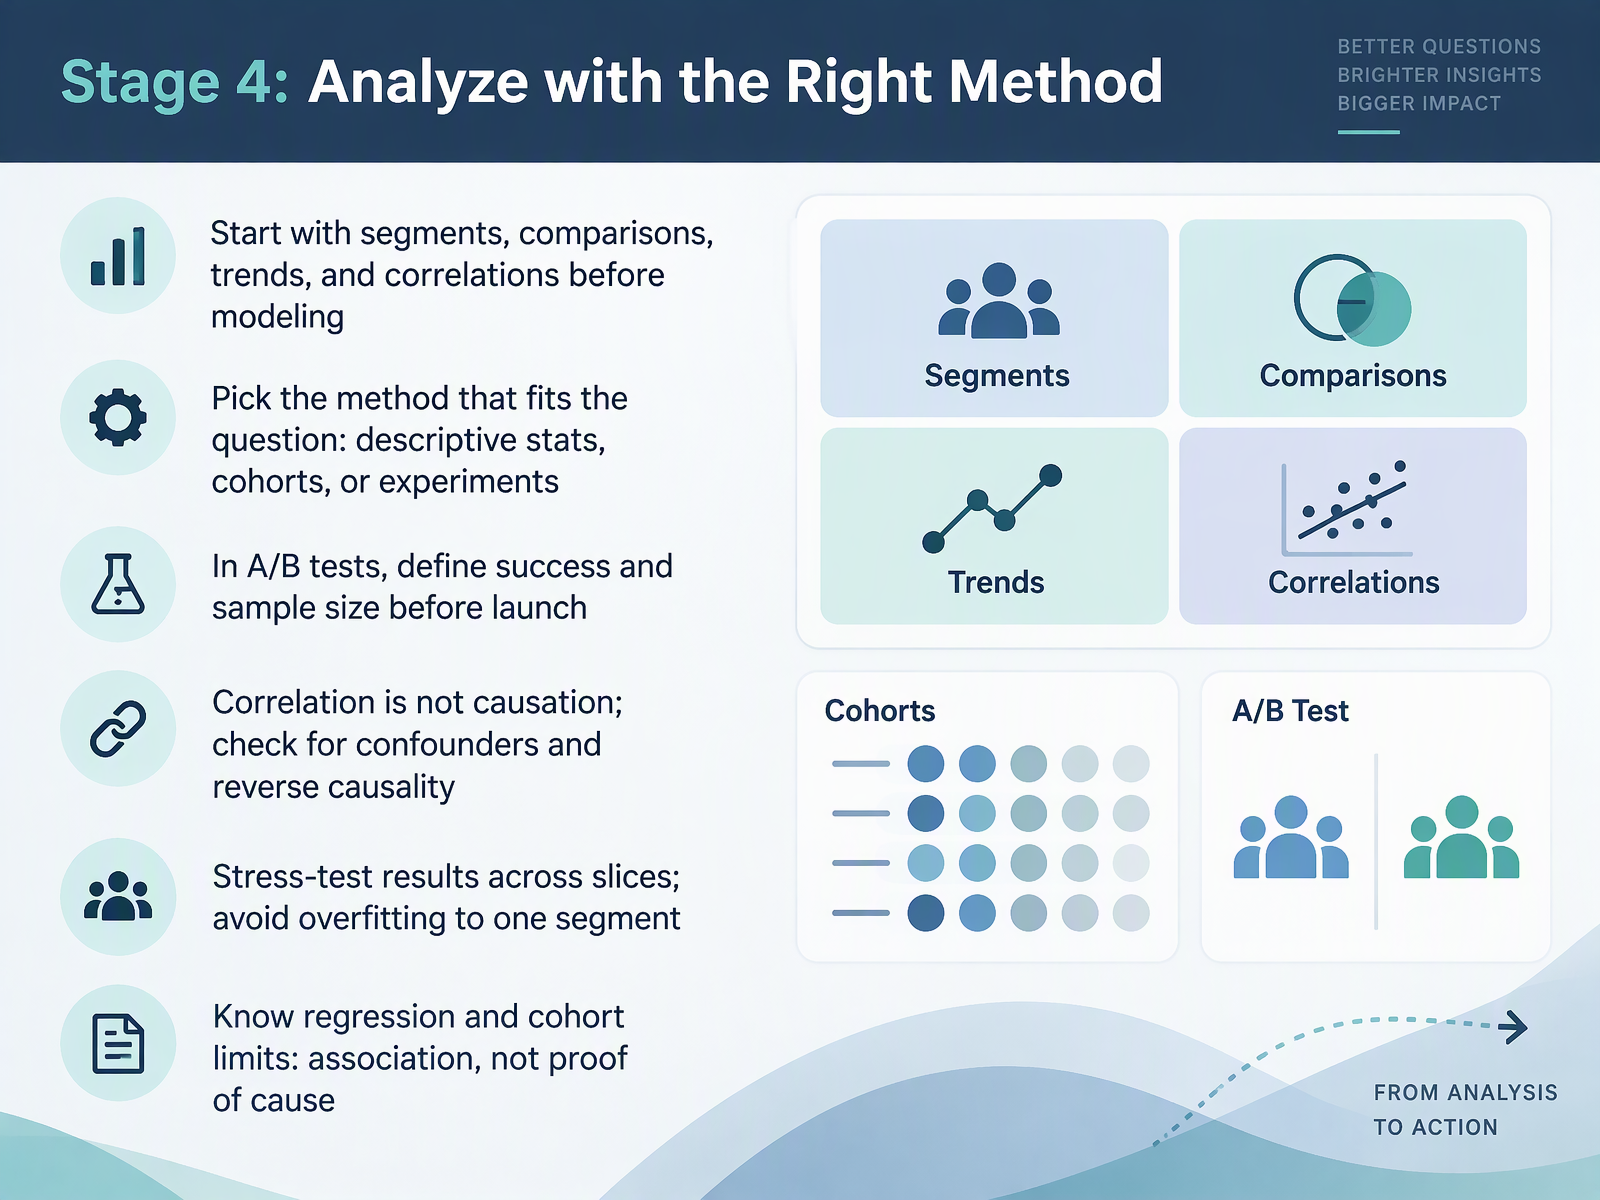
- 08Stage 4: Analyze with the Right MethodNow we move into analysis, into Stage 4, where you choose the right method for the question. Before you build any model, start simple. Run segments, comparisons, trends, and correlations. A segment is just a slice of your data, like new customers versus returning ones. For example, before predicting churn, compare churn rates by segment. Then pick the method that fits the question: descriptive statistics, cohorts, or experiments. If you run an A/B test, define success and sample size before launch. Remember, correlation is not causation. Check for confounders, which are hidden factors that affect both variables, and for reverse causality. Stress-test results across slices, and avoid overfitting to one segment. Know the limits of regression and cohort analysis: they show association, not proof of cause. When the numbers don't line up, check the source first. That leads us to Stage 5: Turn Findings into Business Recommendations.
 1 min
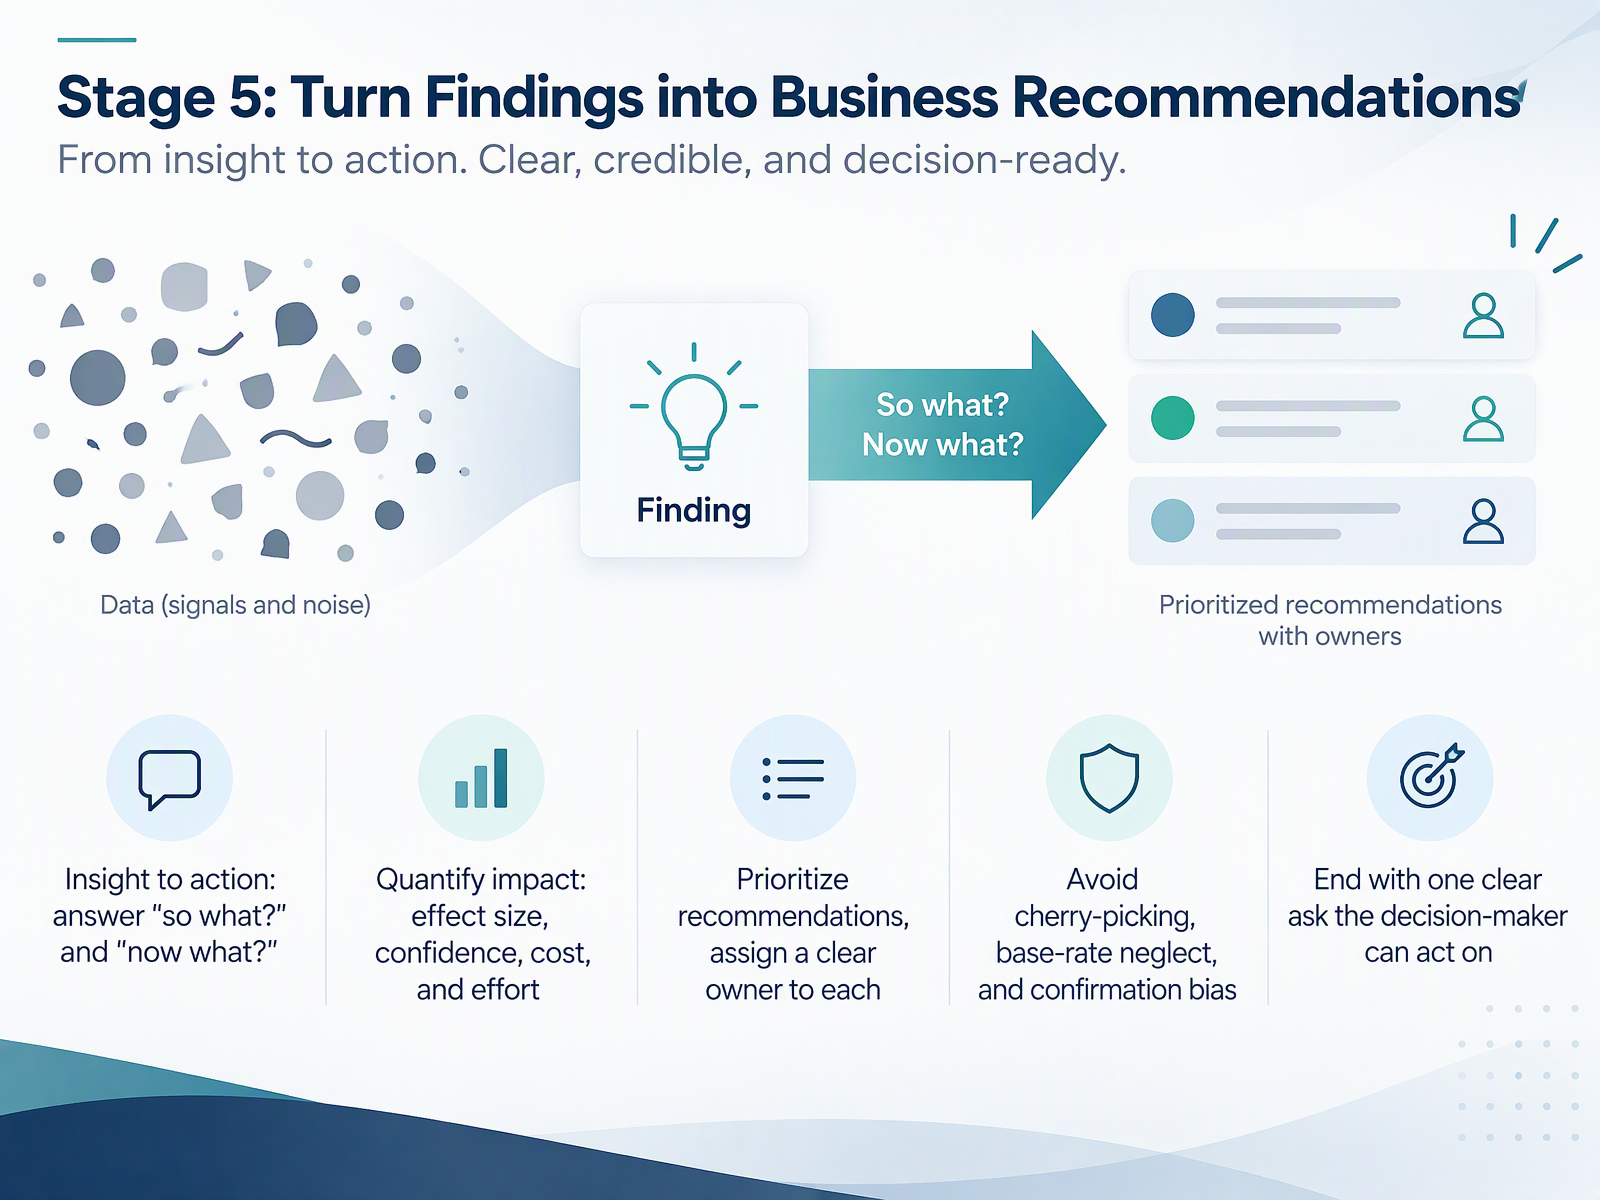
- 09Stage 5: Turn Findings into Business RecommendationsNow let's move to the fifth stage. Turning findings into business recommendations. This is where analysis becomes action. Start by answering two questions for every finding. So what, and now what? For example, if churn rose five percent last quarter, so what means revenue is at risk, and now what means here is a fix. Next, quantify the impact. State the effect size, your confidence level, the cost, and the effort required. Then rank the recommendations and give each one a clear owner. A name, not a team. Watch for three common traps. Cherry-picking, which means choosing only data that supports your view. Base-rate neglect, which means ignoring the usual frequency of an event. And confirmation bias, which means favoring evidence you already agree with. When the numbers don't line up, check the source first. That is normal. Finally, close with one clear ask the decision-maker can act on. Not a list, one ask. That gives them a real choice. Next, we will look at how to communicate all this with dashboards, memos, and stories.
 2 min
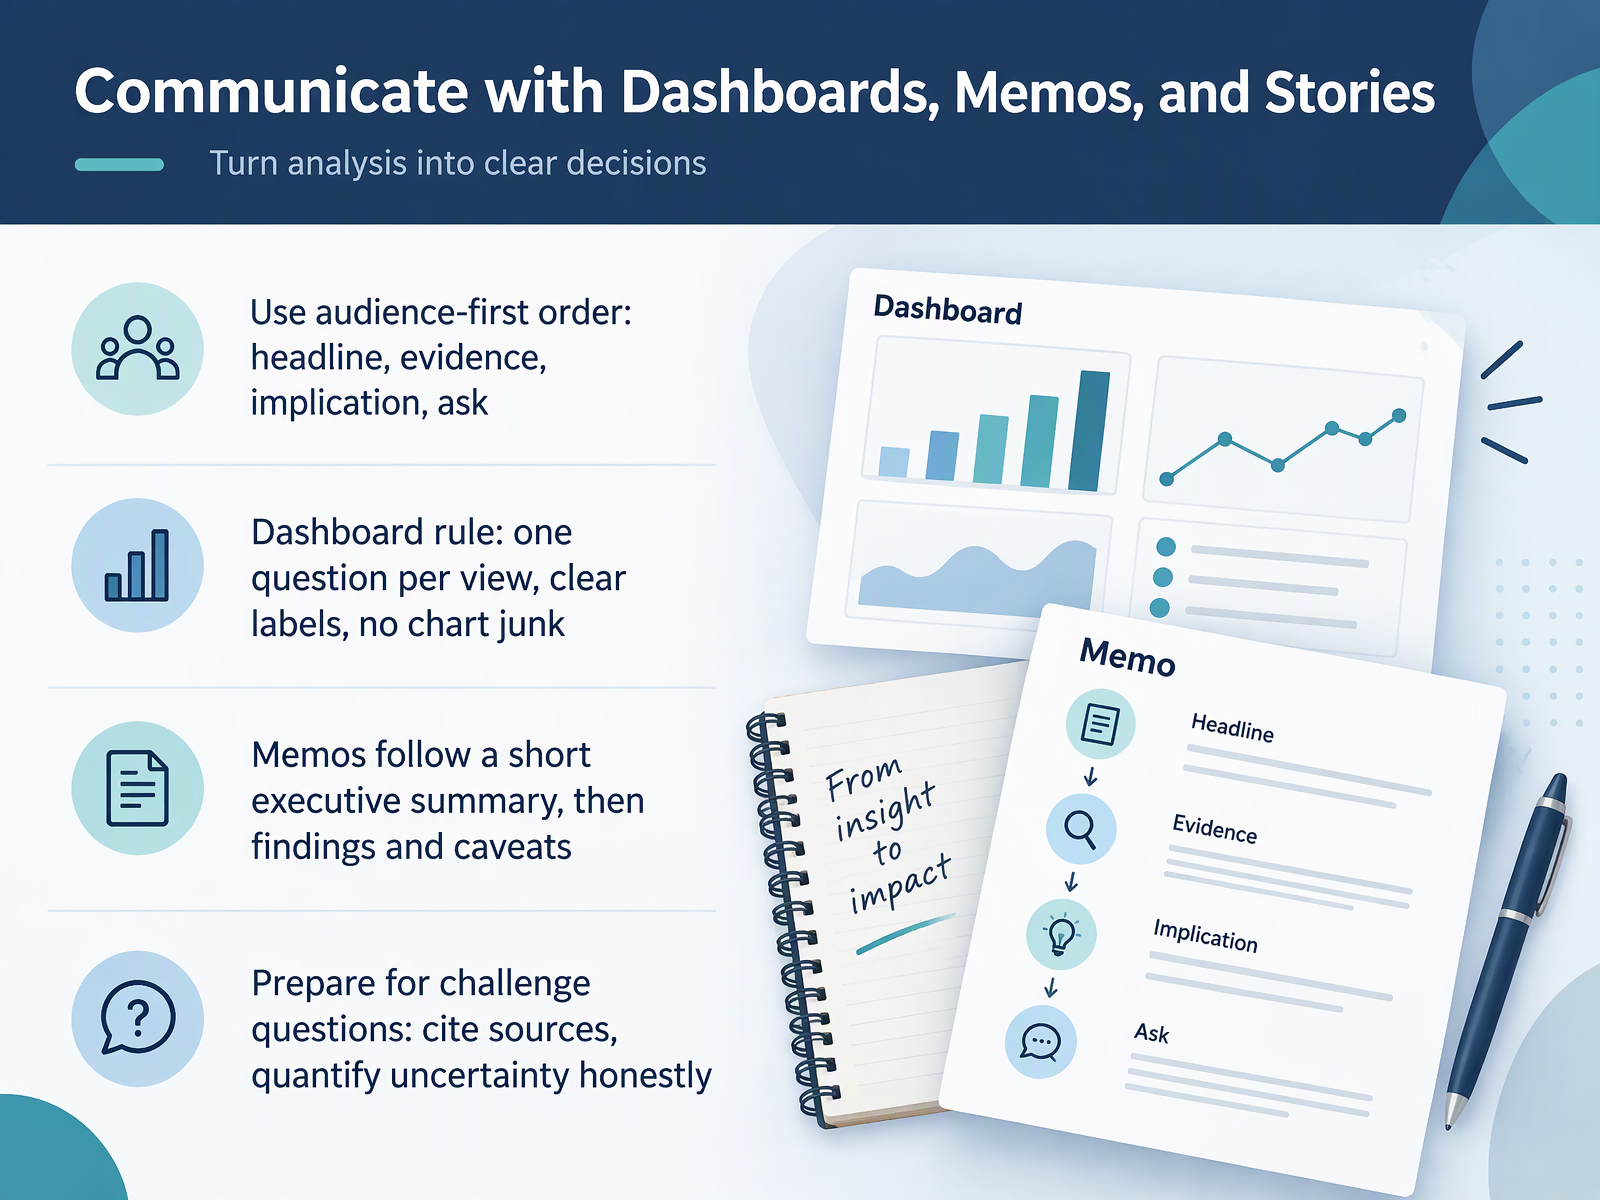
- 10Communicate with Dashboards, Memos, and StoriesLet's move on to how you communicate the work. Deliver in audience-first order: headline, then evidence, then implication, then the ask. Lead with the conclusion. For example, open with "Churn is rising in the mid-market," then show the trend line, state what it costs, and ask for a decision on retention spend.
For dashboards, keep one question per view, label axes clearly, and remove chart junk. Chart junk is decoration that adds no information, like heavy gridlines or three-dimensional bars.
Memos follow a short executive summary, then findings and caveats. List your sources and your assumptions. When the numbers don't line up, check the source first.
Prepare for challenge questions. Cite your sources, and quantify uncertainty honestly. Say "plus or minus ten percent" instead of "about right." Next, we put this into practice with one question, end to end.
 2 min
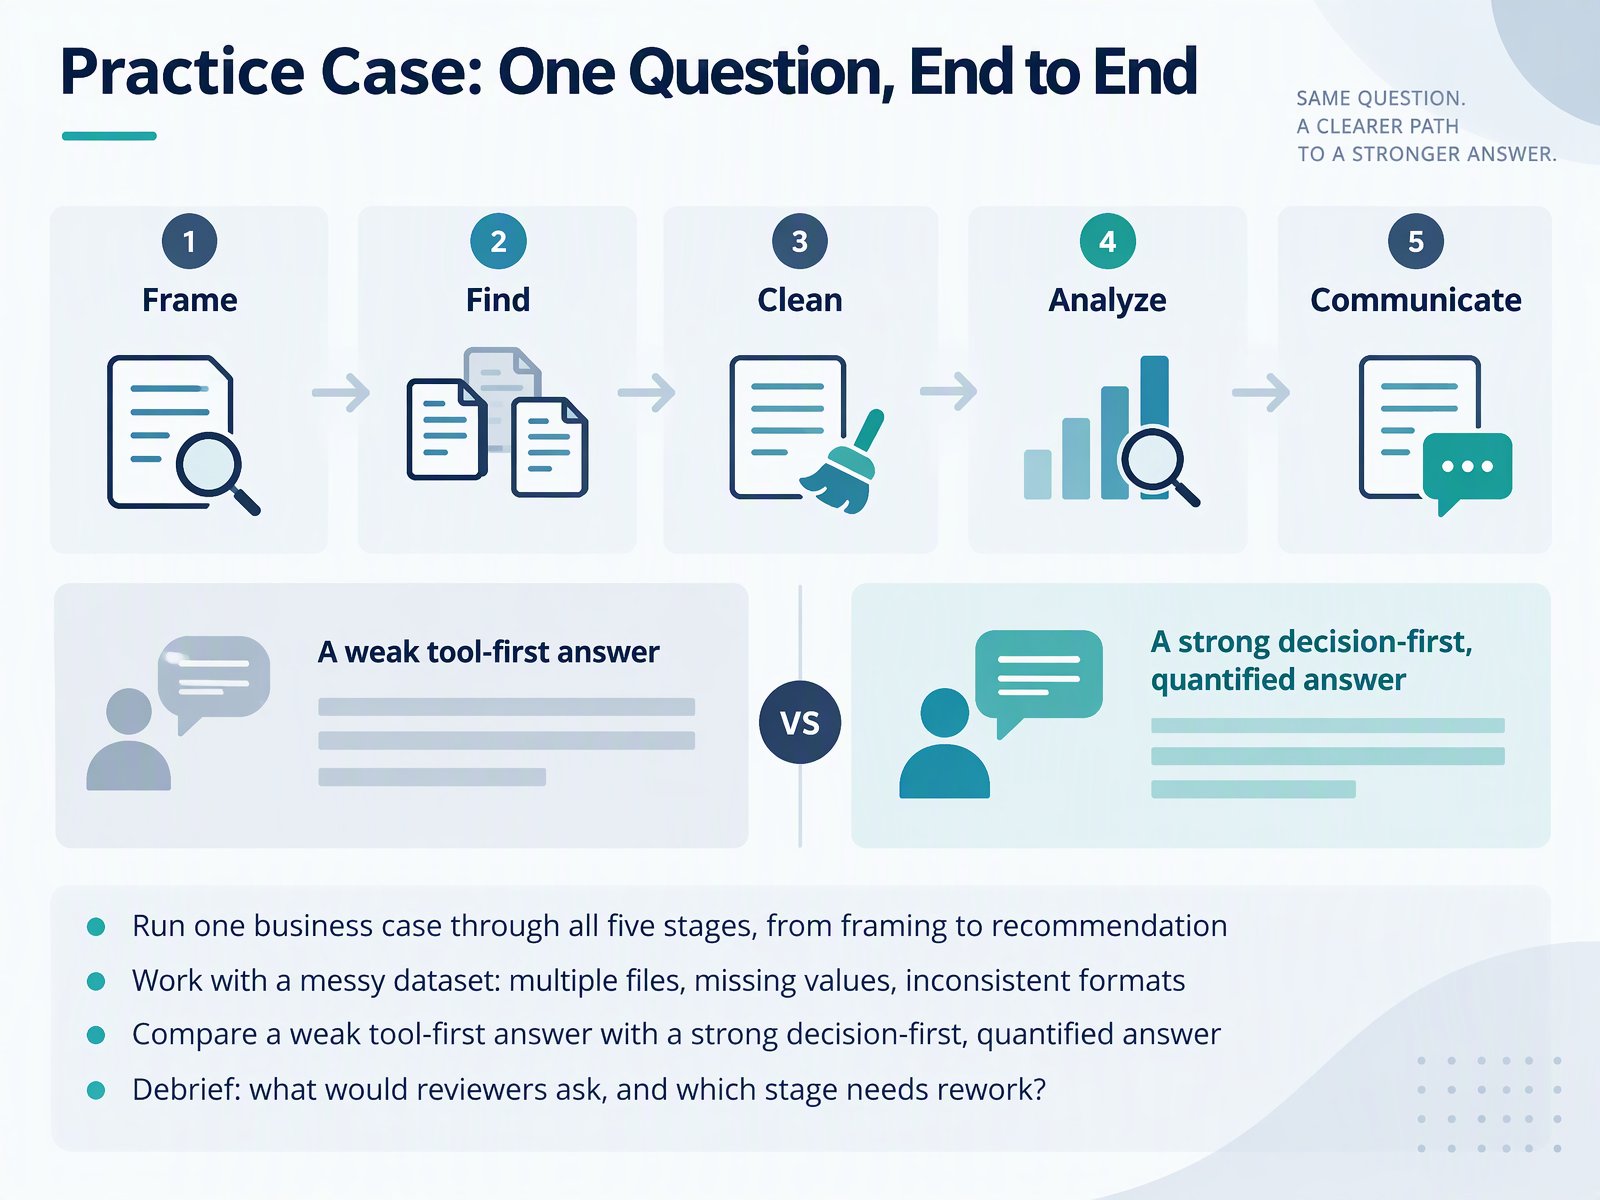
- 11Practice Case: One Question, End to EndNow let's put all five stages into one practice case. Pick a single business question, say why customer churn rose last quarter, and run it end to end, from framing to recommendation. Use a messy dataset on purpose: several files, missing values, and inconsistent formats. A weak tool-first answer starts by opening a spreadsheet and charts whatever is easy. A strong decision-first answer starts with the decision, then quantifies it, for example, high-risk accounts renewing within sixty days represent about four hundred thousand dollars in exposure. When the numbers don't line up, check the source first. Then debrief. Ask what a reviewer would challenge, and which stage needs rework. Next, we build a 90-Day Learning Plan.
 1 min
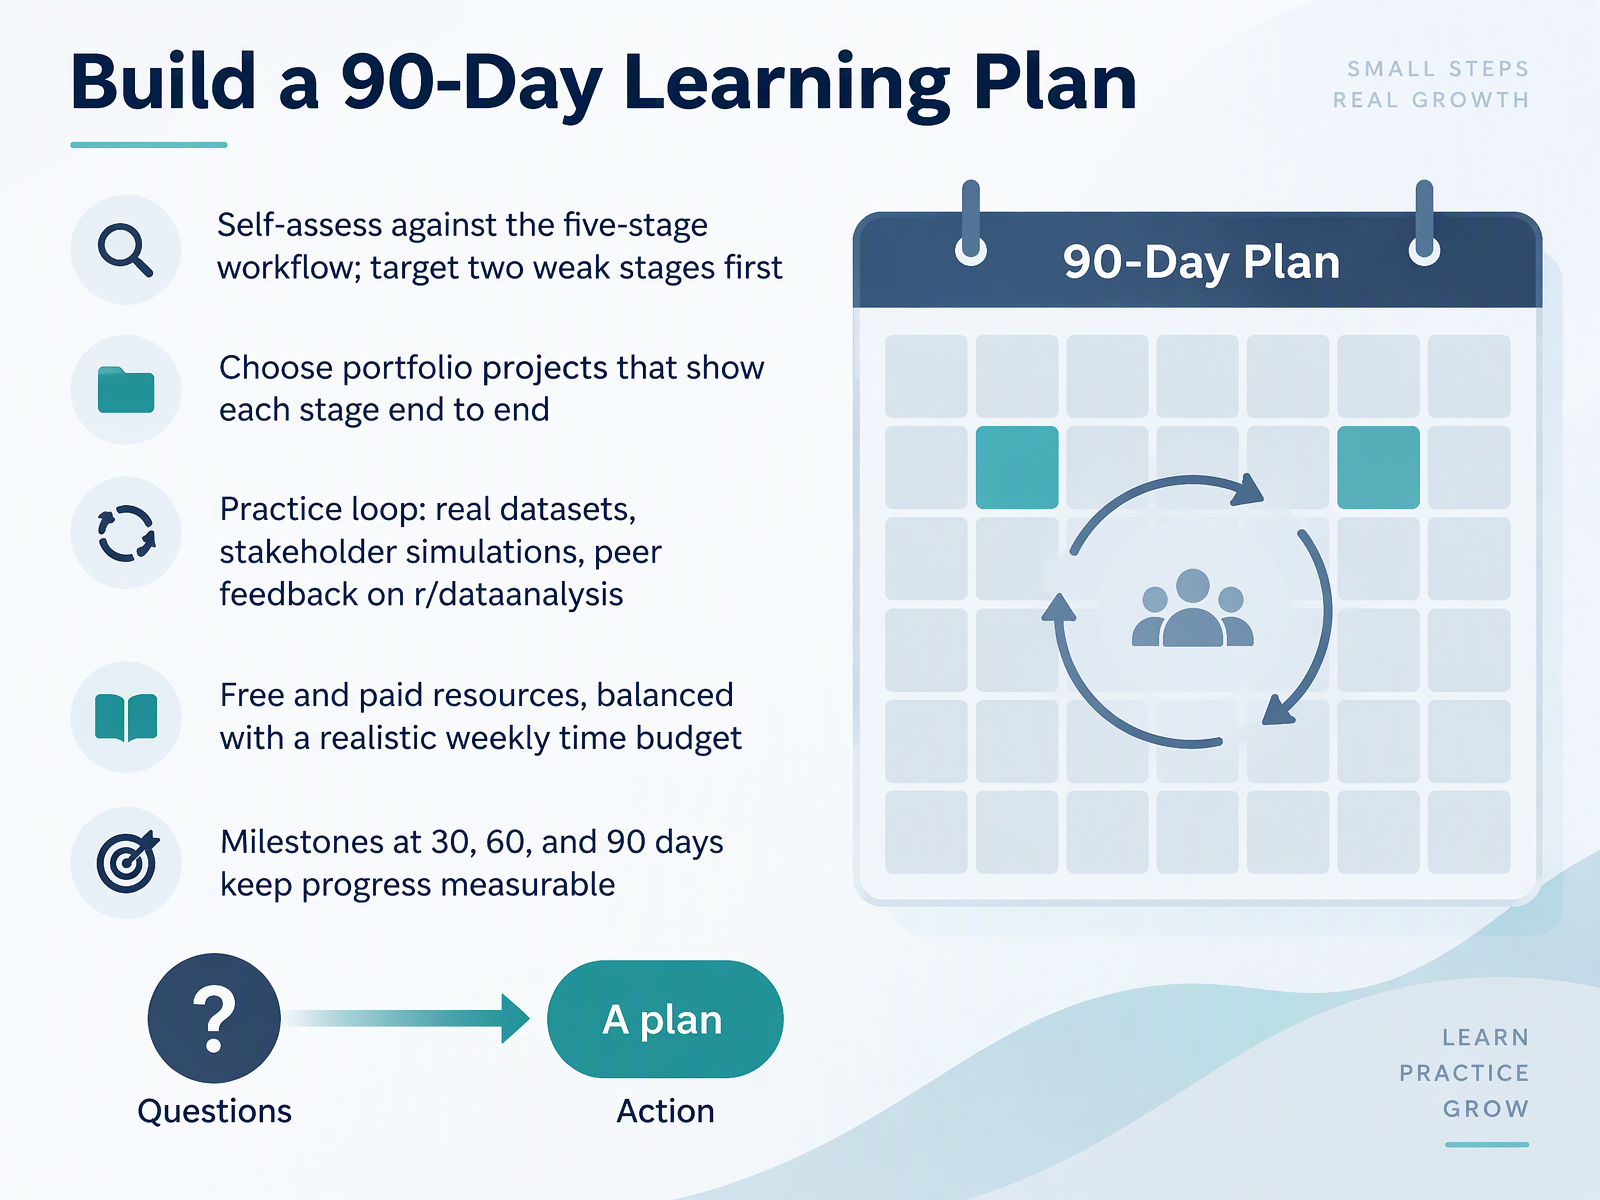
- 12Build a 90-Day Learning PlanNow let's turn that workflow into a ninety-day learning plan. Start with a self-assessment against the five stages. Score yourself honestly and target your two weakest stages first. Next, choose portfolio projects that show each stage end to end, from defining the question to presenting the recommendation. Build a practice loop. Use real datasets, run stakeholder simulations, and get peer feedback on r/dataanalysis. Mix free and paid resources, and set a realistic weekly time budget you can actually keep. Finally, set milestones at thirty, sixty, and ninety days. That keeps progress measurable. When the numbers don't line up, check the source first. It's a normal step, not a failure. Next, we'll look at portfolio projects that hiring managers actually notice.
 2 min
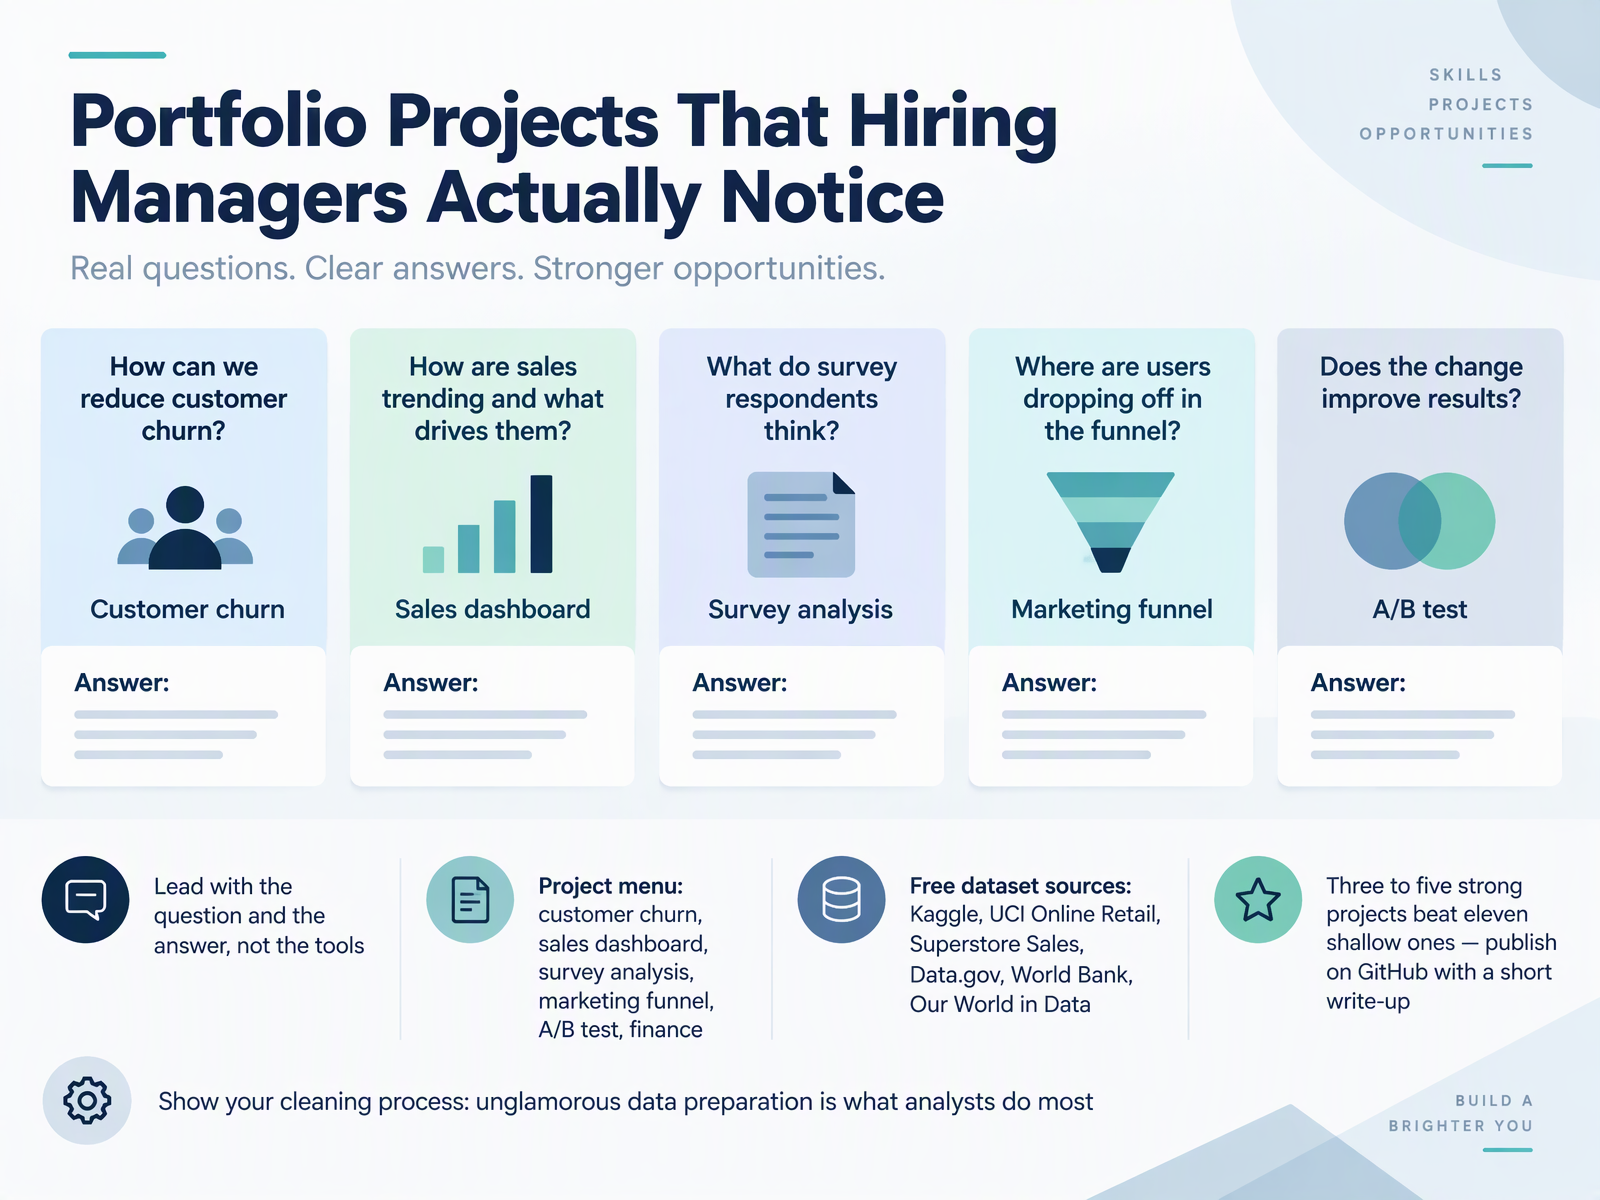
- 13Portfolio Projects That Hiring Managers Actually NoticeLet's talk about portfolio projects, and what hiring managers actually notice. Lead with the question and the answer, not the tools. For a churn project, open with: which customers are likely to leave, and why. Then show the answer. Pick from a project menu: customer churn, a sales dashboard, survey analysis, marketing funnel, an A B test, or finance. For free data, try Kaggle, the U C I Online Retail dataset, Superstore Sales, Data dot gov, the World Bank, or Our World in Data. Three to five strong projects beat eleven shallow ones. Publish on GitHub with a short write-up. And show your cleaning process, because unglamorous data preparation is what analysts do most. When the numbers don't line up, show how you checked the source. That builds trust. Next, let's avoid common pitfalls and keep improving.
 1 min
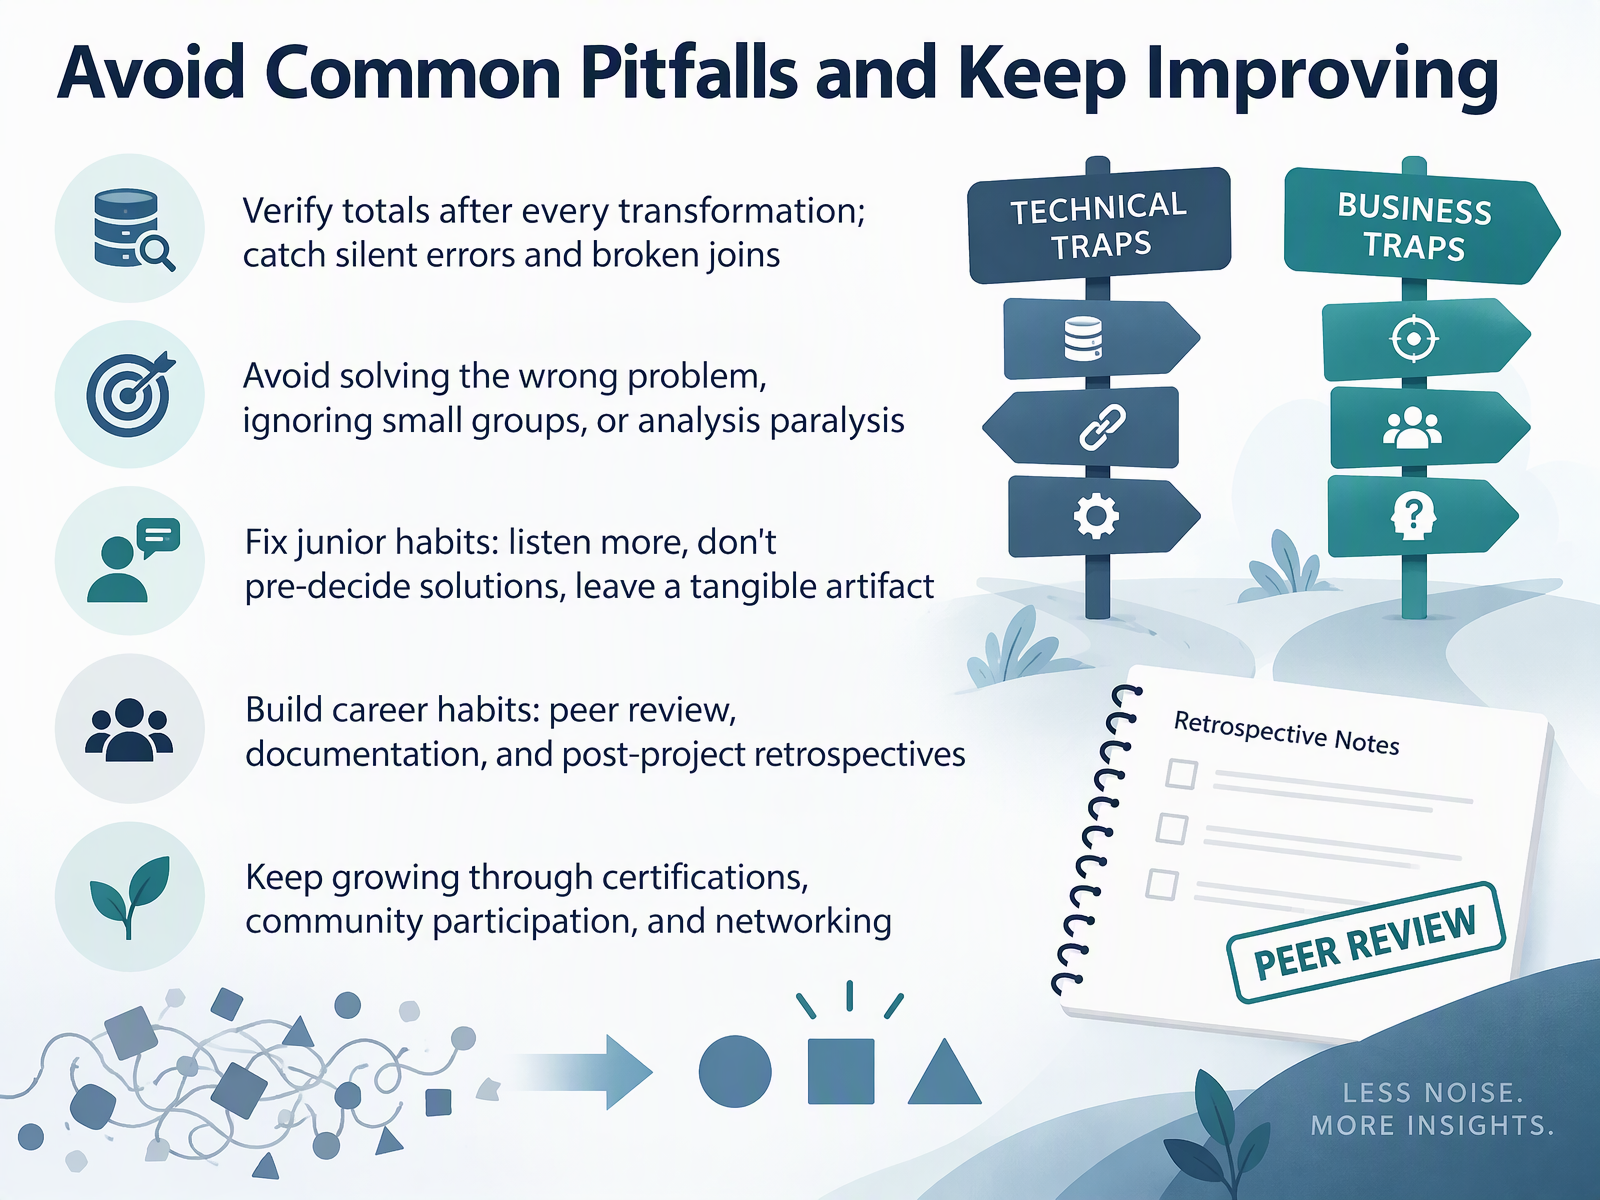
- 14Avoid Common Pitfalls and Keep ImprovingLet's close with the habits that keep your analysis honest and keep you growing. First, verify totals after every transformation. A silent error means a mistake that doesn't throw an error message, and a broken join means a table link that drops or duplicates rows. Check row counts and totals before you trust the output. Second, avoid the big traps. Solving the wrong problem, ignoring small groups, or getting stuck in analysis paralysis, which means endless analysis with no decision. When the numbers don't line up, check the source first. Third, fix junior habits. Listen more. Don't pre-decide the solution. Leave a tangible artifact, like a short summary memo. Build career habits too. Peer review, documentation, and post-project retrospectives, which are structured reviews after a project ends. Finally, keep growing through certifications, community participation, and networking. So verify your data, guard against common pitfalls, build review habits, and stay connected. Thank you for working through this course. You have a practical workflow now. Use it, refine it, and keep improving.
 2 min
Take the deck with you
Download this course as a file — free, no sign-up needed.
- PDF handoutEvery slide page, ready to print or share.15 pages · 3.0 MBDownload
- Narrated PowerPointThe deck that presents itself — every slide carries the digital human's narration video.15 pages · 12.4 MBDownload
- PowerPoint slidesThe full deck as a .pptx — open it in PowerPoint, Keynote, or Google Slides.15 pages · 3.0 MBDownload
Free to use in your own training — please keep the PersonWise credit page at the end.
Have your own deck? Turn it into a course