Begin
14 pages · ~28 min
Data Visualization Software Proficiency
This training builds proficiency in data visualization software for analysts and professionals who need to create clear, effective visualizations.
A digital instructor presents all 14 pages. Hold “Ask” at any point and ask out loud — the answer comes from this course. No sign-up needed.
What you’ll learn
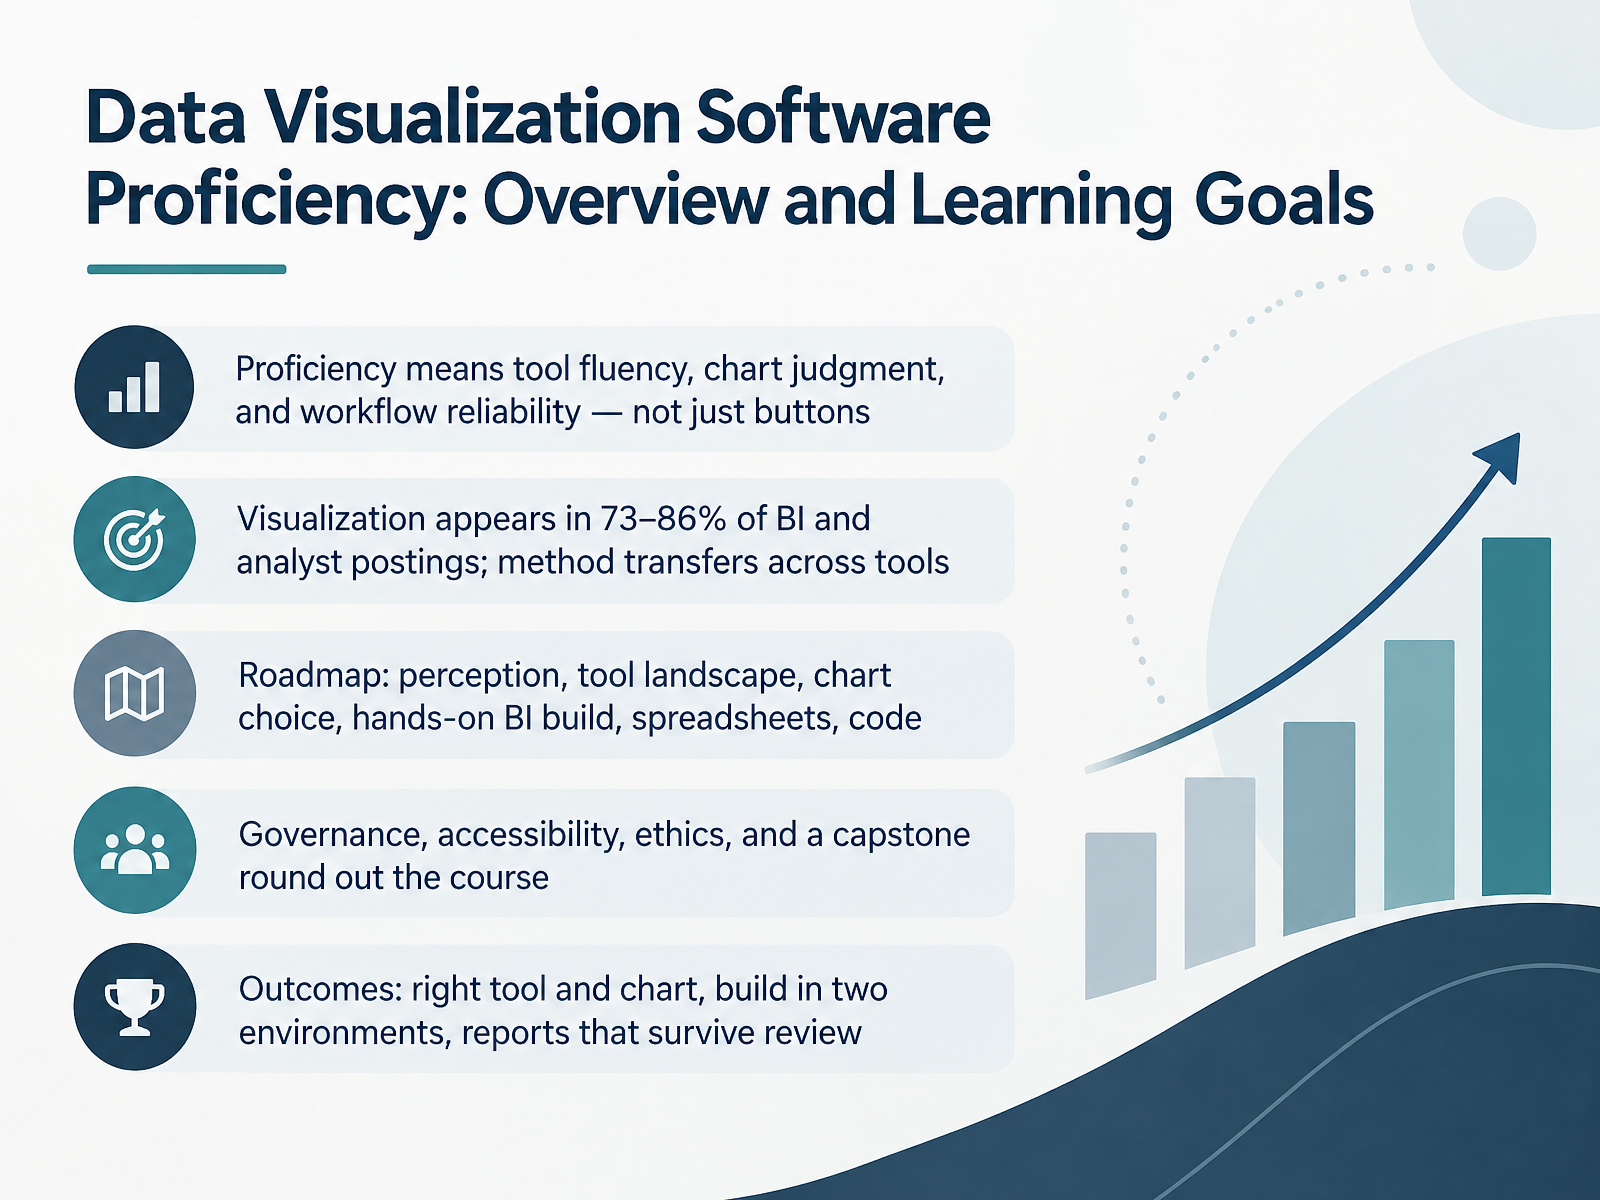
- 01Data Visualization Software Proficiency: Overview and Learning GoalsWelcome. This course is about data visualization software proficiency, and it is built for analysts, reporting specialists, and students who already work with data and want their charts to hold up under real review. Here is the framing. Proficiency is not just knowing where the buttons are. It combines three things: fluency in your tool, judgment about which chart fits the question, and a reliable workflow that produces the same clean result next month. In business intelligence and analyst job postings, visualization shows up in roughly seventy-three to eighty-six percent of listings. Tools vary from Tableau to Power BI to spreadsheets, but the underlying method transfers, so we teach the method, not one interface. Our roadmap moves through visual perception, the tool landscape, chart choice, a hands-on business intelligence build, spreadsheets, and code. Governance, accessibility, and ethics round out the course, and a capstone ties it together. By the end, you will select the right tool and chart, build in two environments, and produce reports that survive review. Let us begin with core concepts: data types and visual encoding.owox.cominterviewstack.iojobpedia.ai+22 min
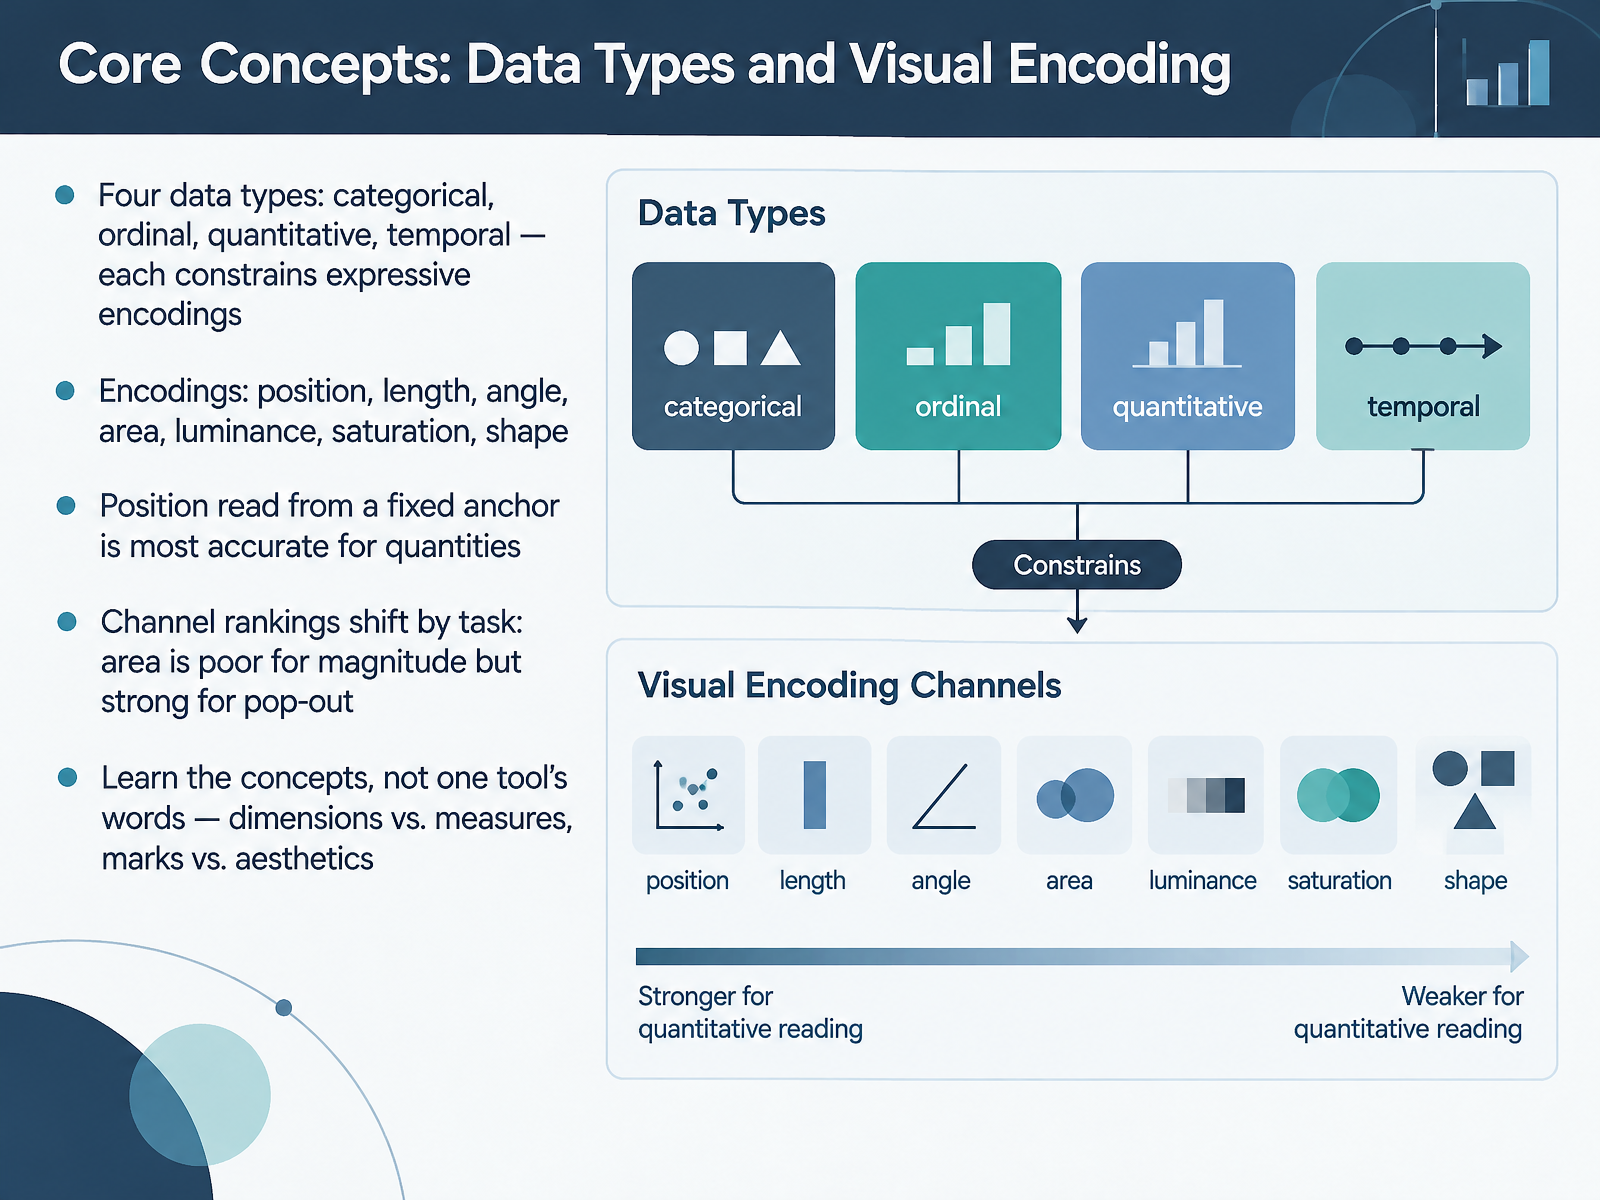
- 02Core Concepts: Data Types and Visual EncodingNext, let's cover the core concepts that underlie every chart you build: data types and visual encoding. You'll work with four data types: categorical, ordinal, quantitative, and temporal. Each one constrains which encodings make sense. The main channels are position, length, angle, area, luminance, saturation, and shape. Position read from a fixed anchor is the most accurate channel for quantities, which is why bar and line charts work so well. But channel rankings shift by task. Area is poor for judging magnitude, yet it's strong for pop-out, so it helps viewers spot outliers quickly. And here's the durable takeaway: learn the concepts, not one tool's vocabulary. Dimensions versus measures, marks versus aesthetics, they describe the same ideas across tools, so the mapping carries over when you switch platforms. Coming up next: Chart Judgment, Matching Chart Type to Analytical Question.
 doi.orgdoi.orgdoi.org+21 min
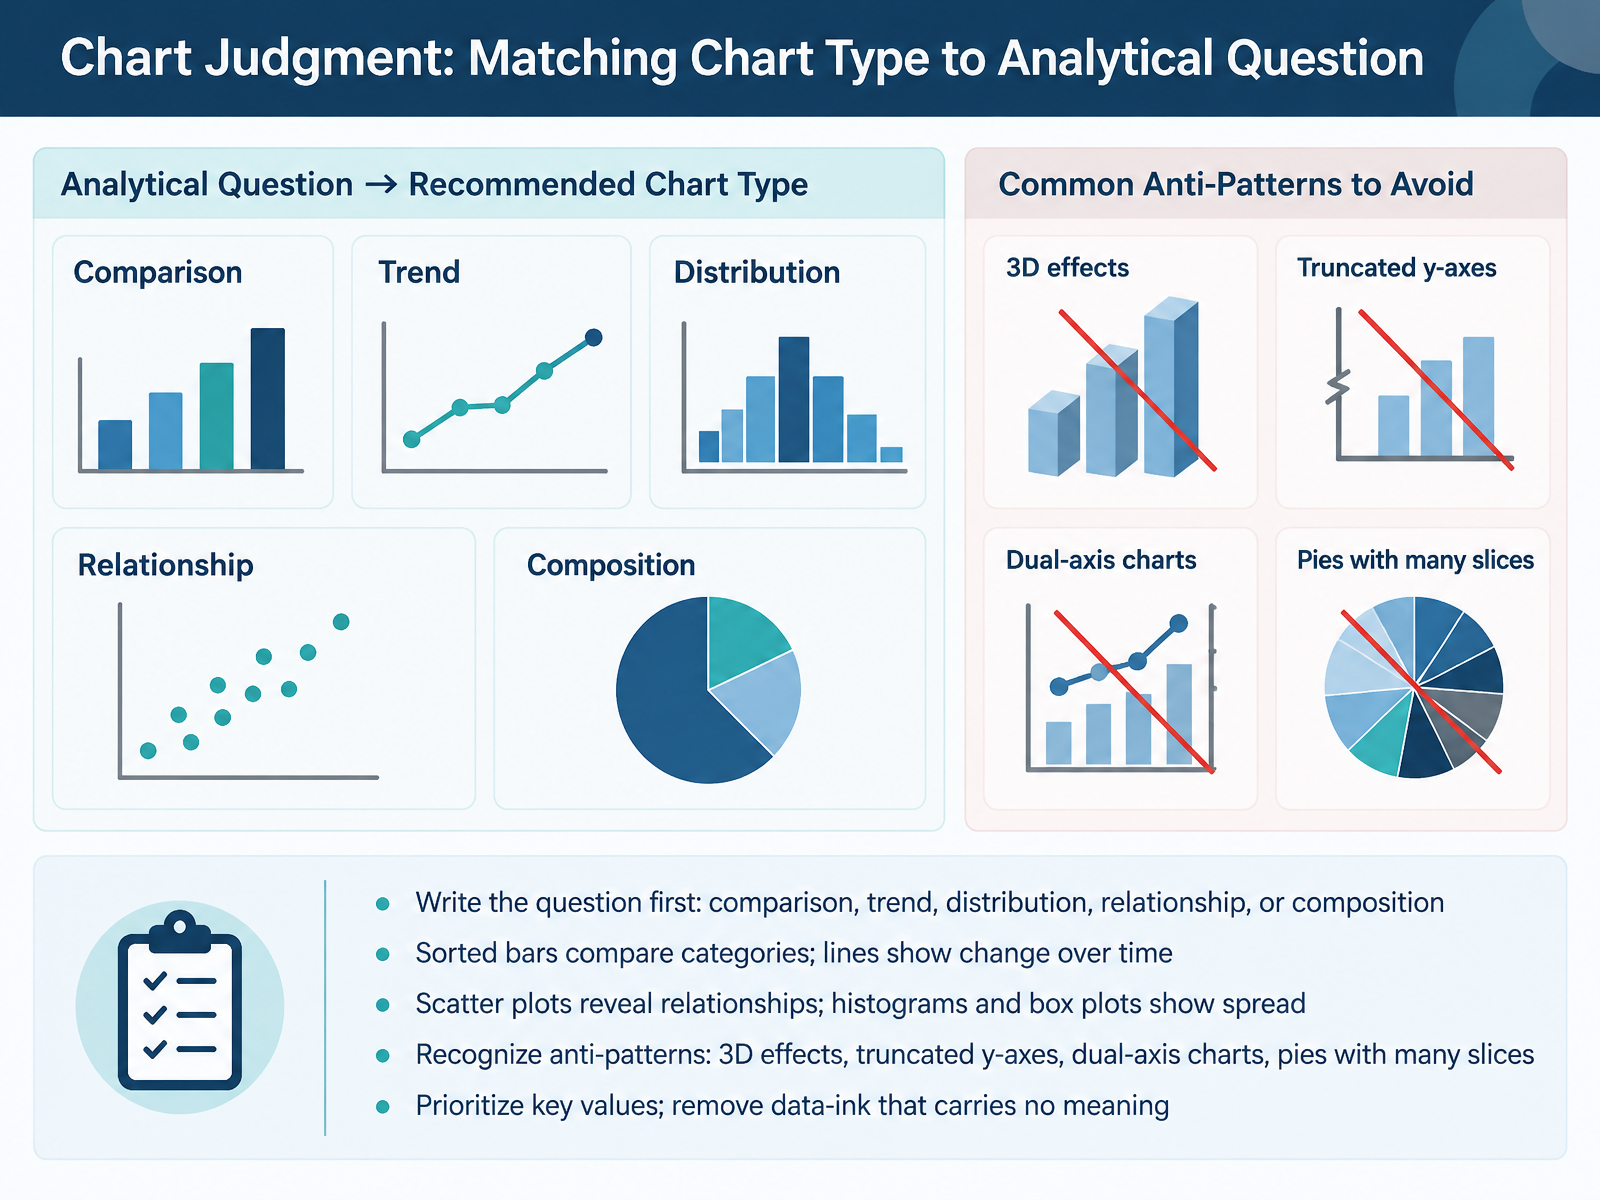
- 03Chart Judgment: Matching Chart Type to Analytical QuestionLet's look at chart judgment, matching the chart type to the analytical question. Start by writing the question before you touch a chart tool. Decide whether you are asking about comparison, trend, distribution, relationship, or composition. The answer picks the chart. For comparison, use sorted bars, since length is the easiest visual judgment. For change over time, use a line chart, because a continuous line reads as a trend. For relationships between two numeric variables, use a scatter plot. For spread within one variable, use a histogram or a box plot. Then watch for anti-patterns. Avoid 3D effects, which distort values. Avoid truncated y-axes, which exaggerate differences on bars. Avoid dual-axis charts, which imply relationships that may not exist. And avoid pie charts with many slices, since small shares become unreadable. Finally, prioritize the key values and remove data ink that carries no meaning. The test is simple. A colleague should be able to state your message in one sentence. Next, we move on to the tool landscape, choosing the right software.
 support.microsoft.comsupport.microsoft.comsupport.microsoft.com+22 min
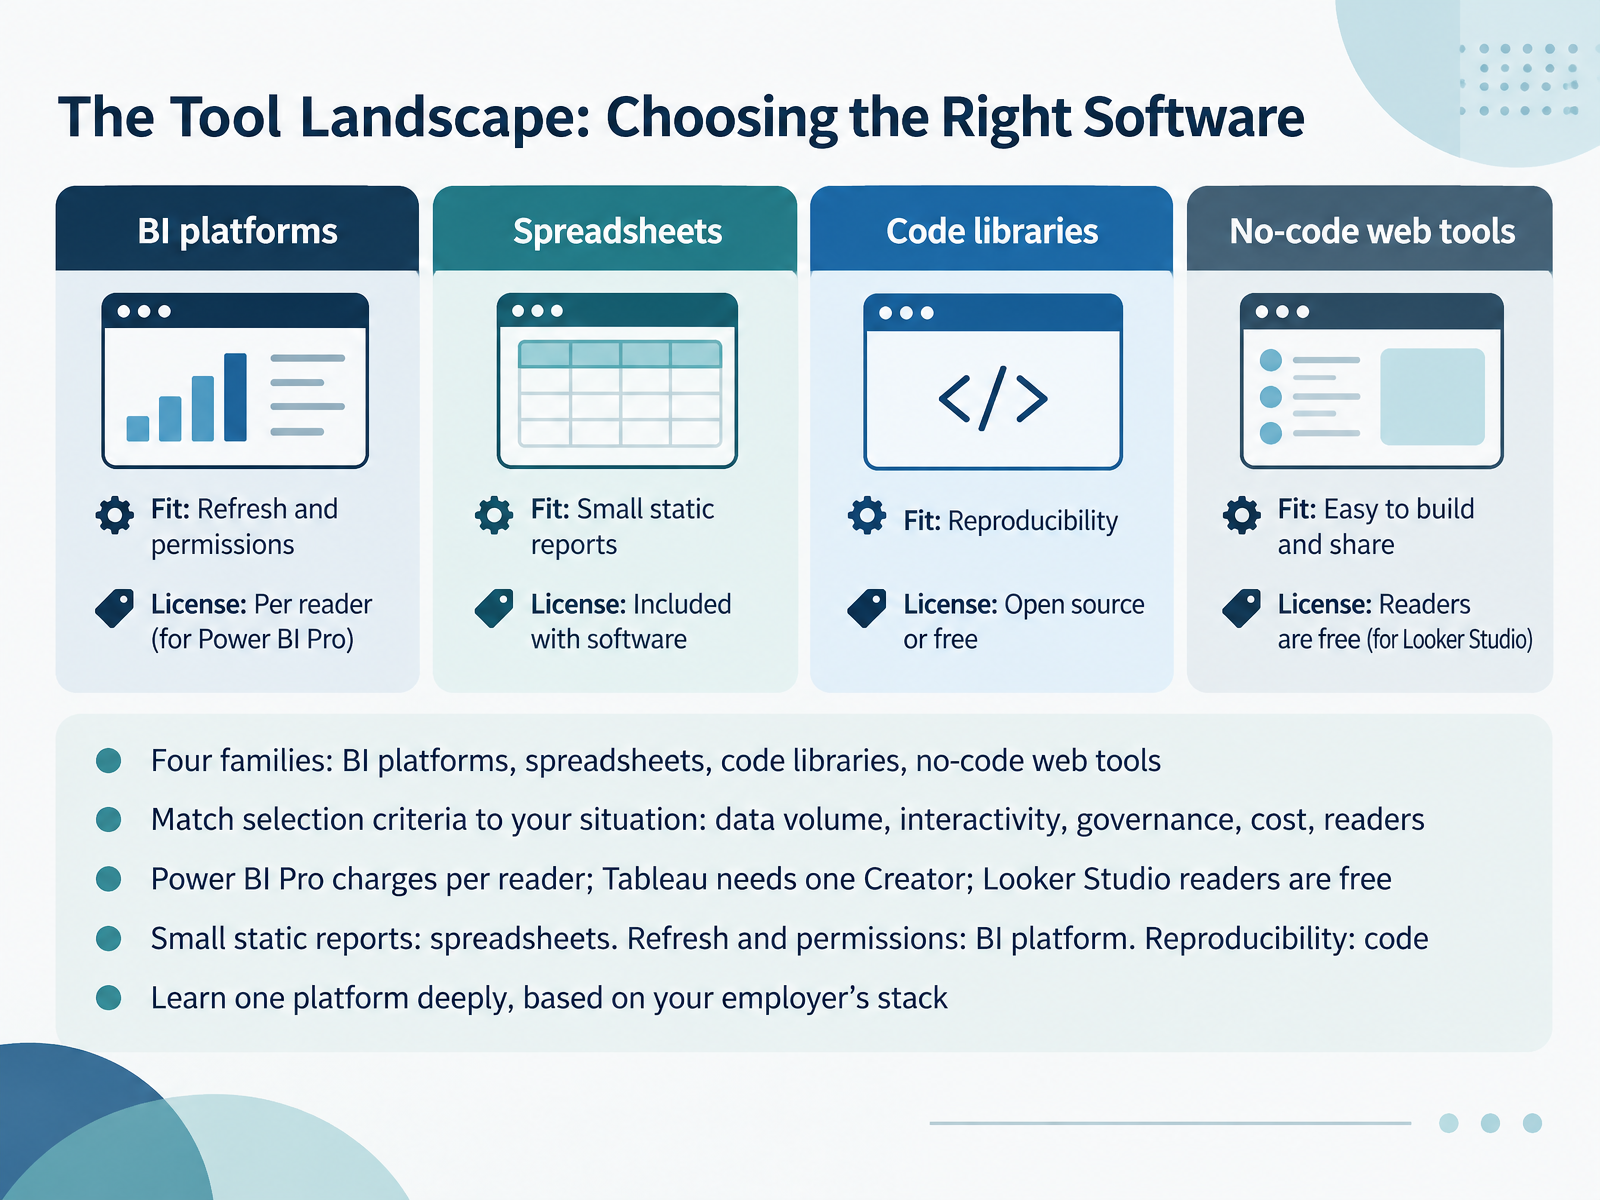
- 04The Tool Landscape: Choosing the Right SoftwareNow let's look at the tool landscape, because choosing software is really a matching exercise. There are four families to know: BI platforms, spreadsheets, code libraries, and no-code web tools. Before you pick, write down your selection criteria: data volume, how much interactivity readers need, governance requirements, cost, and who actually reads the report. Licensing matters here. Power BI Pro charges per reader, Tableau requires at least one Creator licence at seventy-five dollars a month, and Looker Studio readers are free. Then match the situation. Small static reports belong in a spreadsheet. Regular refresh and permissions point to a BI platform. Reproducibility points to code libraries. So learn one platform deeply, based on your employer's stack. Next, we move into design fundamentals: color, labels, and clarity.
 surowiecki.orgini8labs.techdatastudioformarketers.com+21 min
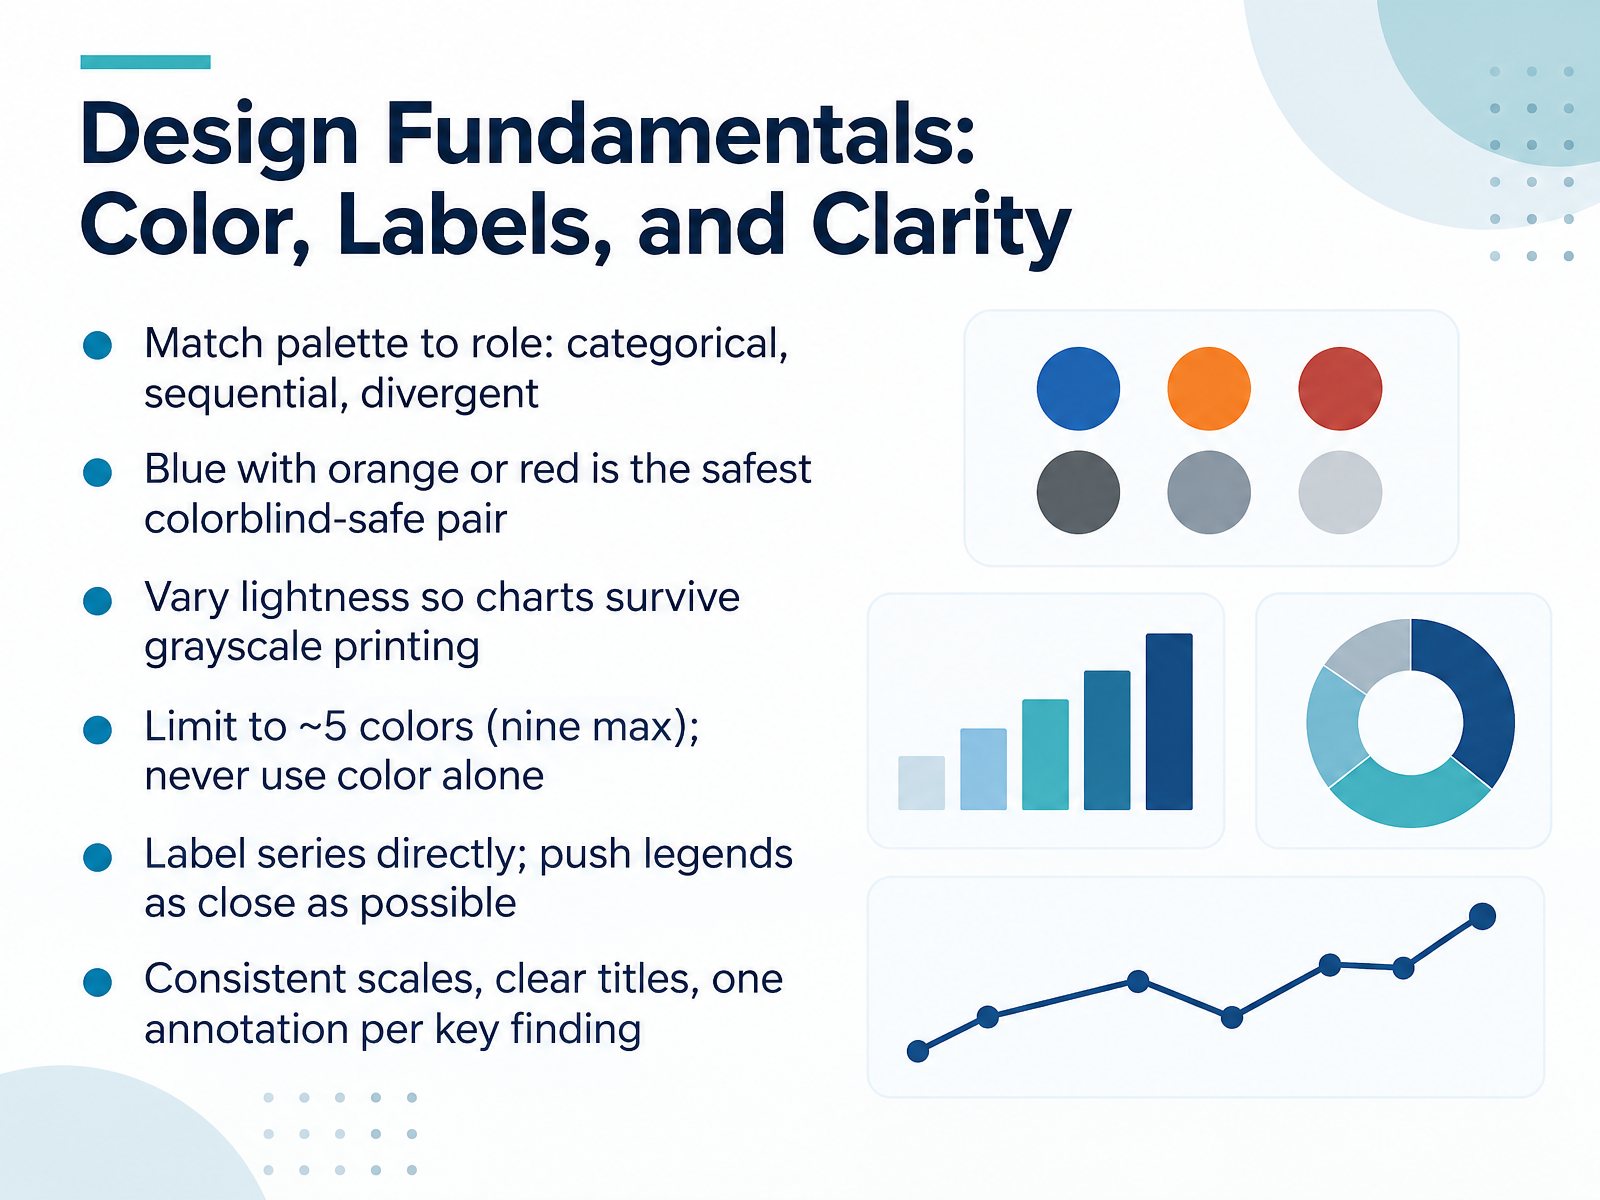
- 05Design Fundamentals: Color, Labels, and ClarityNow let's look at design fundamentals, starting with color. Match your palette to the role the color plays. Use categorical colors to separate unrelated groups, sequential colors, which shift in lightness, to show an ordered range, and divergent colors, which fan out from a midpoint, for values above and below a center. Blue paired with orange or red is the safest colorblind-safe combination. Also vary lightness across your palette so the chart still reads in grayscale printing. Keep it to about five colors, nine at most, and never use color alone. Pair it with direct labels, patterns, or shapes. Label series directly where you can, and keep any legend as close to the chart as possible. Finally, use consistent scales, clear titles, and one annotation per key finding. Next, we move into hands-on work. Hands-On Part 1: From Raw Data to a First Report in a BI Tool.
 1 min
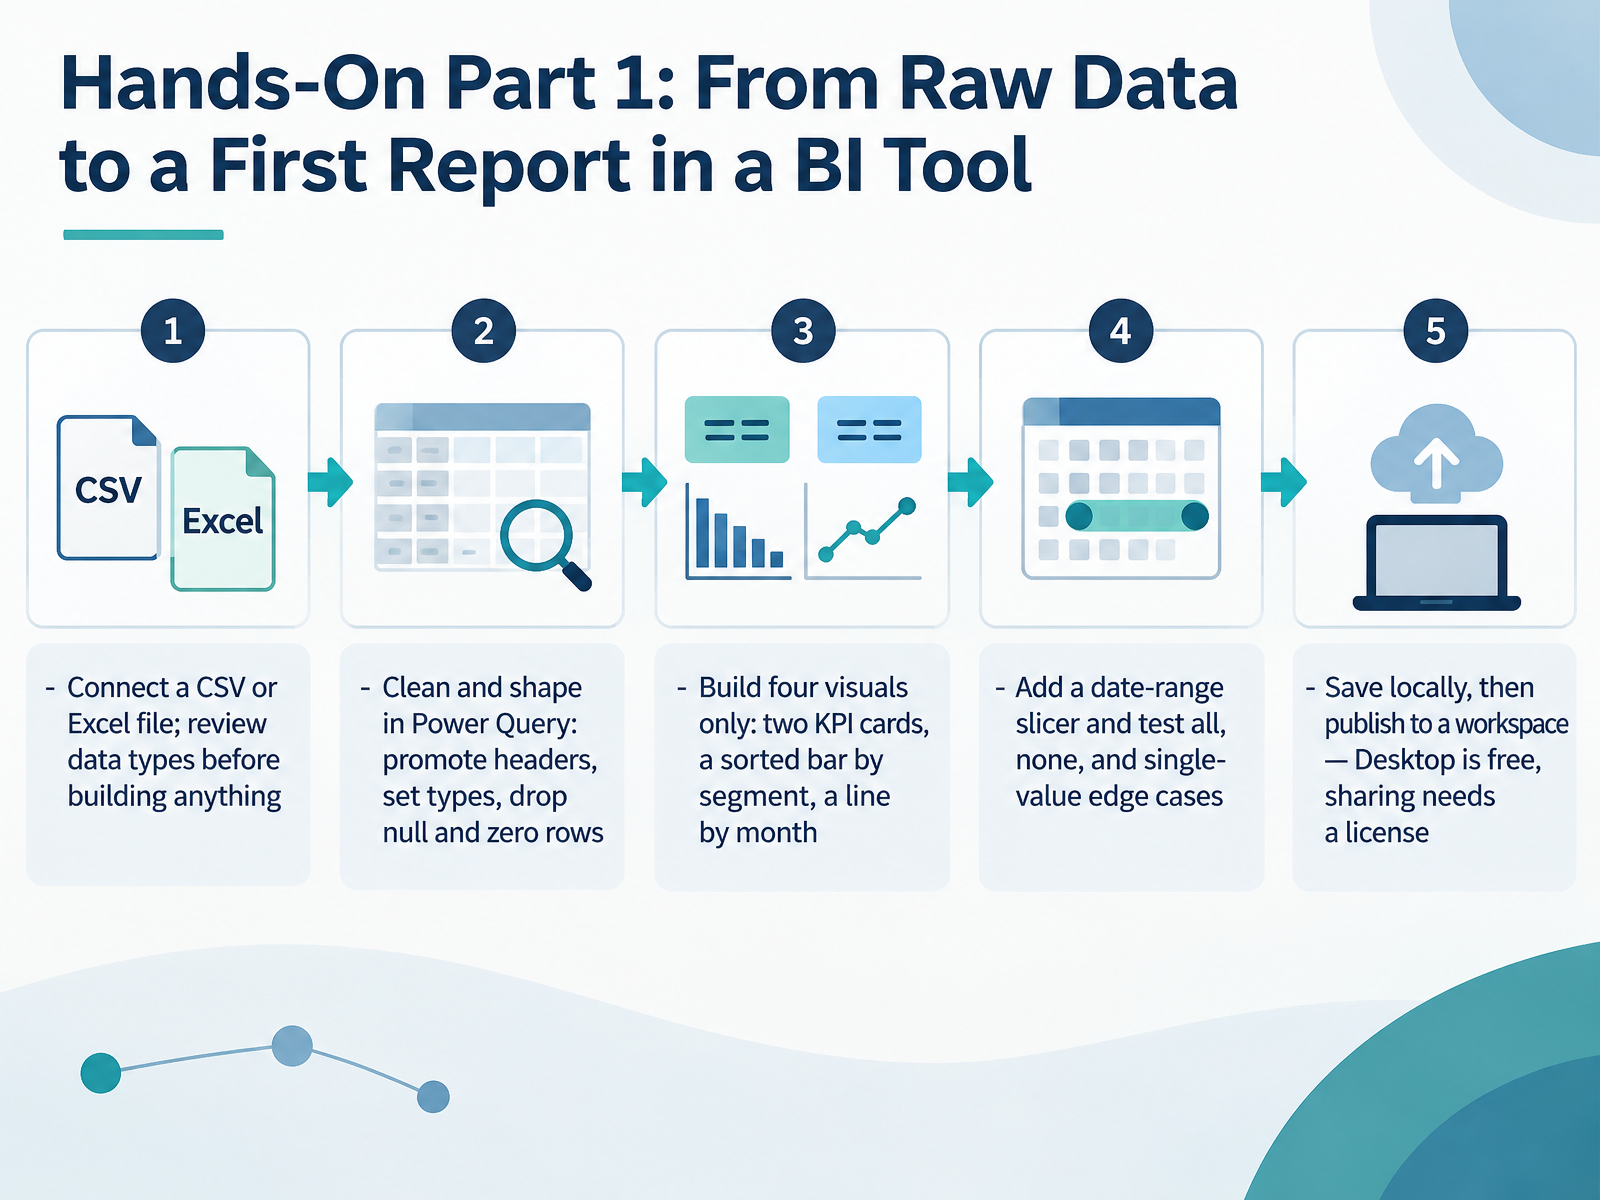
- 06Hands-On Part 1: From Raw Data to a First Report in a BI ToolNow let's move from concepts into your first hands-on build. Start by connecting a CSV or Excel file, and review the data types before you build anything. Data types tell the tool whether a column holds numbers, dates, or text, and getting them right prevents broken charts later. Next, open Power Query and shape the data. Promote the first row to headers, set the correct type on each column, and drop rows where nulls or zeros would distort your totals. Then build four visuals only. Add two KPI cards, a bar chart sorted by segment, and a line chart by month. Now add a date-range slicer, and test three cases: all dates, none selected, and a single value. Each should behave sensibly. When the report looks right, save it locally, then publish to a workspace. Power BI Desktop is free, but sharing requires a license. Next, we'll cover publishing, sharing, and common beginner errors.
 2 min
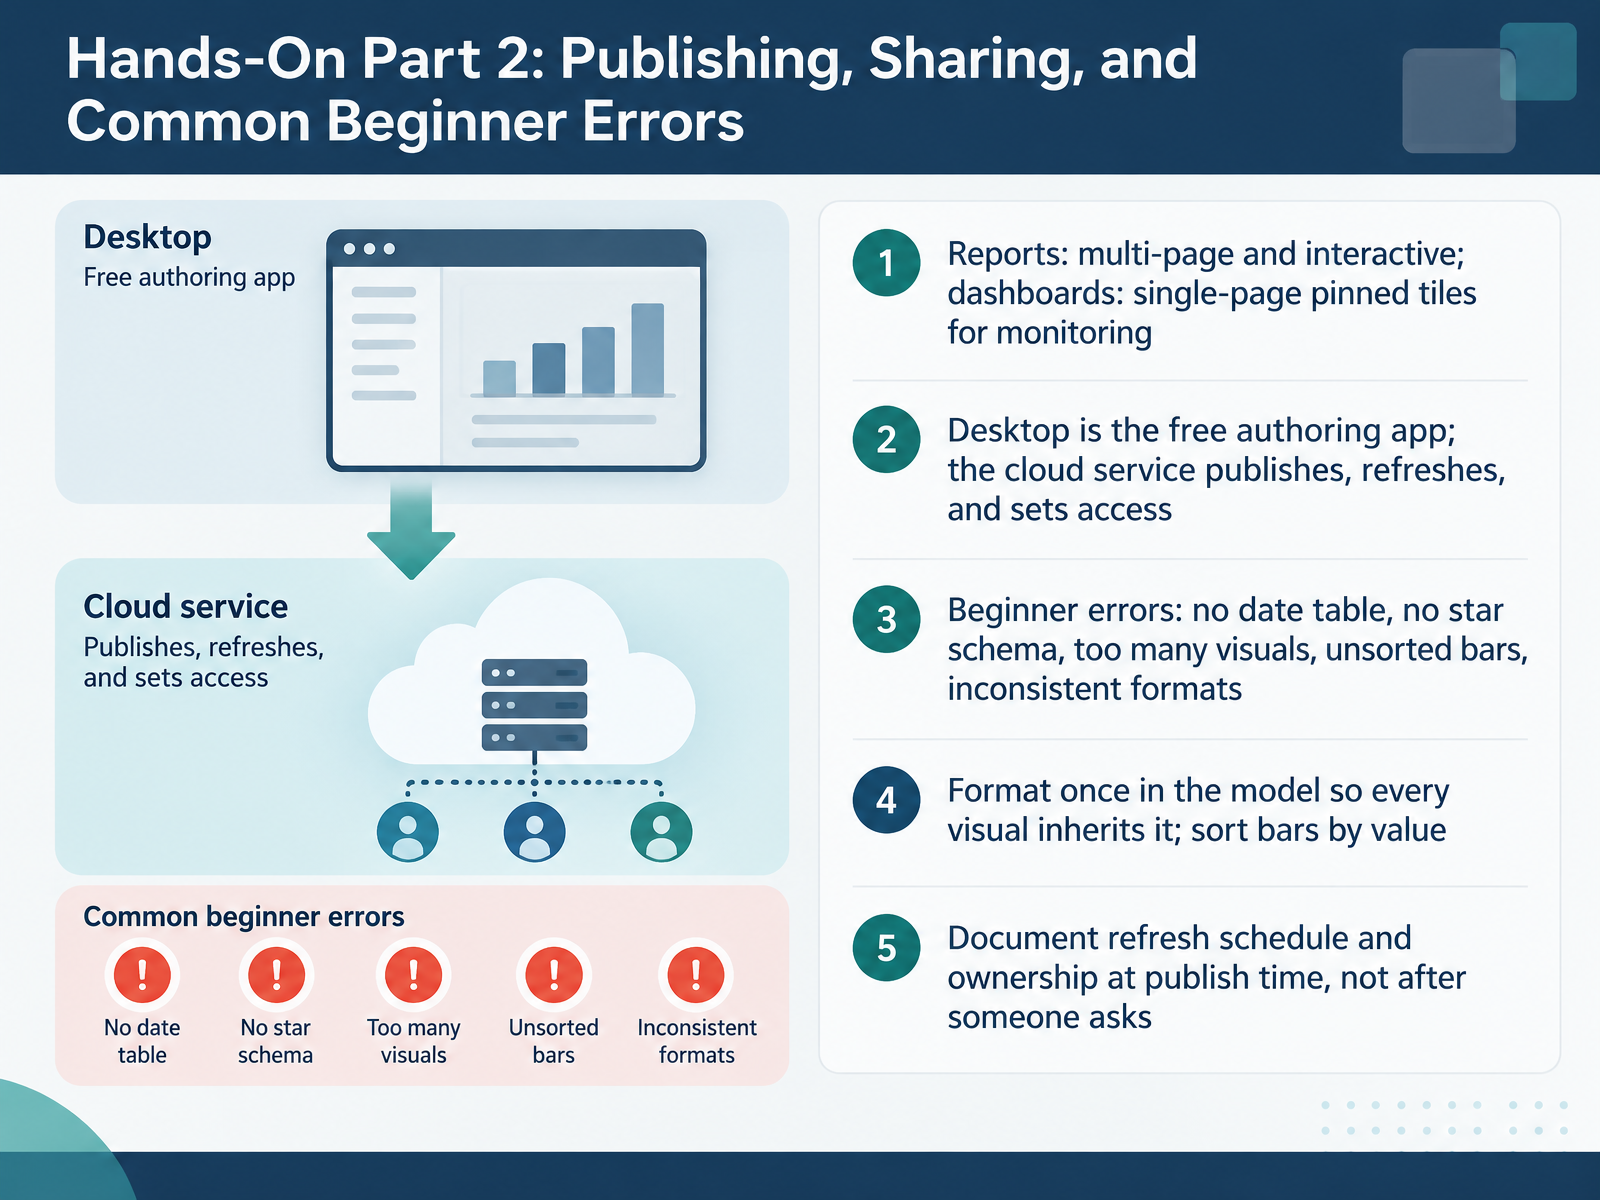
- 07Hands-On Part 2: Publishing, Sharing, and Common Beginner ErrorsNow let's move from building to delivering. First, clarify two terms. A report is a multi-page, interactive document with slicers and drill-through. A dashboard is a single page of pinned tiles, built for monitoring at a glance. Power BI Desktop is the free authoring app. The cloud service publishes, refreshes, and sets access. When you publish, choose a workspace and confirm who owns the content. Next, watch for common beginner errors: no date table, no star schema, too many visuals, unsorted bars, and inconsistent number formats. Keep the layout to a few focused visuals, and sort bar charts by value so readers don't have to work for the ranking. Format once in the model so every visual inherits the same format. Finally, document the refresh schedule and ownership at publish time, not after someone asks. That single habit prevents most trust issues downstream. Next, we'll cover Spreadsheet and Presentation Tool Proficiency.
 2 min
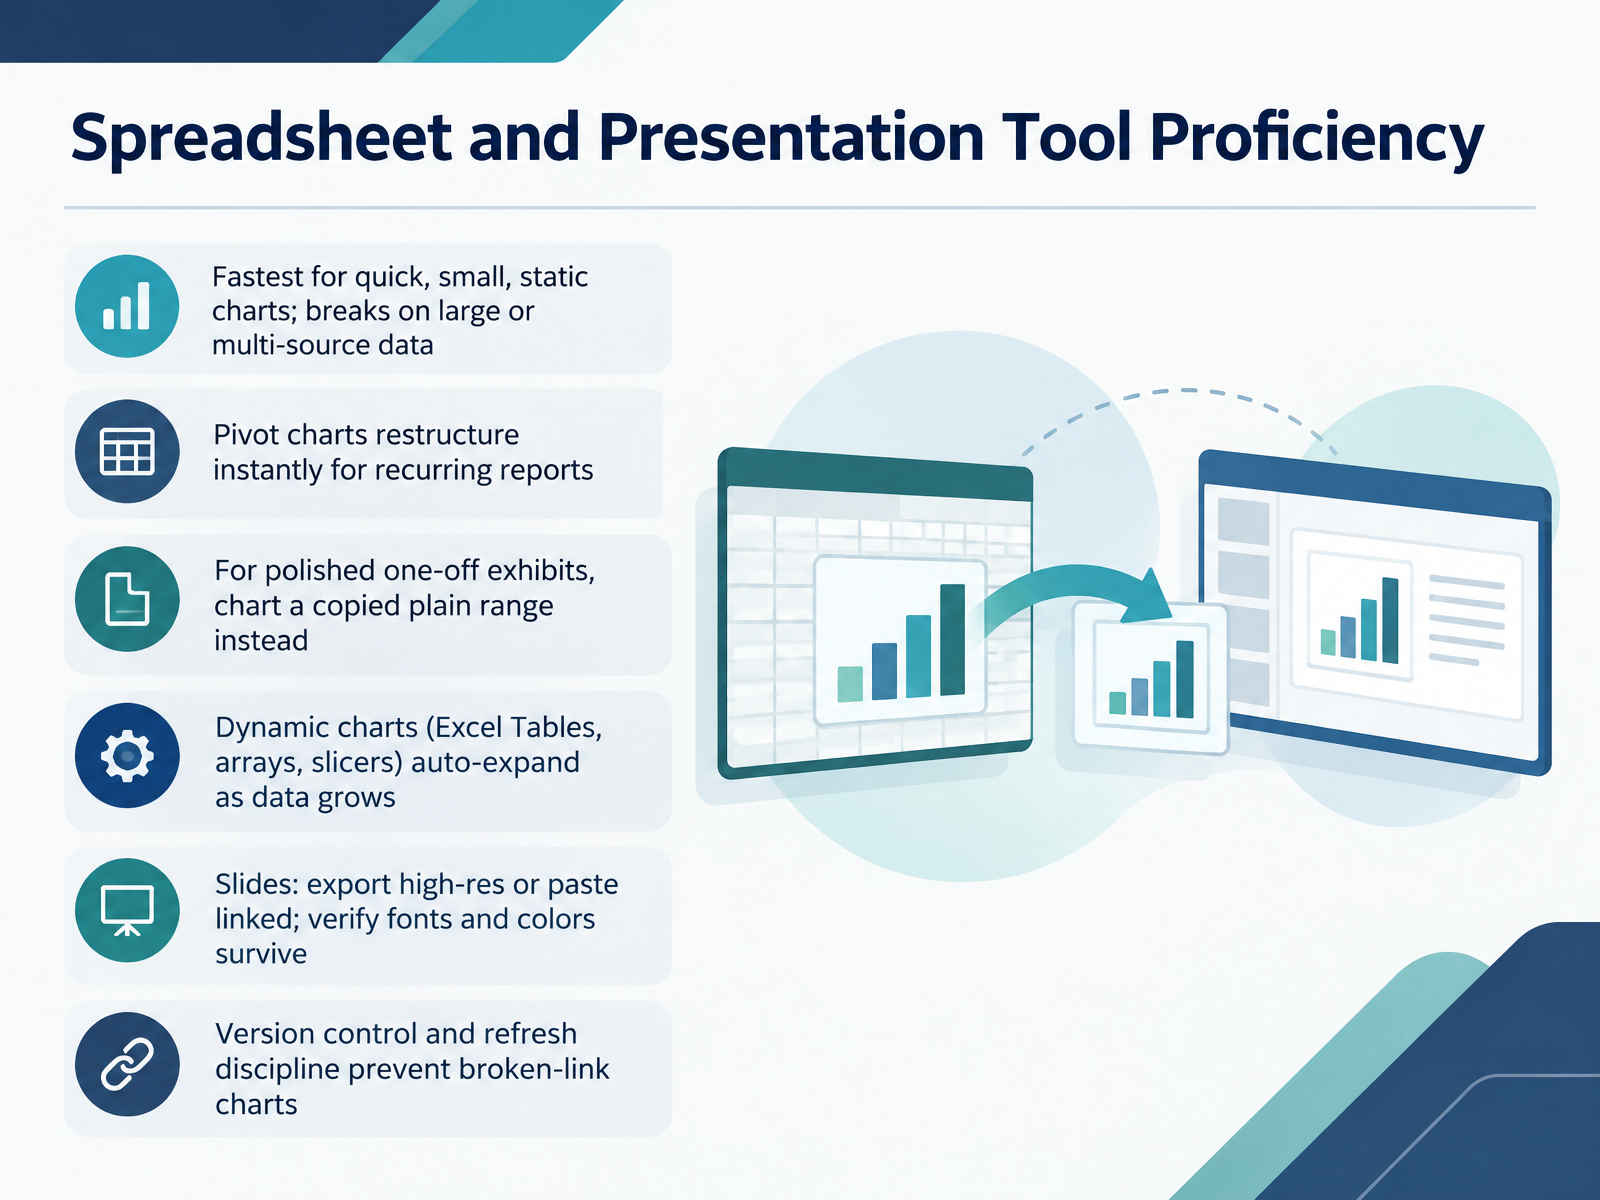
- 08Spreadsheet and Presentation Tool ProficiencyLet's look at the everyday tools you already have open: spreadsheets and presentation software. For quick, small, static charts, a spreadsheet is fastest, but it breaks down once the data gets large or comes from multiple sources. Pivot charts restructure instantly, so they suit recurring reports well. For a polished one-off exhibit, copy the pivot values to a plain range and chart that instead. Dynamic charts based on Excel Tables, dynamic arrays, or slicers auto-expand as data grows. When you move a chart into slides, either export it at high resolution or paste it as a link, then verify that fonts and colors survived the transfer. Finally, keep version control and refresh discipline, because that is what prevents broken-link charts. Coming up next, we move into programmatic visualization with Python and R.
 support.microsoft.comsupport.microsoft.comsupport.microsoft.com+21 min
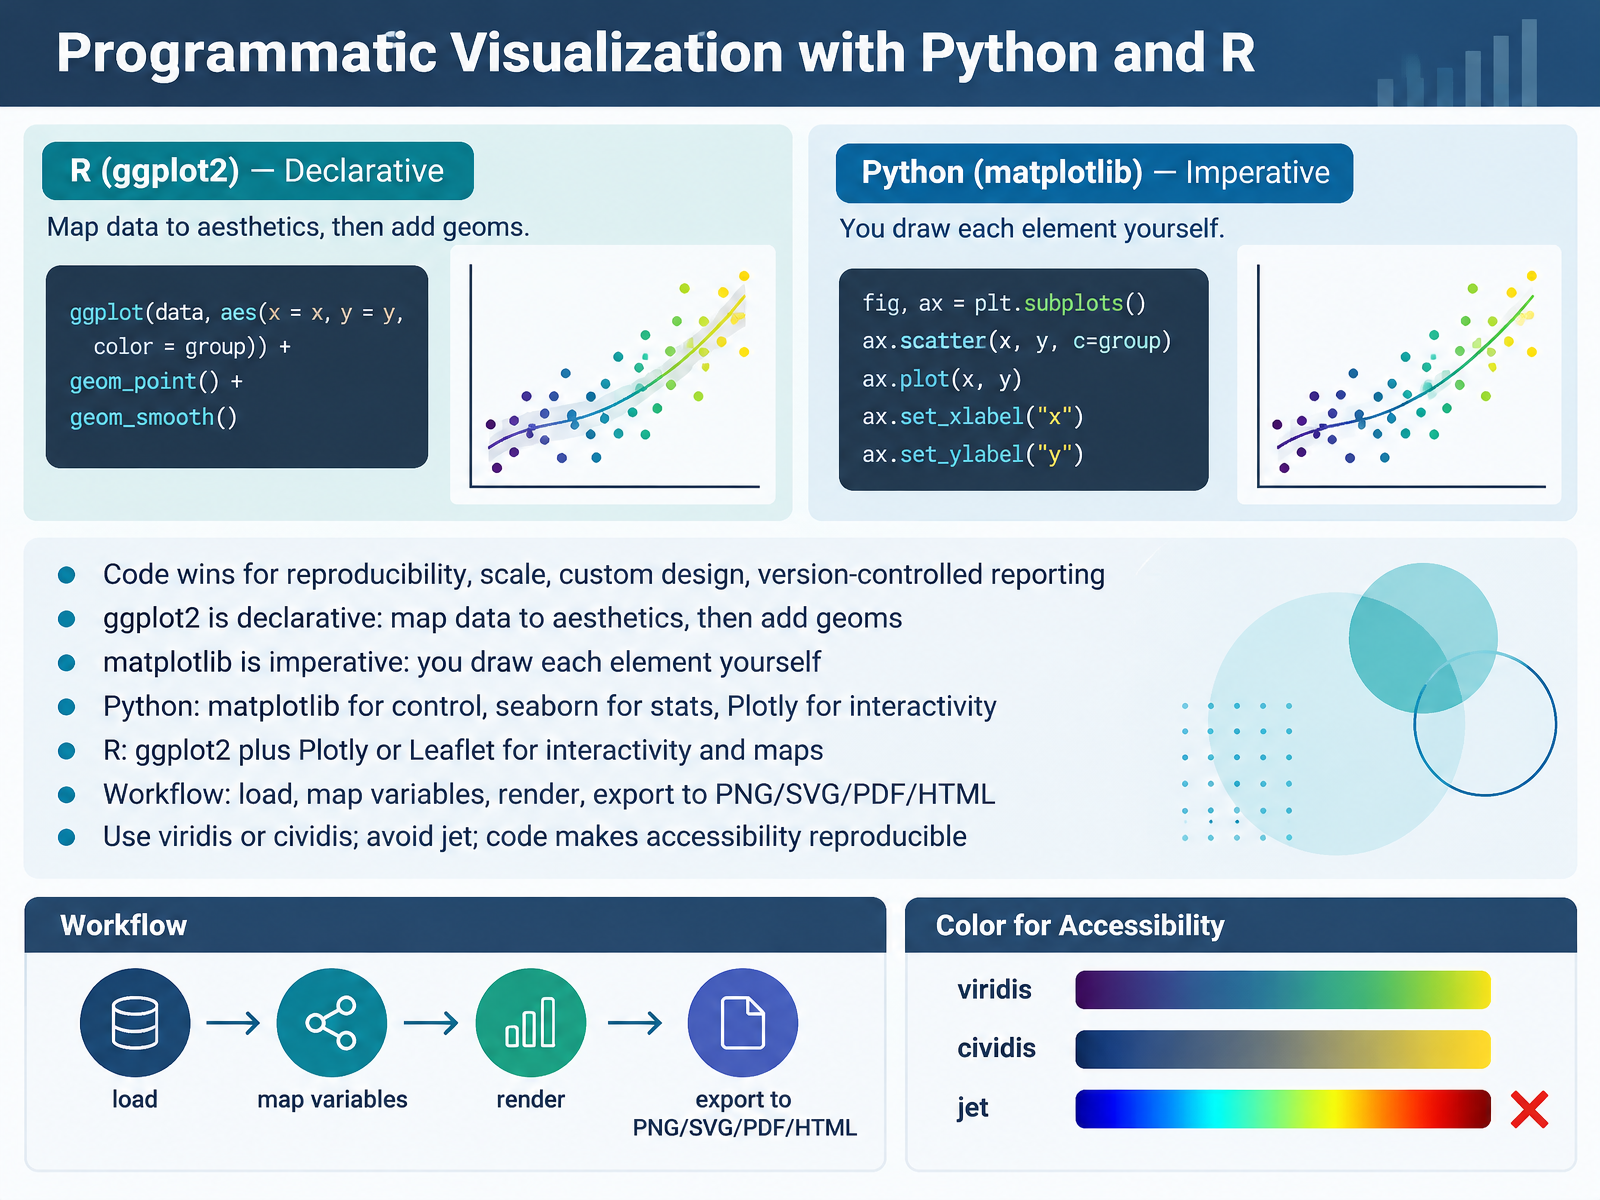
- 09Programmatic Visualization with Python and RNow let's look at building visualizations in code, with Python and R. Code gives you reproducibility: a script can be rerun, reviewed, and version-controlled, so a report regenerates identically each time. The two main approaches differ in philosophy. In R, ggplot2 is declarative. You map data columns to aesthetics, like x, y, and color, then add geoms such as points or bars, and ggplot2 handles axes and legends. In Python, matplotlib is imperative. You create a figure and axes, then draw each element yourself, setting titles, colors, and legends explicitly. Within Python, use matplotlib for fine control, seaborn for statistical charts with quick defaults, and Plotly for interactivity. In R, pair ggplot2 with Plotly for interactivity or Leaflet for maps. The workflow stays consistent: load the data, map variables, render the chart, then export to PNG, SVG, PDF, or HTML. For color, use viridis or cividis and avoid jet, because those palettes stay readable for colorblind viewers, and writing the palette in code makes accessibility reproducible. Next, we move to data quality, accuracy, and governance in reports.
 2 min
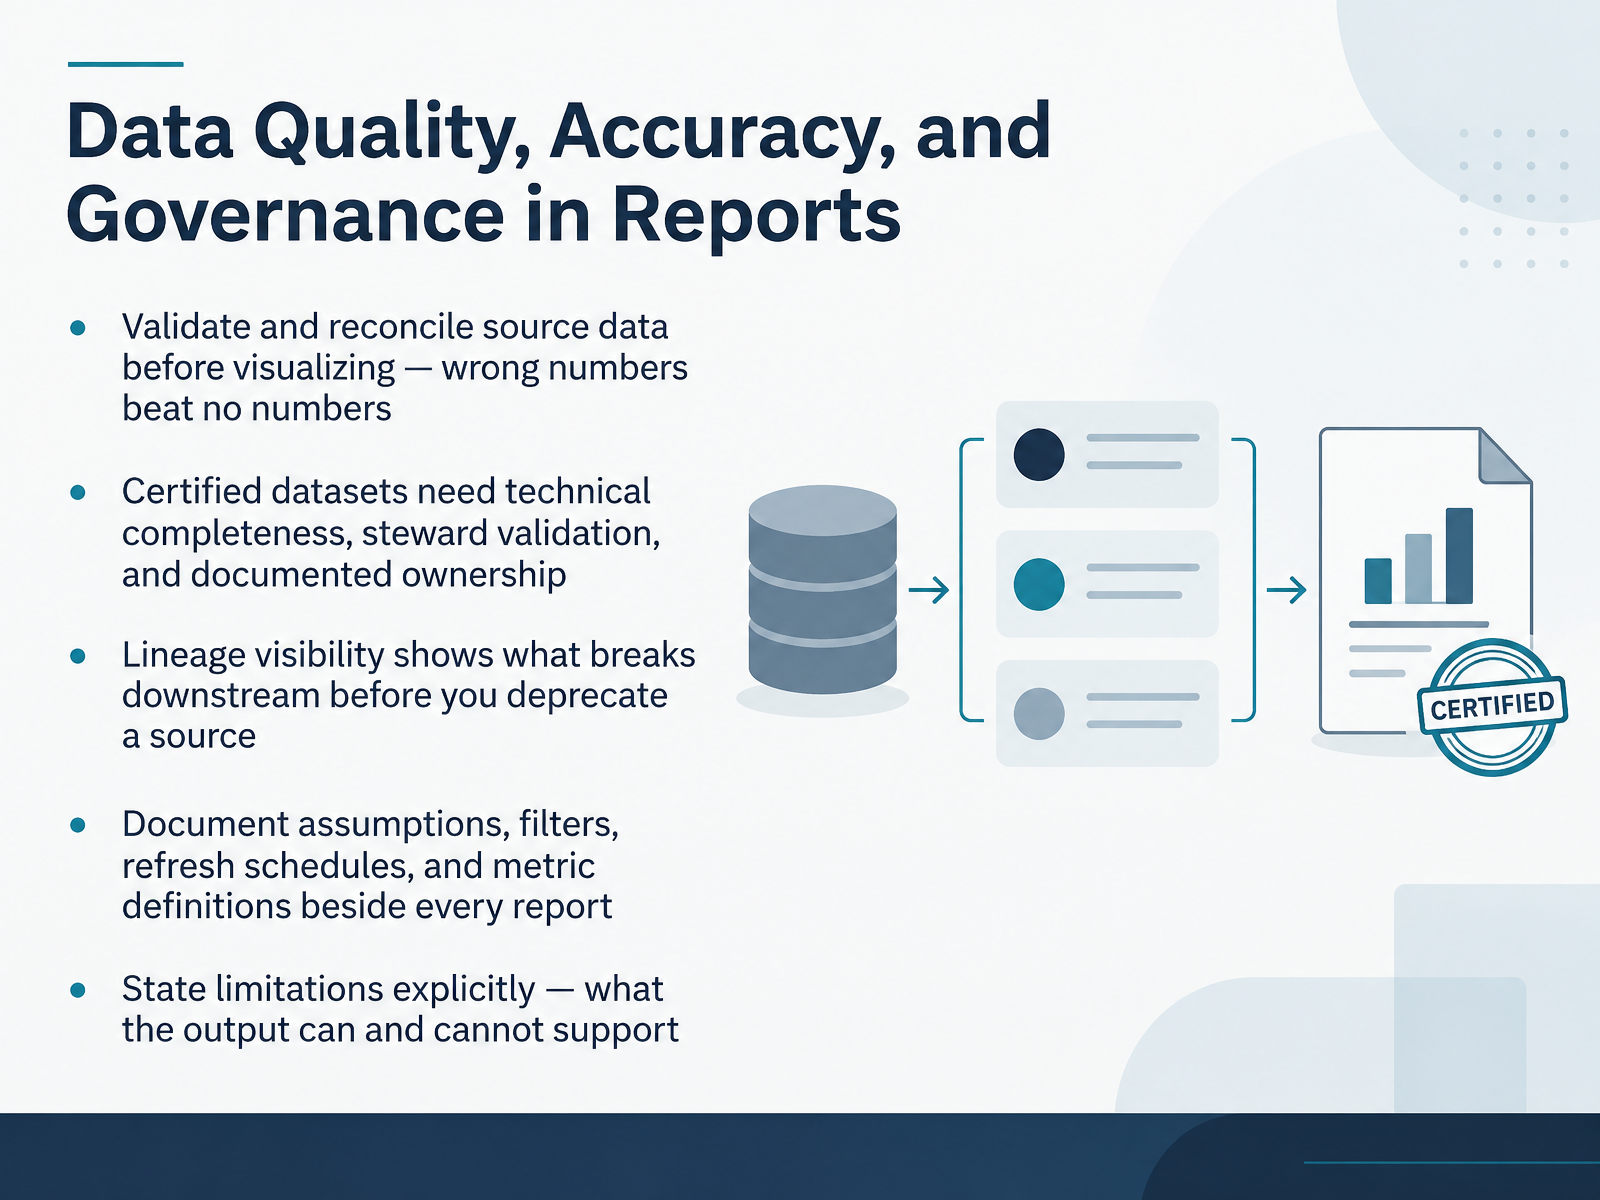
- 10Data Quality, Accuracy, and Governance in ReportsNext, let's talk about data quality, accuracy, and governance in reports. Start by validating and reconciling source data before you visualize anything. Wrong numbers are worse than no numbers, because people act on them. Certified datasets should meet three conditions. Technical completeness, meaning documentation, naming, and refresh checks pass. Steward validation, where a domain owner confirms key measures against an authoritative source. And documented ownership, so someone is accountable. A technically clean dataset with a wrong business definition is still a bad dataset, so don't skip the business review. Next, lineage visibility. Lineage traces how data moves from source to report. Before you deprecate a source, check its lineage to see what breaks downstream. Then document the assumptions, filters, refresh schedules, and metric definitions beside every report, so the next person isn't guessing. Finally, state limitations explicitly. Say what the output can and cannot support, and separate observed facts from interpretation. Moving on, accessibility: contrast, color, alternatives, and keyboard access.
 owox.cominterviewstack.iojobpedia.ai+21 min
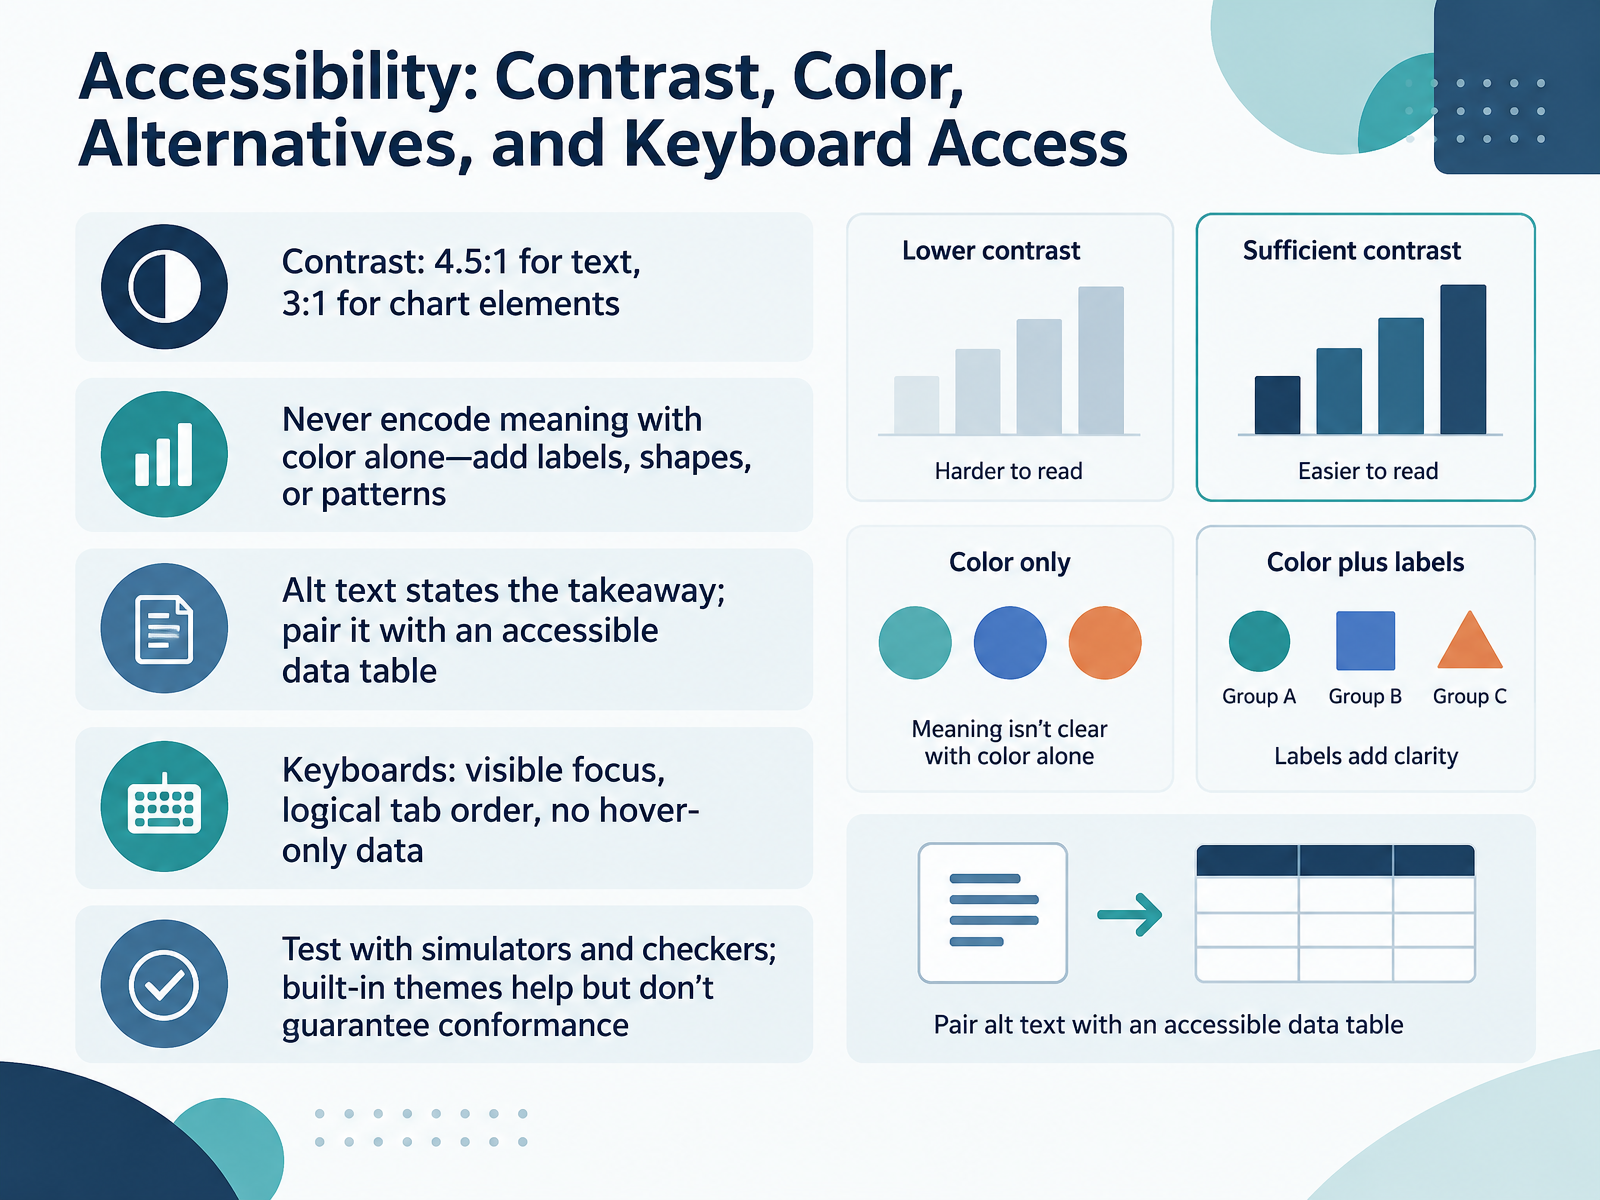
- 11Accessibility: Contrast, Color, Alternatives, and Keyboard AccessNext, let's build accessibility into the visual itself. Start with contrast. Text needs a ratio of at least four point five to one against the background, including titles, labels, and legends. Chart elements like bars, lines, and pie segments need at least three to one against adjacent colors. Next, never encode meaning with color alone. Add direct labels, distinct shapes, or simple patterns so a series stays identifiable without color, and keep the label plain so it reads clearly both on screen and aloud. For alt text, state the takeaway, not every value. A useful pattern is chart type of data where the takeaway, so a line chart of unemployment where the rate falls from twenty twenty to twenty twenty five. Pair that with a real data table, never an image of a table, so screen reader users can navigate the cells. For keyboard access, confirm a visible focus indicator, a tab order that runs top to bottom and left to right, and no data hidden behind hover only. Then test with a color vision simulator and a contrast checker. Built-in themes help, but they don't guarantee conformance, so verify each chart. That leads into the next slide, Ethics and Honest Persuasion in Data Visuals.
 2 min
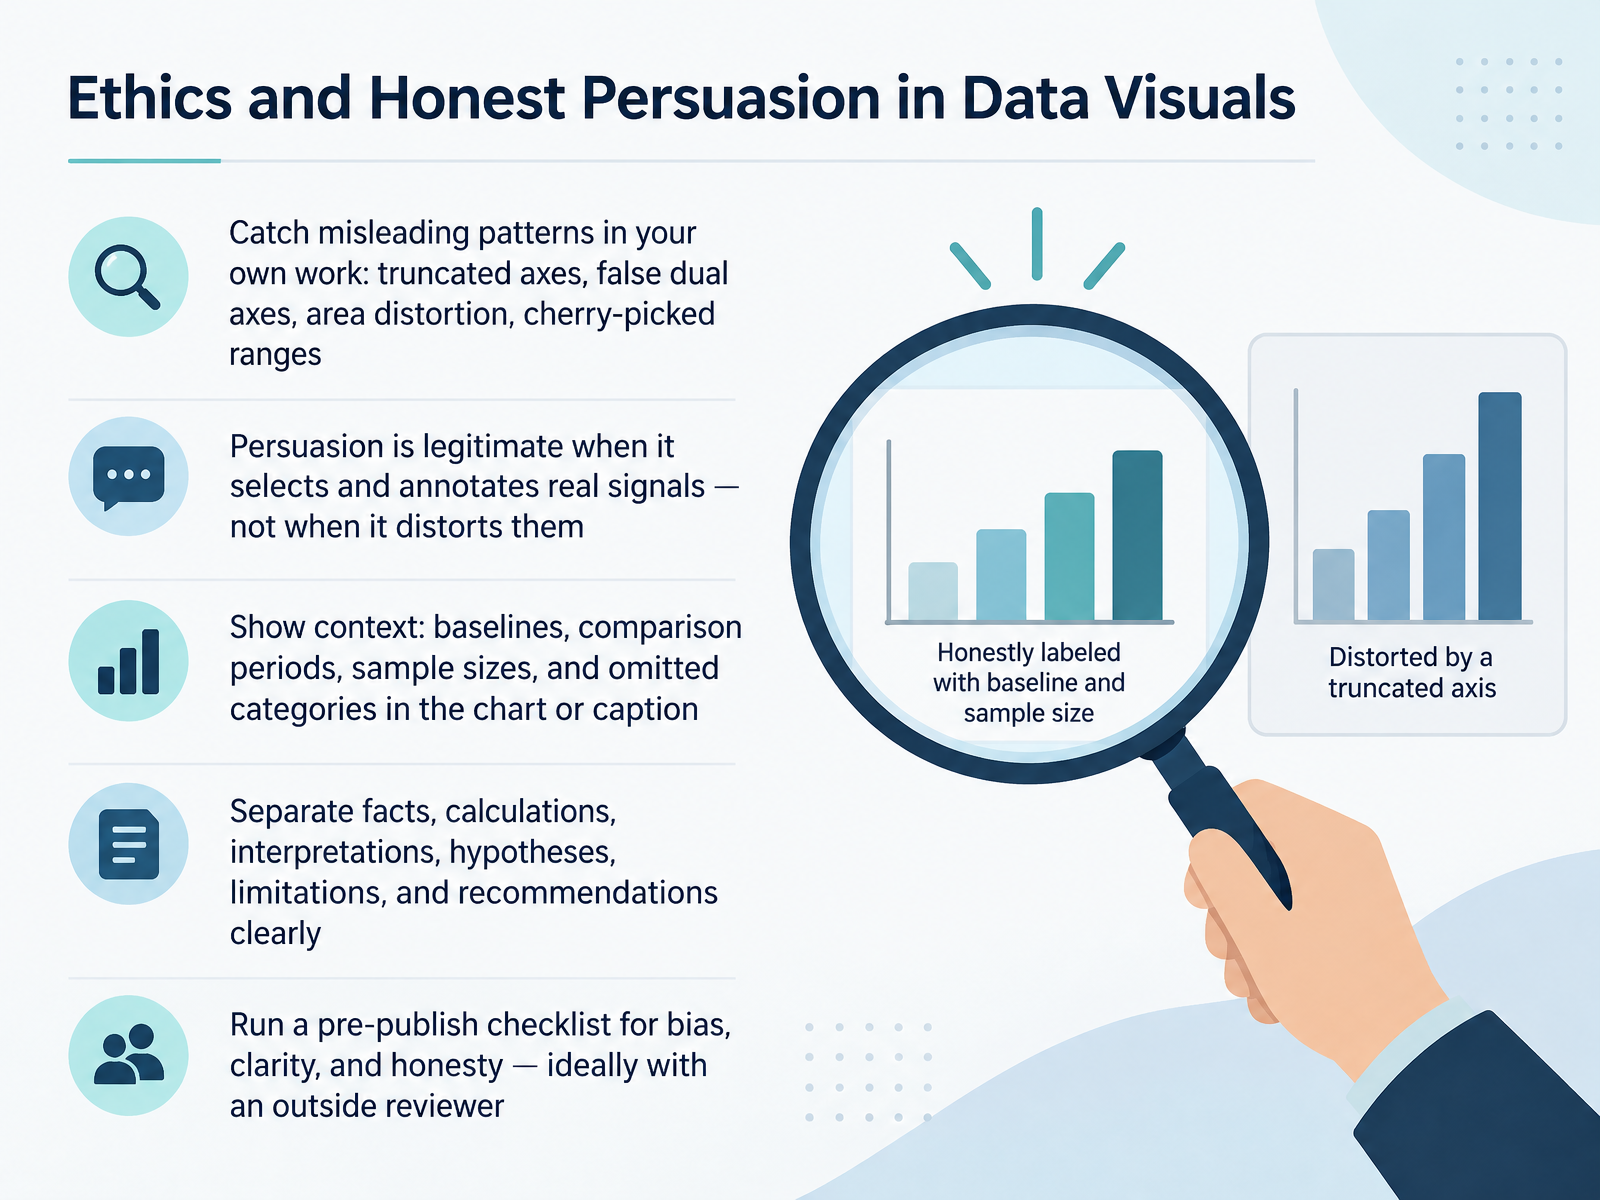
- 12Ethics and Honest Persuasion in Data VisualsNow let's talk about ethics and honest persuasion in data visuals. Before you publish, check your own work for misleading patterns: truncated axes that start above zero, false dual axes that imply a relationship, area distortion in bubbles or pies, and cherry-picked date ranges that hide a trend. Persuasion is legitimate when you select and annotate real signals. It stops being legitimate when the visual distorts them. So show context: baselines, comparison periods, sample sizes, and omitted categories, either in the chart or in the caption. A good practice is to separate facts, calculations, interpretations, hypotheses, limitations, and recommendations clearly, so a reader can tell what the data says from what you conclude. Finally, run a pre-publish checklist for bias, clarity, and honesty, ideally with an outside reviewer who is not invested in the result. That review is especially useful for catching an axis you trimmed without noticing. That brings us to the capstone brief, From Raw Data to Delivered Report.
 doi.orgdoi.orgdoi.org+22 min
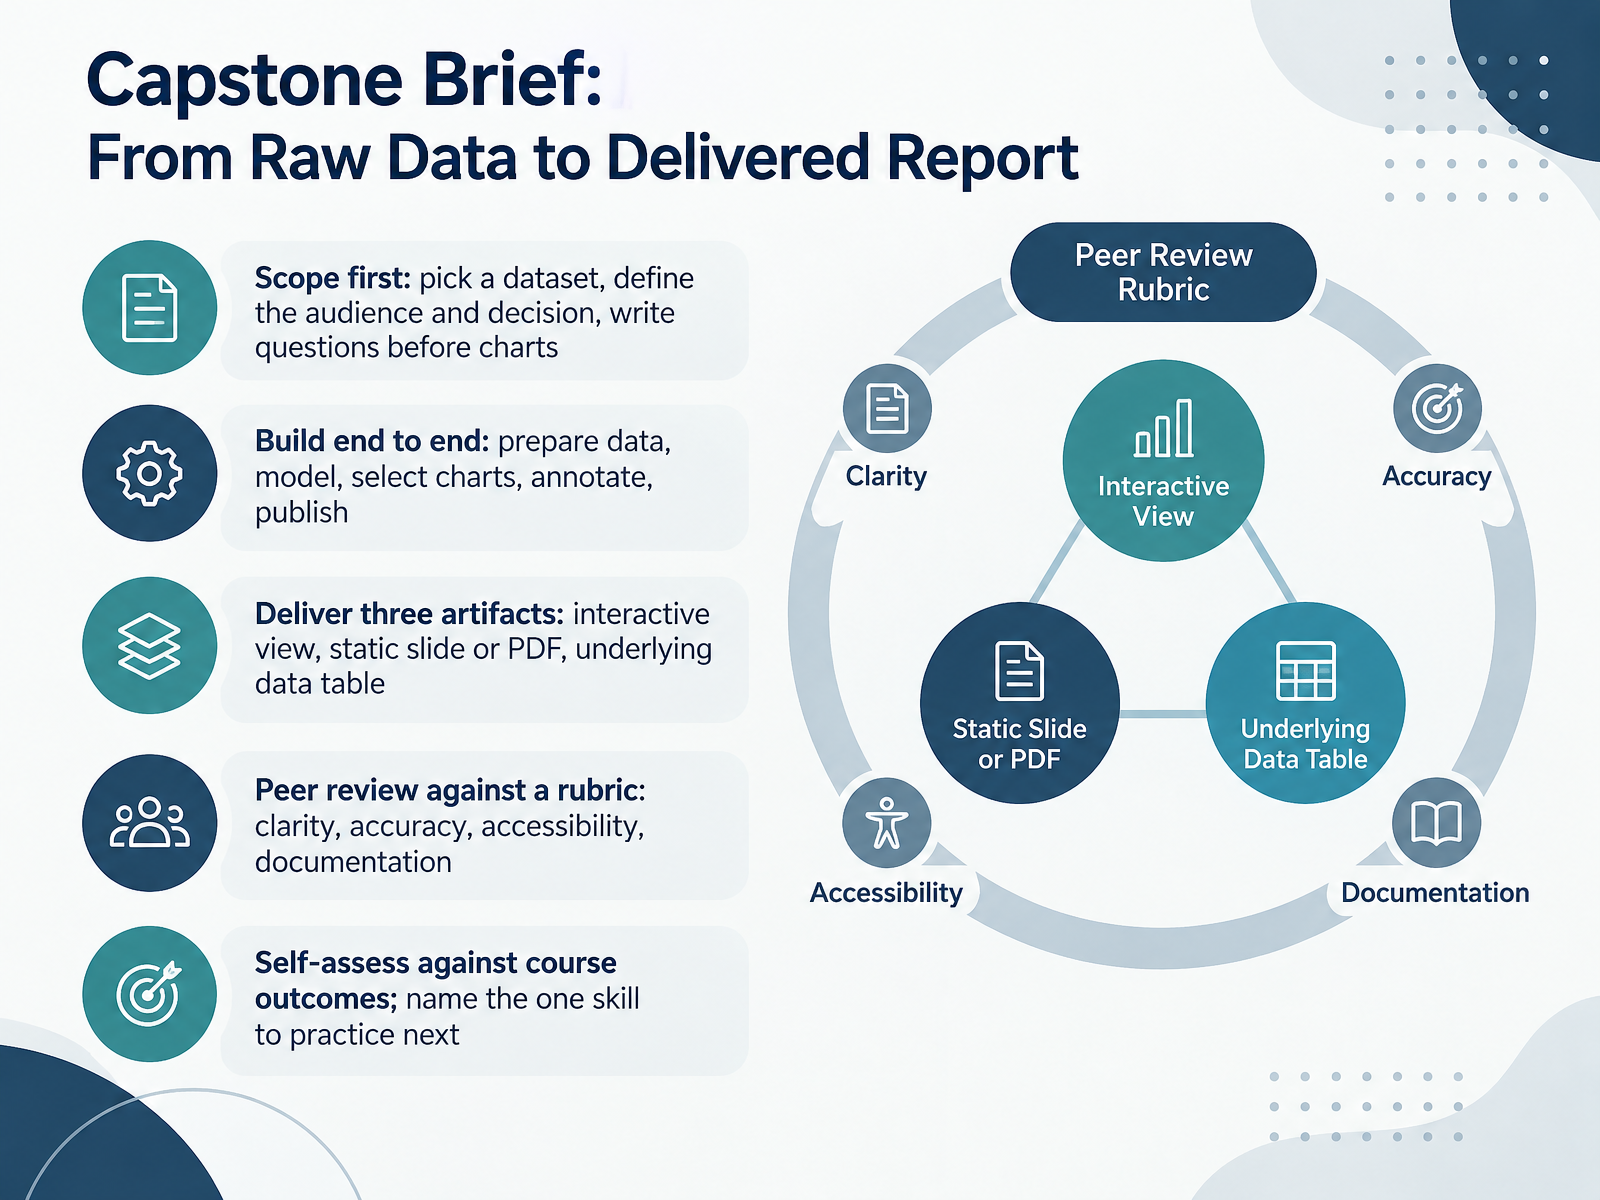
- 13Capstone Brief: From Raw Data to Delivered ReportNow let's put the whole course together in the capstone brief. Start with scope. Pick your dataset, define the audience and the decision it should support, and write your questions before you build any charts. Then work end to end. Prepare the data, model it, select charts, annotate the key findings, and publish. Your deliverable is three artifacts: an interactive view, a static slide or PDF, and the underlying data table. For review, exchange work with a peer and check it against the rubric: clarity, accuracy, accessibility, and documentation. Finally, self-assess against the course outcomes, and name the one skill you will practice next. That single commitment is what turns this capstone into ongoing improvement. In the next slide, we will look at practice rhythm, resources, and next steps.
 owox.cominterviewstack.iojobpedia.ai+21 min
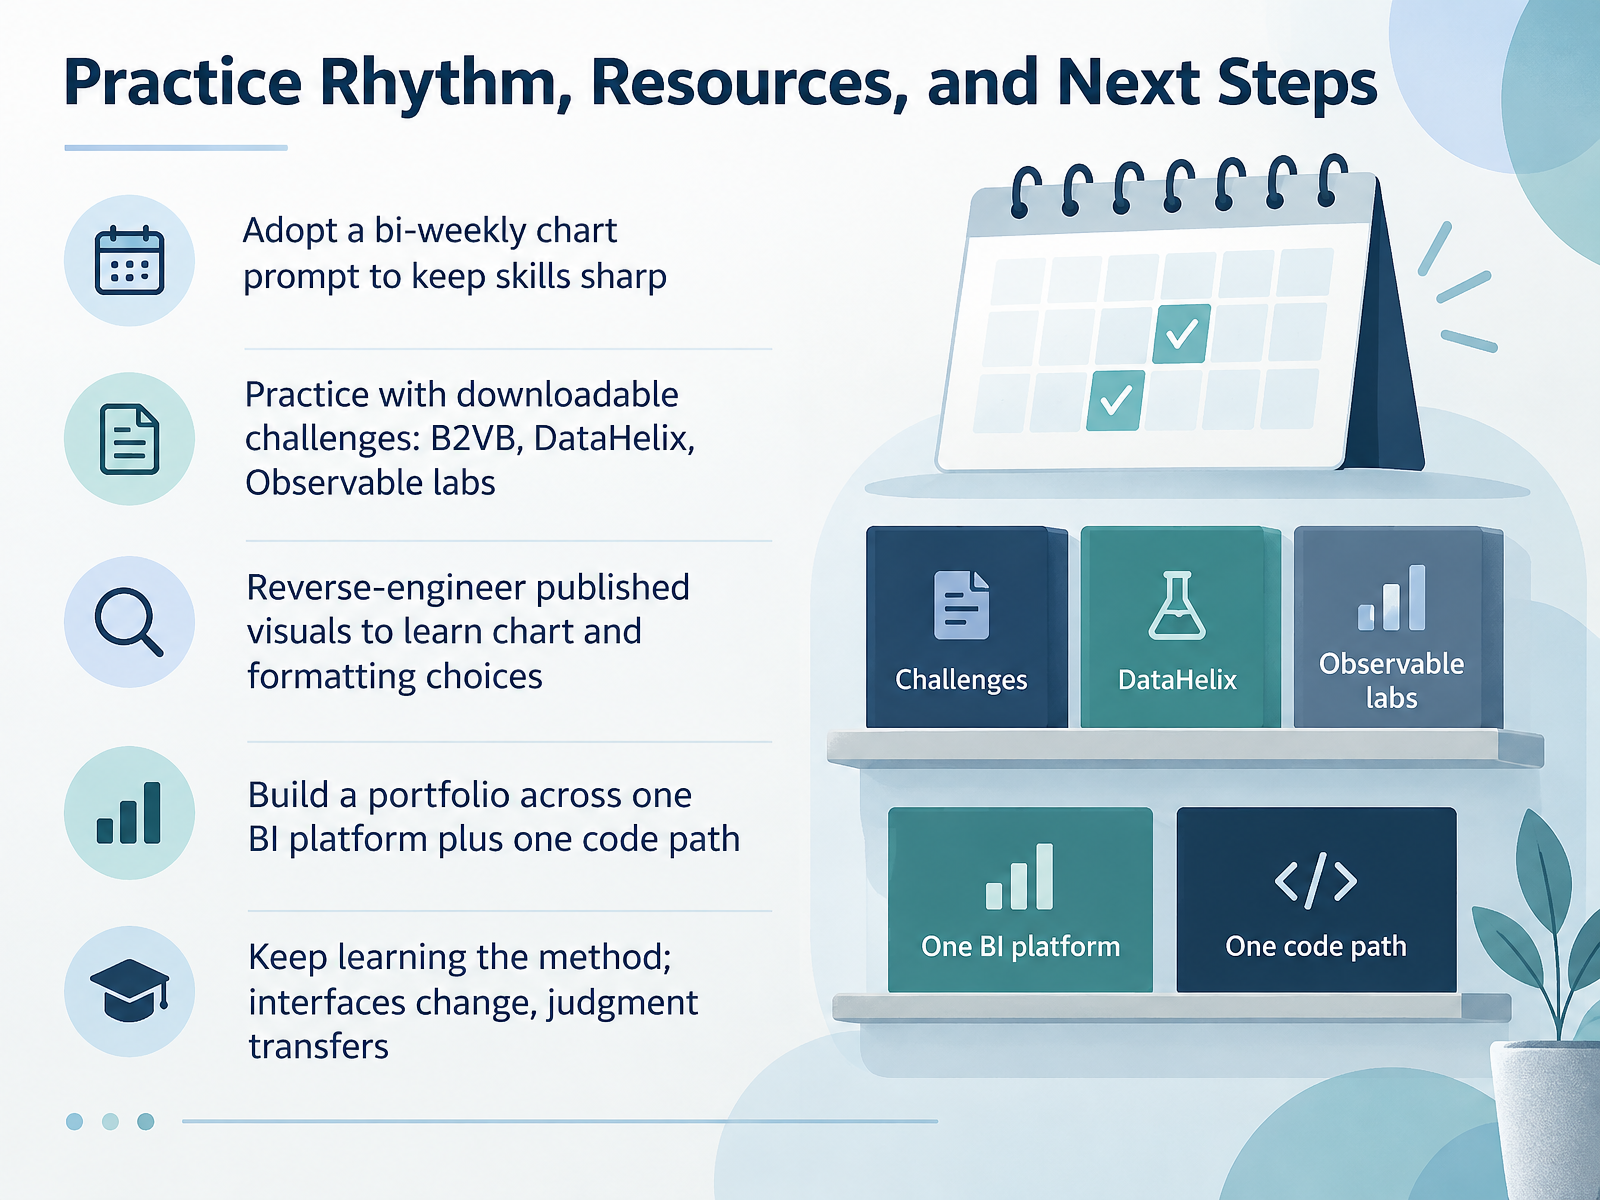
- 14Practice Rhythm, Resources, and Next StepsLet's finish with a practice rhythm you can actually sustain. Set a bi-weekly chart prompt: every other week, take one dataset and build one chart, the way the Back 2 Viz Basics challenges release a new prompt and dataset every other Monday. For structured drills, work through downloadable challenges from B2VB, DataHelix, and Observable labs. Second, reverse-engineer published visuals. Open a chart you admire, identify the chart type, then trace the formatting choices behind it, such as color, labels, and annotations. Third, build a portfolio across one BI platform plus one code path. Go deep on a single platform, Power BI or Tableau, and pair it with one code path, such as Python or R. Last, keep learning the method. Interfaces change, but judgment transfers, so practice choosing the right chart, defining metrics, and labeling units. Thank you for working through this course. Keep the bi-weekly rhythm going, and your judgment will compound.
 owox.cominterviewstack.iojobpedia.ai+22 min
Take the deck with you
Download this course as a file — free, no sign-up needed.
- PDF handoutEvery slide page, ready to print or share.15 pages · 3.3 MBDownload
- Narrated PowerPointThe deck that presents itself — every slide carries the digital human's narration video.15 pages · 15.5 MBDownload
- PowerPoint slidesThe full deck as a .pptx — open it in PowerPoint, Keynote, or Google Slides.15 pages · 3.2 MBDownload
Free to use in your own training — please keep the PersonWise credit page at the end.
Have your own deck? Turn it into a course
Sources consulted
Web sources consulted while building this course.
- Reporting analyst skills from 1,438 real job postings — owox.com
- Business Intelligence Analyst Skills in 2026: The $24K Tool Gap | InterviewStack.io — interviewstack.io
- Data Visualization demand at tech companies: which roles ask for it, 90 days to Oct 9, 2026 · Jobpedia.AI — jobpedia.ai
- Data Visualization and Reporting Analyst at Thermofisher — thermofisher.wd5.myworkdayjobs.com
- Data Analysis Work: Evidence from 126 Vacancies — mtfinstitute.com
- Assessing Effects of Task and Data Distribution on the Effectiveness of Visual Encodings — doi.org
- Rethinking the Ranks of Visual Channels — doi.org
- Redundant Encoding in Data Visualizations: Assessing Perceptual Accuracy and Speed — doi.org
- Graphical Perception and Graphical Methods for Analyzing Scientific Data Author(s): William S. Cleveland and Robert McGill Source: Science, New Series, Vol. 229, No. 4716 (Aug. 30, 1985), pp. 828-833 Published by: American Association for the Advancement of Science Accessed: 03/02/2009 15:37 — webspace.ship.edu
- The Science of Visual Data Communication: What Works — par.nsf.gov
- Available chart types in Office | Microsoft Support — support.microsoft.com
- Use PivotTables and other business intelligence tools to analyze your data | Microsoft Support — support.microsoft.com
- Create a chart with recommended charts | Microsoft Support — support.microsoft.com
- Excel Charts: The Complete Guide to Creating and Customizing Graphs - Learn Excel — learnexcel.io
- Making the Pivot Table More Visual with Charts - Getting Great Results with Excel® Pivot Tables, PowerQuery and PowerPivot® - Wiley Online Library — onlinelibrary.wiley.com
- BI tools comparison | Tableau, Power BI, Looker — surowiecki.org
- Power BI vs Tableau vs Looker: The Definitive Enterprise BI Comparison for 2026 | INI8 Labs — ini8labs.tech
- Data Studio vs Power BI vs Tableau for Marketers (2026) — datastudioformarketers.com
- Power BI vs Tableau vs Looker: Which BI Tool to Choose 2026 — spiderhunts.com
- BI Pricing Index July 2026 — What 30 Plans Really Cost a Team of 5 vs 25 — datahubpro.co.uk