Business Analytics Portfolio Project
Begin
14 pages · ~28 min
Business Analytics Portfolio Project
Learn to create a compelling business analytics portfolio that showcases your data skills and projects to attract employers and advance your career.
What you’ll learn
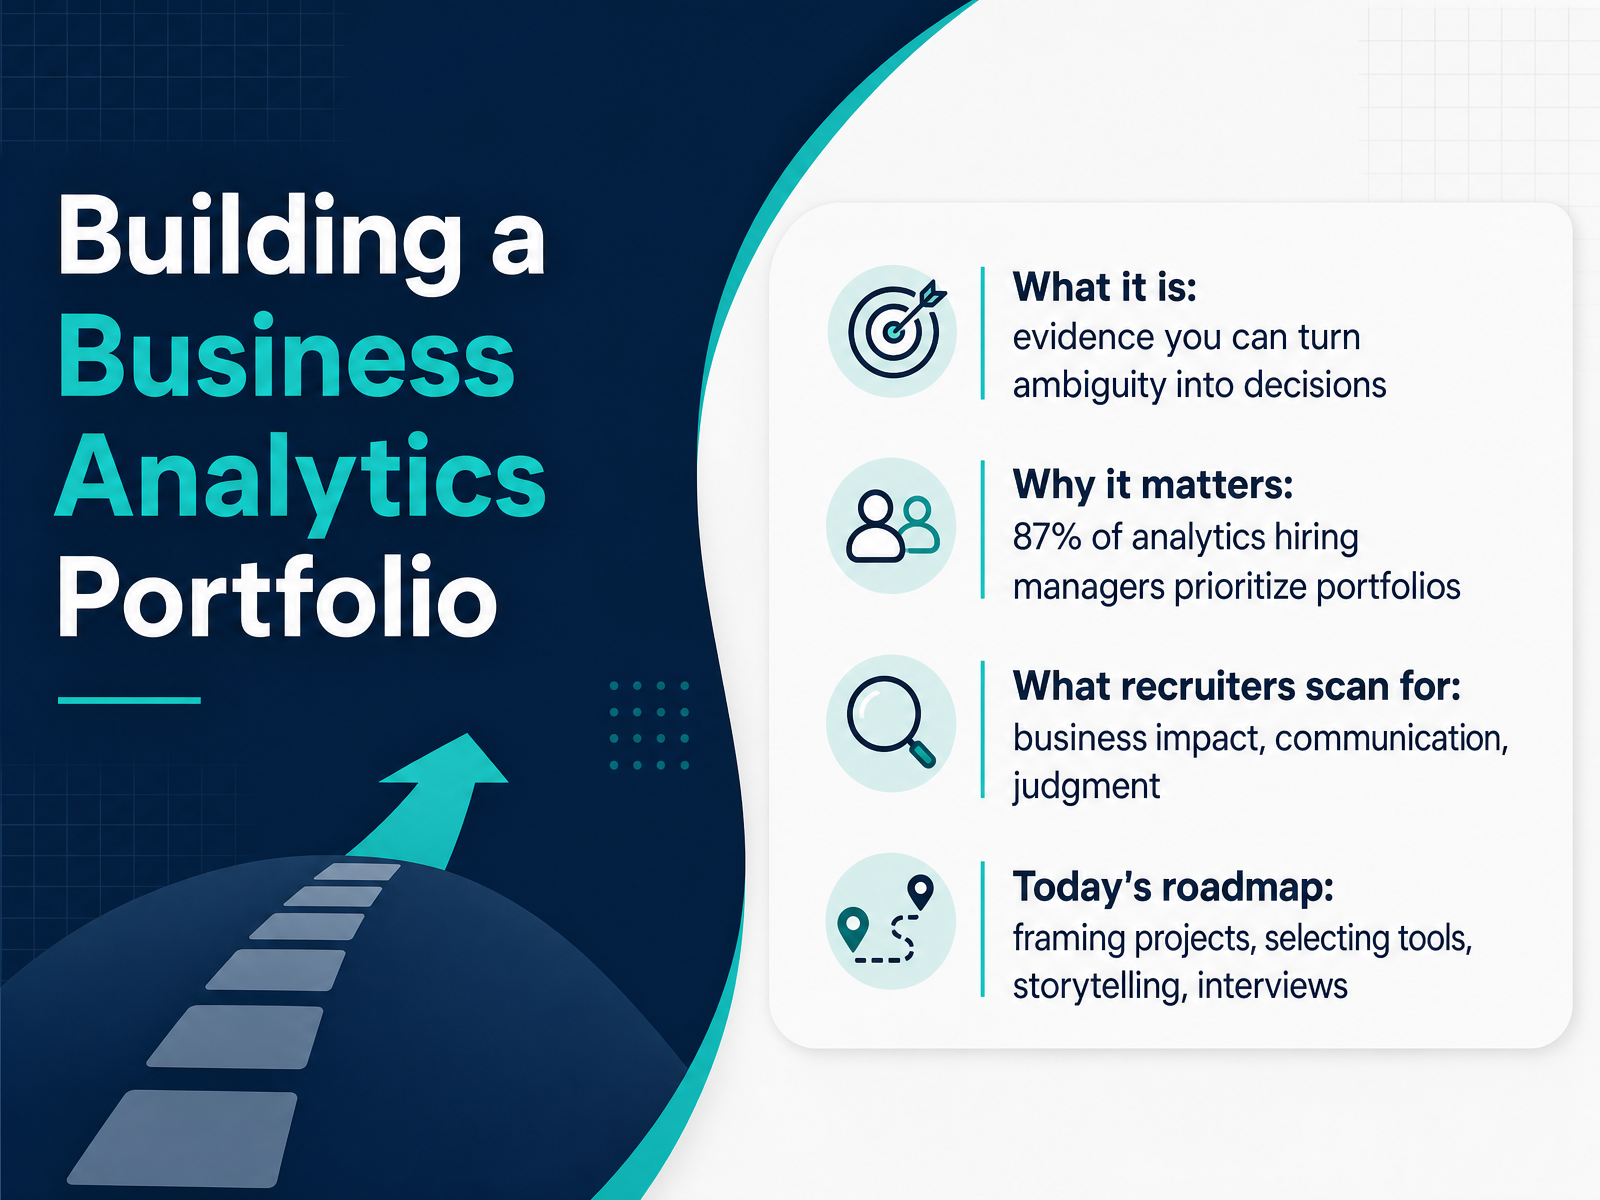
- 01Building a Business Analytics PortfolioWelcome. If you are here, you probably know the tools, or you are learning them, but you are missing the one thing that proves you can actually do the job: a portfolio. Think of it as a project showcase, not a scrapbook. It is evidence that you can take messy, ambiguous business problems and turn them into clear decisions. And that evidence matters more than you might think. In recent surveys, eighty-seven percent of analytics hiring managers say they are more likely to interview candidates who have one. When they open yours, they are not looking for fancy charts. They are scanning for three signals: business impact, clear communication, and your judgment. Today, we are going to build that proof, step by step. We will frame projects that answer real business questions, choose the right tools, tell the story of your analysis, and turn the whole thing into your best interview asset. By the end, you will have a portfolio that opens doors. Let us start by looking at exactly what employers evaluate when they review your work.bavolta.comstaragile.comtraecta.com+21 min
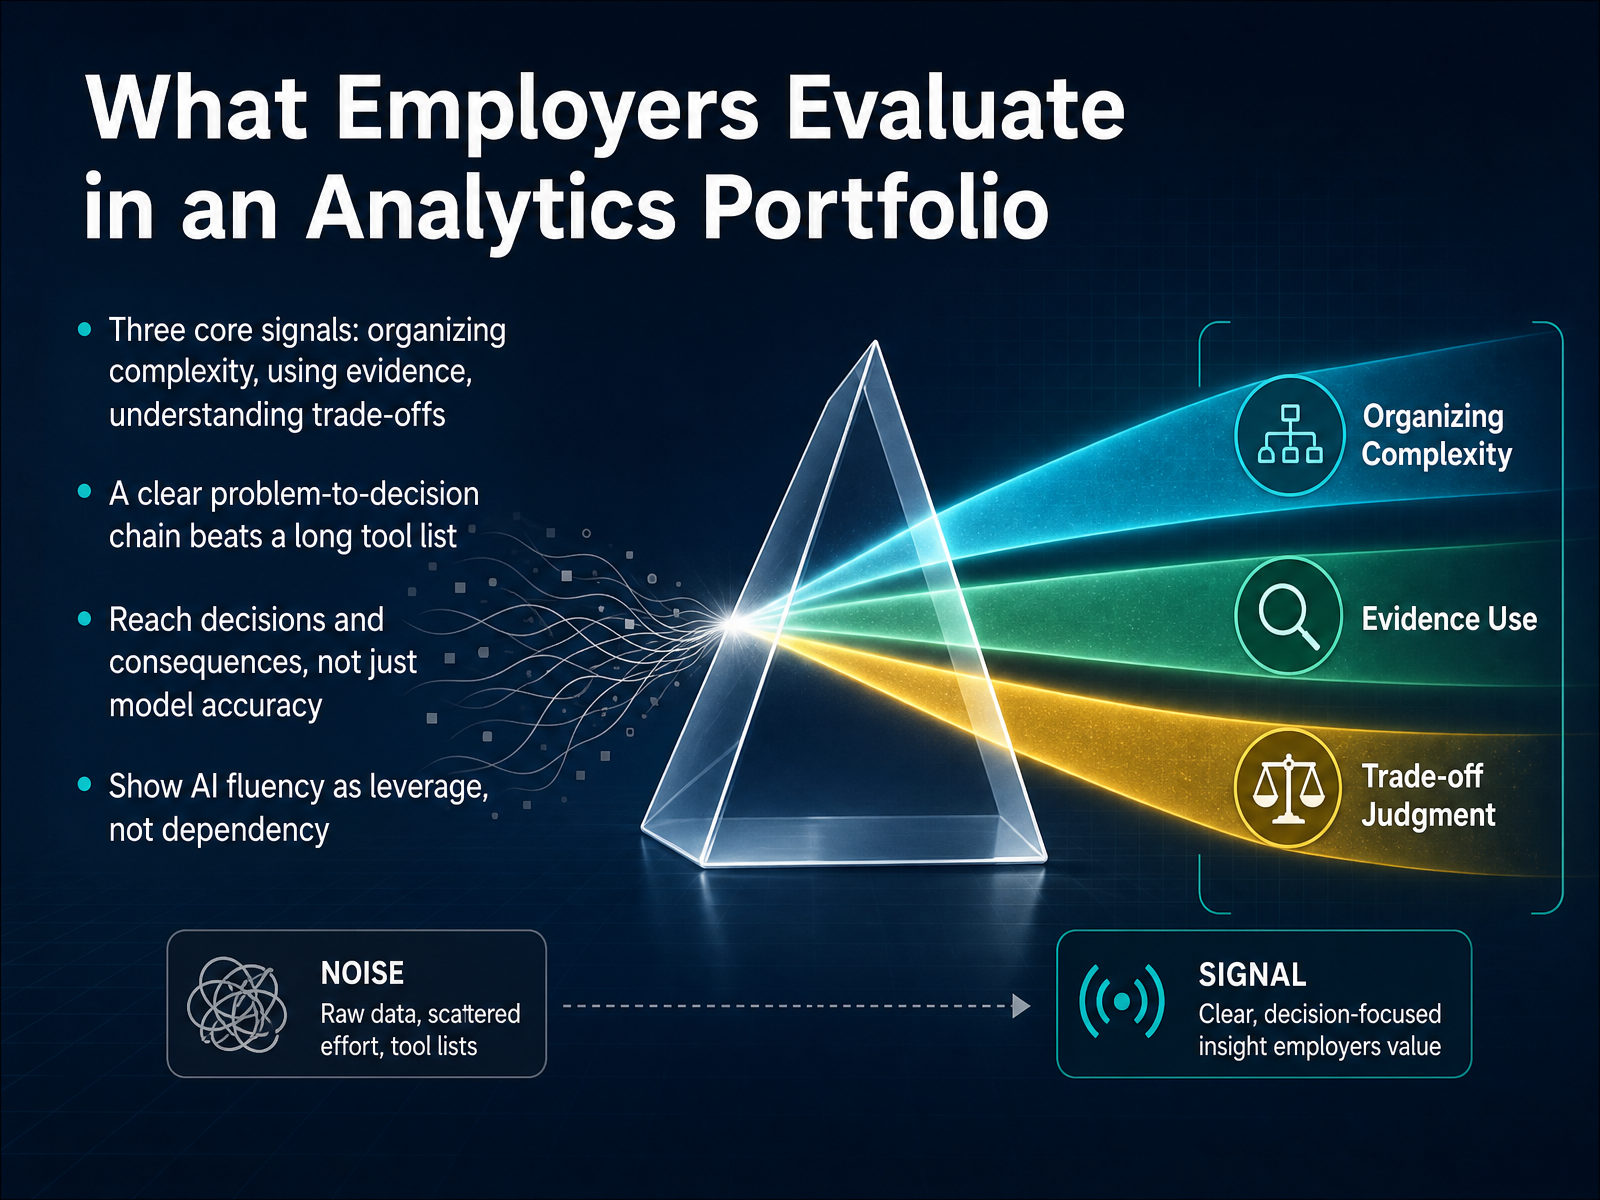
- 02What Employers Evaluate in an Analytics PortfolioLet's talk about what hiring managers are actually looking for when they open your portfolio. It is not a tool list, and it is not a certificate wall. They are scanning for three core signals. First, can you organize complexity? A well-structured document tells them you can bring order to chaos. Second, do you use evidence, not assumptions? Generic statements like 'maintain open communication' tell them nothing. Instead, show you grounded a decision in a specific concern someone raised. Third, do you understand trade-offs? In real projects, budget fights scope, and speed fights quality. Show them you can navigate that tension. And here is the key point: a clear problem-to-decision chain beats a long tool list. They want to see a project carried all the way to a decision and its consequence, not just a model with good accuracy. Finally, show AI fluency as leverage, not dependency. It is fine to say you used an AI tool to draft initial SQL, as long as you validated and corrected the logic yourself. That signals judgment. Keep these three signals in mind as we move to choosing projects that prove business capability.
 bavolta.comstaragile.comtraecta.com+22 min
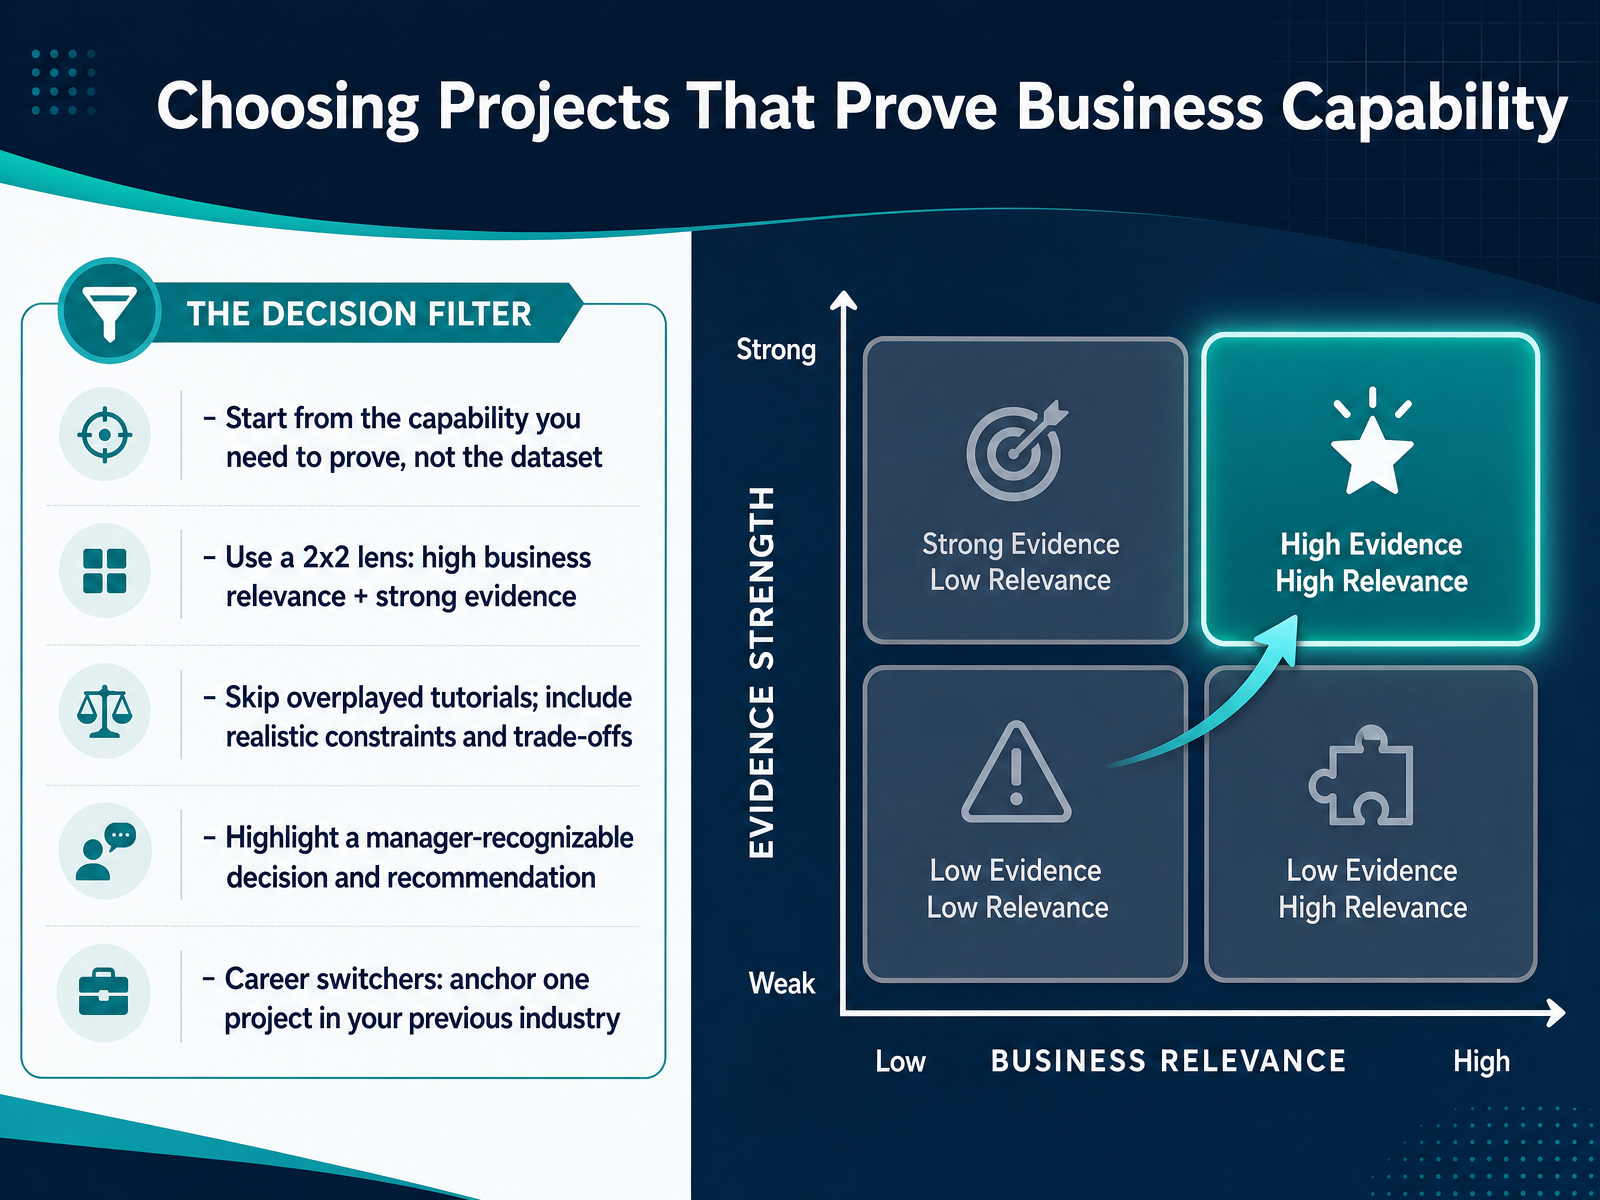
 - 03Choosing Projects That Prove Business CapabilityNow, let's talk about choosing the right projects for your portfolio. Here's the key principle: start with the capability you need to prove, not with the dataset. Instead of asking what data is available, ask which skill a hiring manager needs to see from you. Do you need to prove you can drive retention, reduce costs, or spot revenue opportunities? Once you name that skill, finding the project becomes much easier. A useful way to screen ideas is a simple two-by-two lens. You want projects that score high on business relevance and high on evidence strength. That means the problem is one a manager actually faces, and the analysis gives you clear, defensible proof of your recommendation. Skip the overplayed tutorials. The world doesn't need another generic sales dashboard built from the same famous dataset. Instead, build something with realistic constraints and trade-offs, like data that's messy or incomplete, and explain how you handled it. The goal is to highlight a decision a manager would recognize, plus a clear recommendation they could act on. If you're a career switcher, here is your secret weapon: anchor at least one project in your previous industry. If you worked in retail, analyze inventory trade-offs. If you came from finance, build a revenue forecast. Your domain knowledge is an advantage that analysts without that background can't replicate. So choose fewer projects, but make every one prove a real business capability. Next, let's talk about framing the business question before you even touch the data.
 dedensembada.comgithub.laiyagushi.comtraecta.com+22 min
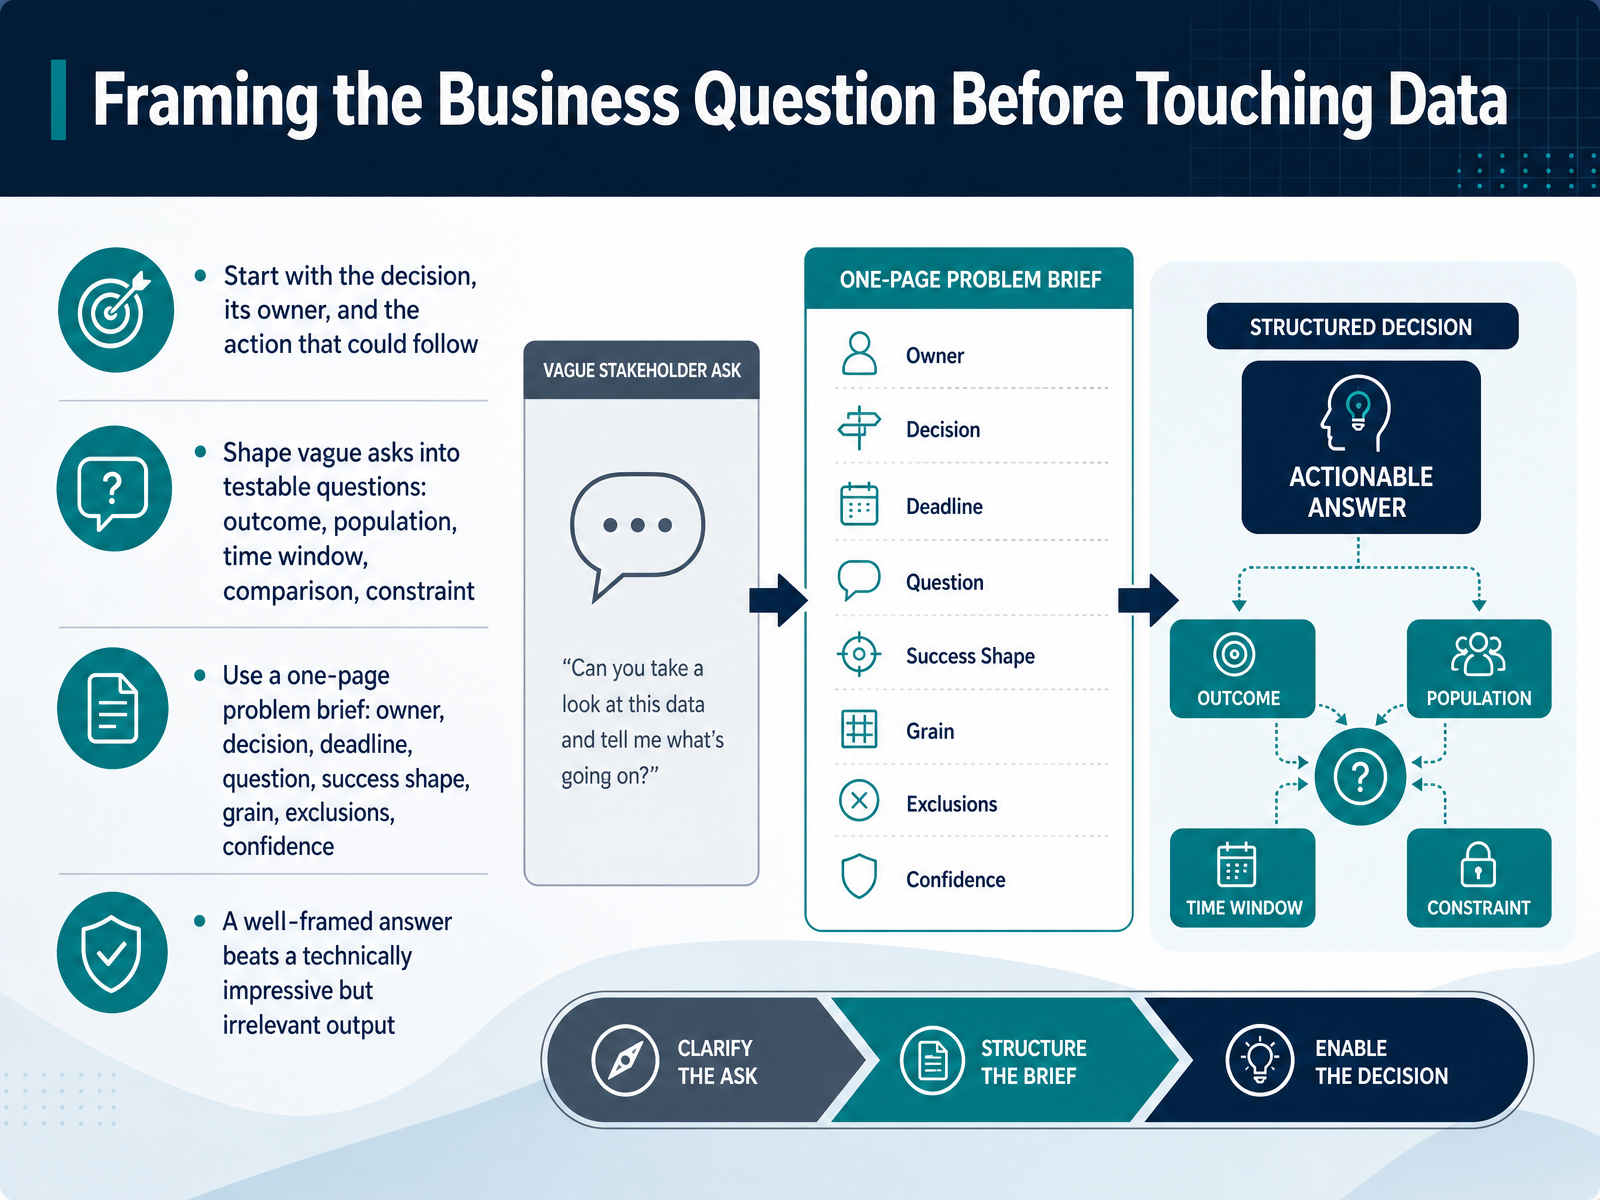
 - 04Framing the Business Question Before Touching DataSo here is where the real skill comes in. Before you touch a single row of data, you need to frame the business question. Start with the decision. Who owns it, and what action could they take with your answer? A vague request like, "help us understand churn" is just a topic, not a question. Shape it into something testable. Ask, for which customer segment, over what time window, compared to what baseline, and under what constraints? Use a one-page problem brief to lock this down. It includes the decision owner, the decision itself, the deadline, your question, what success looks like, the analysis level, and what to exclude. A well-framed answer always beats a technically impressive but irrelevant output. Remember, your job is to make a decision clearer, not to show off your code. Now, let's switch gears and talk about selecting the right tools and hosting platforms.
 informs.orgtivon.ioanalyticsmadesimple.com+22 min
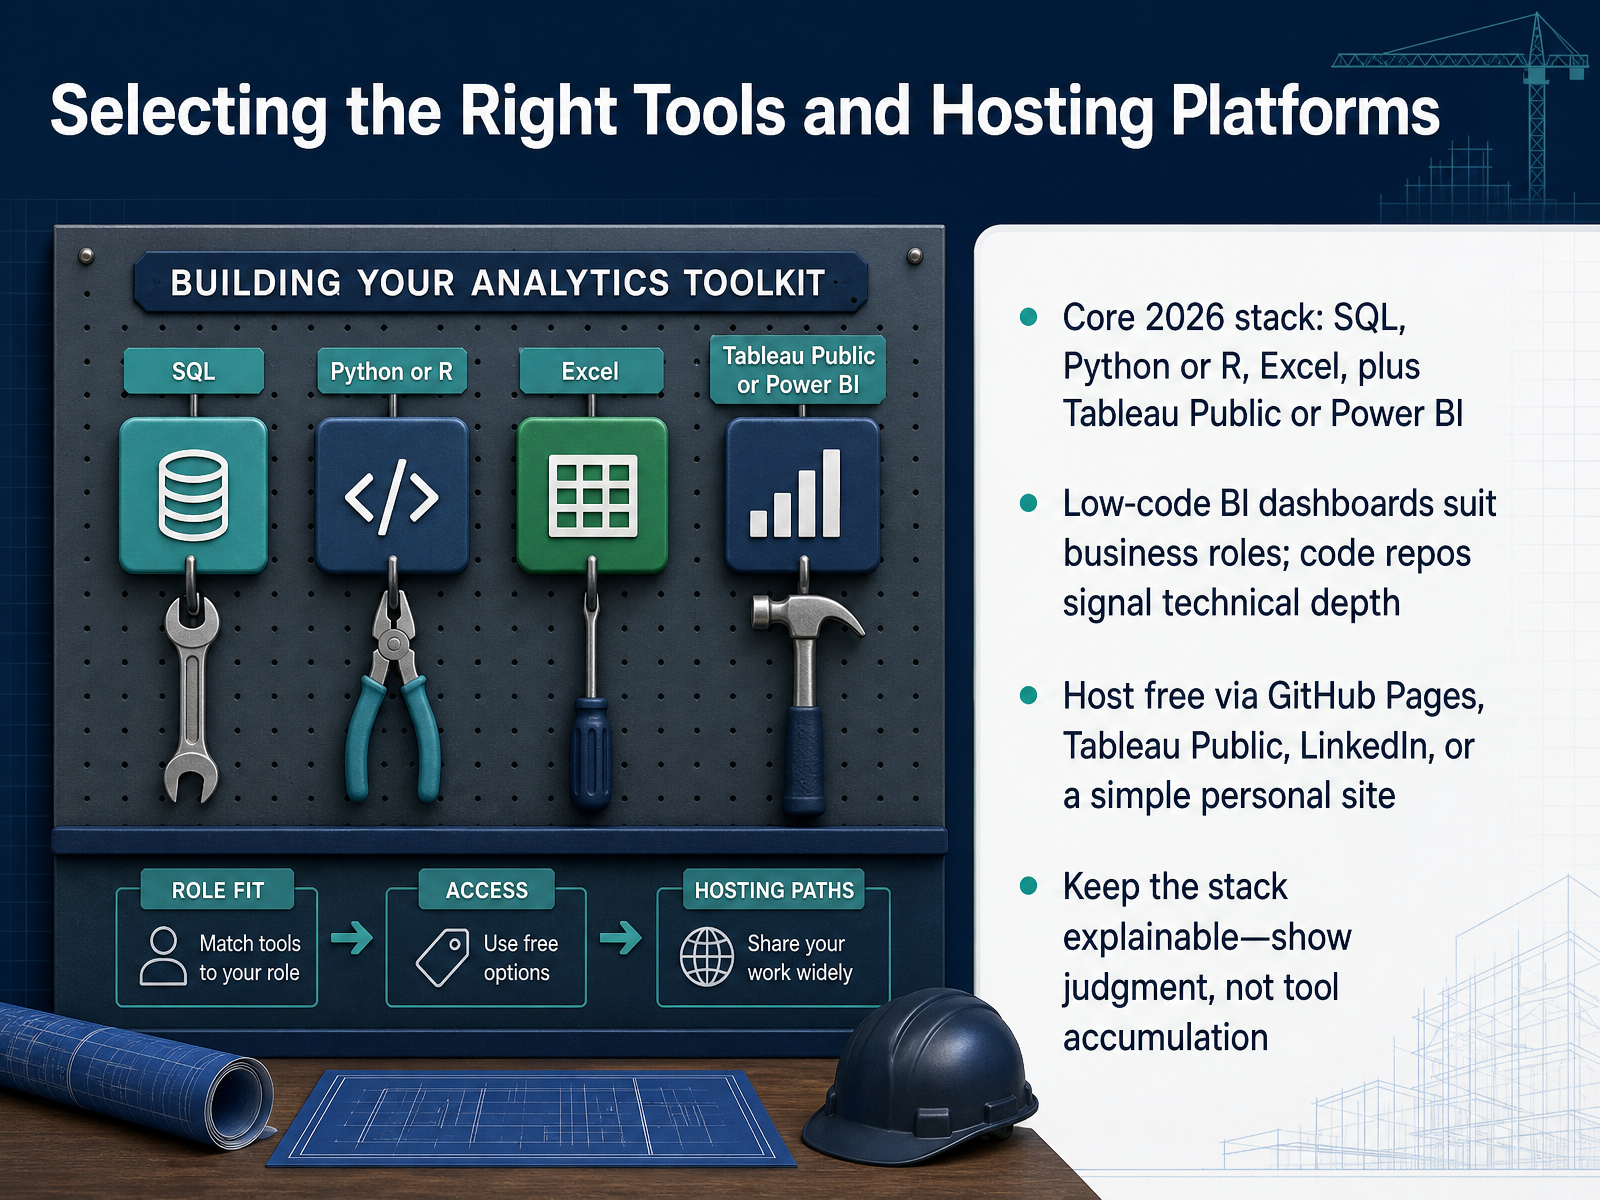
 - 05Selecting the Right Tools and Hosting PlatformsNow, let's talk about picking the tools that will actually help you land that first role. In 2026, the core stack is SQL for querying data, Python or R for deeper analysis, Excel for quick modeling, and Tableau Public or Power BI for your dashboards. Notice these are all free or have free versions, so cost is never an excuse to delay. If you're aiming for a business-facing role, low-code BI tools like Power BI and Tableau signal that you can communicate with stakeholders. If you're targeting more technical positions, a repository with clean Python and SQL code proves your depth. You can host everything at no cost on GitHub Pages or Tableau Public, and always link to it from LinkedIn. But here is the key principle: keep your stack small and explainable. Hiring managers want to see judgment, not a collection of tools. It is far better to show one polished end-to-end project in Power BI than to mention six tools you barely touched. So decide on your primary platform today, and make that the home for your first project. Starting next, let's look at how to structure that project from start to finish for maximum impact.
 mokkup.aidatascienceportfol.iomedium.com+22 min
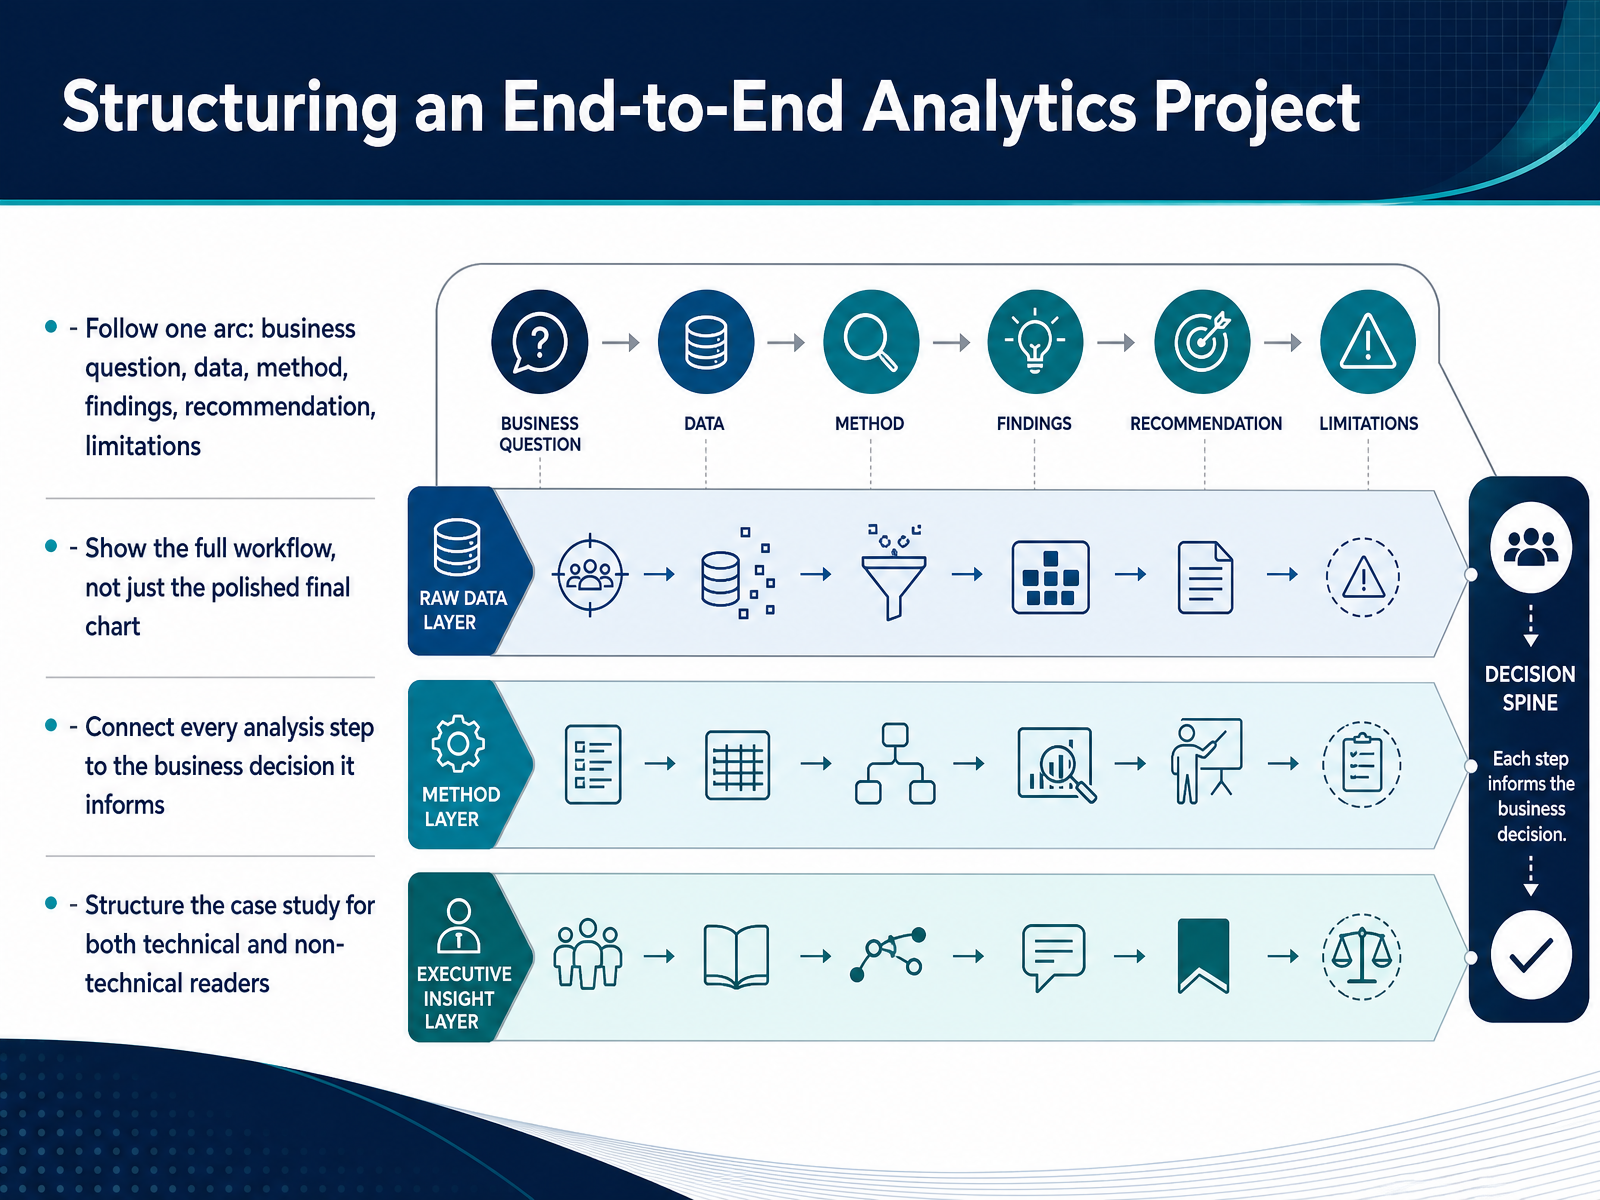
 - 06Structuring an End-to-End Analytics ProjectNow let's talk about structure. When you build a portfolio project, the most common mistake is jumping straight to the data or the charts. Instead, think of each project as a complete journey that starts with a business problem and ends with a decision. The strongest case studies follow one clear arc: business question, data, method, findings, recommendation, and limitations. Even if your final chart is beautiful, it's the messy middle—how you cleaned the data, why you chose a certain method, what you tried that didn't work—that shows employers how you think. Instead of polishing just the final result, walk your reader through the workflow. And here's the key: connect every single analysis step back to the business decision it informs. If you're analyzing customer churn, don't just show a model with high accuracy. Explain that your model helps the retention team decide which customers to target with discount offers. Finally, write the case study for both technical and non-technical readers. That means the technical details are there, but the narrative is clear enough for a manager to understand the value. When you structure a project this way, you're not just showing you can use tools—you're proving you can drive business outcomes. Next, we'll look at how to write for non-technical decision makers, because your analysis is only powerful if your audience understands it.
 bavolta.comstaragile.comtraecta.com+22 min
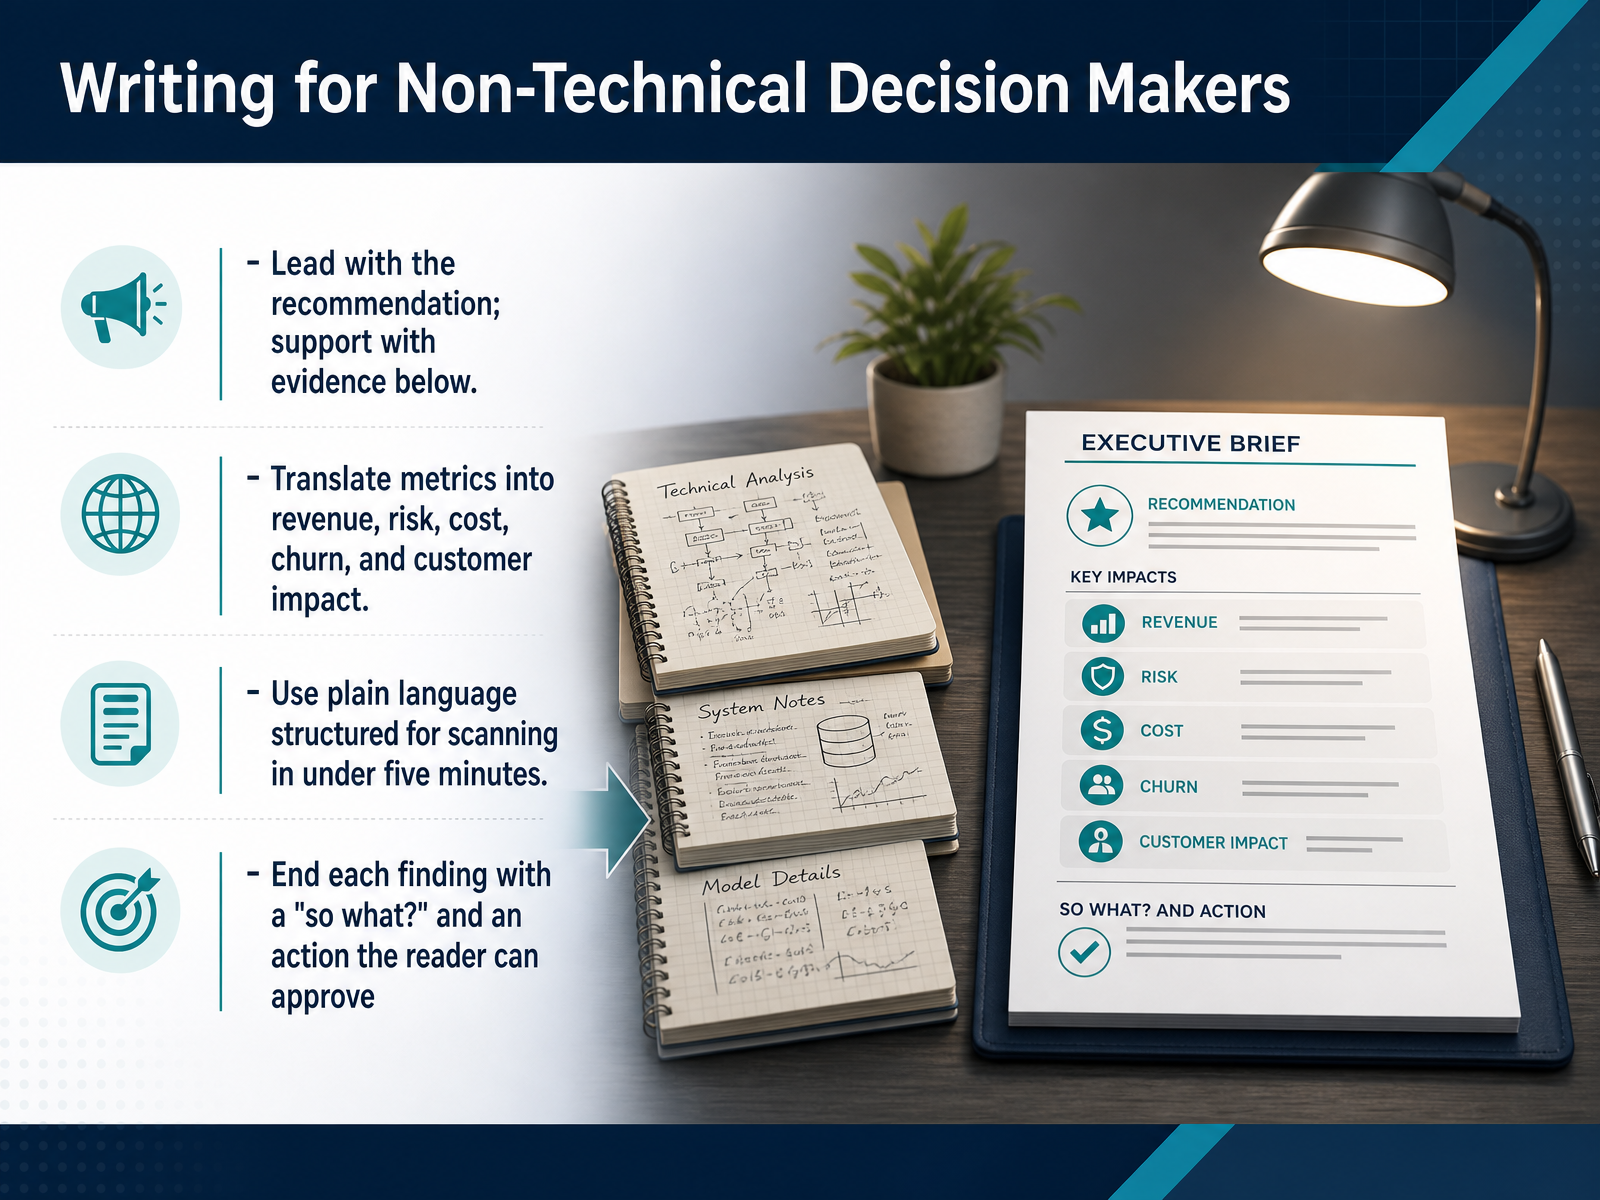
 - 07Writing for Non-Technical Decision MakersNow let’s talk about writing for the people who actually make decisions—the non-technical leaders who don’t have time to decode your charts. Your rule of thumb is simple: lead with the recommendation, then support it with evidence. Think of it like a news article—the headline delivers the answer, and the details come after. Translate your metrics into their language: revenue, risk, cost, churn, customer impact. Don’t say, “The model shows a coefficient of 0.8.” Say, “Customers who delay onboarding churn seven times more often, costing us about two hundred thousand dollars a year.” Use plain language structured for scanning. A leader should grasp your point in under five minutes. If they have to hunt for the insight, you’ve already lost them. And end every finding with a “so what?” followed by an action they can approve. For example, “We recommend shifting twenty percent of ad spend to email, which projects an additional three point two million in annual revenue.” That turns data into a decision. Before you move on, remember this test: if the reader only read your first paragraph, would they know exactly what you want them to do? If not, rewrite it. Next, we’ll look at designing visuals that support the insight instead of obscuring it.
 2 min
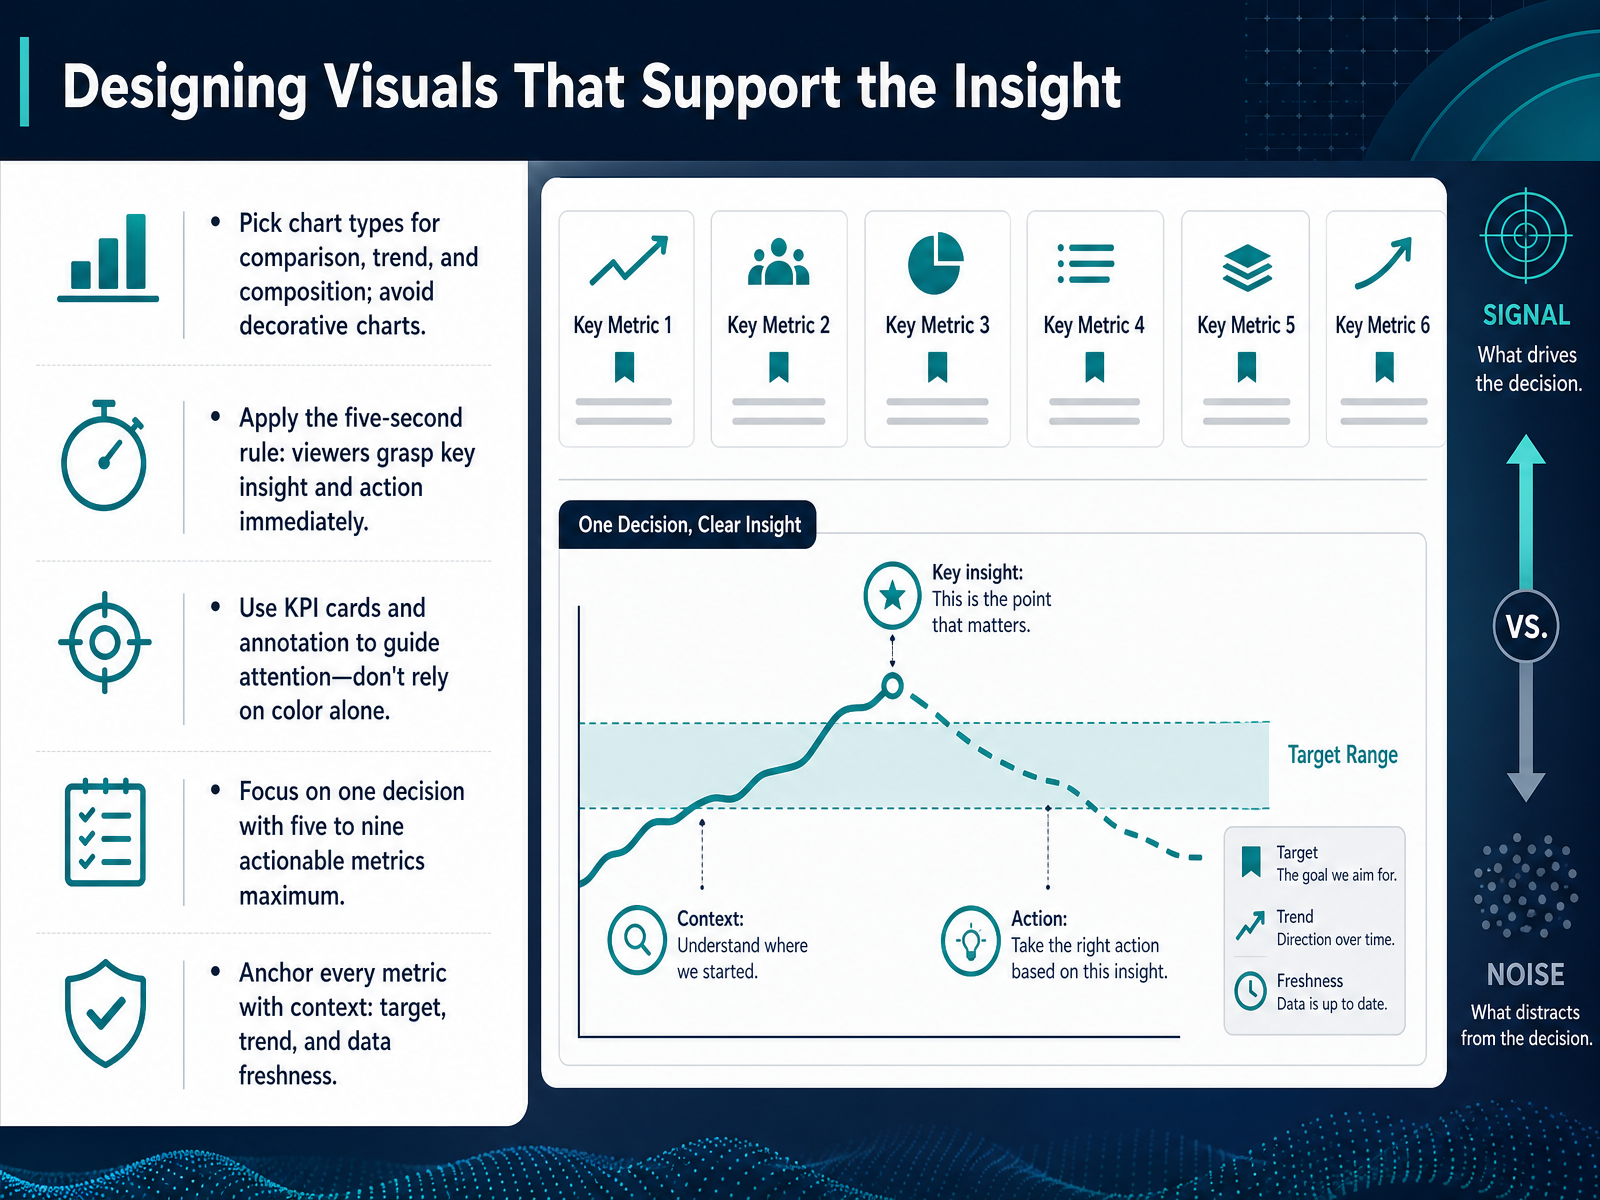
2 min - 08Designing Visuals That Support the InsightNow let's talk about the visuals themselves, because this is where many portfolios lose impact. Pick chart types that actually support the insight you're presenting: use comparisons, trends, and composition, not decorative charts. Apply the five-second rule: anyone glancing at your dashboard should grasp the key insight and the action needed within five seconds. If they can't, simplify. Use KPI cards and annotations to guide attention—don't rely on color alone, since not everyone perceives it the same way. Focus on one decision per view with five to nine actionable metrics maximum, which matches how much information people can process at once. And anchor every metric with context: what's the target, what's the trend, and when was the data last refreshed. A number without context is just noise. Keep these principles in mind as we move into assembling a navigable portfolio.
 1 min
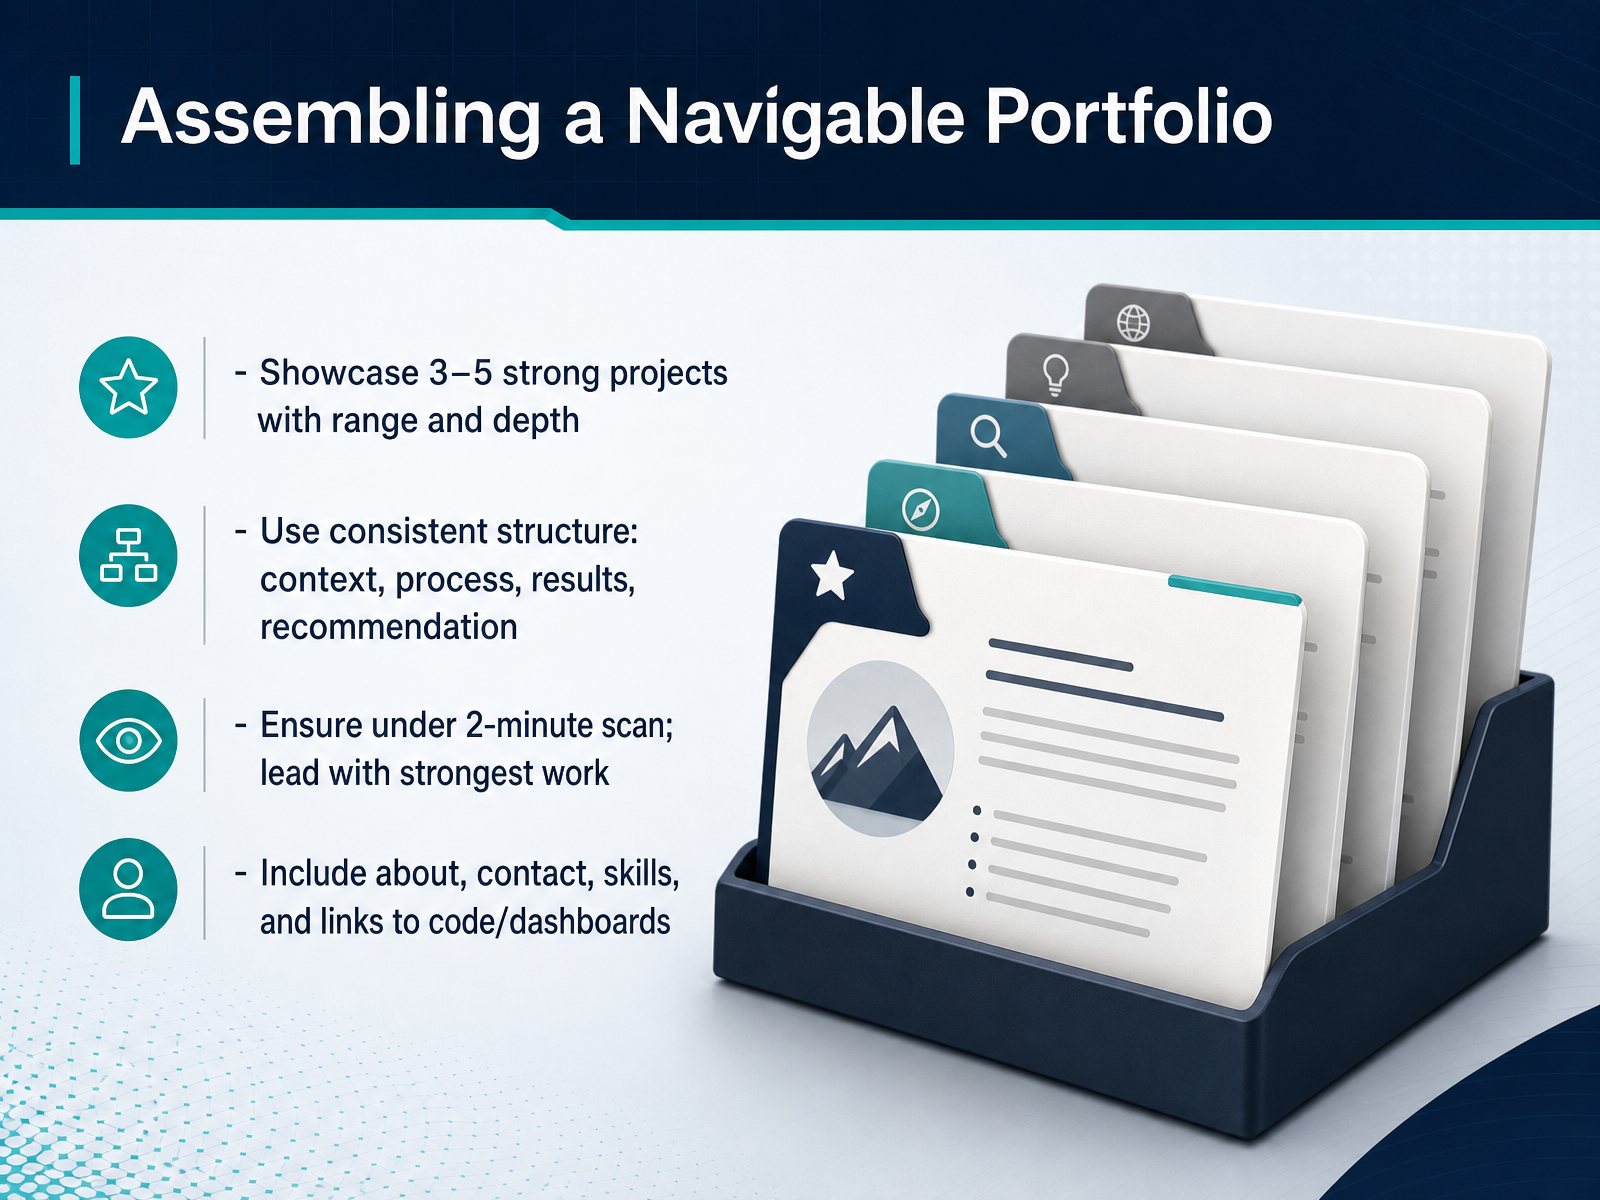
1 min - 09Assembling a Navigable PortfolioNow let’s talk about assembling a navigable portfolio, because how you organize your work matters just as much as the work itself. Think of it like a well-designed storefront: if visitors can’t find what they’re looking for in the first couple of minutes, they’ll walk away. Aim for three to five strong projects that show range and depth. Quality beats quantity every time. For each project, keep the same structure: context, process, results, and recommendation. That consistent flow makes it easy for recruiters to compare pieces and understand how you think. A quick test: can someone scan your portfolio in under two minutes and grasp your value? If not, simplify. Lead with your strongest work to hook them immediately. Beyond the projects, make sure the basics are effortless to find. Include an about section, a clear way to contact you, a summary of your skills, and working links to your code, dashboards, or any live demos. The goal is to remove friction and let your thinking shine. Once case-study structure feels clear in your mind, we’ll move on to how you present those projects in interviews.
 2 min
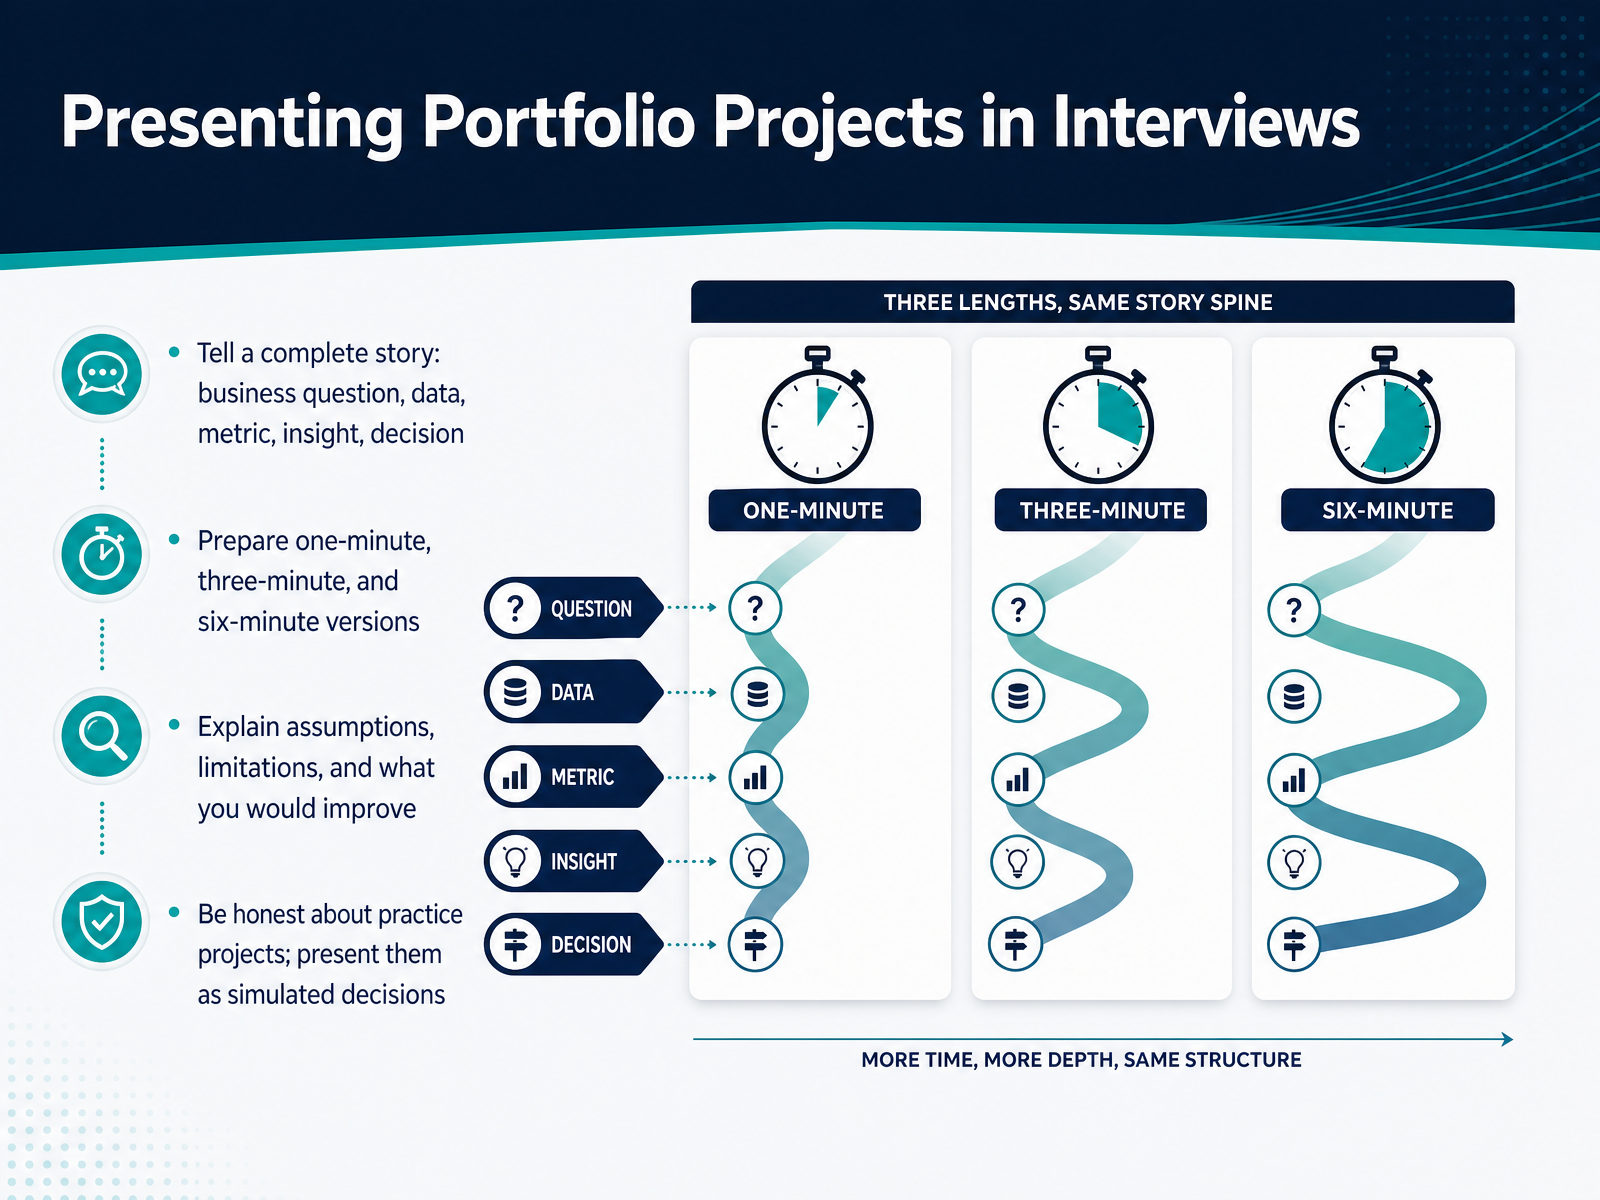
2 min - 10Presenting Portfolio Projects in InterviewsNow let’s talk about the moment your portfolio has been preparing you for — presenting it in an interview. The goal is not to walk through every chart or code snippet. Instead, tell a complete story: the business question, the data you used, the key metric, the insight, and the decision it supports. For example: I wanted to know why repeat purchases were dropping. I analyzed six months of transaction data, focused on the repeat purchase rate, and found that high-volume customers were buying less. That led to a recommendation for a targeted retention campaign.
Prepare one-minute, three-minute, and six-minute versions of that story. You never know how much time the interviewer will give you, so have a tight version ready that still covers the full arc.
The final point is about honesty. Practice projects are fine — many candidates have them. Just be upfront. Say it was a simulated business decision, then explain what you would recommend based on your findings, and what you would improve with more time.
Keep this in mind as we move on to talking through the decision rather than the tool tour.
 1 min
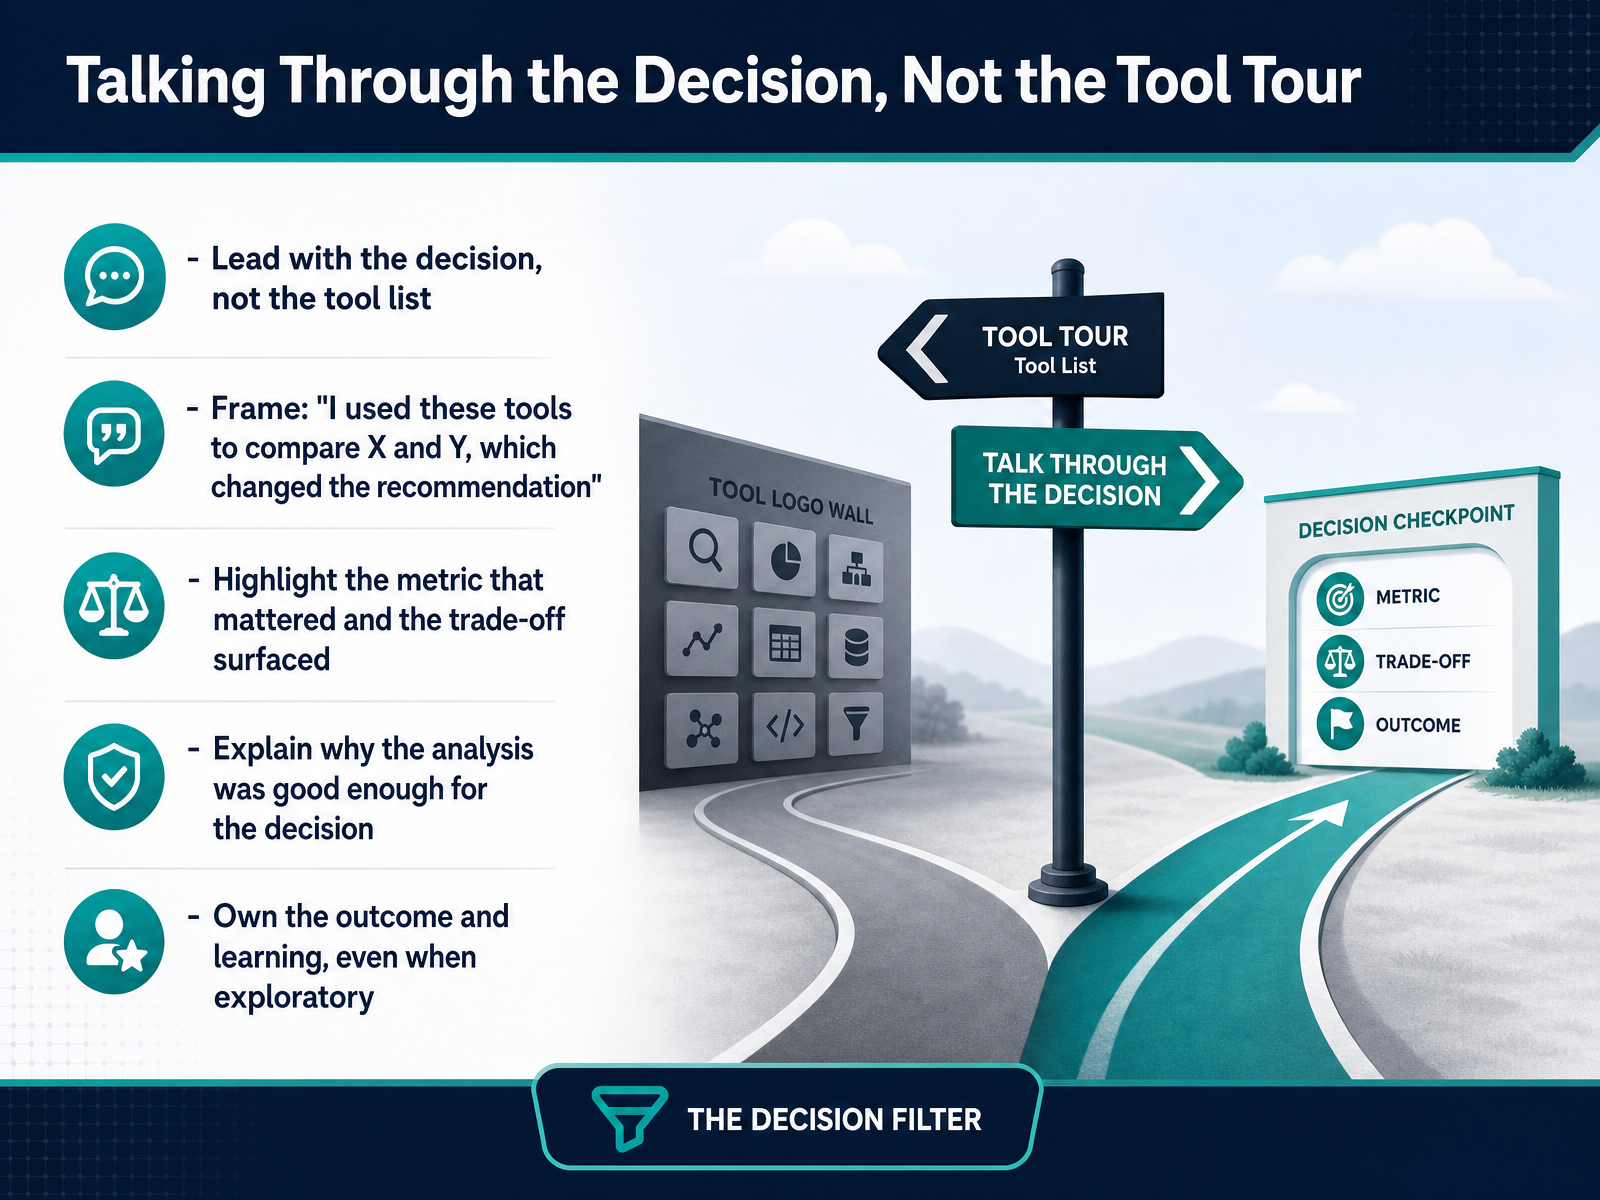
1 min - 11Talking Through the Decision, Not the Tool TourLet’s talk about how you actually walk someone through your work. The biggest mistake candidates make is treating this like a tool tour. They list every chart, filter, and dashboard page. But hiring managers don’t hire tools—they hire judgment. So, lead with the decision. Start with a simple frame: “I used these tools to compare average order value against order volume, and that changed my recommendation.” Do you hear how that works? The tool is supporting the story, not driving it. Now, highlight the one metric that mattered most. Keep it decisive, like customer churn rate, not five different KPIs. And be honest about trade-offs surfaced. Explain why your analysis was good enough to act on, even if the data was messy or incomplete. Finally, own the outcome. If a recommendation didn’t pan out, or if it was only an exploratory analysis, say what you learned. That honesty builds trust. Remember: the interviewer wants to hear how you think. The decision you made IS your thinking made visible. Now, let’s look at why your portfolio should keep evolving over time.
 bavolta.comstaragile.comtraecta.com+22 min
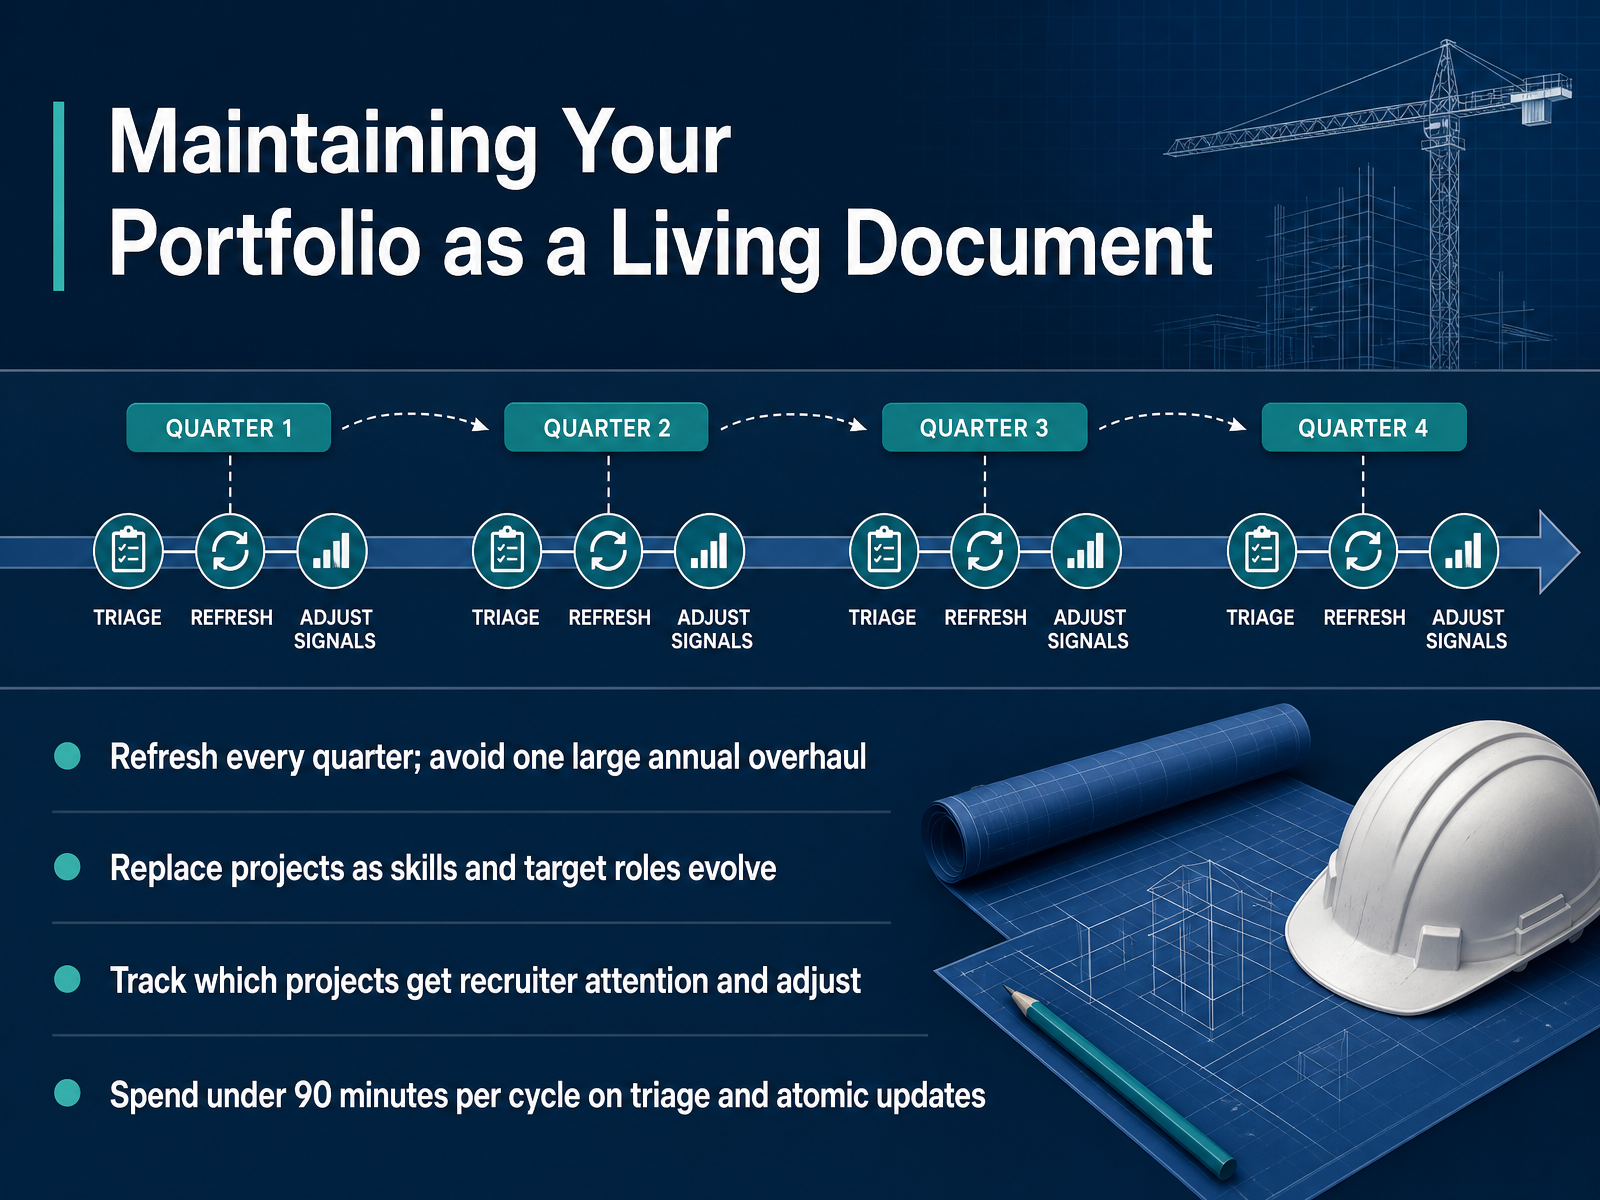
 - 12Maintaining Your Portfolio as a Living DocumentThink of your portfolio as a living document, not a static trophy case. It needs regular care to stay relevant. The best approach is to refresh it every quarter. Small, consistent updates beat one massive annual overhaul every time. As you learn new tools and your target roles shift, swap out older projects. Showcase the work that reflects where you're heading, not just where you've been. Also, pay attention to which projects actually get recruiter attention. Use the analytics on your portfolio site if you have them. If a case study isn't getting views or traffic, consider tweaking its title or description. If it still underperforms, it might be time to replace it. The whole process should take you under ninety minutes. That's the time to triage your projects, make a few atomic updates like refreshing one case study, and prune anything outdated. Schedule this like a meeting with yourself. Consistent small refinements will compound over time. This keeps you interview-ready, and it signals to recruiters that you're actively growing. Next, let's talk about getting feedback and building your credibility.
 2 min
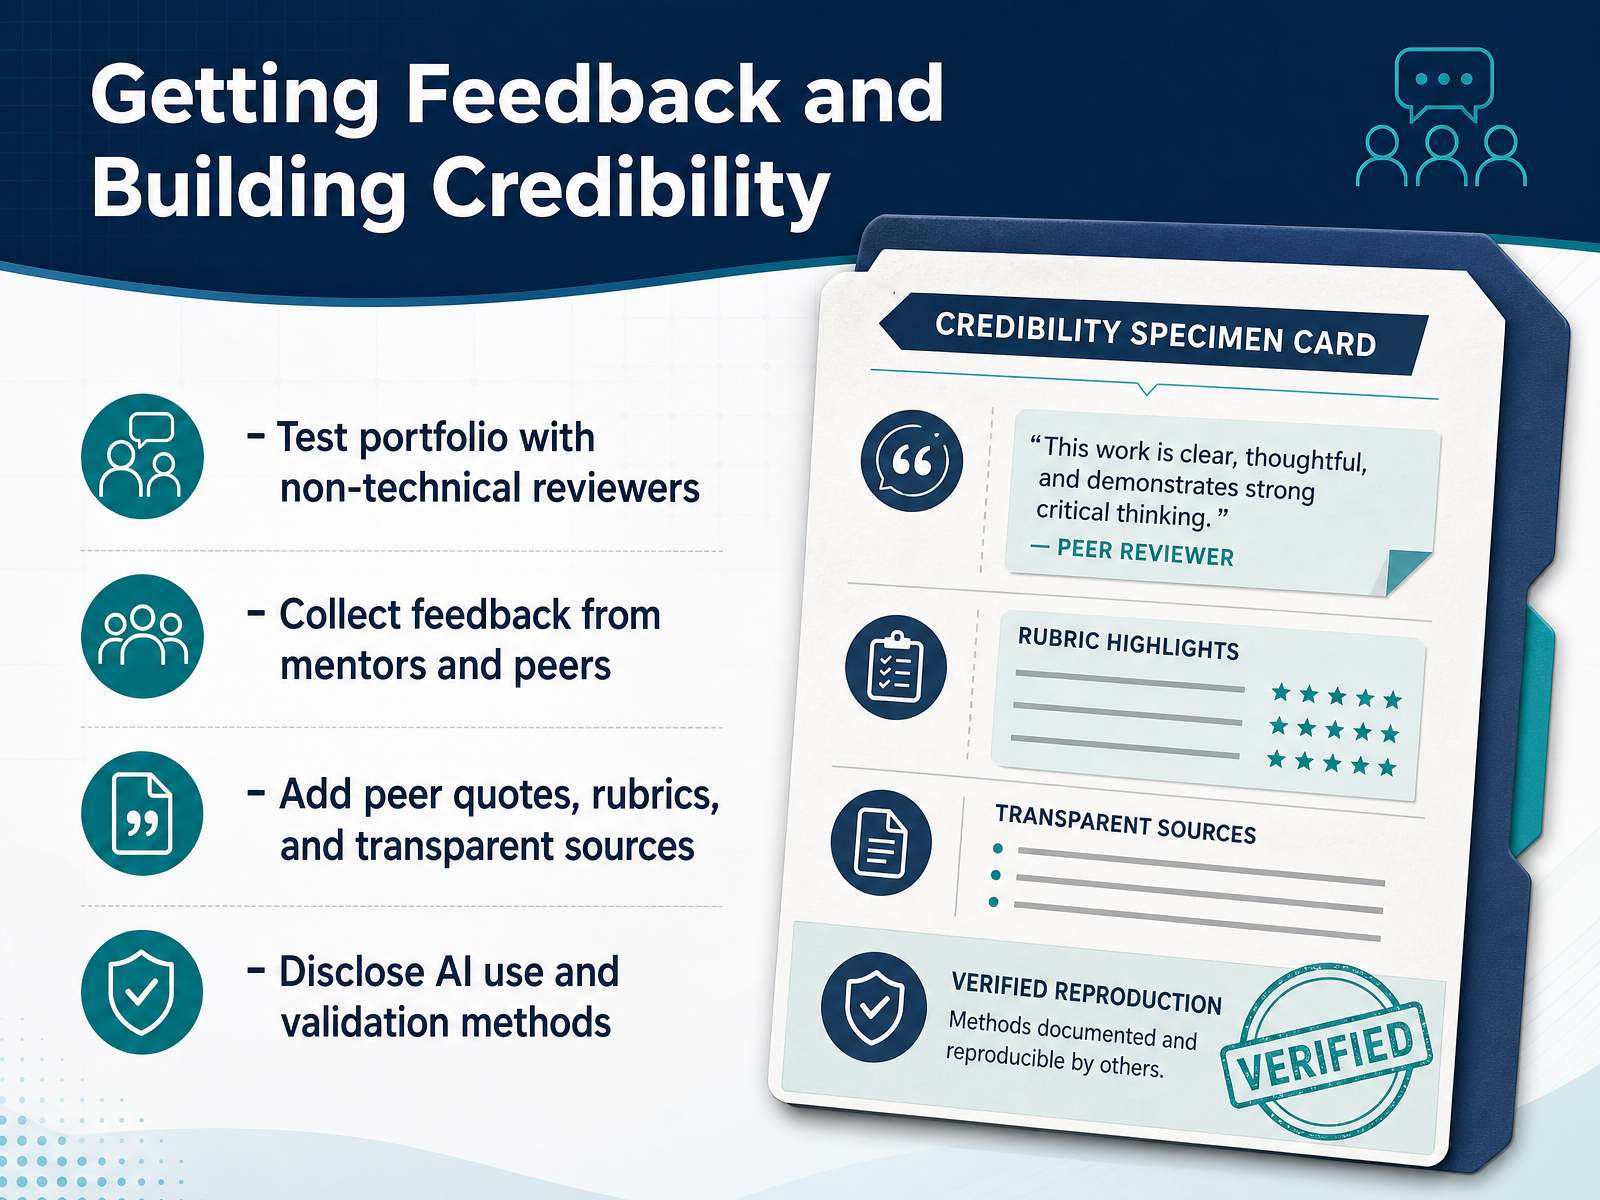
2 min - 13Getting Feedback and Building CredibilityNow that your portfolio has real substance, it’s time to pressure-test it. Don’t skip this step. Before you send out a single application, share your portfolio with people who are not data analysts. Ask them a simple question: can you tell me what problem I solved and why it matters? If they hesitate, your story isn’t clear enough yet. This is how you find out if your communication is as strong as your analysis. Next, get feedback from mentors or peers who work in the field. Ask them to check the technical depth. A great approach is to include a peer quote or a short rubric with each case study. When a hiring manager sees that someone else verified your work, it builds instant credibility. Also, be transparent about your process. List your data sources, your assumptions, and how you validated your models. This matters even more when you use AI tools. You should not hide that. Instead, write one clear line, like, I used AI to draft the initial SQL, then manually validated every query. That note shows good judgment and reinforces trust in your work. Treat your portfolio like a product someone is evaluating. Then it will hold up when a stranger clicks the link. Next, we will move into a practical action plan and the common mistakes you should avoid. These will make your work stronger before you hit submit.
 bavolta.comstaragile.comtraecta.com+22 min
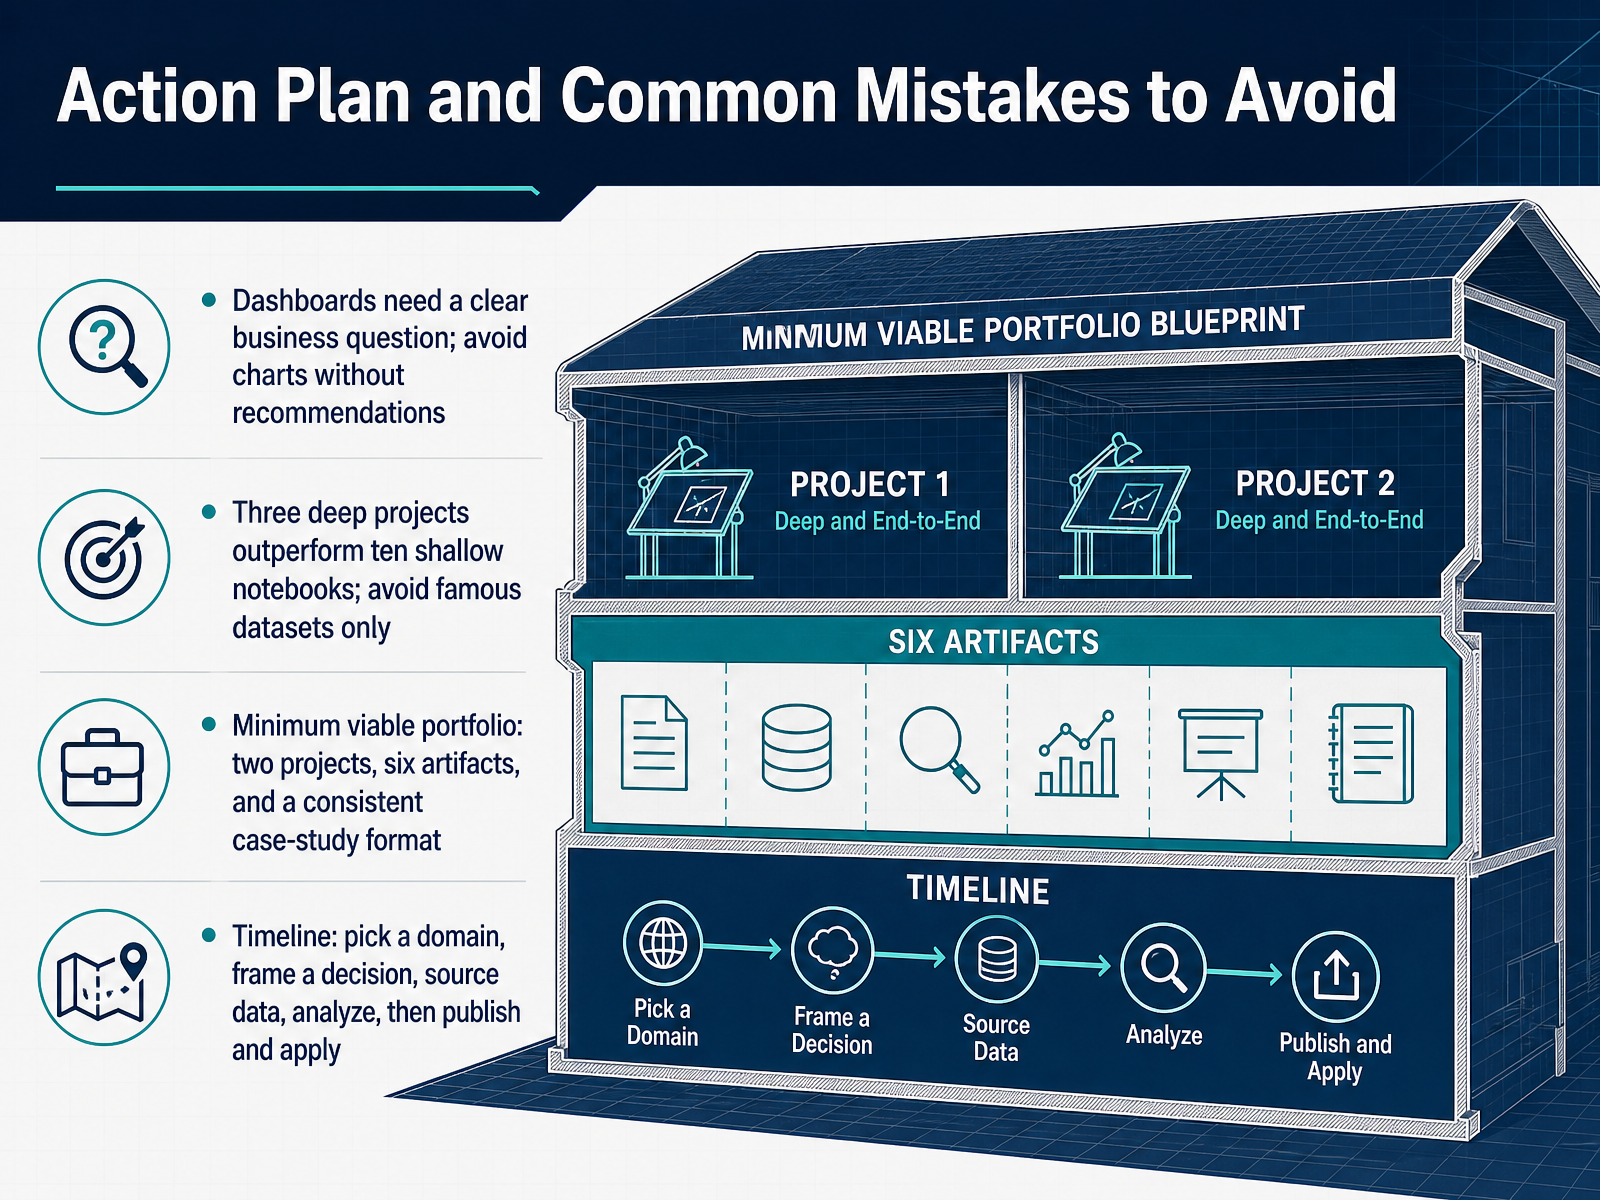
 - 14Action Plan and Common Mistakes to AvoidHere’s your action plan, and the mistakes to sidestep. First, every dashboard needs a clear business question. Charts without a recommendation are just decoration. Ask yourself, so what? What decision does this data support? Second, depth beats quantity. Three deep projects outperform ten shallow notebooks. Avoid famous datasets everyone uses. Pick a real problem, even if the data is public. Third, your minimum viable portfolio is two projects with six artifacts total, using one consistent case study format. That’s enough to show range and thinking. Fourth, follow this timeline. Pick a domain you care about. Frame a real business decision. Find and clean the data. Analyze it. Then publish your work and start applying. You have everything you need to start right now. Pick one project, commit to finishing it this week, and build from there. You’ve got this.
 bavolta.comstaragile.comtraecta.com+21 min
Take the deck with you
Download this course as a file — free, no sign-up needed.
- PDF handoutEvery slide page, ready to print or share.15 pages · 3.8 MBDownload
- Narrated PowerPointThe deck that presents itself — every slide carries the digital human's narration video.15 pages · 14.4 MBDownload
- PowerPoint slidesThe full deck as a .pptx — open it in PowerPoint, Keynote, or Google Slides.15 pages · 3.7 MBDownload
Free to use in your own training — please keep the PersonWise credit page at the end.
Have your own deck? Turn it into a course
Sources consulted
Web sources consulted while building this course.
- Do Business Analysts Need a Portfolio in 2026? | BAvolta — bavolta.com
- Build a Strong Data Analytics Portfolio with Projects — staragile.com
- Build a Job-Ready Portfolio for Business Analyst Roles — traecta.com
- Building an Analytics Portfolio and CV: An Analyst's Guide | INFORMS — careercenter.informs.org
- How to Build a Data Analyst Portfolio 2026 — bigblue.academy
- Beginner Data Analyst Portfolio Ideas: Interactive Dashboard Projects That Impress — Deden Sembada — dedensembada.com
- GitHub - dineshkumarg5/Retail-Sales-Analytics-Dashboard: Complete End-to-End Data Analytics Portfolio Project | Python, Pandas, SQL, Power BI | EDA, RFM Segmentation, Visualizations, Dashboard · GitHub — github.laiyagushi.com
- 8 Best First Analytics Projects for Career Changers — traecta.com
- JamieChristian22/business-analyst-portfolio — github.com
- 5 Data Analytics Projects for Beginners - Coursera — coursera.org
- Guiding Questions - INFORMS — informs.org
- How to Turn a Vague Business Question into an Analysis Plan — tivon.io
- What Problem Are We Actually Solving? - Analytics Made Simple — analyticsmadesimple.com
- Key questions to kick off your data analytics projects — sas.com
- 2.1 Identify the Research Questions — iiba.org
- How to Build a Business Analyst Portfolio in 2026 | Mokkup.ai — mokkup.ai
- Build your data portfolio. Everything you need to create high quality data projects and showcase them on your own beautiful portfolio website. — datascienceportfol.io
- How to Build a Data Analytics Portfolio for Free | Medium — medium.com
- Build Your Analyst Portfolio & Auto-Save Your Reports — authory.com
- Free Portfolio Website Builder for Data Analysts - Easy Portfolio Maker — professionalsite.me