Begin
15 pages · ~30 min
Conversion Rate Optimization Examples
Learn proven conversion rate optimization patterns, their strengths, and common pitfalls. Ideal for marketers and product teams seeking to improve website performance.
A digital instructor presents all 15 pages. Hold “Ask” at any point and ask out loud — the answer comes from this course. No sign-up needed.
What you’ll learn
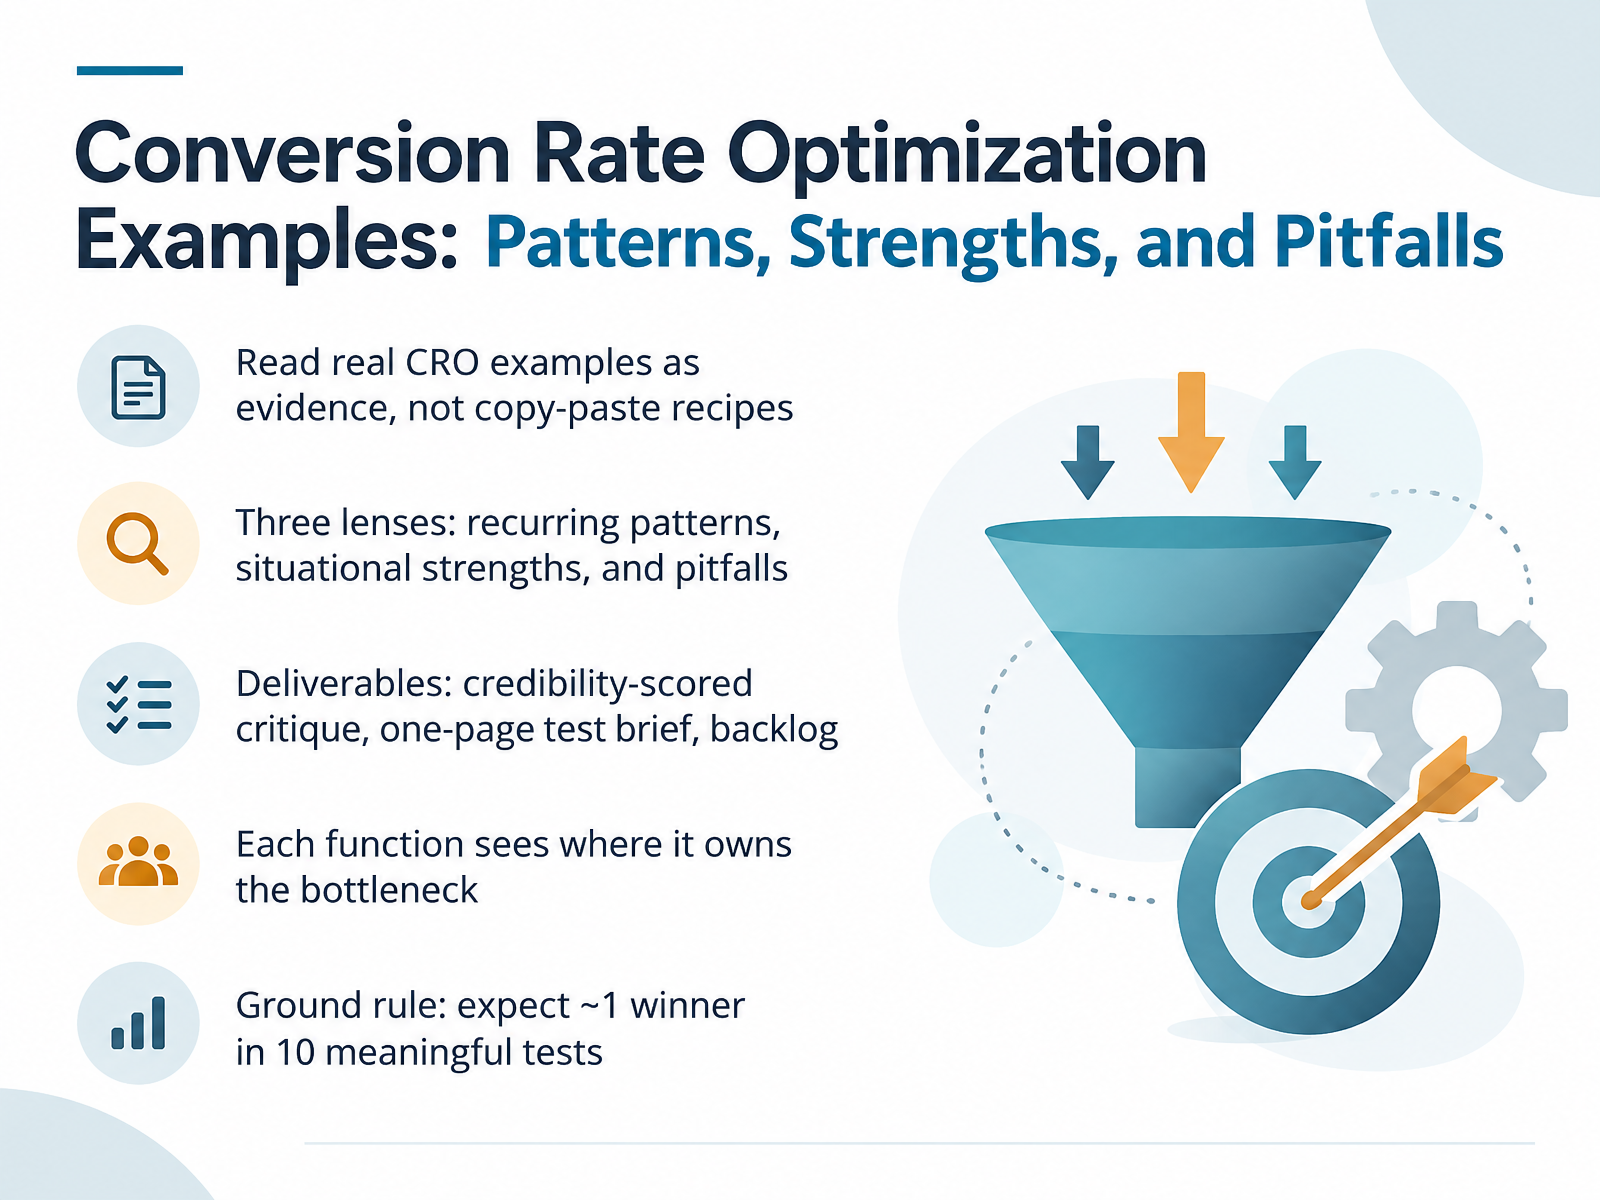
- 01Conversion Rate Optimization Examples: Patterns, Strengths, and PitfallsWelcome. This course is about reading Conversion Rate Optimization examples as evidence, not as copy-paste recipes. We will look through three lenses. First, recurring patterns that show up again and again. Second, situational strengths, because what works in one business context may fail in another. And third, pitfalls, so you can spot the traps before they cost you a test cycle.
By the end, you will produce three deliverables. A credibility-scored critique of real examples. A one-page test brief your team can actually run. And a prioritized backlog tied to bottlenecks, not opinions.
One important frame. Each function sees where it owns the bottleneck. Marketing owns traffic quality and message match. Product owns onboarding and activation. E-commerce operations owns pricing, inventory, and checkout friction. Analytics owns measurement integrity. UX owns clarity and effort. When you critique an example, name who owns the constraint, because that determines whether the lesson transfers.
A ground rule for the whole course. Expect roughly one winner in ten meaningful tests. That number keeps you honest. It means most ideas fail, so your process matters more than any single tactic. We will focus on learning velocity, not hit rate.
Next, we will set the core concepts and working vocabulary so we critique examples with the same language.2 min
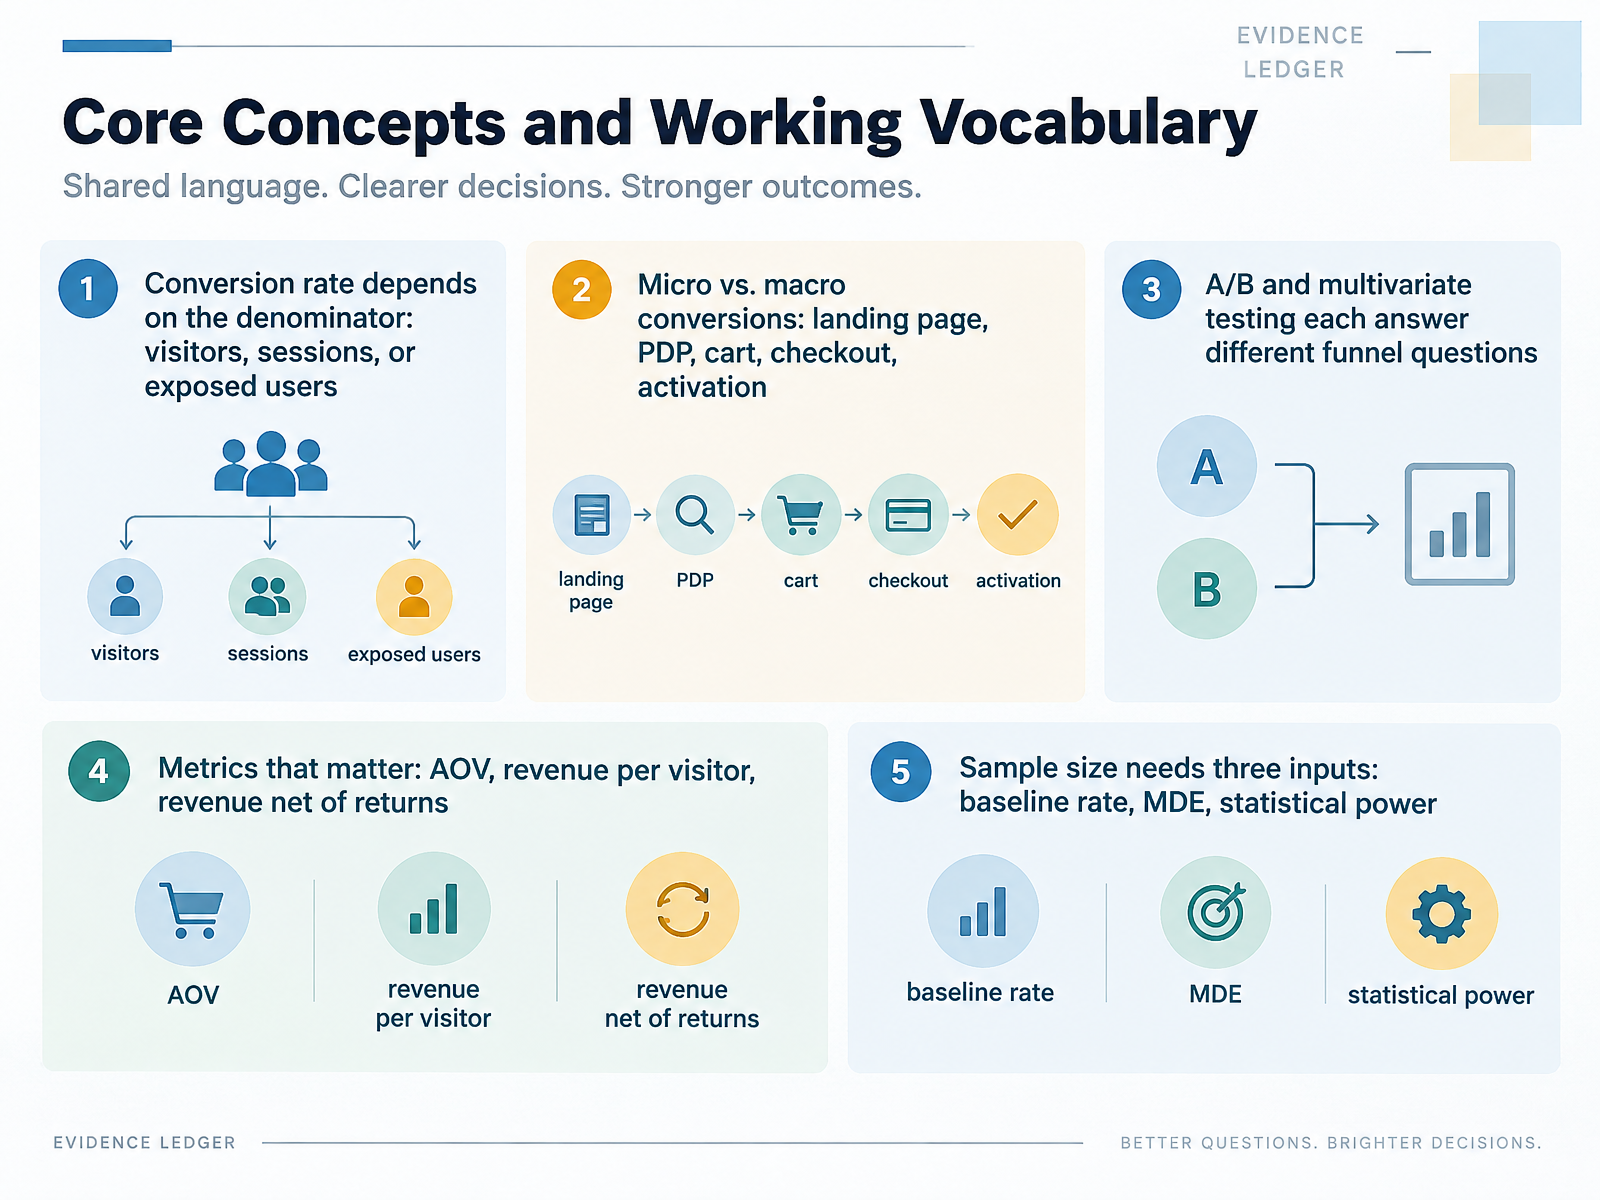
- 02Core Concepts and Working VocabularyLet's lock down the vocabulary, because most CRO disputes are really definition disputes. First, conversion rate depends on the denominator. Visitors, sessions, or exposed users give you three different numbers, so pick one and declare it. Second, separate micro from macro conversions: landing page, product detail page, cart, checkout, activation. A healthy micro rate with a broken macro rate tells you the funnel leaks late. Third, A/B and multivariate tests answer different questions. A/B isolates one change; multivariate tests interaction effects, but needs far more traffic. Fourth, track AOV, revenue per visitor, and revenue net of returns. Net revenue is the one your finance team trusts. Fifth, sample size needs three inputs: baseline rate, minimum detectable effect, and statistical power, usually eighty percent. Set them before launch. Next, how to read a CRO case study without getting fooled.
 pageduel.comthesnowmedia.comecomhint.com+22 min
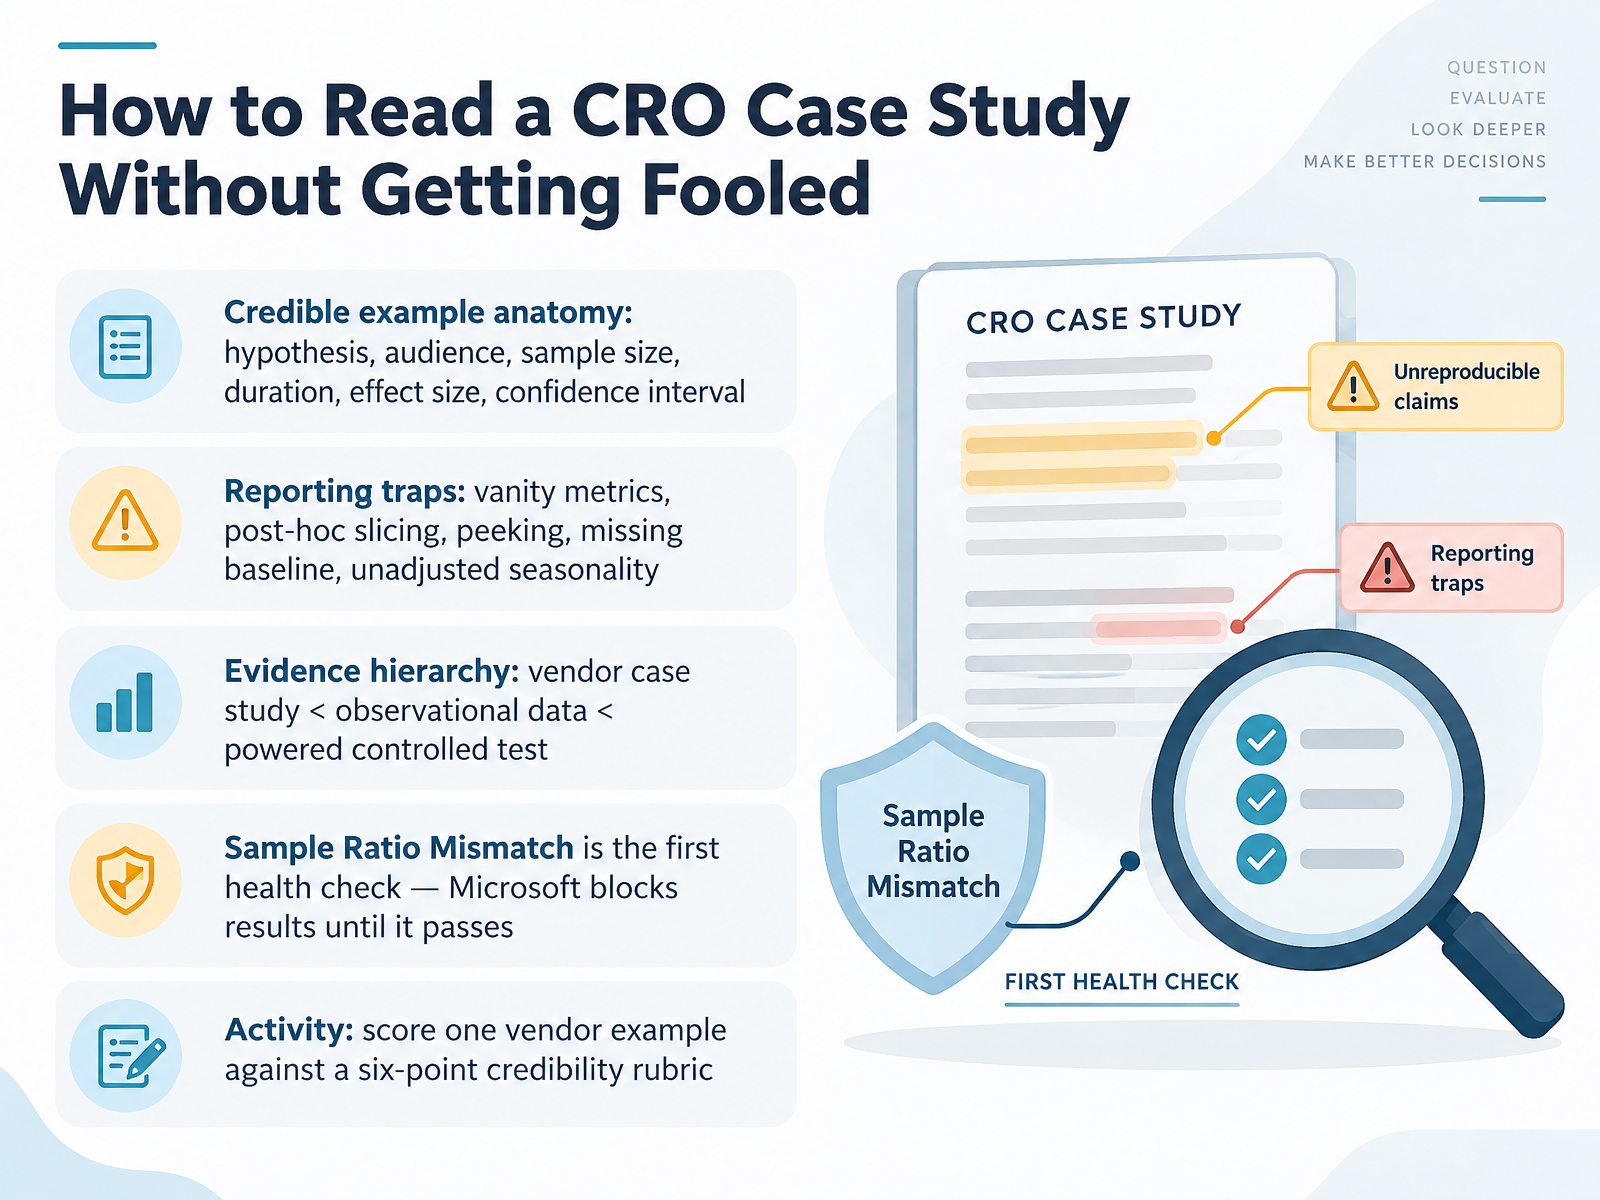
- 03How to Read a CRO Case Study Without Getting FooledLet's talk about how to read a conversion rate optimization case study without getting fooled. A credible example has six parts: a clear hypothesis, the audience it targeted, sample size, duration, effect size, and a confidence interval. If any of those are missing, treat the result as a story, not evidence. Then watch for reporting traps. Vanity metrics, post hoc slicing, peeking at results early, a missing baseline, and unadjusted seasonality will all quietly distort a finding. Keep an evidence hierarchy in mind. A vendor case study sits at the bottom, observational data sits in the middle, and a properly powered controlled test sits at the top. Before you trust any test, check for Sample Ratio Mismatch, or S R M. That is the first health check. At Microsoft, results are blocked until it passes. So here's your activity. Take one vendor example and score it against a six point credibility rubric. Find the weakest link. Coming up next, we look at the pattern library of recurring CRO levers across examples.
 dl.acm.orgarxiv.orgatticusli.com+22 min
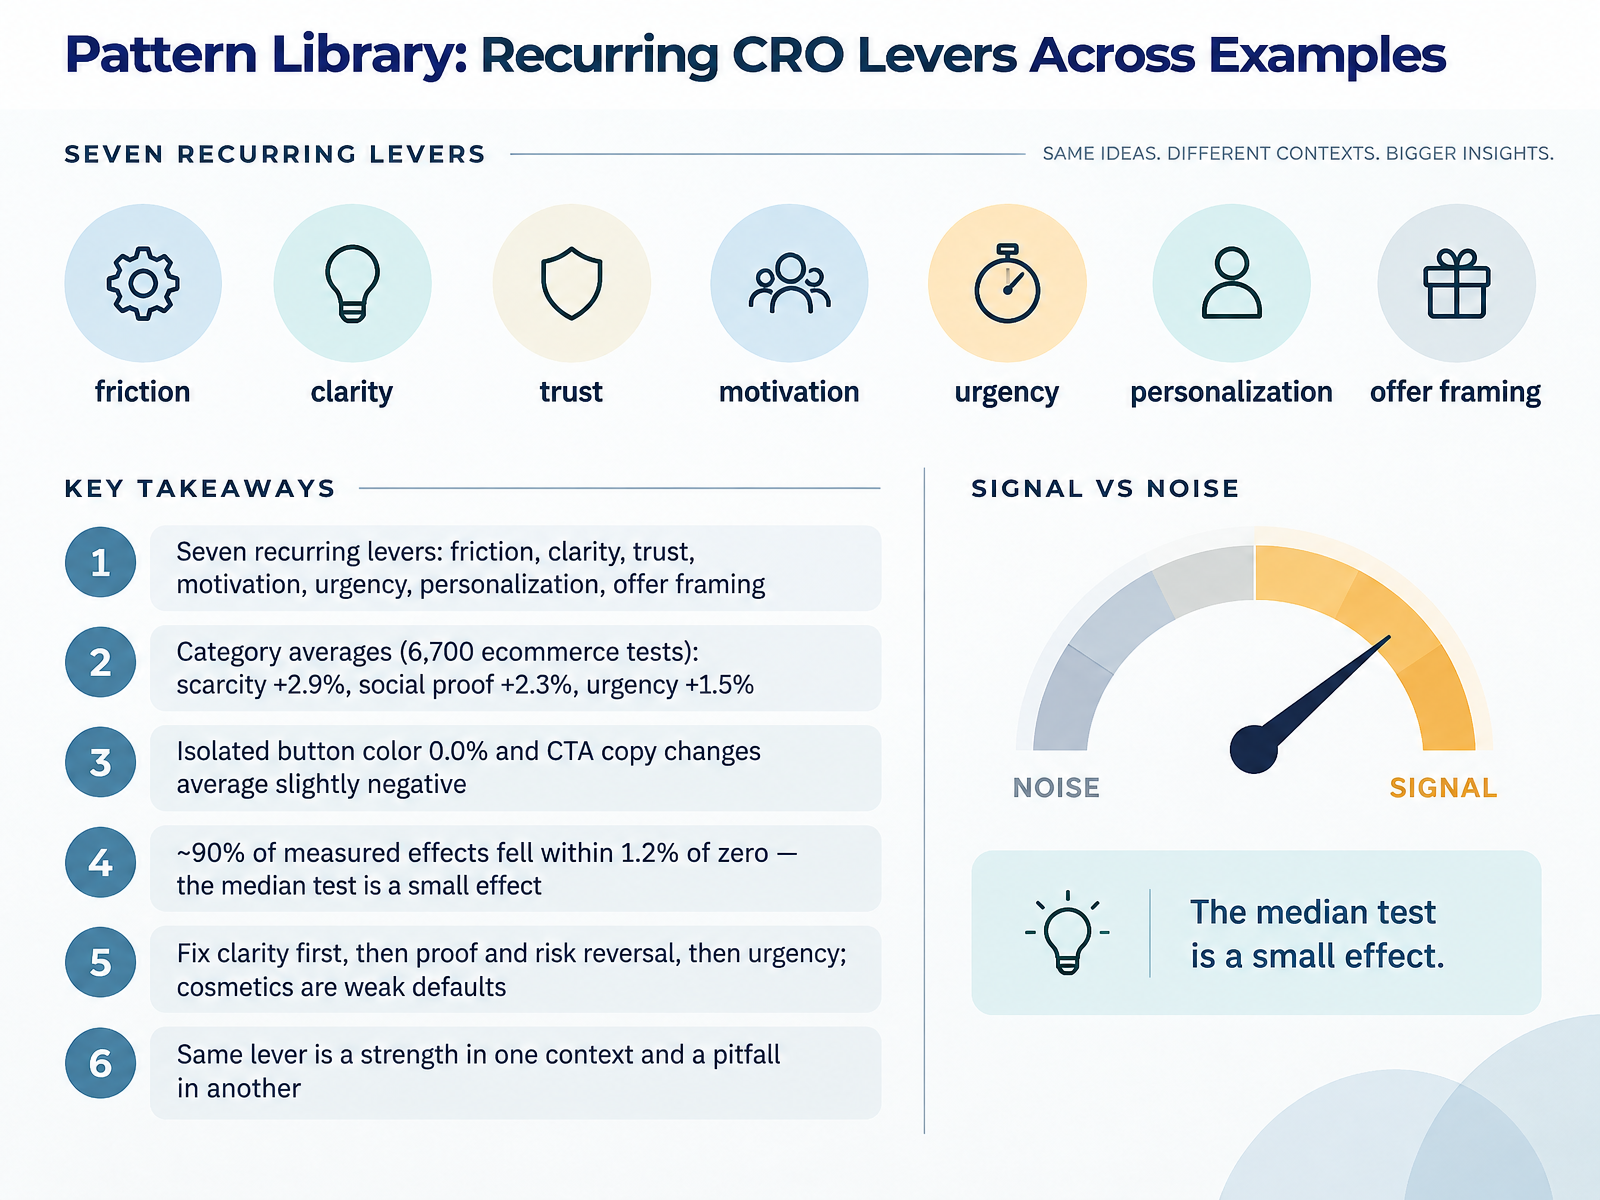
- 04Pattern Library: Recurring CRO Levers Across ExamplesNext, let's build a pattern library of the recurring CRO levers you'll see across examples. There are seven: friction, clarity, trust, motivation, urgency, personalization, and offer framing. Different labels, but they all act on the same thing. A buyer's uncertainty. Now, the numbers. Across six thousand seven hundred ecommerce tests, scarcity averaged plus two point nine percent, social proof plus two point three, and urgency plus one point five. Isolated button color changes averaged zero percent. CTA copy changes averaged slightly negative. And roughly ninety percent of measured effects fell within one point two percent of zero. Read that again. The median test is a small effect, not a dramatic uplift. So how do you sequence this? Fix clarity first. Then proof and risk reversal. Then urgency. Cosmetics are weak defaults. And here's the tradeoff that matters. The same lever is a strength in one context and a pitfall in another. Social proof near the price reduces doubt. The same logo wall on a homepage can just add noise. So diagnose the bottleneck before you copy a tactic. That leads us to ecommerce product pages, and why placement beats quantity.
 landingboost.appgrowthfather.comdonnuab.com+22 min
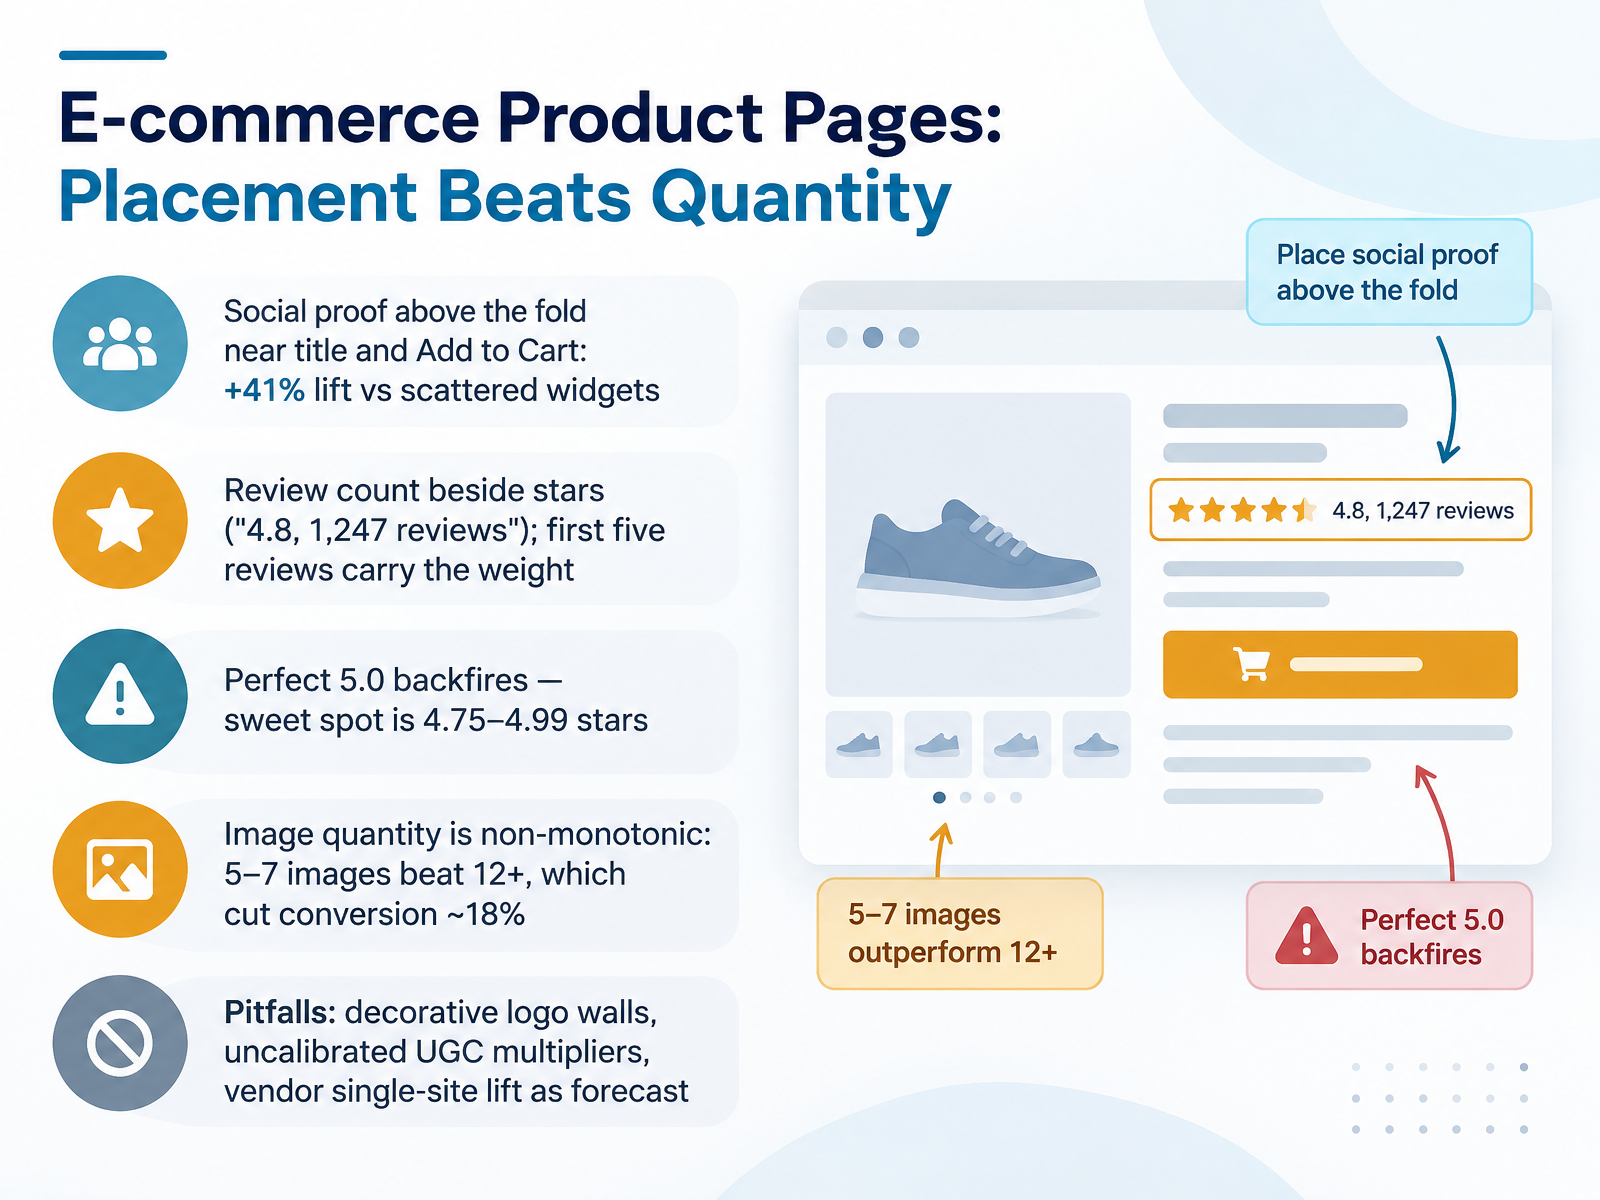
- 05E-commerce Product Pages: Placement Beats QuantityLet's look at product pages, where placement matters more than quantity. Take social proof. Placing the star rating and review count above the fold, near the title and the add to cart button, produced a forty-one percent lift compared to scattering review widgets across the header, footer, and sidebar. Scattered widgets become visual noise. Customers tune them out.
Show the count next to the stars, not the stars alone. "Four point eight, one thousand two hundred forty-seven reviews" signals both quality and volume in one glance. And the first five reviews carry most of the weight. Moving a product from zero to five reviews matters far more than pushing it from two hundred to four hundred.
Here is the counterintuitive part. A perfect five point zero rating backfires. The conversion sweet spot sits between four point seven five and four point nine nine stars, because a flawless score reads as filtered or fake.
Image quantity is non-monotonic. Five to seven images beat twelve or more, which cut conversion by roughly eighteen percent. More photos added fog, not clarity.
Watch three pitfalls: decorative logo walls that convince nobody, uncalibrated user-generated content multipliers treated as forecasts, and vendor single-site lift numbers quoted as if they will reproduce on your store.
Next, we move to checkout, where friction, fees, and payment diversity decide the sale.
 landingboost.appgrowthfather.comdonnuab.com+22 min
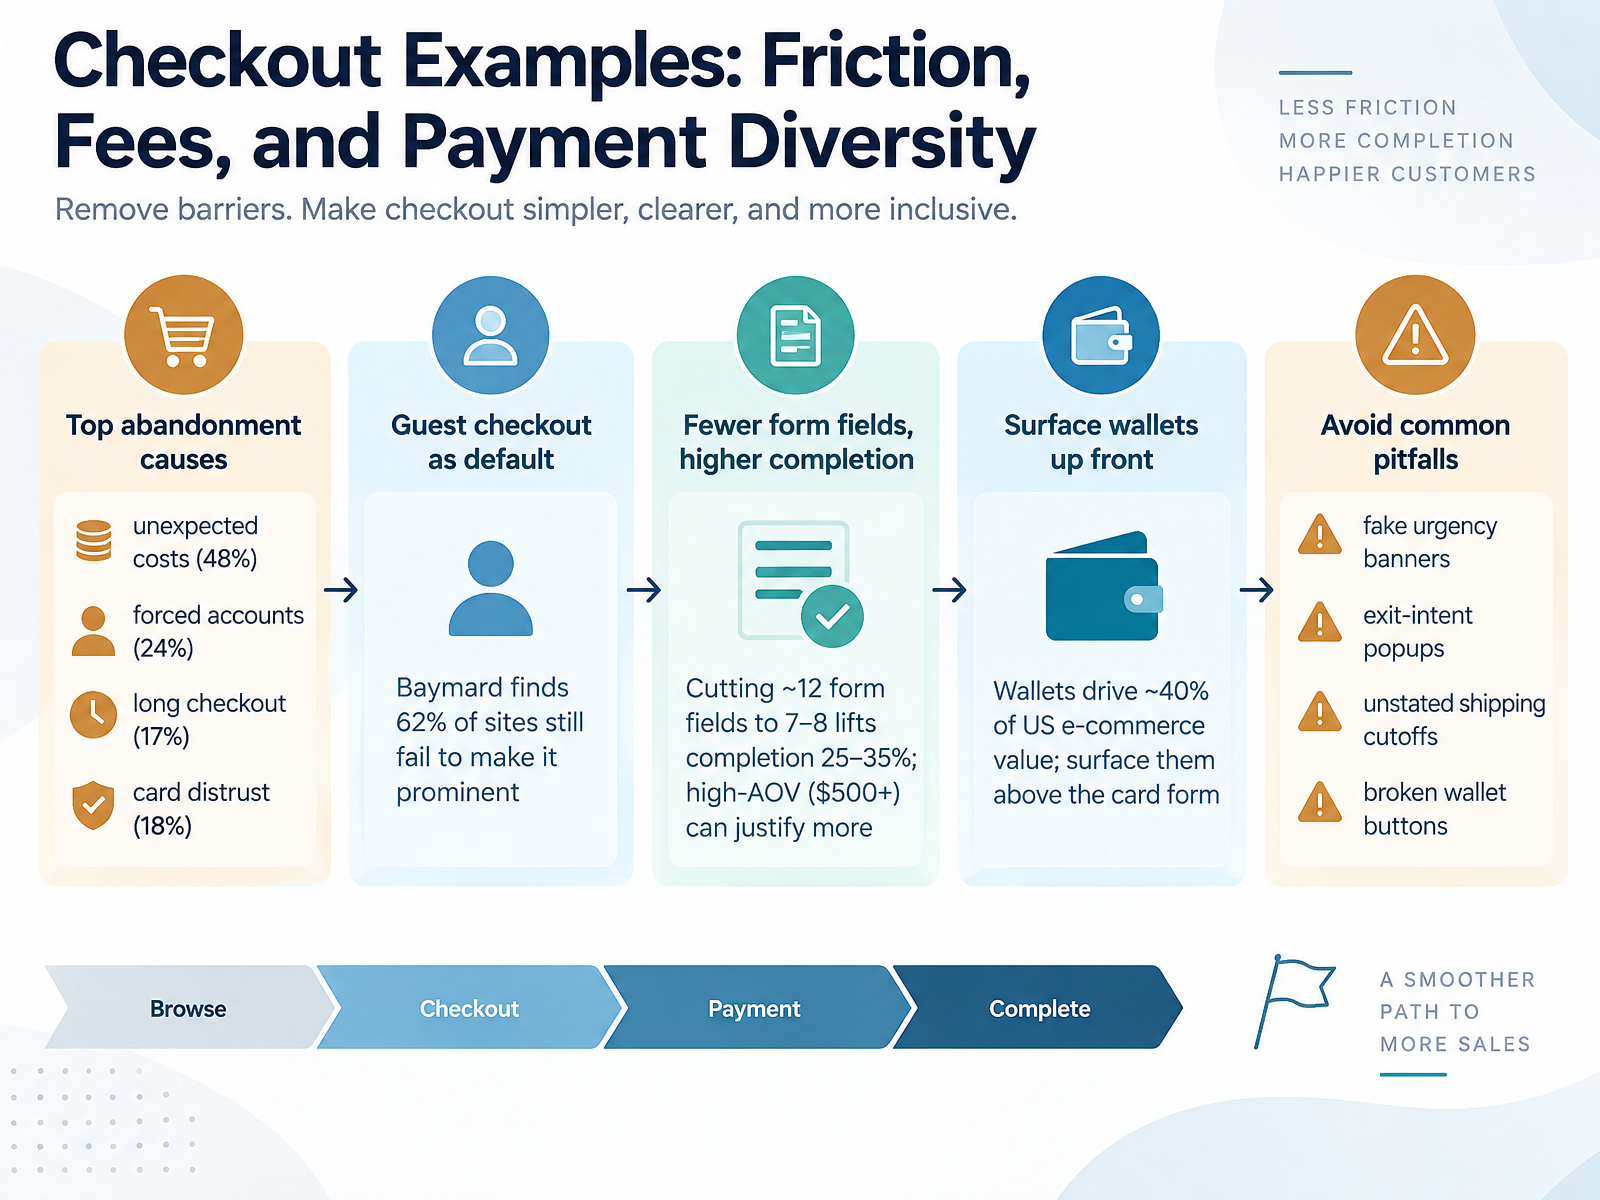
- 06Checkout Examples: Friction, Fees, and Payment DiversityLet's move to checkout, where most revenue quietly leaks away. The top abandonment driver is unexpected cost at forty eight percent, followed by forced account creation at twenty four, a checkout that's simply too long at seventeen, and card distrust at eighteen. So surprise fees beat every UX detail. Baymard finds sixty two percent of sites still hide the guest option, which is a free fix: make guest checkout the default and offer account creation after payment. Then shorten the form. Trimming roughly twelve fields down to seven or eight lifts completion twenty five to thirty five percent, though high average order values above five hundred dollars can justify a few extra fields. Payment diversity matters too. Digital wallets drive about forty percent of US ecommerce value, so surface Apple Pay, Google Pay, and Shop Pay above the card form, not buried below it. And avoid the pitfalls: fake urgency banners, exit-intent popups, unstated shipping cutoffs, and broken wallet buttons that erode trust. Next, we shift from transactions to pipelines in SaaS and Lead Generation: From Free Trial to Qualified Lead.
 shopify.comecomdesignpro.comecomdesignpro.com+22 min
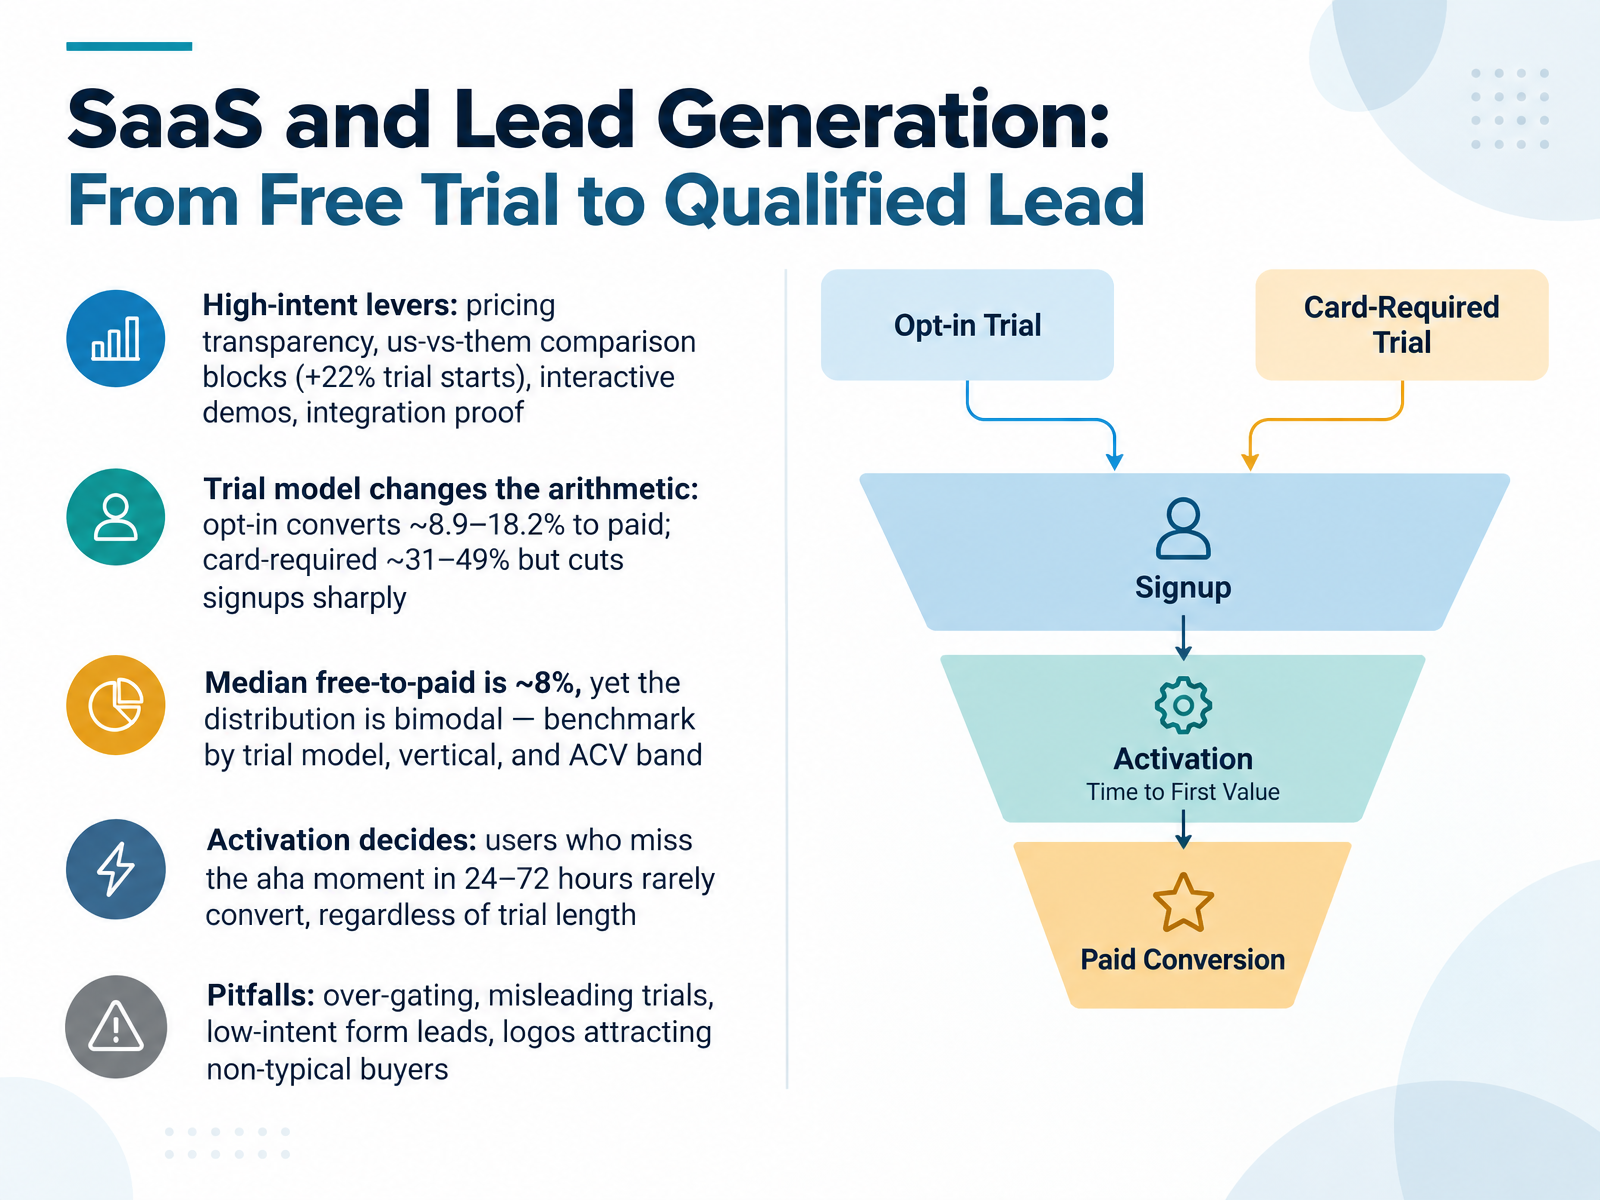
- 07SaaS and Lead Generation: From Free Trial to Qualified LeadLet's move to SaaS and lead generation, where the free trial is your real conversion engine. The high intent levers here are pricing transparency and us versus them comparison blocks. Surfacing that comparison lifted trial starts by about twenty two percent on average, because buyers are running the comparison anyway, and being the one who frames it earns trust. Interactive demos and integration proof do the same job. They reduce uncertainty before a sales call ever happens. Now the trial model changes the arithmetic, and this is where teams go wrong. Opt in trials convert roughly nine to eighteen percent of signups to paid. Card required trials convert thirty one to forty nine percent, but they cut signups sharply. So credit card trials produced about eleven paying customers per thousand visitors, versus four for opt in. Fewer, better leads. The median free to paid rate is about eight percent, yet the distribution is bimodal. The top twenty percent convert ten times better than the bottom, so benchmark by trial model, vertical, and contract value band, not against one industry number. But the real decider is activation. If a user misses the aha moment in the first twenty four to seventy two hours, they rarely convert, no matter how long the trial runs. Finally, watch the pitfalls. Over gating, misleading trials, low intent form leads, and logos that attract buyers who were never your typical customer. The takeaway, pick your trial model deliberately, then obsess over time to first value. Mobile, page speed, and accessibility, quiet but high impact.
 landingboost.appgrowthfather.comdonnuab.com+22 min
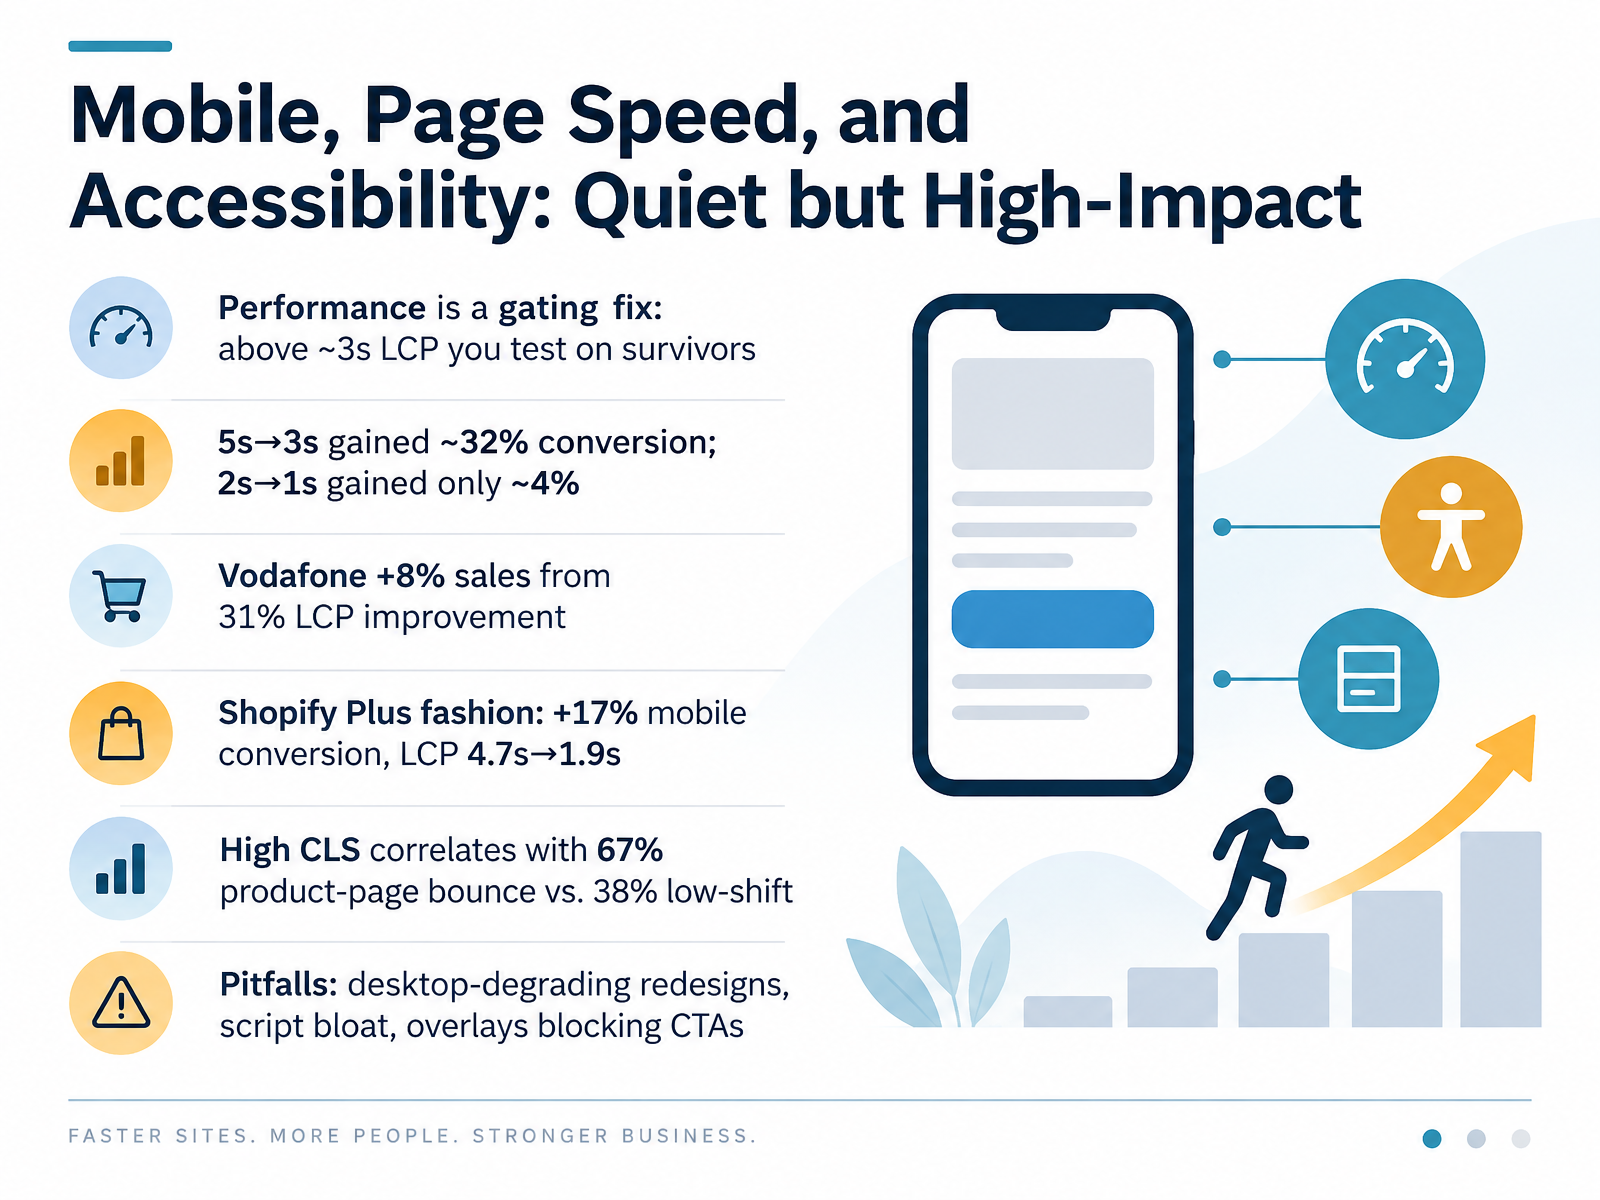
- 08Mobile, Page Speed, and Accessibility: Quiet but High-ImpactNext, let's look at performance, mobile, and accessibility, the quiet but high impact layer. Treat page speed as a gating fix. Above roughly three seconds on Largest Contentful Paint, you are no longer optimizing for your full audience, you are testing on survivors, the people patient enough to stay. Returns are also non linear. Moving from five seconds to three has produced gains around thirty two percent, while going from two seconds to one adds only about four percent. In other words, fix the broken experiences first. The case evidence is consistent. Vodafone improved LCP by thirty one percent and saw sales rise eight percent. A Shopify Plus fashion brand cut mobile LCP from four point seven seconds to one point nine and lifted mobile conversion by seventeen percent. On layout shift, product pages with high Cumulative Layout Shift saw a sixty seven percent bounce rate versus thirty eight percent when shift was low. The pitfalls are familiar. Redesigns that quietly degrade desktop, script bloat from apps and tags, and overlays that cover your primary call to action. Each one adds friction where intent is highest. That sets up our next topic, Personalization and AI-Assisted CRO: Promise and Guardrails.
 shopify.comecomdesignpro.comecomdesignpro.com+22 min
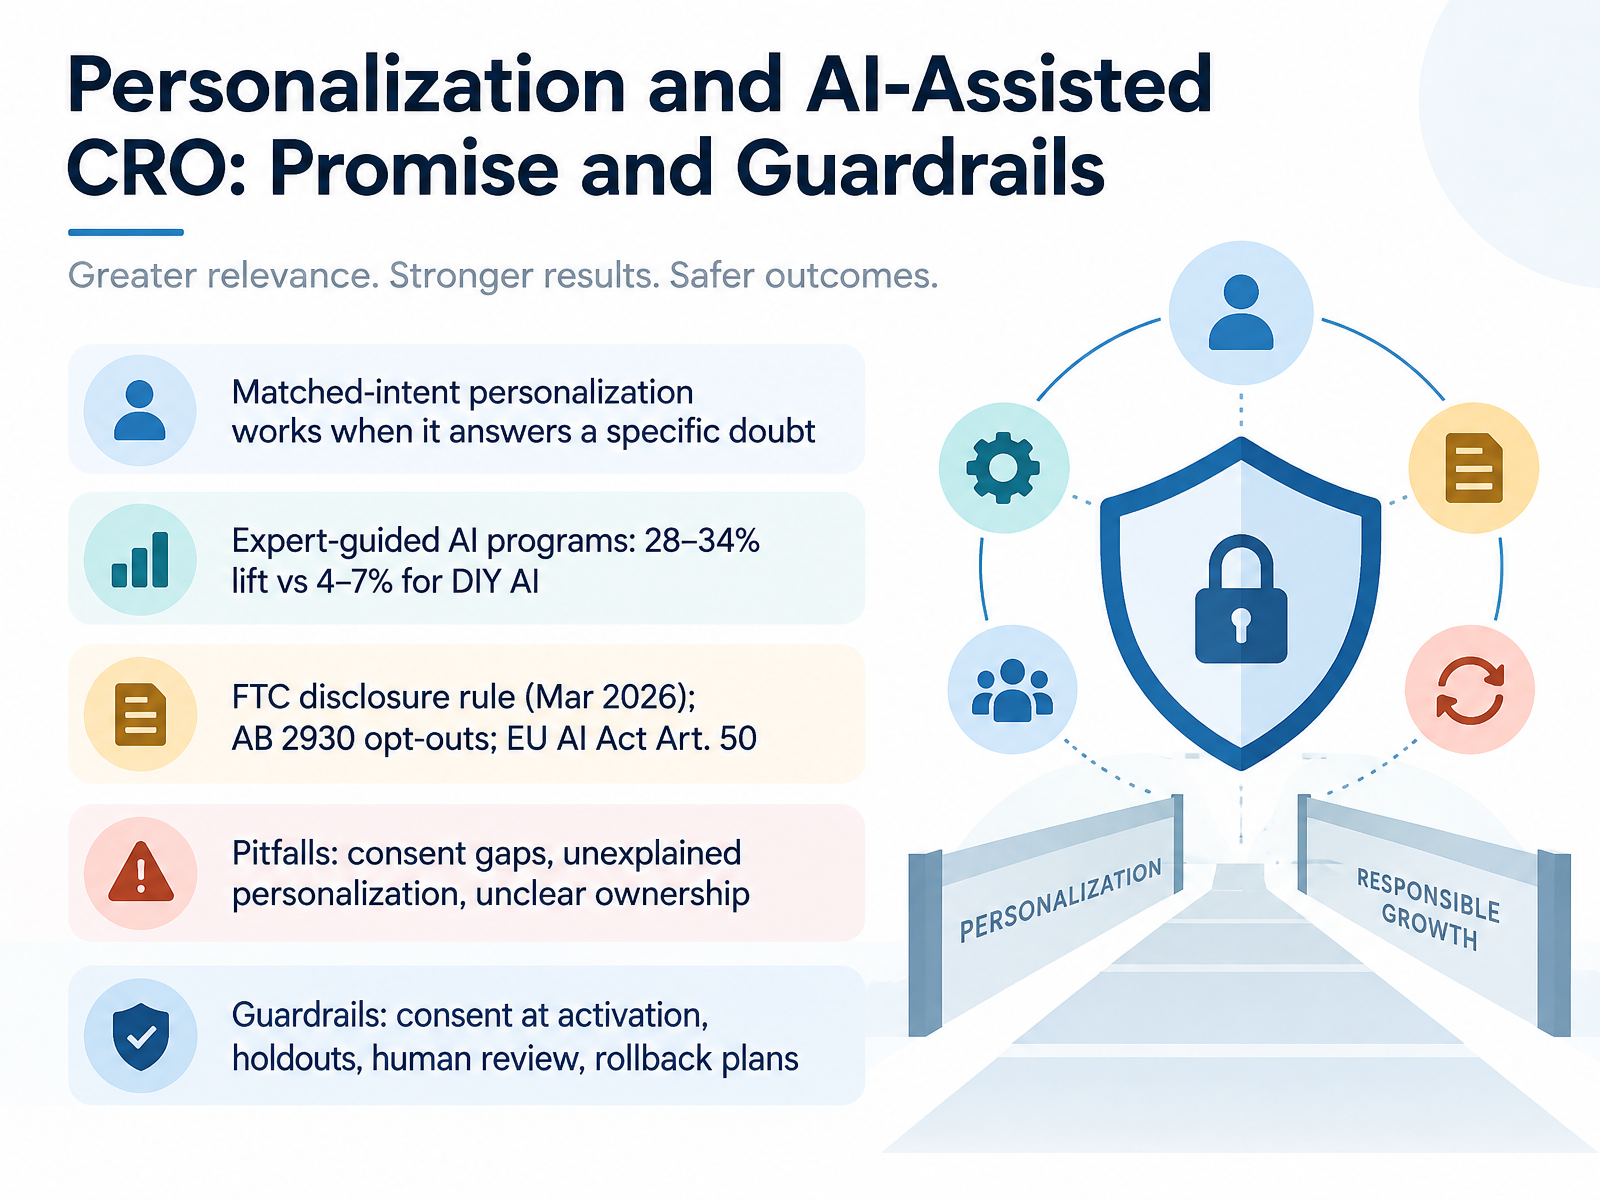
- 09Personalization and AI-Assisted CRO: Promise and GuardrailsLet's look at personalization and AI-assisted C R O, where the promise and the guardrails now arrive together. Matched-intent personalization works when it answers a specific doubt. A visitor asking whether a jacket runs small should see sizing guidance, not a generic discount. According to 2026 industry data, expert-guided AI programs lift conversion by twenty-eight to thirty-four percent, while do-it-yourself AI programs deliver only four to seven percent. The difference is governance, not model quality. And the rules have teeth now: the F T C disclosure rule took effect in March 2026, California's A B twenty-nine thirty requires opt-outs for automated decisions, and the E U AI Act Article Fifty demands transparency. So where do programs break? Consent gaps, personalization nobody can explain, and unclear ownership. The fix is a short list of guardrails: evaluate consent at activation, not at collection; keep holdout groups to prove lift; route high-stakes decisions to human review; and keep rollback plans ready. Get those right, and personalization compounds with trust instead of spending it. Next, let's examine scarcity and urgency, when the number moves and what it costs.
 2 min
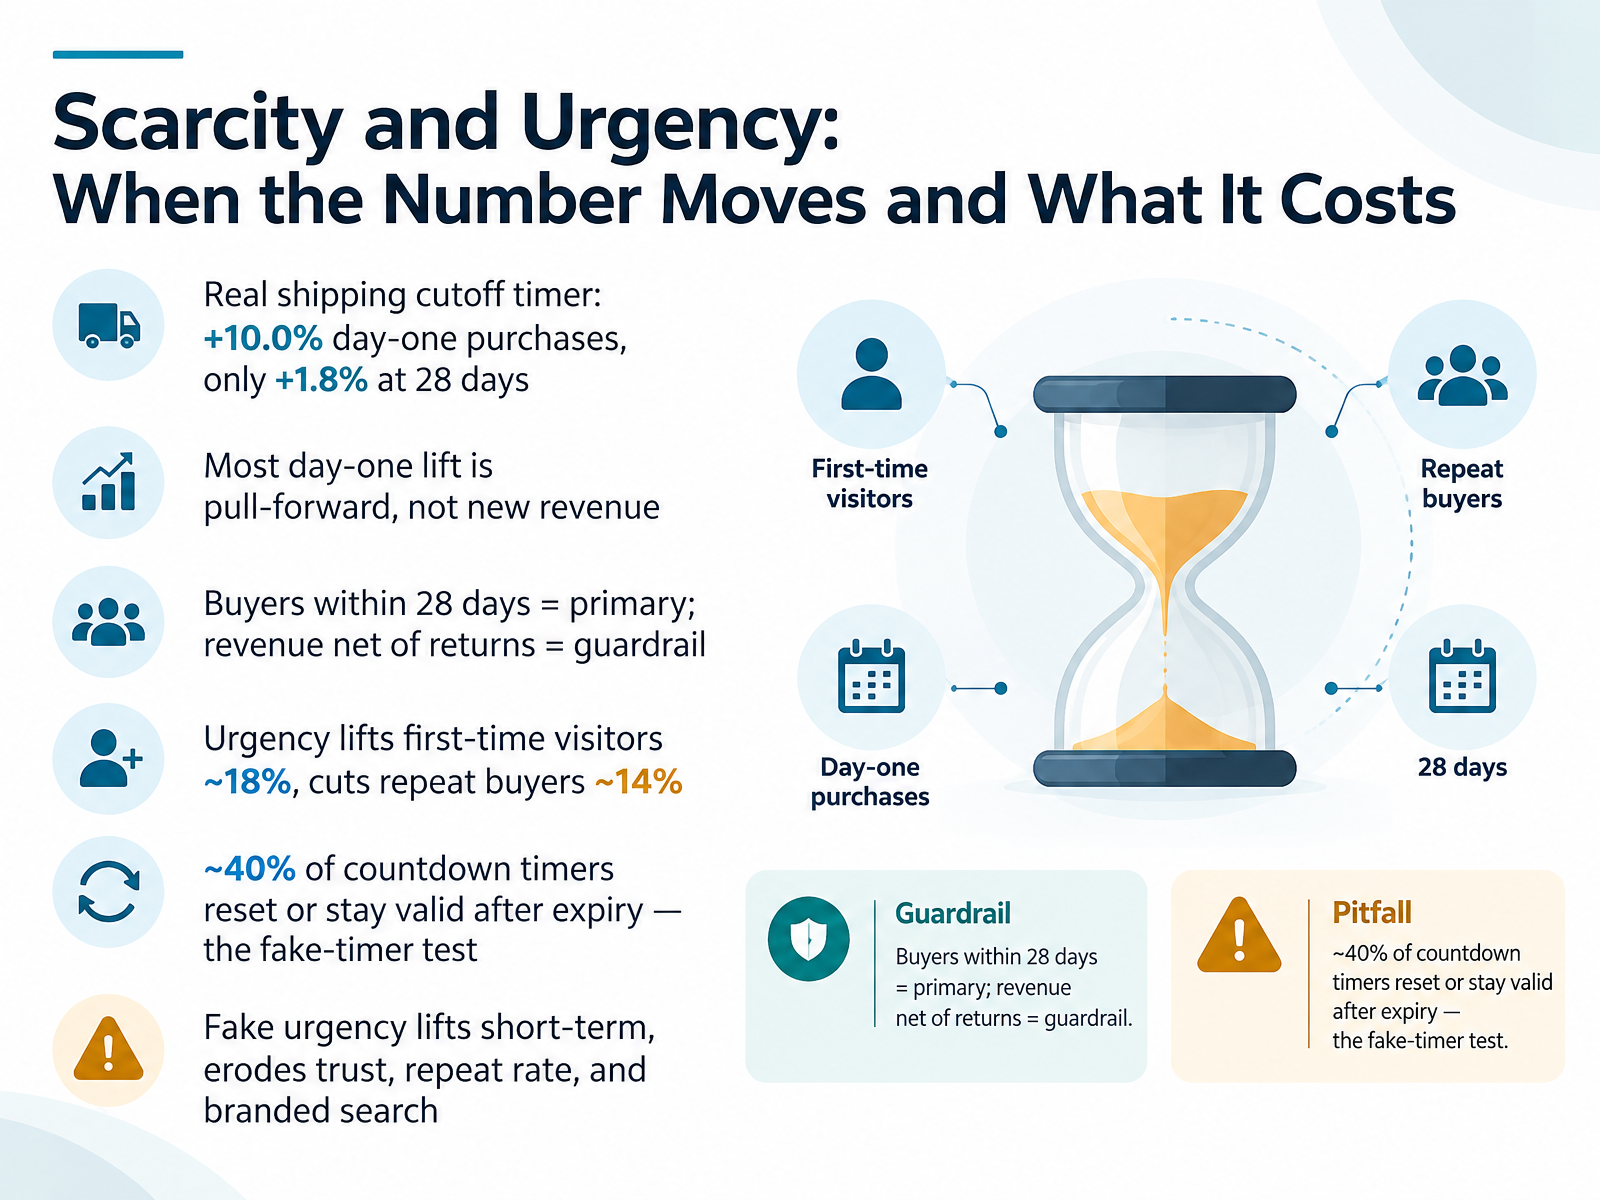
- 10Scarcity and Urgency: When the Number Moves and What It CostsNow let's look at scarcity and urgency, and the gap between the number that moves and the value that lasts. A real shipping cutoff timer lifted day-one purchases by ten percent, but at twenty-eight days, only one point eight percent. Most of that spike was pull-forward, buyers who would have purchased anyway, just sooner. So the primary metric is buyers within twenty-eight days, and revenue net of returns is the guardrail. Urgency also splits by audience: first-time visitors lift around eighteen percent, while repeat buyers drop about fourteen percent. And roughly forty percent of countdown timers reset or stay valid after expiry, the fake-timer test. Fake urgency lifts short-term, then erodes trust, repeat rate, and branded search. Keep urgency real and operational. Next, we move into experiment design: hypothesis, primary metric, and guardrails.
 landingboost.appgrowthfather.comdonnuab.com+21 min
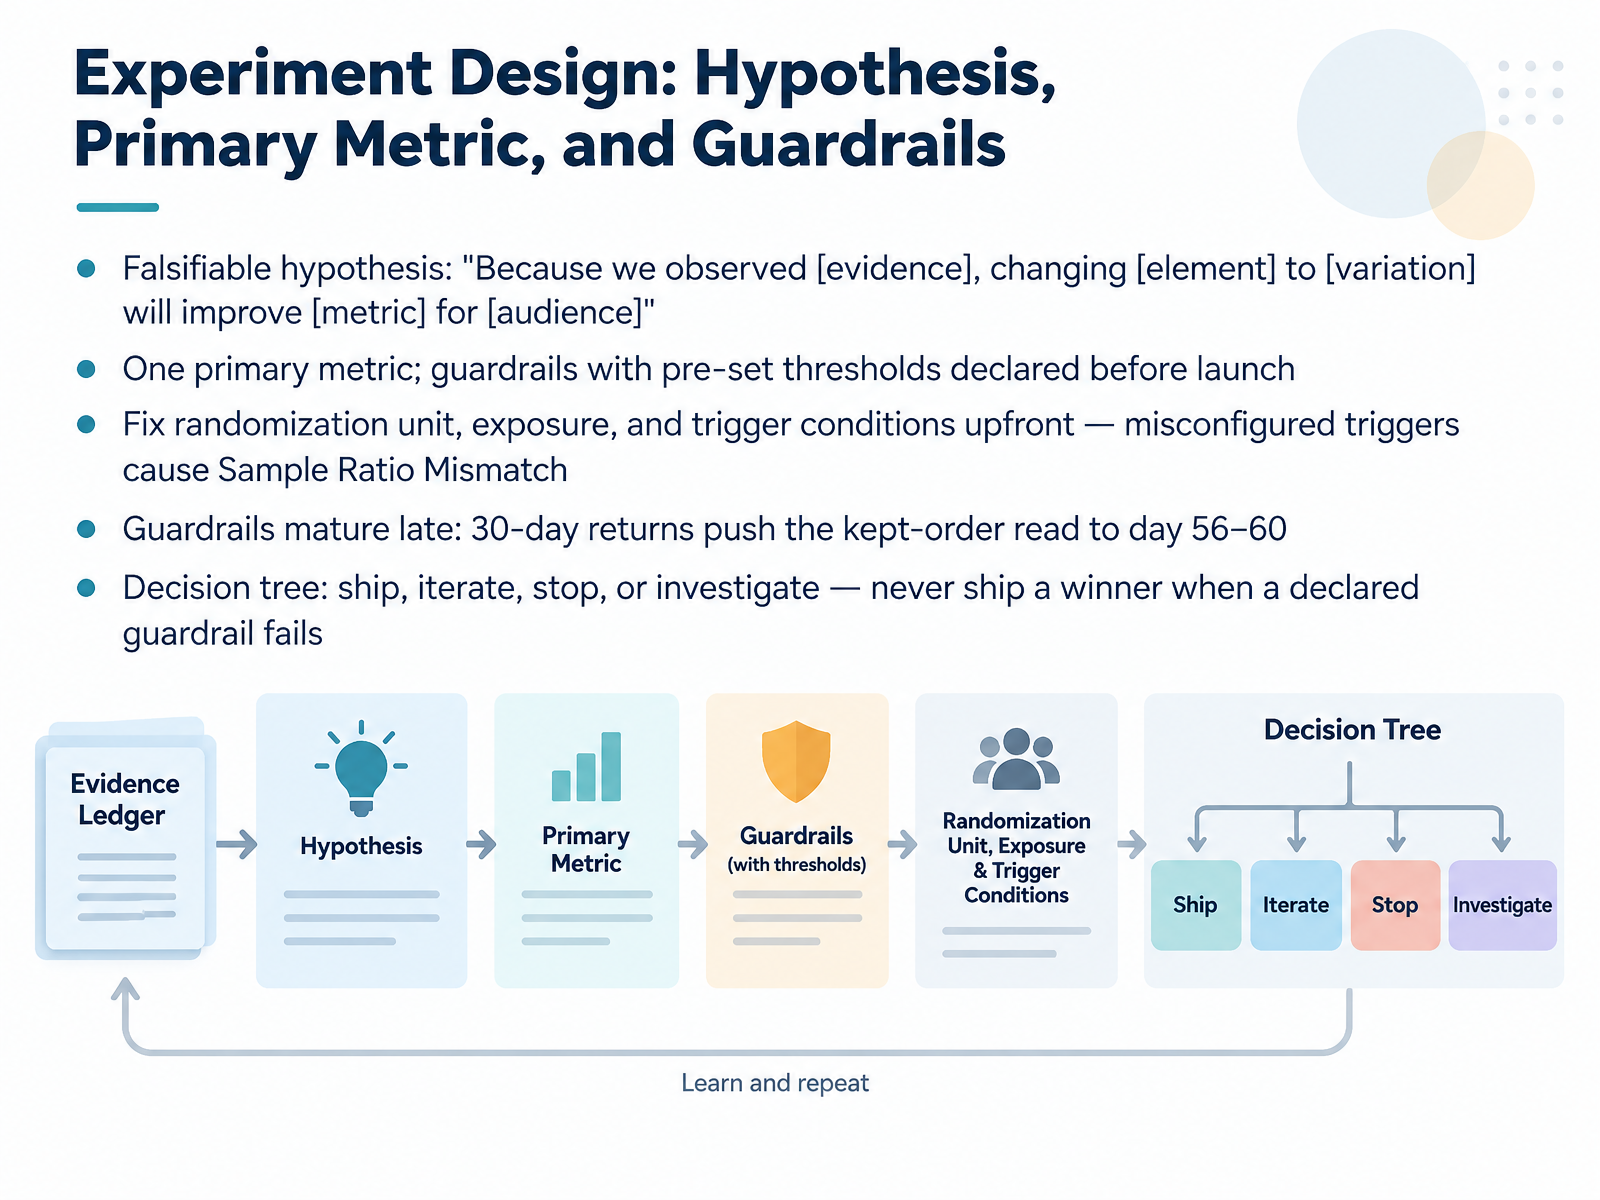
- 11Experiment Design: Hypothesis, Primary Metric, and GuardrailsLet's move into experiment design, where trust is won or lost before launch. Start with a falsifiable hypothesis in plain language: because we observed this evidence, changing this element to this variation will improve this metric for this audience. Then commit to exactly one primary metric, and declare guardrail thresholds before the test goes live. Next, fix the randomization unit, exposure, and trigger conditions upfront. Misconfigured triggers are a leading cause of sample ratio mismatch, where observed traffic splits drift from the expected split, quietly invalidating results. Guardrails also mature late. With a thirty-day return window, the kept-order read may only land around day fifty-six to sixty. Finally, work from a decision tree: ship, iterate, stop, or investigate. A variant can look like a winner, but if a declared guardrail fails, you do not ship it. Now let's look at sample size, duration, and the peeking problem.
 dl.acm.orgarxiv.orgatticusli.com+22 min
- 12Sample Size, Duration, and the Peeking ProblemLet's talk about how long a test should actually run, and why peeking quietly breaks it.
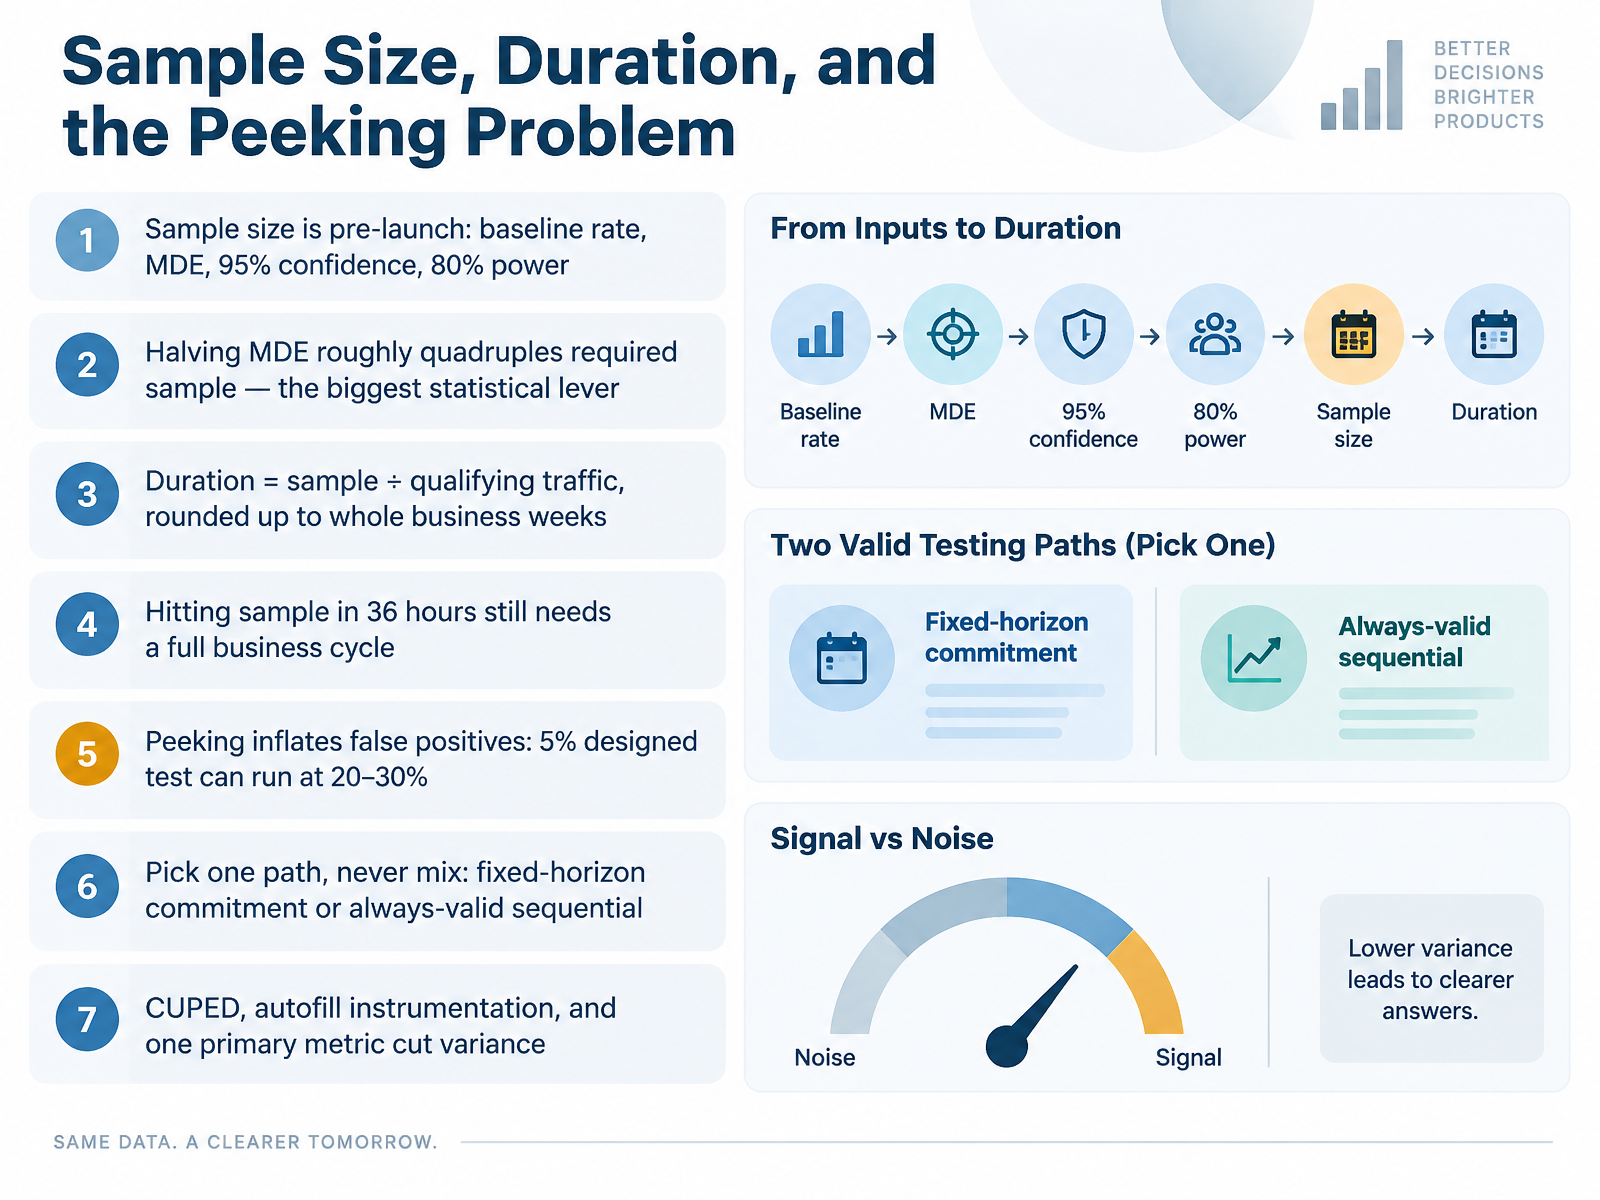
Sample size is set before launch, from four inputs: your baseline rate, the minimum detectable effect, ninety-five percent confidence, and eighty percent power. The biggest lever is MDE. Halve it and required sample roughly quadruples, so an ambitious test gets expensive fast.
Then convert sample into time. Take the required sample, divide by qualifying traffic, and round up to whole business weeks. Hitting your sample in thirty-six hours still means waiting out a full cycle, because Tuesday buyers aren't Sunday browsers.
Now the peeking problem. A fixed-horizon test guarantees five percent false positives only if you look once. Check daily and stop at the first significant read, and that same test can run at twenty to thirty percent.
So pick one path and never mix them: a fixed-horizon commitment, or an always-valid sequential method that's designed for continuous monitoring.
To cut variance and shrink sample, use CUPED, automate your instrumentation, and declare one primary metric.
From Patterns to a Prioritized Test Roadmap.
 dl.acm.orgarxiv.orgatticusli.com+22 min
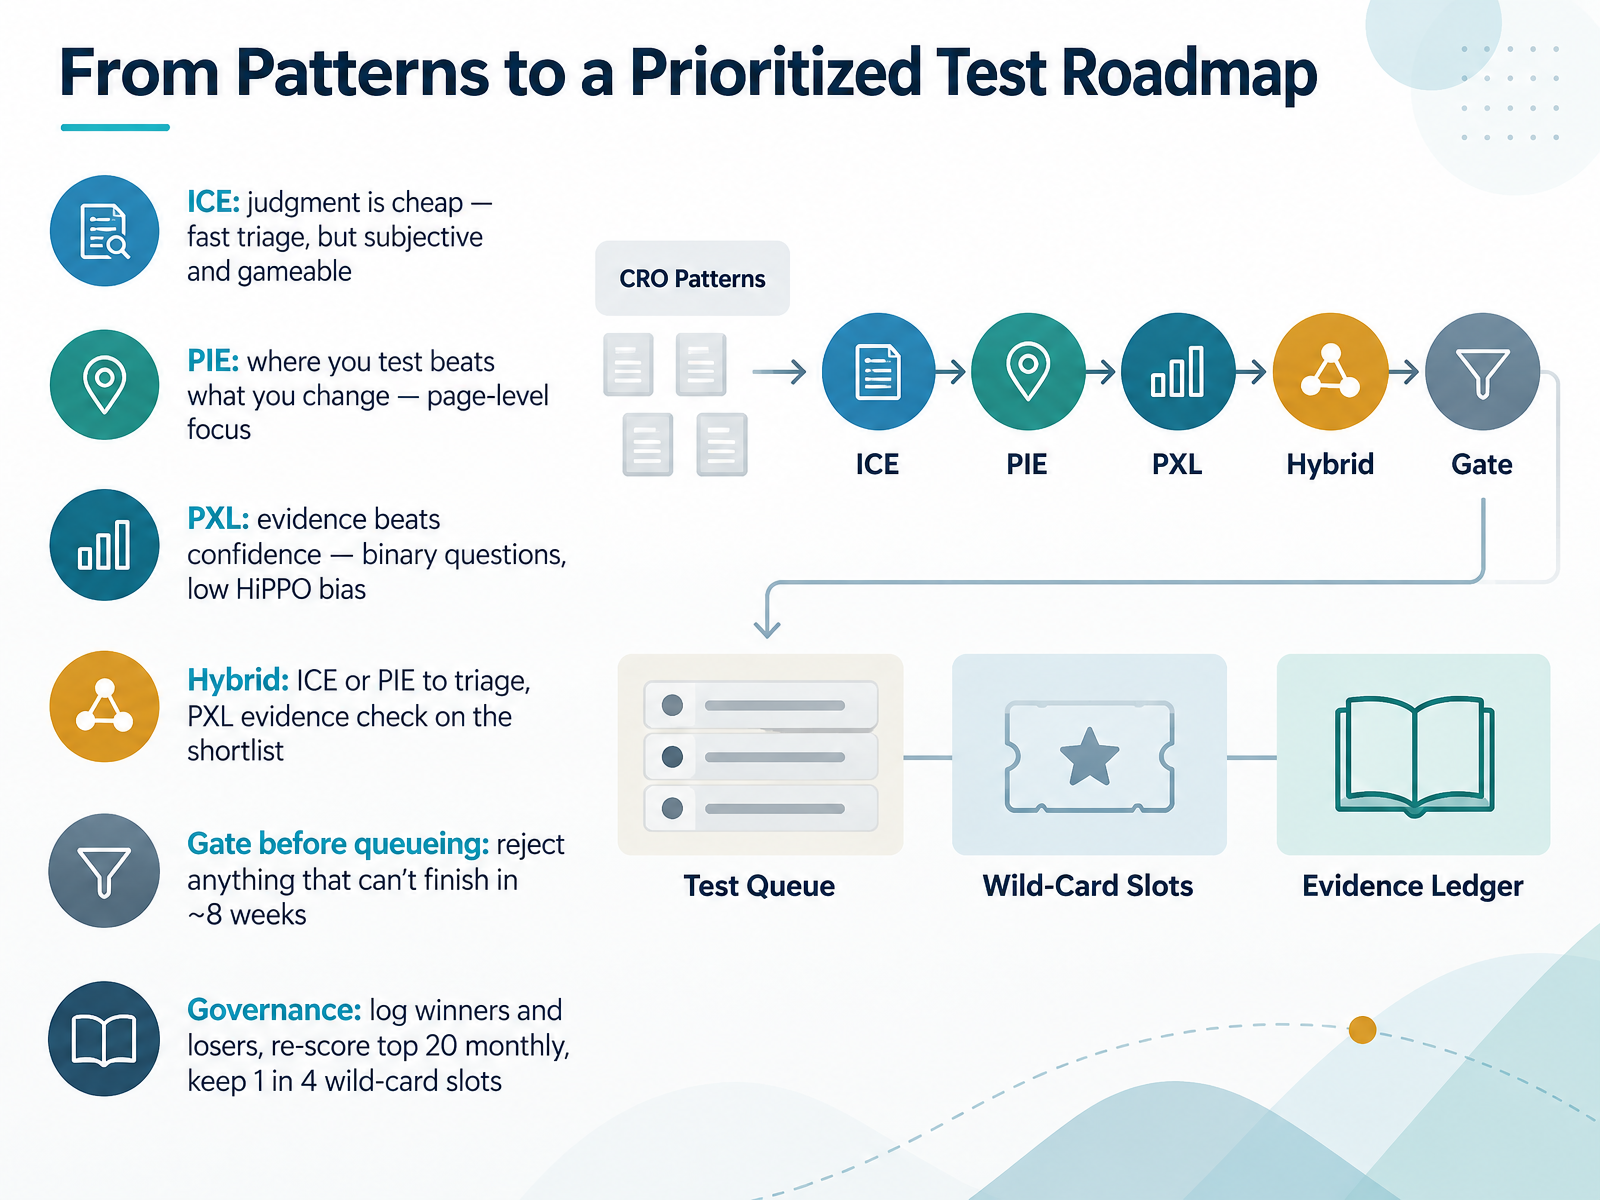
- 13From Patterns to a Prioritized Test RoadmapNow let's turn these frameworks into an actual roadmap. Start with ICE for fast triage. It's cheap and quick, but subjective and easy to game, so treat the output as a queue, not a ranking. PIE shifts the question to where you test, which makes it strong for page-level decisions. PXL replaces opinion with evidence. Binary questions push the highest paid person's opinion out of the room. In practice, most mature teams run a hybrid. Use ICE or PIE to triage a large backlog, then run PXL's evidence check on the shortlist before committing engineering time. Then add a gate before anything queues. If a test cannot finish in roughly eight weeks, reject it, because an unpowered test tells you nothing. Finally, governance keeps the system honest. Log winners and losers with the reasoning behind each score, re-score your top twenty ideas monthly, and reserve about one in four slots for wild-card tests. Safe, evidence-led ideas compound, but the biggest lifts often come from a speculative swing.
Next, we'll put this into practice. Workshop: Critique an Example, Build a Test Brief, Present Findings.
 2 min
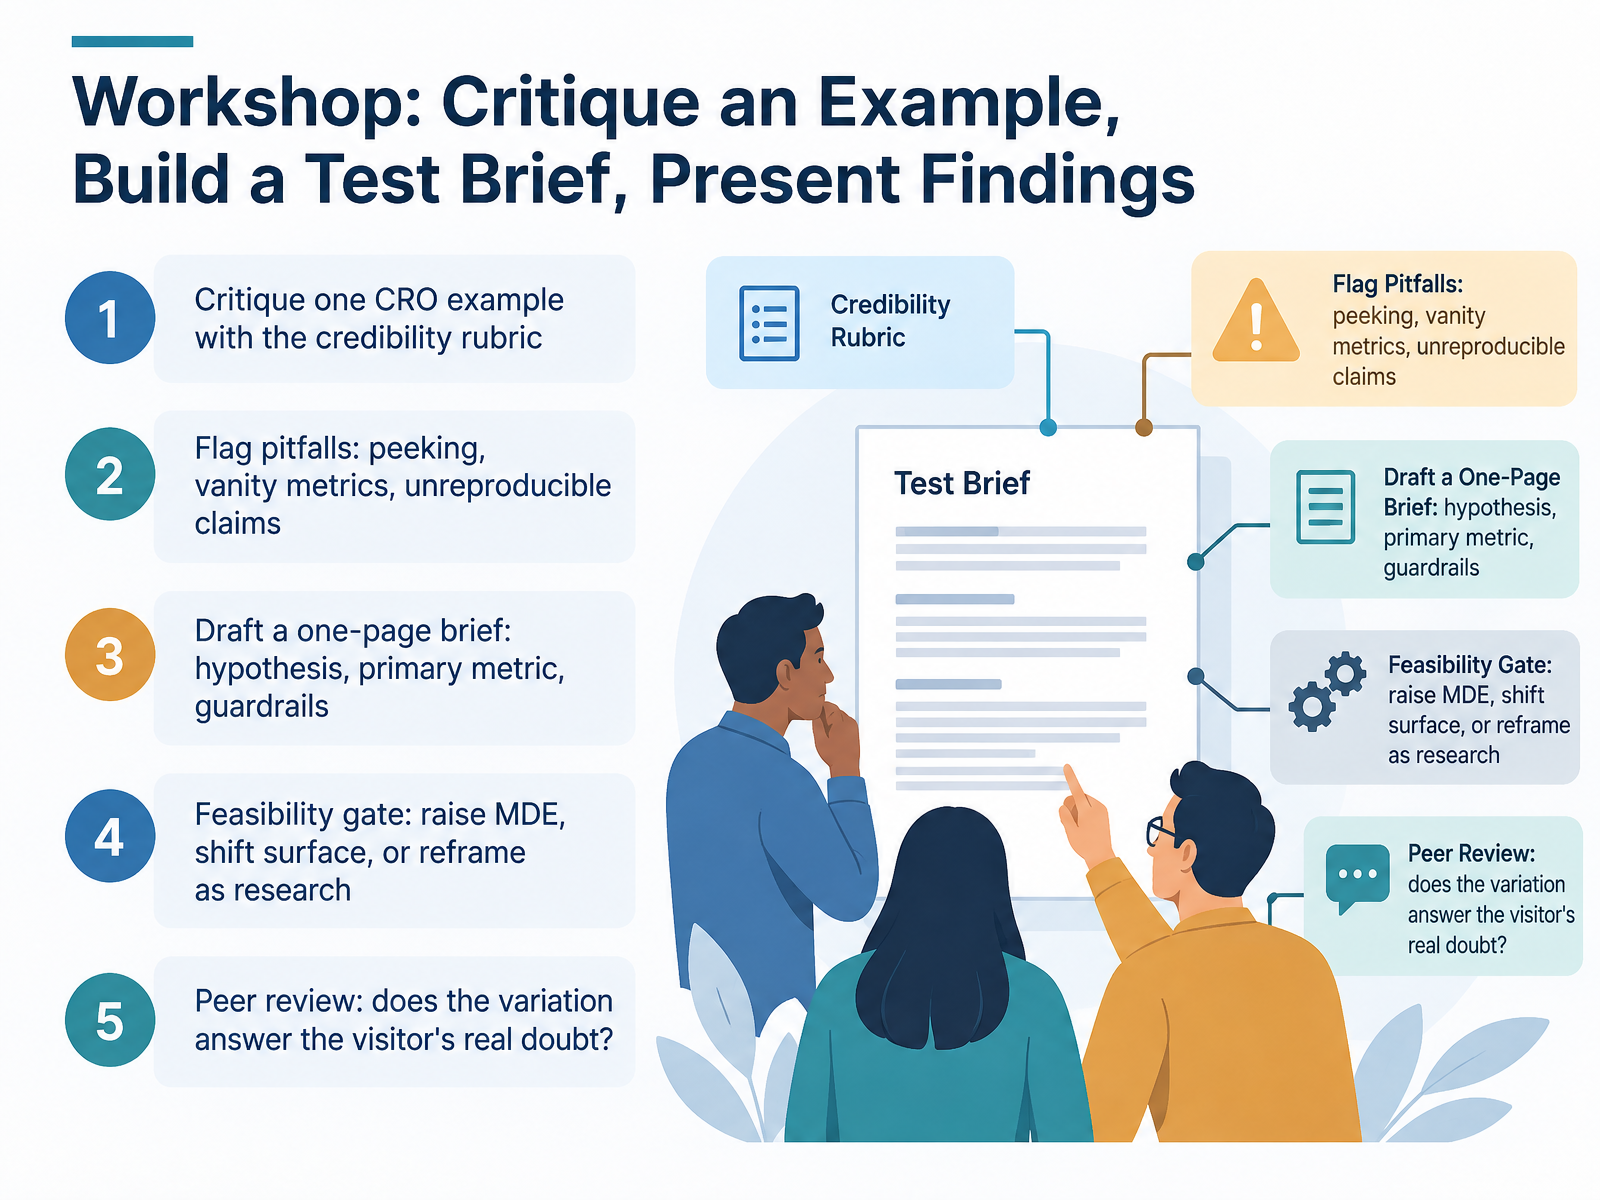
- 14Workshop: Critique an Example, Build a Test Brief, Present FindingsLet's put all of this into practice with a hands-on workshop. Here's the flow. First, critique one CRO example against the credibility rubric we covered. Look for the setup, the claim, and the gap between them. Then flag the usual pitfalls out loud: peeking at results before your sample size is met, celebrating vanity metrics like clicks instead of revenue, and any claim you couldn't reproduce on your own site. Next, draft a one-page test brief. One sentence hypothesis, one primary metric, and explicit guardrails, such as returns or revenue per visitor, set before you launch. Then apply the feasibility gate. If the test can't reach significance in an acceptable window, you have three honest options: raise the minimum detectable effect, move the test to a higher-traffic surface, or reframe it as qualitative research. Finally, peer review. Ask the sharpest question there is: does this variation actually answer the visitor's real doubt? If it doesn't, you're optimizing the wrong thing. Now let's close and commit. What to stop, start, and measure.
 dl.acm.orgarxiv.orgatticusli.com+22 min
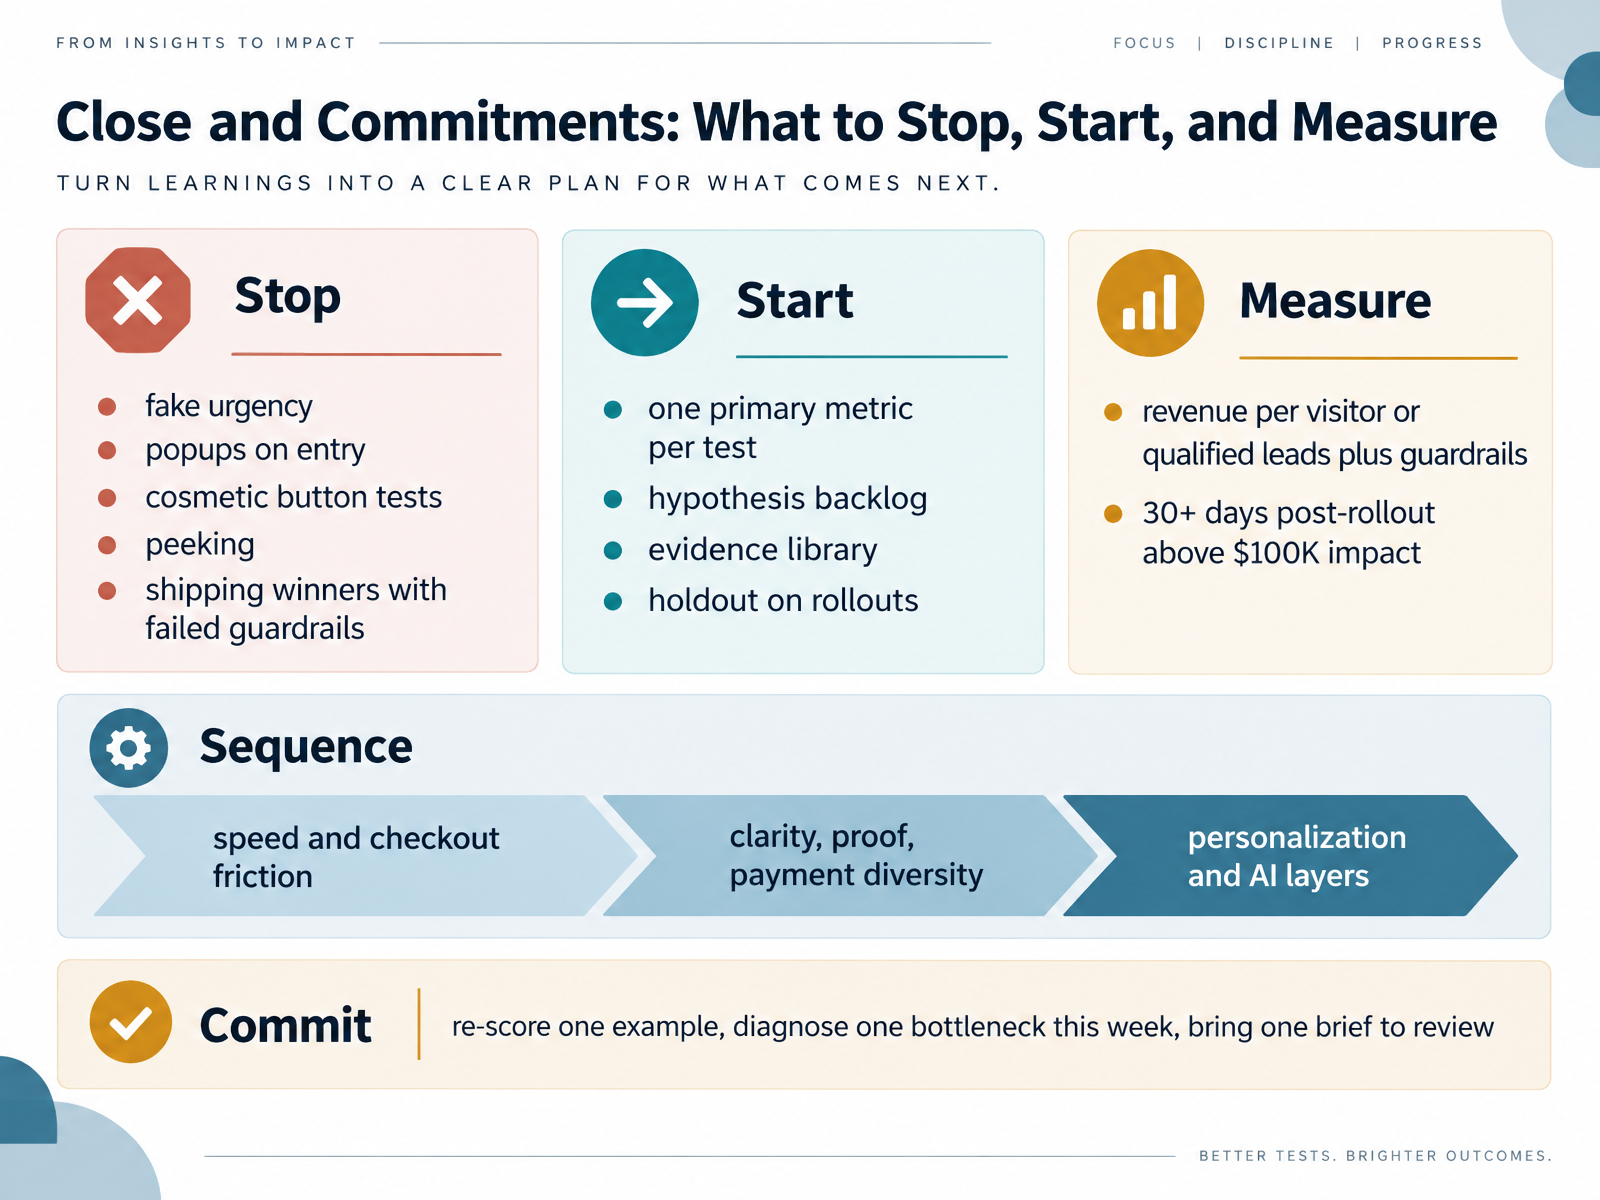
- 15Close and Commitments: What to Stop, Start, and MeasureLet's close with commitments. Stop fake urgency, entry popups, cosmetic button tests, peeking at early data, and shipping winners without guardrails. Start giving every test one primary metric, a hypothesis backlog, an evidence library, and a holdout on rollouts. Measure revenue per visitor or qualified leads, plus guardrails, and validate any test above one hundred thousand dollars in impact for thirty days or more after rollout. Sequence the work: first speed and checkout friction, then clarity, proof, and payment diversity, then personalization and AI layers. So here is your commit. Re-score one example, diagnose one bottleneck this week, and bring one brief to review. Thank you for joining. Keep testing with evidence, and let the data guide the next win.
 dl.acm.orgarxiv.orgatticusli.com+21 min
Take the deck with you
Download this course as a file — free, no sign-up needed.
- PDF handoutEvery slide page, ready to print or share.16 pages · 3.6 MBDownload
- Narrated PowerPointThe deck that presents itself — every slide carries the digital human's narration video.16 pages · 18.5 MBDownload
- PowerPoint slidesThe full deck as a .pptx — open it in PowerPoint, Keynote, or Google Slides.16 pages · 3.5 MBDownload
Free to use in your own training — please keep the PersonWise credit page at the end.
Have your own deck? Turn it into a course
Sources consulted
Web sources consulted while building this course.
- Conversion Rate Benchmarks by Industry 2026 | PageDuel — pageduel.com
- CRO Benchmarks by Industry: Conversion Rates, Bounce Rates & More (2025-2026) | The Snow Media — thesnowmedia.com
- Ecommerce Conversion Rate Benchmarks by Industry [2026] — ecomhint.com
- Average Conversion Rate By Industry: 2026-2028 Benchmarks — emulent.com
- Conversion Rate Benchmarks for YOUR Industry ... — wordstream.com
- Diagnosing Sample Ratio Mismatch in Online Controlled Experiments | Proceedings of the 25th ACM SIGKDD International Conference on Knowledge Discovery & Data Mining — dl.acm.org
- Ensure A/B Test Quality at Scale with Automated Randomization Validation and Sample Ratio Mismatch Detection — arxiv.org
- External Validity Threats | Atticus Li — atticusli.com
- kindatechnical() - A/B Testing with Time Series Data — kindatechnical.com
- Diagnosing Sample Ratio Mismatch in A/B Testing — microsoft.com
- What 6,700 CRO Experiments Say Actually Moves Revenue — landingboost.app
- 7 CRO experiments that actually moved revenue (and 3 that didn't) · GrowthFather — growthfather.com
- Scarcity and Urgency A/B Testing: What to Measure · Donnu A/B — donnuab.com
- Social Proof A/B Testing: What to Test and How to Measure · Donnu A/B — donnuab.com
- 10 CRO Lessons From 2,654 Ecommerce Brands | Build Grow Scale — buildgrowscale.com
- Ecommerce Checkout Optimization: Complete Guide (2026) - Shopify New Zealand — shopify.com
- Express Checkout UX That Lifts Mobile Checkout Completion - Ecom Design Pro — ecomdesignpro.com
- Guest Checkout UX Patterns That Cut Friction and Cart Abandonment - Ecom Design Pro — ecomdesignpro.com
- eCommerce Checkout Optimization: UX Guide 2026 — digitalapplied.com
- Ecommerce Checkout Page Design That Converts More Buyers | Tagada — tagada.io