Begin
14 pages · ~28 min
Understanding Standard Deviation in Statistics
This training explains the meaning of standard deviation (Std) in statistics, helping learners understand and interpret this key measure of data variability.
A digital instructor presents all 14 pages. Hold “Ask” at any point and ask out loud — the answer comes from this course. No sign-up needed.
What you’ll learn
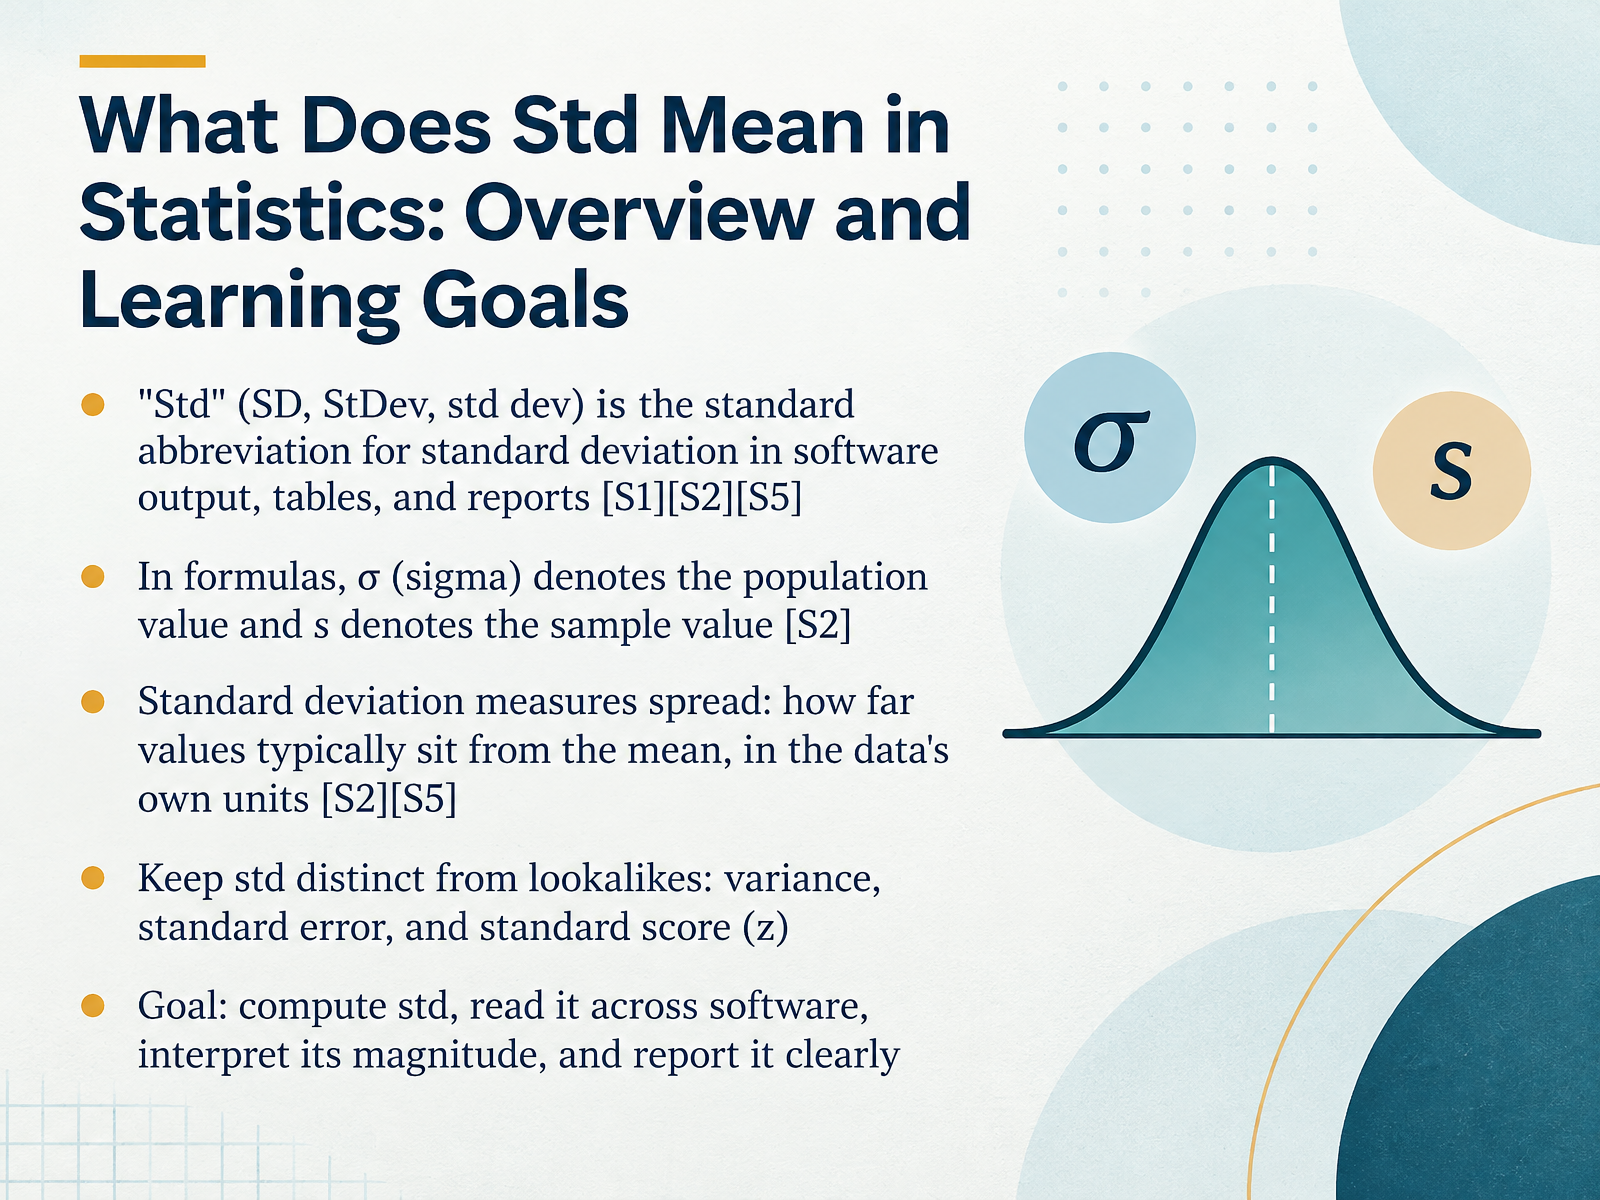
- 01What Does Std Mean in Statistics: Overview and Learning GoalsWelcome. In this course, we'll unpack one of the most common abbreviations you'll see in statistics: std. In software output, tables, and reports, std, or SD, or standard deviation, all mean the same thing. Standard deviation measures spread. It tells you how far values typically sit from the mean, in the data's own units. For example, if the average test score is 70 and the standard deviation is 10, most scores fall within about 10 points of 70. To read results correctly, keep std distinct from lookalikes such as variance, standard error, and standard score. By the end, you'll be able to compute standard deviation, spot it across software, judge its magnitude, and report it clearly. Next, we'll look at core concepts and notation: sigma, s, and variance.stats.oarc.ucla.edusupport.minitab.comncss.com+21 min
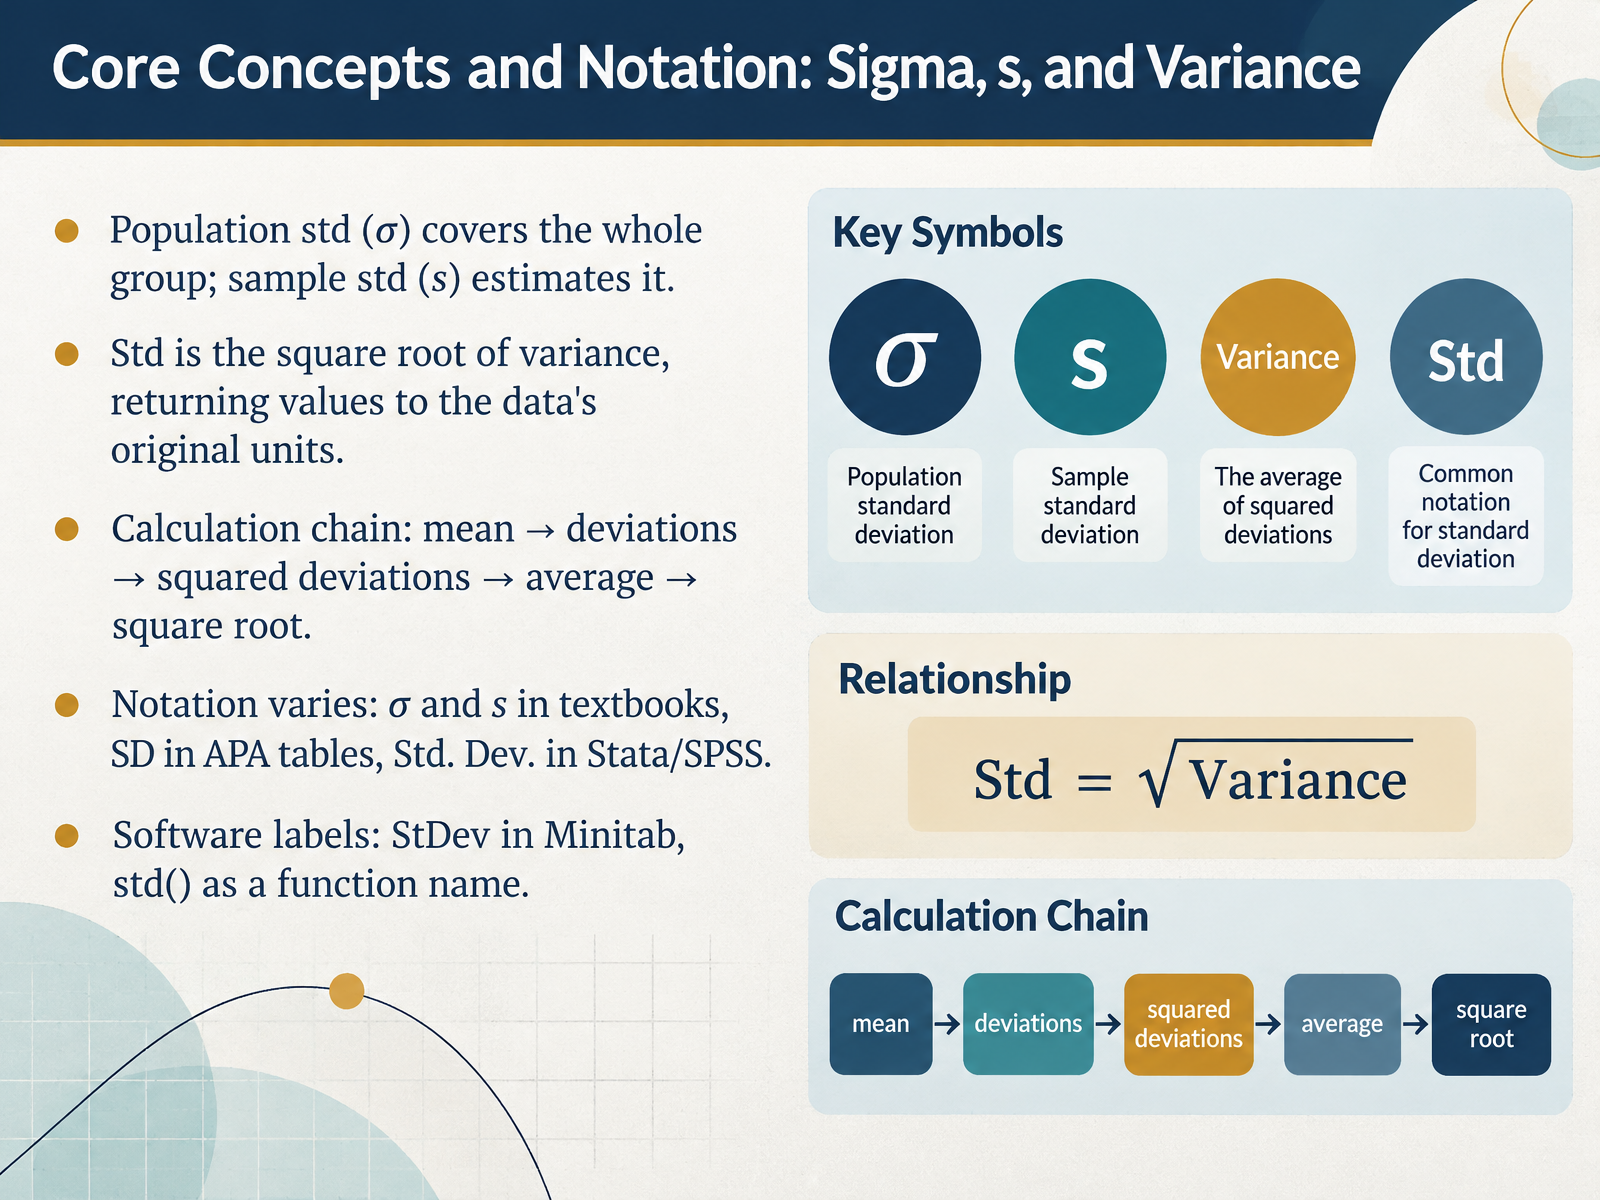
- 02Core Concepts and Notation: Sigma, s, and VarianceLet's build the core notation. The population standard deviation, written as the Greek letter sigma, describes the whole group. The sample standard deviation, written s, estimates that same quantity from a subset. Standard deviation is the square root of variance. Variance averages squared deviations, so its units are squared. Taking the square root returns values to the data's original units. Here is the calculation chain. Find the mean. Subtract it from each value to get deviations. Square those deviations. Average the squares to get variance. Then take the square root. Labels also change by field. Textbooks use sigma and s. APA tables use SD. Stata and SPSS print Std. Dev. Minitab says StDev, and functions appear as std. Read the label against the formula, not the other way around. Next, we look at why sample formulas divide by n minus one.
 stats.oarc.ucla.edusupport.minitab.comncss.com+22 min
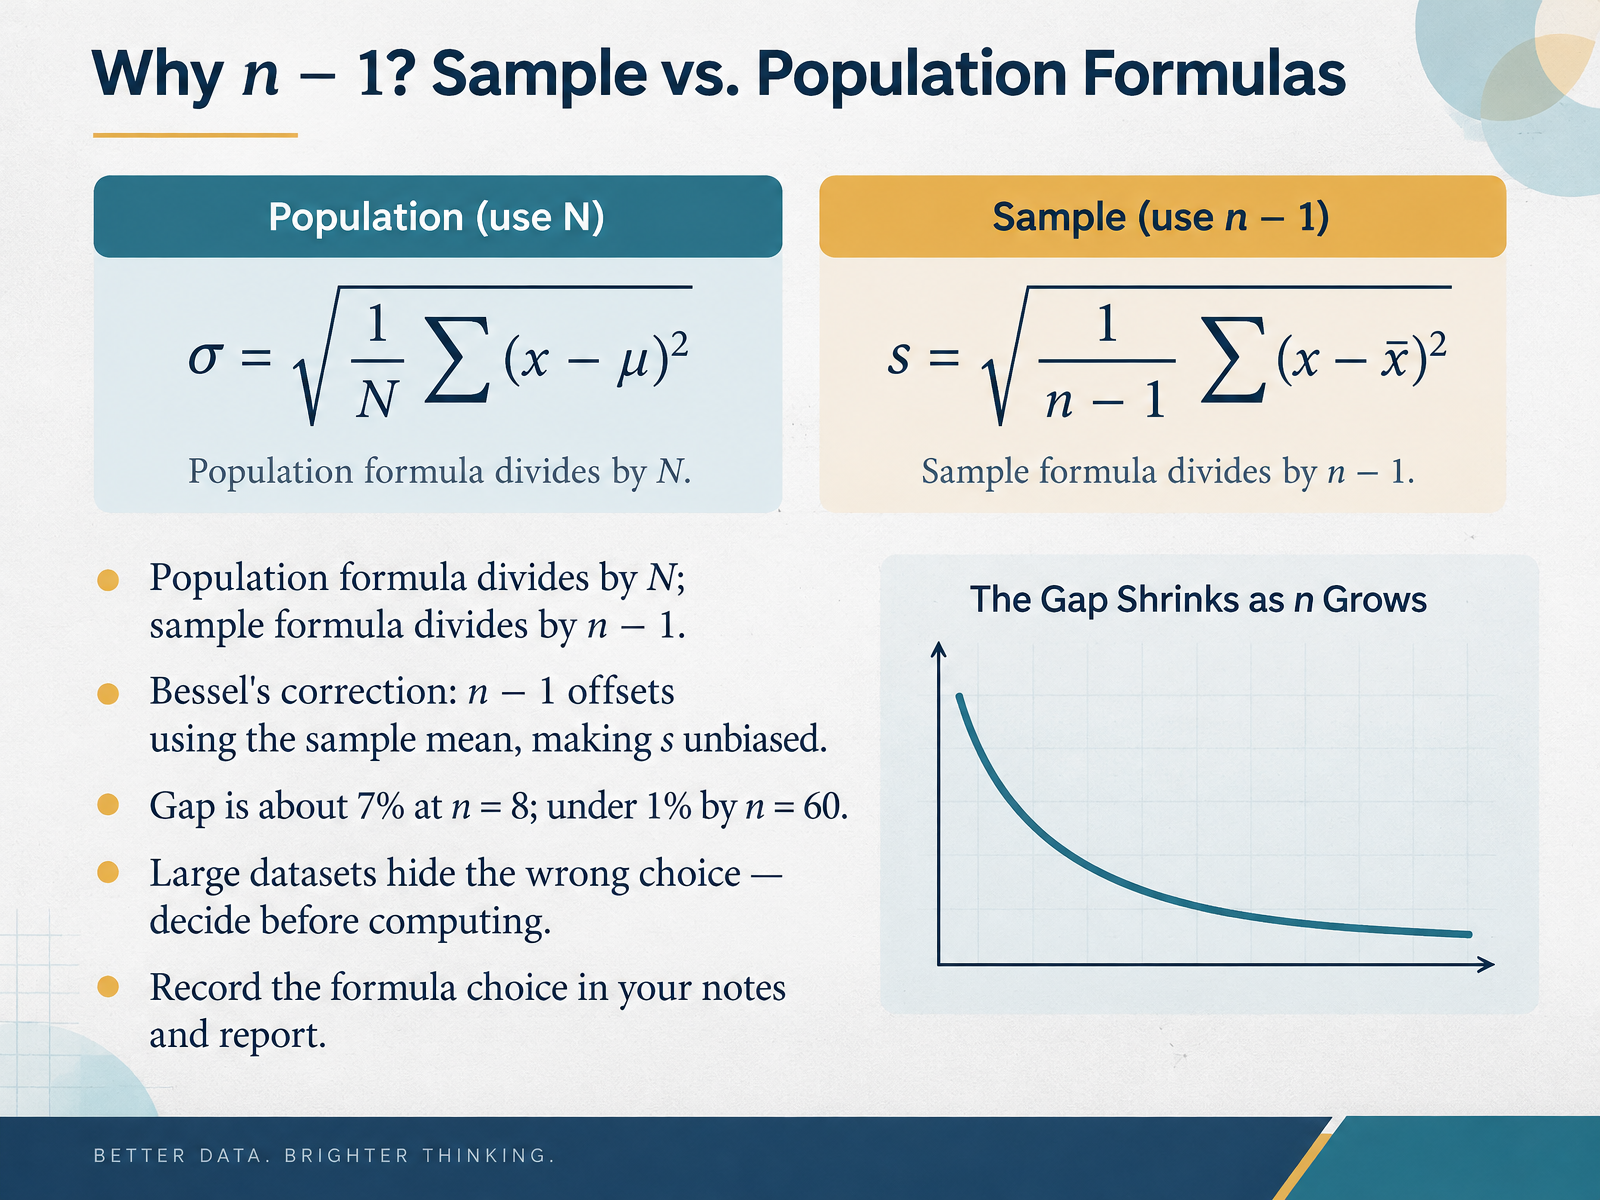
- 03Why n − 1? Sample vs. Population FormulasNow let's look at why the formula uses n minus one. Suppose you collect the eight tallest buildings in a city. That is a sample, not the whole population of buildings. The population formula divides by capital N, the full count. The sample formula divides by lowercase n minus one, one less than your sample size. That adjustment is called Bessel's correction. It compensates for using the sample mean, which sits closer to your data than the true mean would, so the estimate stays unbiased. In practice, the gap between the two formulas is about seven percent when n equals eight. By n equals sixty, it drops below one percent. That is why large datasets hide the wrong choice, so decide which formula you need before you compute. Then record that choice in your notes and your report. Your takeaway is this. Always state whether your standard deviation divides by N or by n minus one. Next, we will walk through how to calculate standard deviation step by step.
 pandas.pydata.orgsupport.microsoft.comsearch.r-project.org+21 min
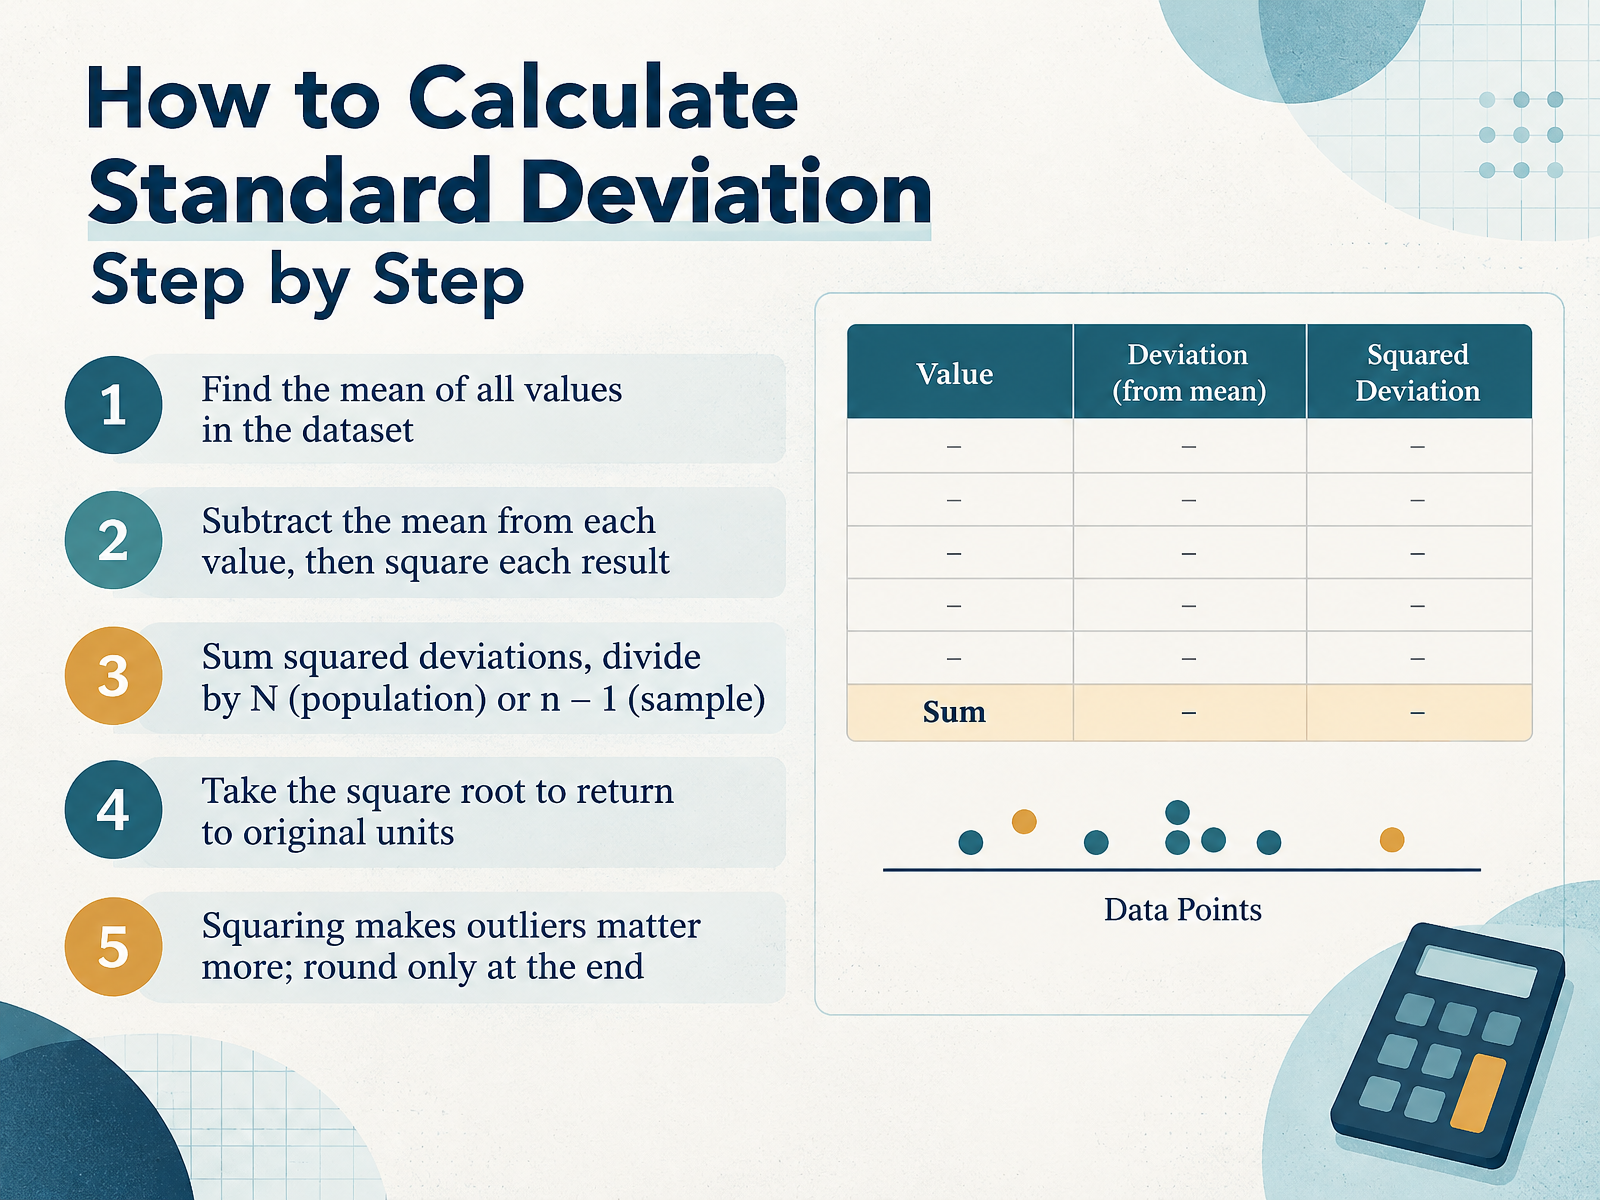
- 04How to Calculate Standard Deviation Step by StepLet's walk through how to calculate standard deviation step by step. Start with the mean, the simple average of all values in your dataset. Next, subtract the mean from each value, then square each result. Squaring matters because it makes outliers count more. Now sum those squared deviations. Then divide by N if you have the whole population, or by n minus 1 if you have a sample. Finally, take the square root to return to the original units. For example, test scores of 70, 80, and 90 have a mean of 80, squared deviations of 100, 0, and 100, and a population standard deviation of about 8.2. Round only at the end to avoid compounding error. The takeaway: standard deviation follows five repeatable steps, and the divisor choice changes your result.
 stats.oarc.ucla.edusupport.minitab.comncss.com+21 min
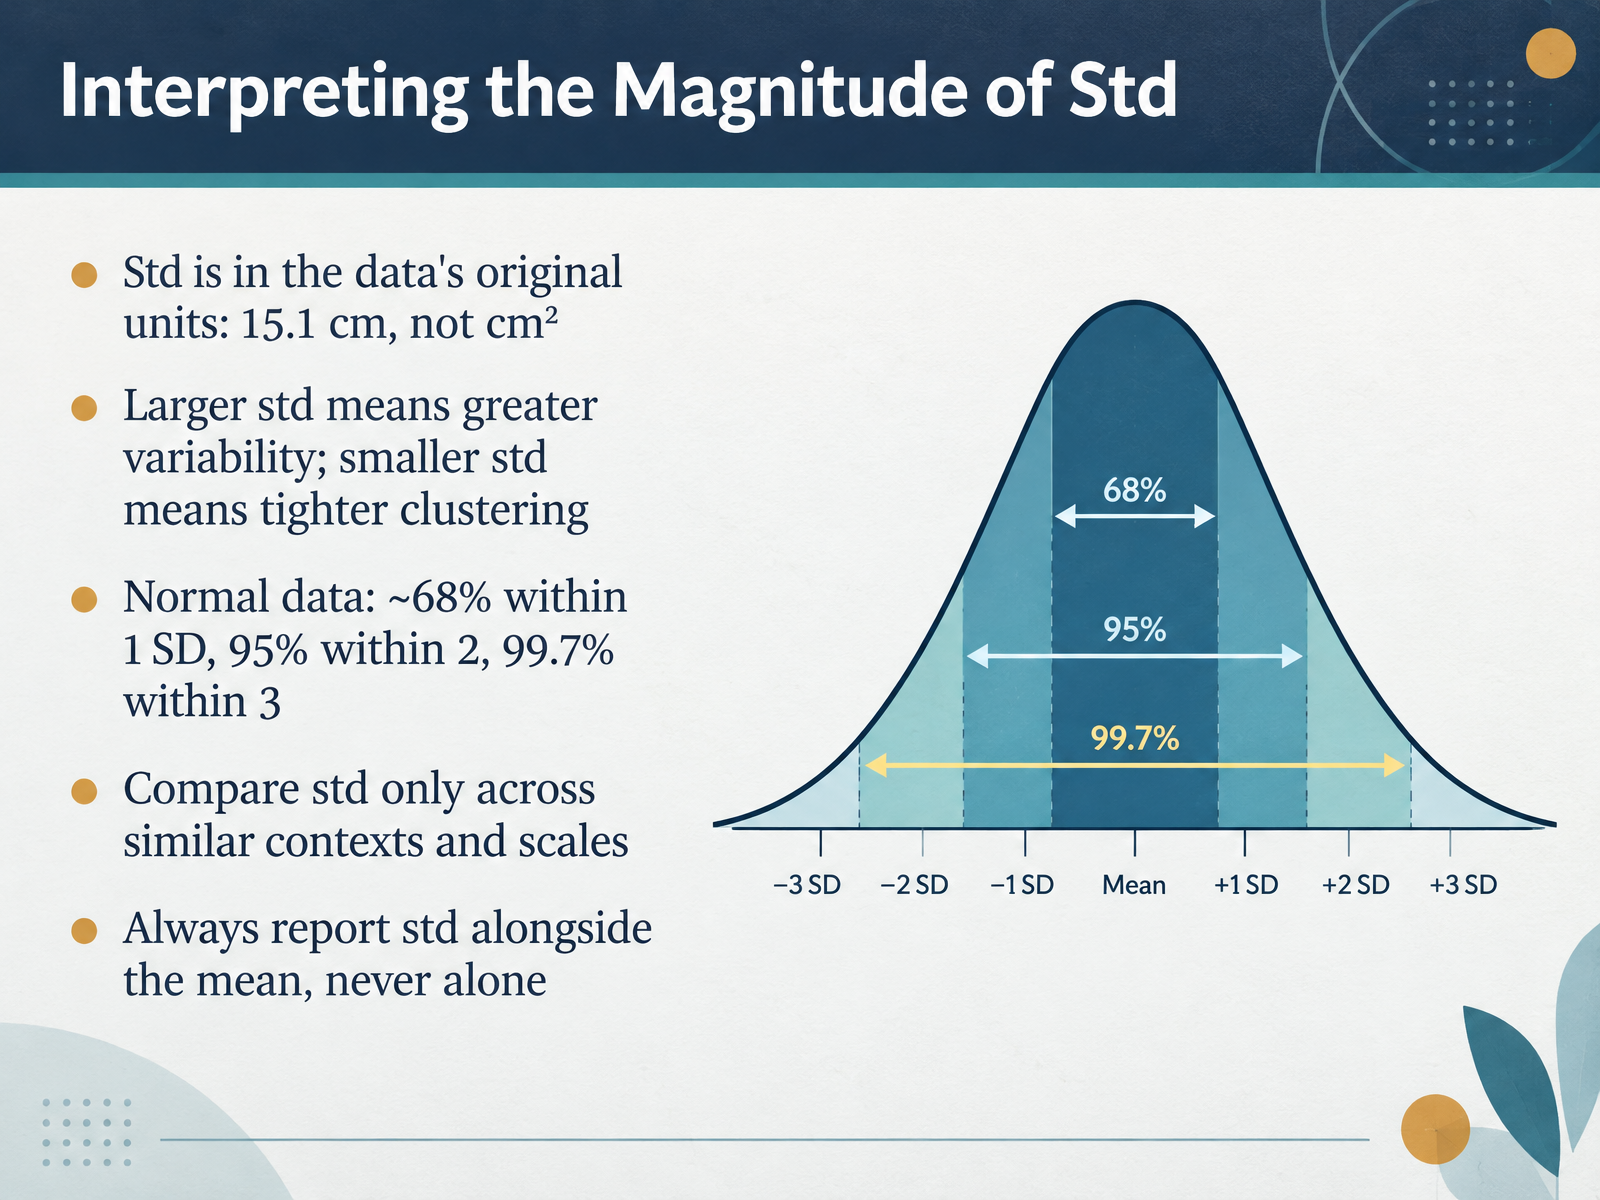
- 05Interpreting the Magnitude of StdNow, let's interpret the magnitude of standard deviation. First, standard deviation is in the data's original units. If your heights vary by fifteen point one centimeters, the standard deviation is fifteen point one centimeters, not centimeters squared. Second, a larger standard deviation means greater variability. A smaller one means tighter clustering. Picture two archery targets. One has arrows spread wide. The other has arrows grouped near the center. The grouped target has the smaller standard deviation. Third, when data follow a normal pattern, about sixty eight percent of values fall within one standard deviation of the mean, about ninety five percent within two, and about ninety nine point seven percent within three. Fourth, compare standard deviation only across similar contexts and scales. A spread of ten points means something different on a test scored out of one hundred than on one scored out of twenty. Finally, always report standard deviation alongside the mean, never alone. The mean tells you the center. The standard deviation tells you the spread. You need both to understand the data. Takeaway: report mean and standard deviation together, and use the sixty eight, ninety five, ninety nine point seven guideline to judge spread. Next, we'll look at reading standard deviation in tables and reports.
 stats.oarc.ucla.edusupport.minitab.comncss.com+22 min
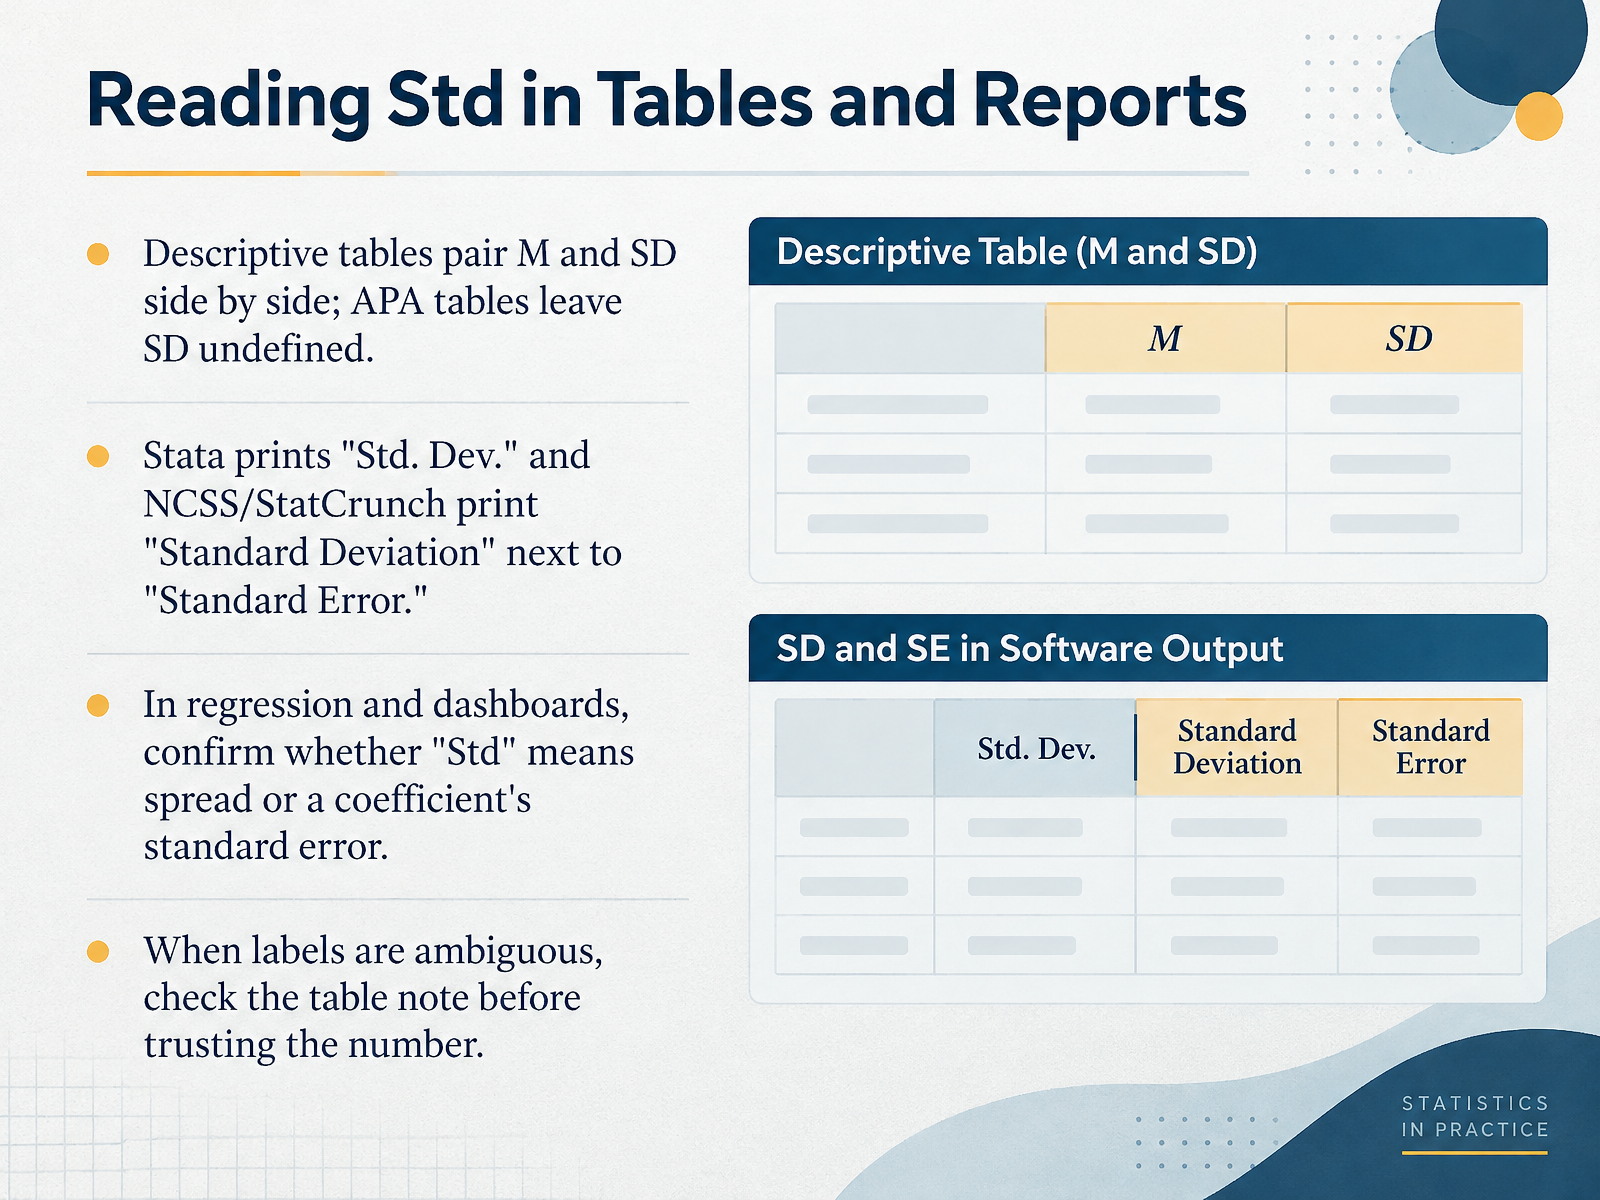
- 06Reading Std in Tables and ReportsLet's look at how to read Std in tables and reports. In descriptive tables, you often see M and SD side by side. M means the mean, and SD means the standard deviation, a measure of spread. In APA style tables, SD is left undefined, because it is a standard symbol. But software varies. Stata prints Std. Dev., while NCSS and StatCrunch print Standard Deviation next to Standard Error. For example, a table may show a mean of fifty with a standard deviation of ten, and that tells you typical spread. In regression and dashboards, confirm whether Std means spread or a coefficient's standard error. When labels are ambiguous, check the table note before trusting the number. Your takeaway is this: always confirm what Std means before you interpret the value. Next, we will look at Std in Software: Excel, R, Python, SPSS, SAS, and MATLAB.
 stats.oarc.ucla.edusupport.minitab.comncss.com+21 min
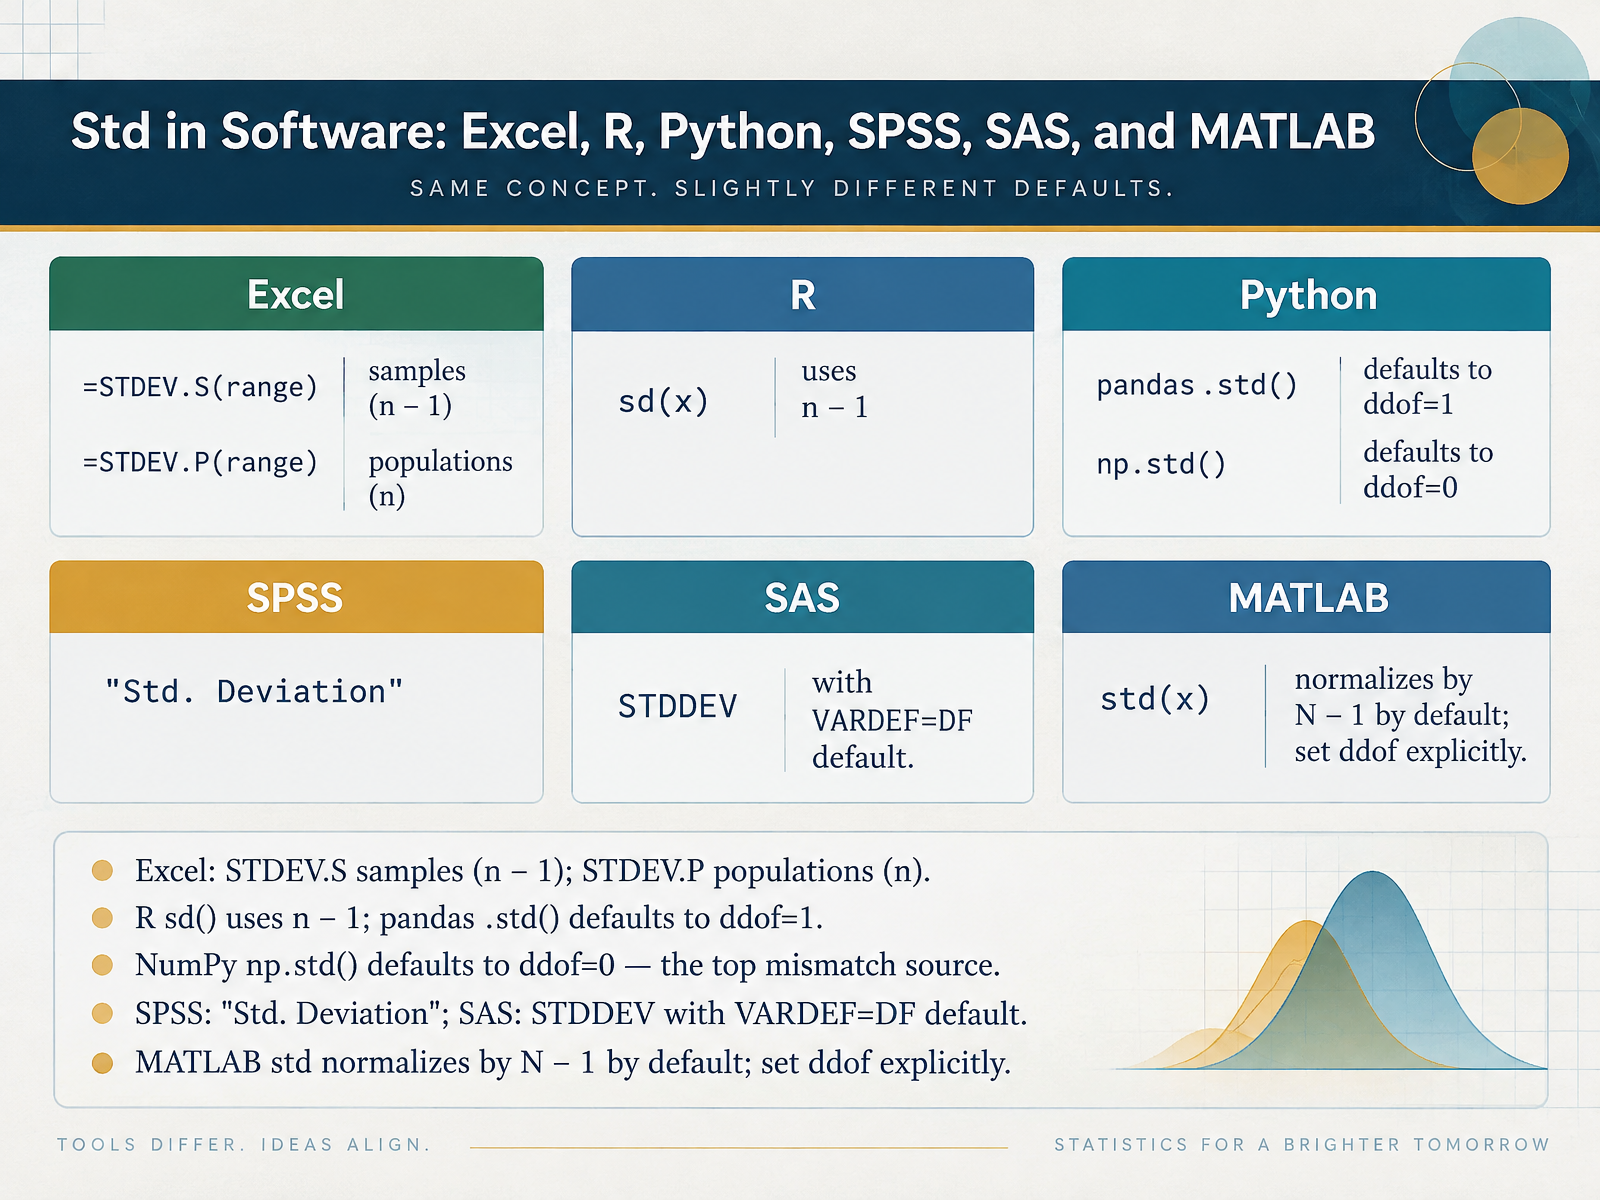
- 07Std in Software: Excel, R, Python, SPSS, SAS, and MATLABNow, let's look at how each software tool handles Std by default. In Excel, use STDEV.S for a sample, which divides by n minus 1, and STDEV.P for a population, which divides by n. In R, the sd function uses n minus 1. In pandas, the dot std method defaults to ddof equals 1, which is the sample version. But watch out. NumPy's np.std defaults to ddof equals 0, the population version. That mismatch is the top source of confusing results in Python. In SPSS, the output column is labeled Std. Deviation. In SAS, the STDDEV option defaults to VARDEF equals DF, the sample formula. In MATLAB, std normalizes by N minus 1 by default, but you can set the degrees of freedom explicitly. So here is your takeaway. Before you trust a standard deviation, check the default correction in your tool, and write ddof explicitly when you can.
 pandas.pydata.orgsupport.microsoft.comsearch.r-project.org+21 min
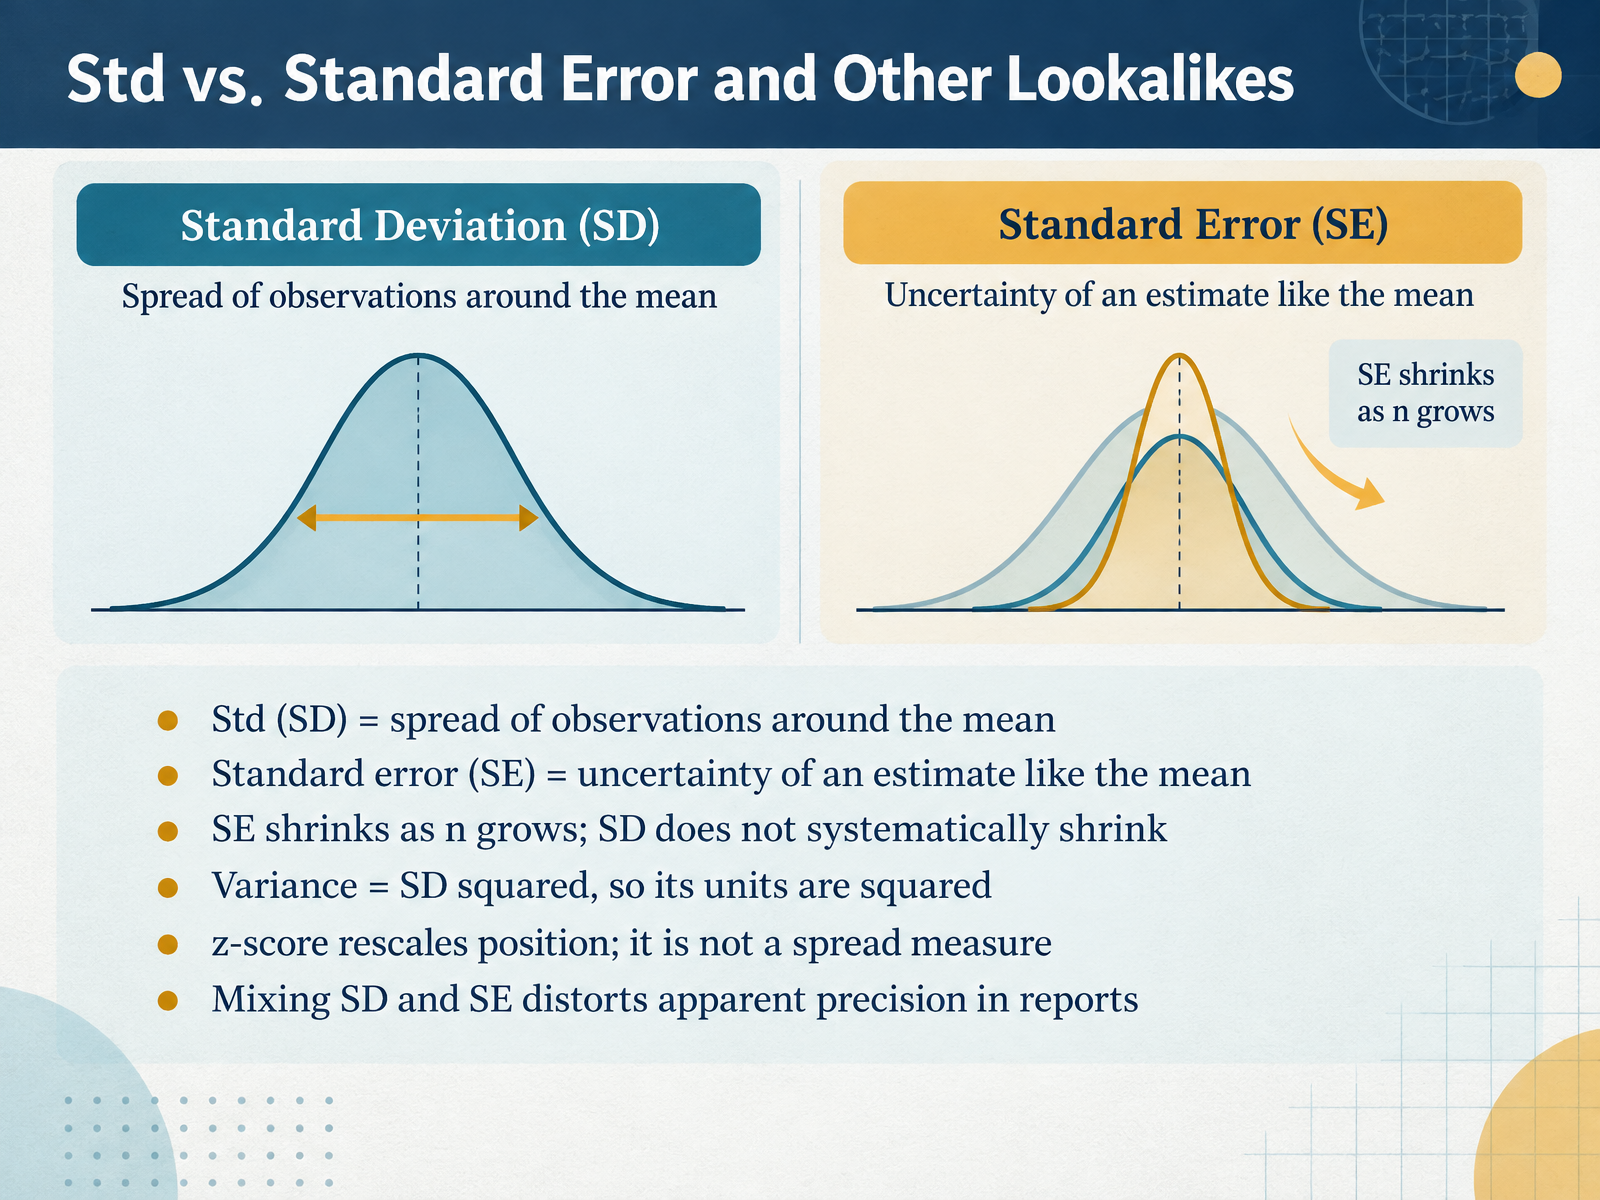
- 08Std vs. Standard Error and Other LookalikesNow let's separate standard deviation from its lookalikes. Standard deviation, often shortened to Std or SD, measures the spread of observations around the mean. Picture test scores: a large SD means scores are scattered widely, while a small SD means they cluster near the average. Standard error, or SE, is different. It measures the uncertainty of an estimate, such as the mean. Here is the key contrast: SE shrinks as your sample size n grows, but SD does not systematically shrink. More data gives you a more precise estimate, not less variable observations. Variance is simply SD squared, so its units are squared, which makes variance harder to read in everyday terms. A z-score rescales a position relative to the mean; it is not a spread measure. And mixing SD and SE in reports distorts the apparent precision. So before you read any spread number, check the label and know which one you are looking at. Next, we will look at reporting Std correctly, with labels, units, and style.
 stats.oarc.ucla.edusupport.minitab.comncss.com+21 min
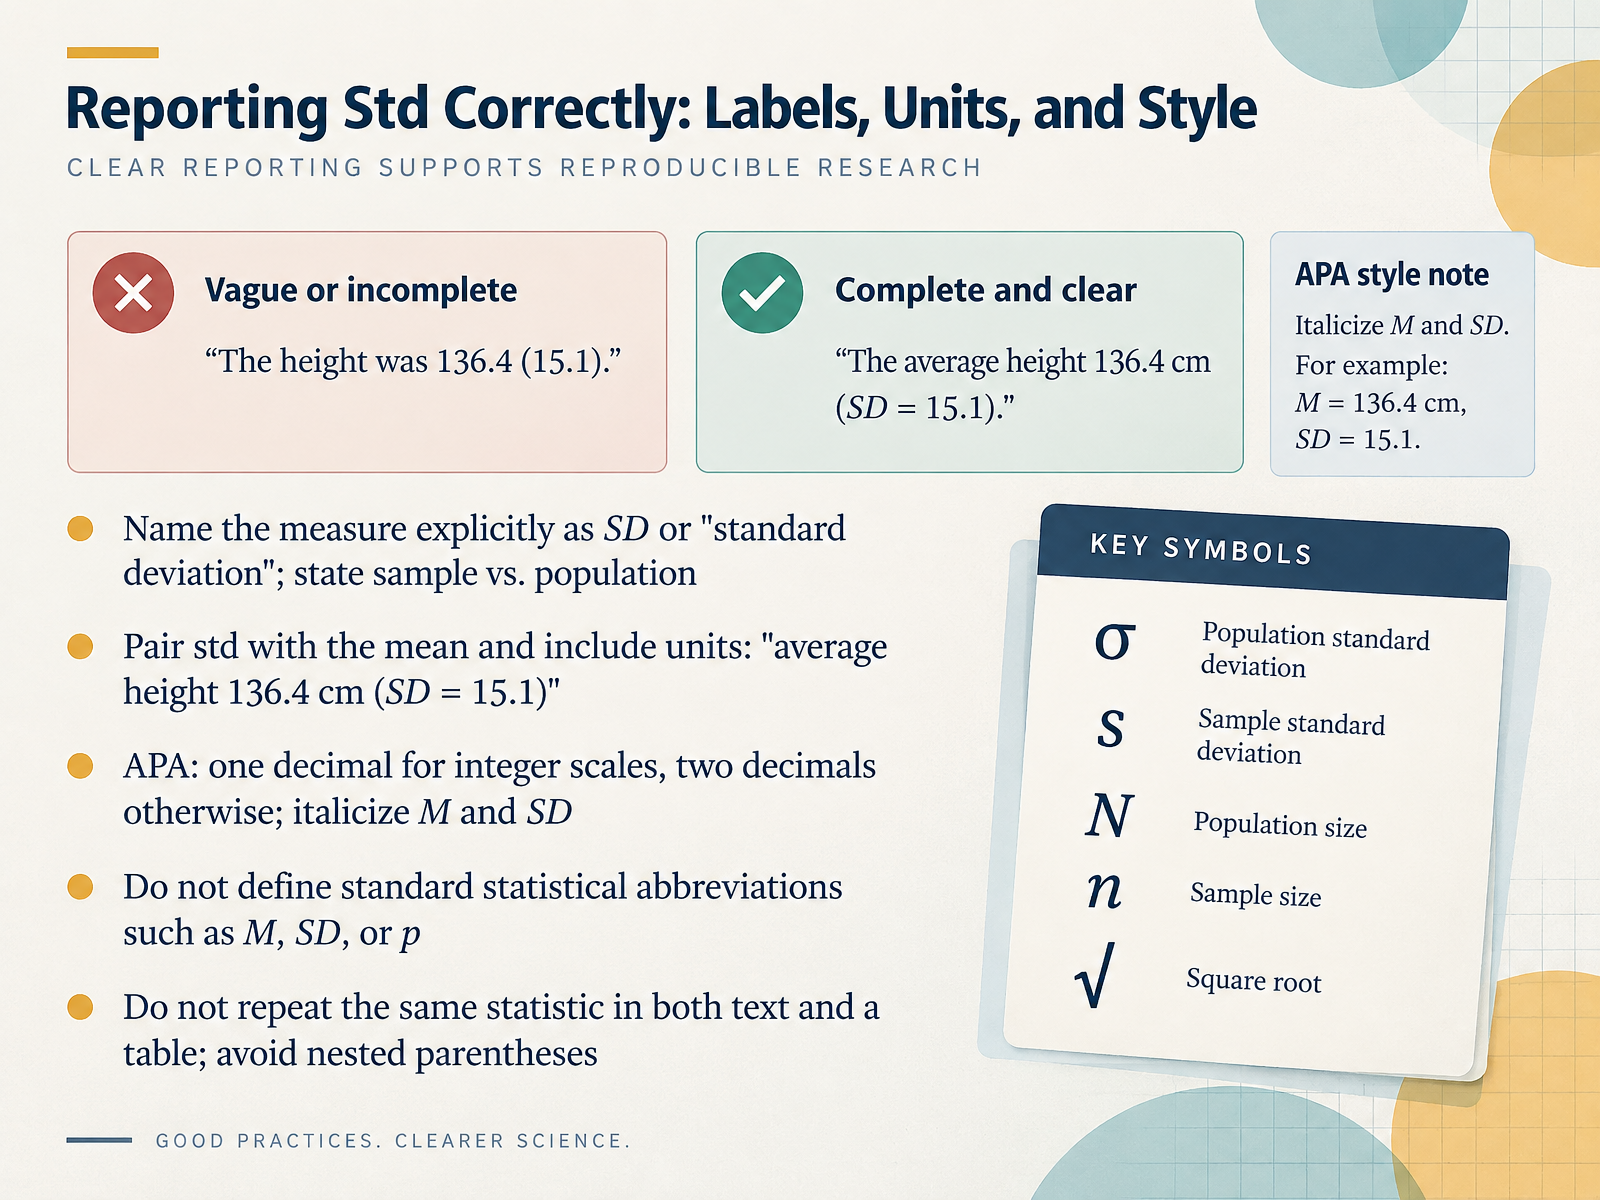
- 09Reporting Std Correctly: Labels, Units, and StyleNow let's look at how to report standard deviation correctly. First, name the measure explicitly. Write "standard deviation," or SD, and say whether it applies to a sample or a population. Second, pair standard deviation with the mean, and include the units. For example, "average height was 136.4 centimeters (SD equals 15.1)." Third, follow APA style for decimals. Use one decimal for integer scales, like surveys, and two decimals otherwise. Also, italicize the letters M and SD. Fourth, do not define standard statistical abbreviations such as M, SD, or p. Readers in your field already know them. Finally, do not repeat the same statistic in both the text and a table. And avoid nested parentheses. If a statistic already sits inside parentheses, use commas to separate related values. The takeaway is simple. Label the measure, keep the units, round sensibly, and report each statistic once. Next, we'll see these rules applied in a practical example with students and teachers.
 apastyle.apa.orgowl.purdue.eduowl.purdue.edu+22 min
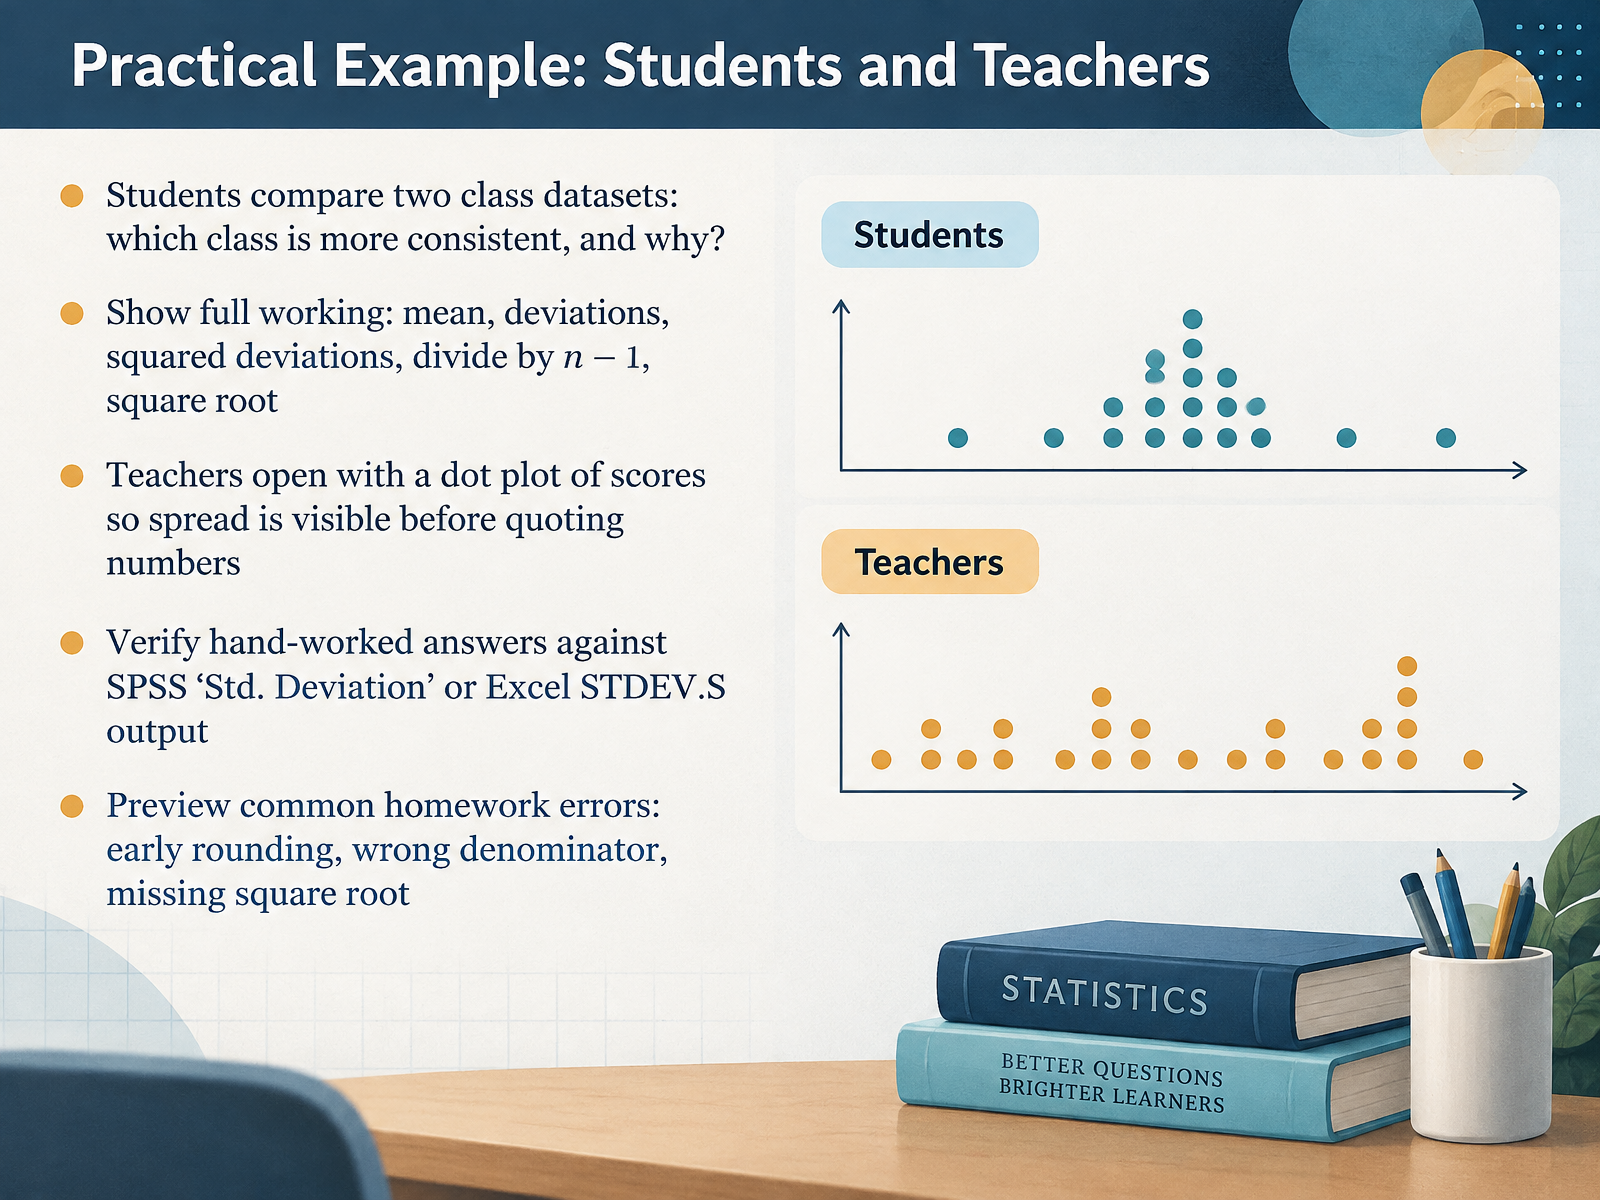
- 10Practical Example: Students and TeachersLet us put the standard deviation to work with a classroom example. Imagine two classes take the same test. Students ask a simple question: which class is more consistent, and why? You answer it with the full working. Find the mean. Subtract it from each score to get the deviations. Square each deviation. Add them up, divide by n minus one, where n is the number of scores, then take the square root. For teachers, start with a dot plot of the scores, so the spread is visible before you quote any numbers. A tight cluster means a small standard deviation. A wide scatter means a large one. Then check your hand-worked answer against software. In SPSS, look for the column labeled Std. Deviation. In Excel, use the function STDEV.S. Both divide by n minus one, so your numbers should match. Now watch for three common homework errors: rounding too early, using the wrong denominator, and forgetting the final square root. The takeaway is this. Always look at the plot first, then confirm the number in software. Next, we move on to analysts, researchers, and content creators.
 stats.oarc.ucla.edusupport.minitab.comncss.com+22 min
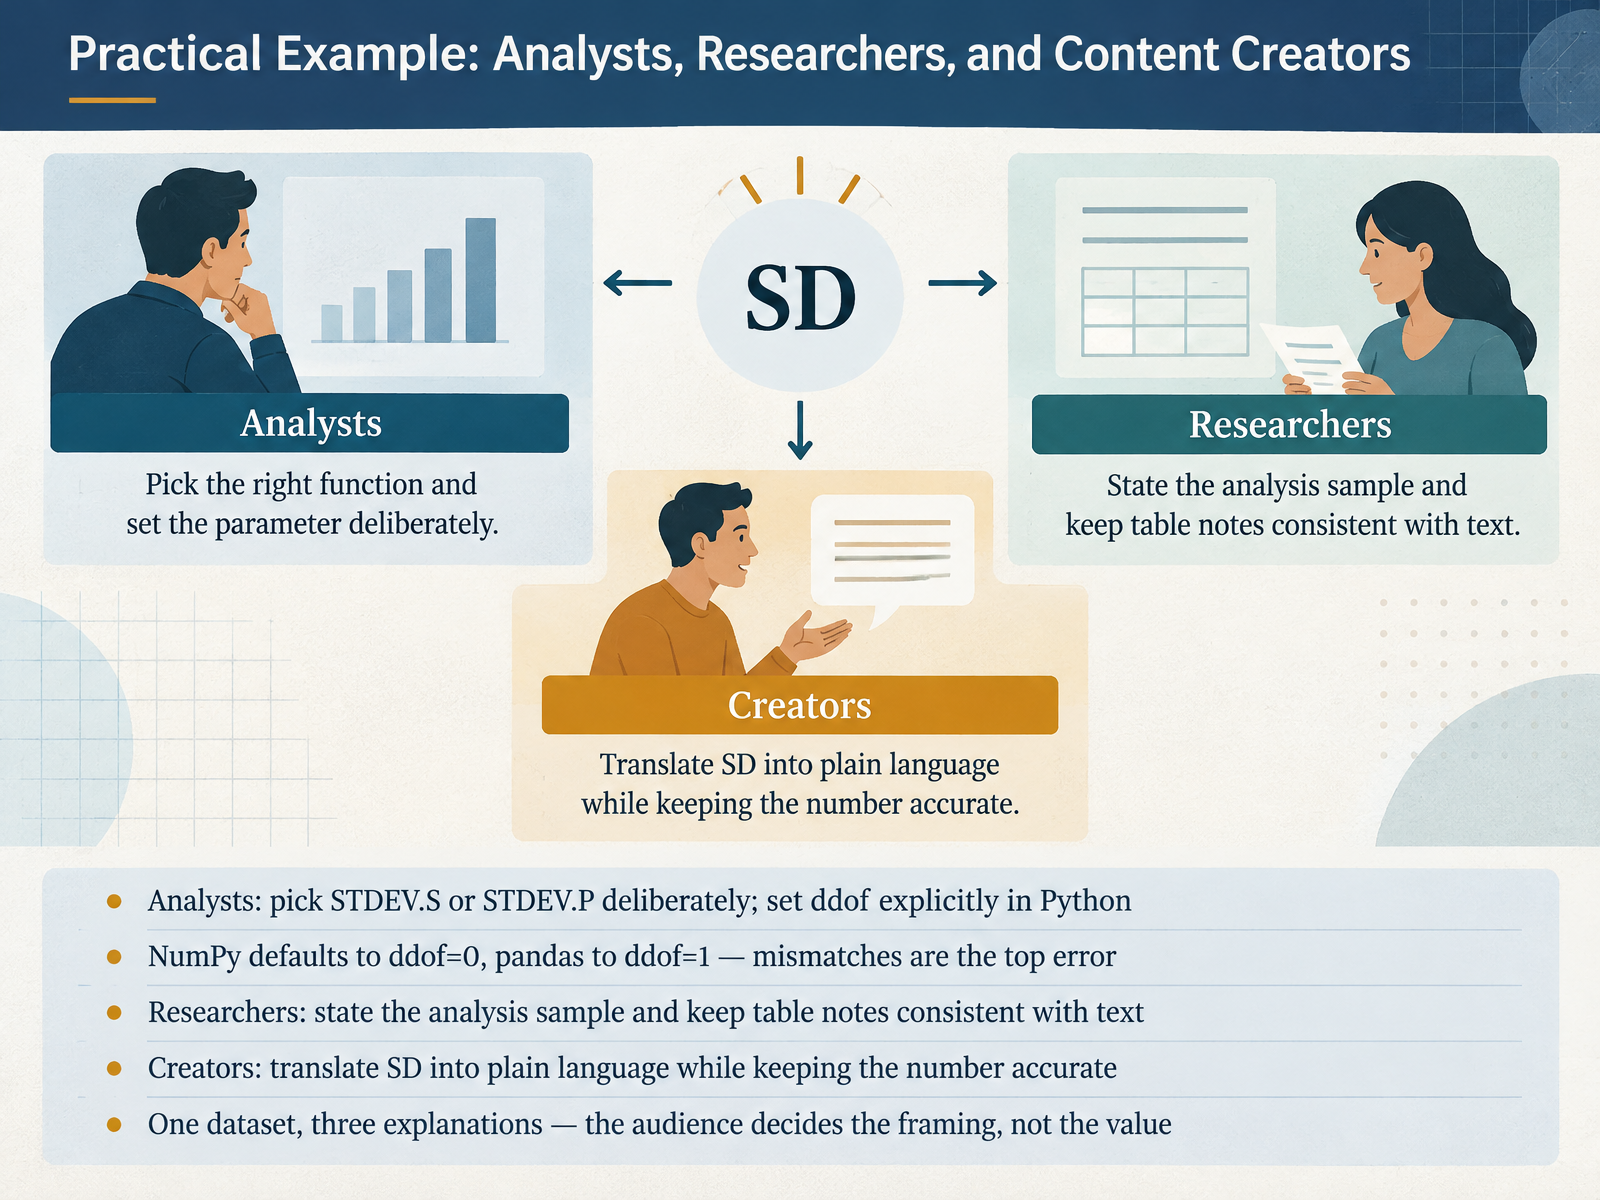
- 11Practical Example: Analysts, Researchers, and Content CreatorsLet's put this into practice with one dataset and three audiences. If you're an analyst, choose STDEV.S for a sample or STDEV.P for a full population, and say which one you used. In Python, set ddof, or delta degrees of freedom, explicitly. NumPy defaults to ddof equals zero, the population formula, while pandas defaults to ddof equals one, the sample formula. That mismatch is the most common error you'll see. If you're a researcher, state your analysis sample clearly, and keep your table notes consistent with your text. If you're a content creator, translate the standard deviation into plain language, but keep the number accurate. Remember, one dataset can support three explanations. Your audience decides the framing, not the value. Next, let's look at common mistakes and misconceptions.
 apastyle.apa.orgowl.purdue.eduowl.purdue.edu+21 min
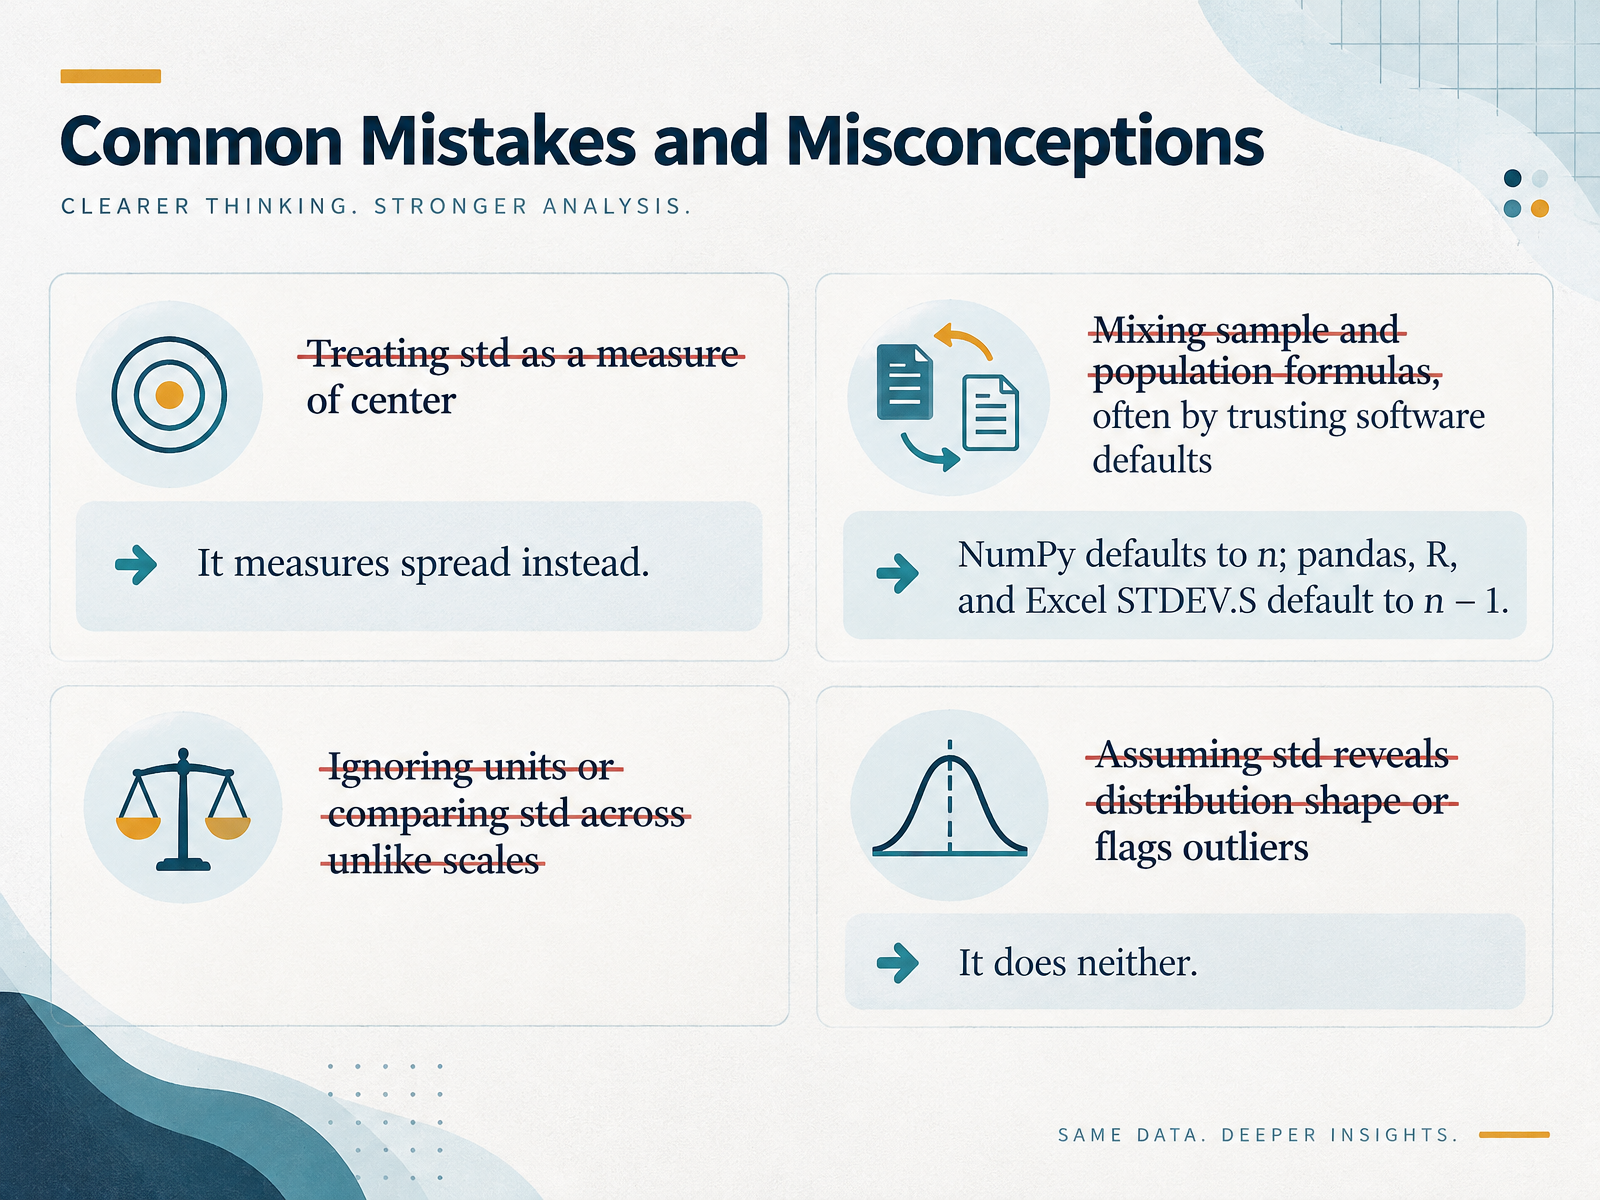
- 12Common Mistakes and MisconceptionsLet's clear up the mistakes that trip people up most often. First, std is not a measure of center. The mean tells you where data sit. Std tells you how far they spread. Second, mixing formulas. Software defaults differ. NumPy divides by n, while pandas, R, and Excel's STDEV.S divide by n minus one. So the same numbers can give two answers. Third, units. Std carries the units of your data, so never compare a std in dollars with one in meters. Fourth, shape. Std tells you spread only. It does not reveal skew or flag outliers on its own. Always plot your data alongside the number. Your takeaway: record which formula your tool used, and keep units and scale in mind. Next, let's bring this into a checklist: reading and reporting std with confidence.
 pandas.pydata.orgsupport.microsoft.comsearch.r-project.org+21 min
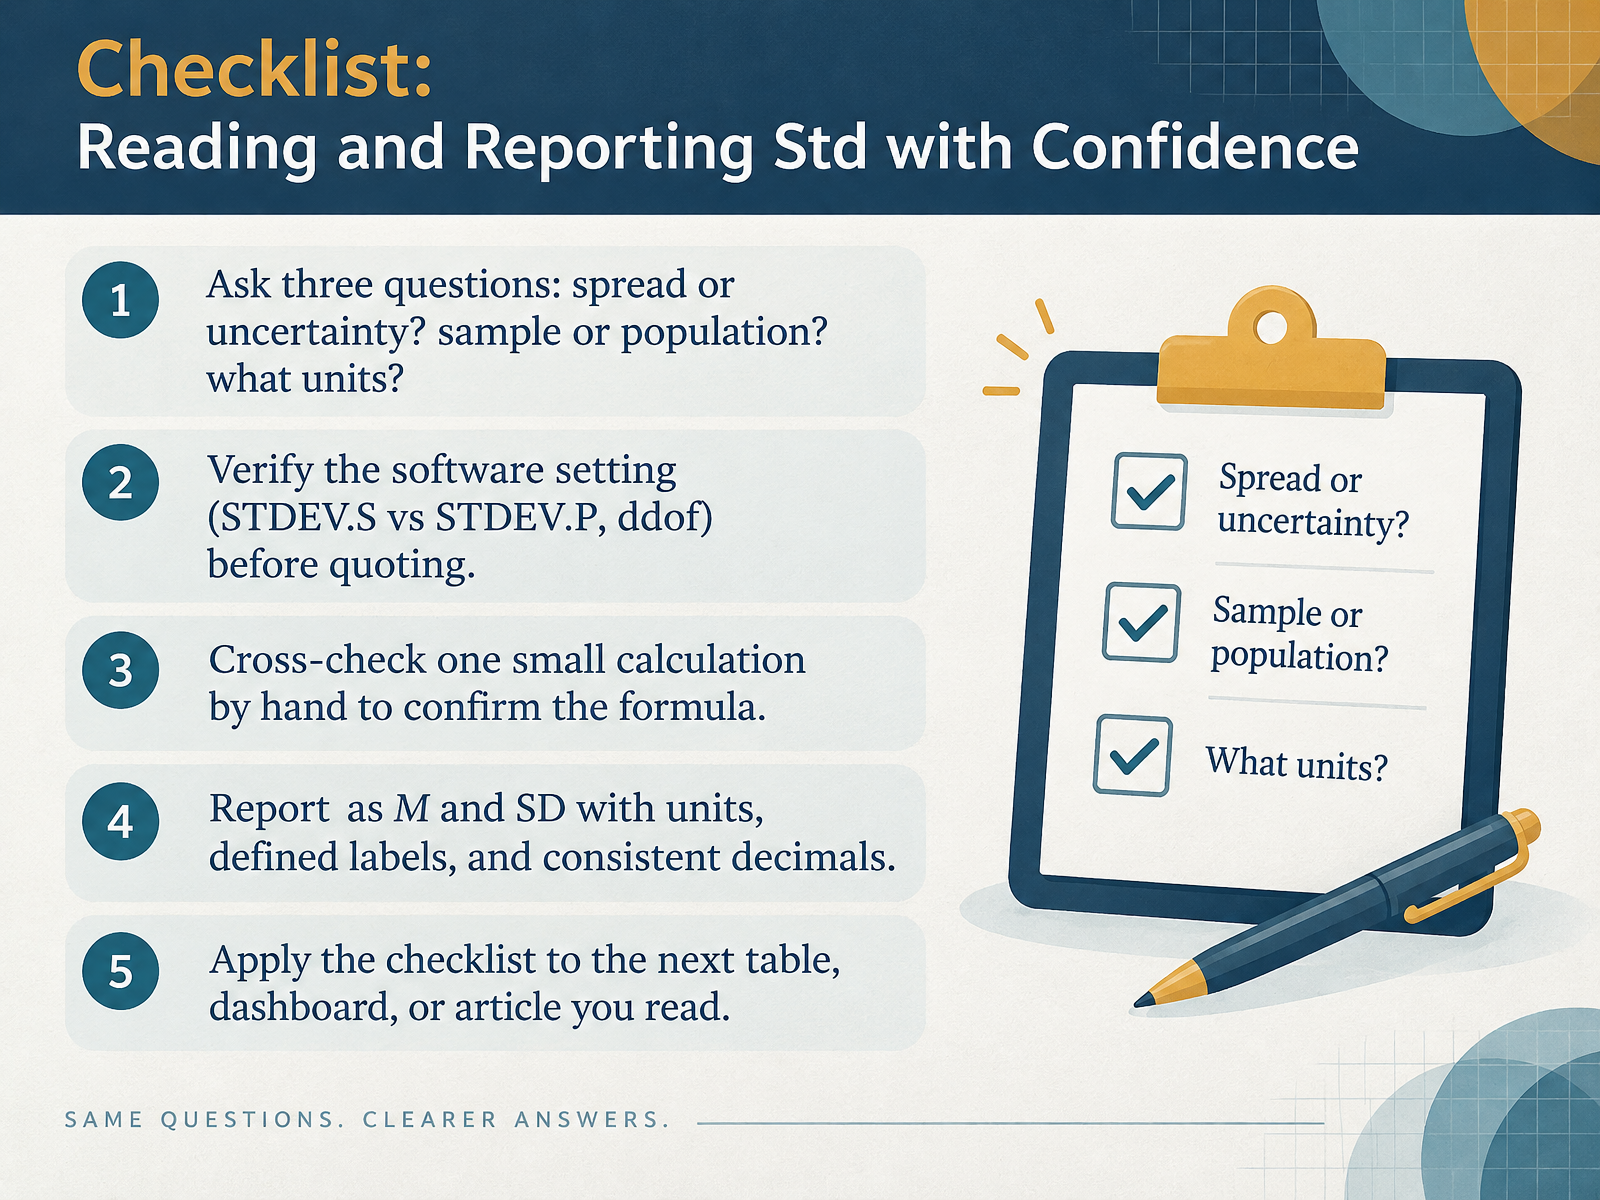
- 13Checklist: Reading and Reporting Std with ConfidenceLet's turn everything into a checklist you can use. First, ask three questions about any standard deviation you see. Is this describing spread, or uncertainty? Is it based on a sample or a whole population? And what units does it carry? For example, a standard deviation of three points on a test means something very different from three centimeters in height. Second, check the software setting before you quote a number. In Excel, STDEV.S uses the sample formula, and STDEV.P uses the population formula. In pandas, the default ddof equals one, which is the sample version. In NumPy, the default is ddof equals zero, the population version. Third, cross-check one small calculation by hand to confirm the formula. Fourth, report your result as M and SD, with units, clear labels, and consistent decimals. Put it together: M equals 19.2 years, SD equals 3.5 years. Finally, apply this checklist to the next table, dashboard, or article you read, before you trust the numbers. In short, ask the three questions, verify the setting, spot-check the math, and report clearly. Next, we'll pull the key takeaways together in Key Takeaways and Quick Reference.
 apastyle.apa.orgowl.purdue.eduowl.purdue.edu+22 min
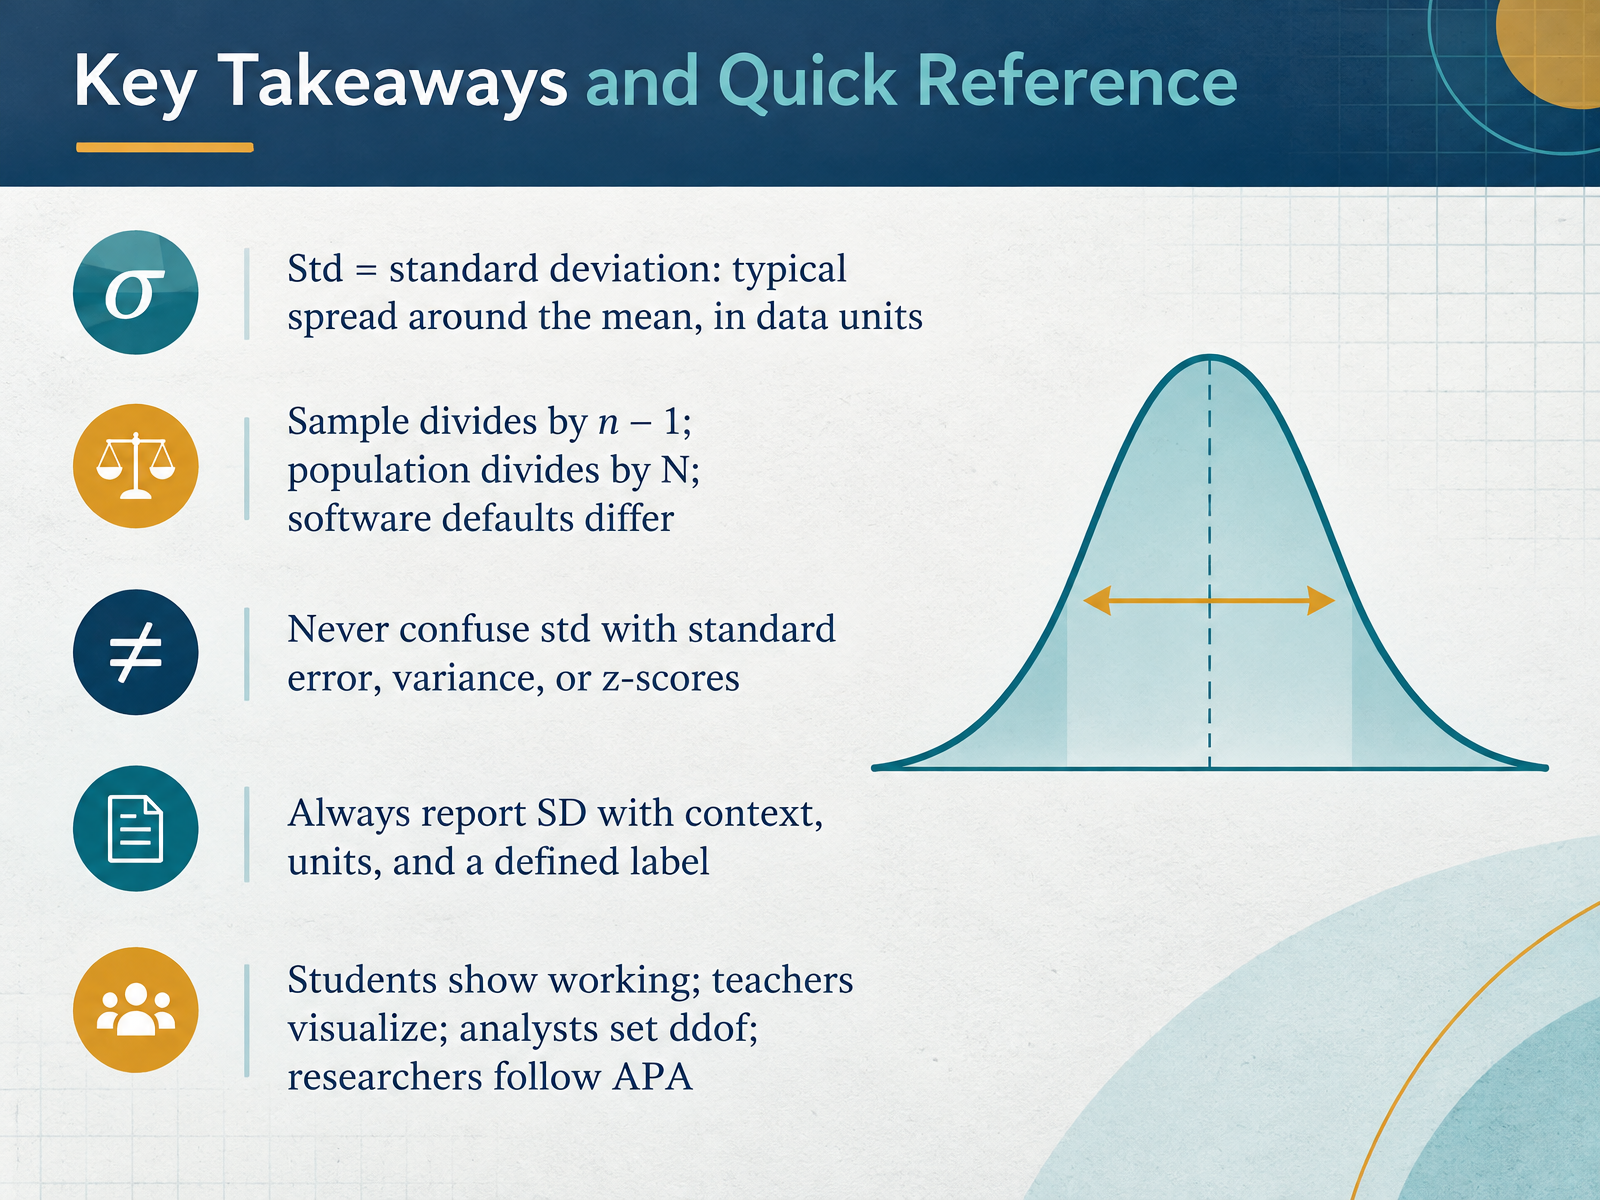
- 14Key Takeaways and Quick ReferenceLet's bring everything together with a quick reference you can carry into your own work. Standard deviation, often written S D, measures the typical spread around the mean, in the same units as your data. Sample formulas divide by n minus one. Population formulas divide by capital N. And software defaults differ, so check them. Never confuse standard deviation with standard error, variance, or z-scores. They answer different questions. Always report S D with context, units, and a clear label, for example, M equals 136.4 centimeters, with S D equal to 15.1. Students, show your working. Teachers, visualize the spread. Analysts, set ddof explicitly. Researchers, follow A P A style. Thank you for following along. Use these takeaways, keep checking your software defaults, and report your spread with confidence. You are ready to read and share standard deviation results clearly.
 apastyle.apa.orgowl.purdue.eduowl.purdue.edu+22 min
Take the deck with you
Download this course as a file — free, no sign-up needed.
- PDF handoutEvery slide page, ready to print or share.15 pages · 4.0 MBDownload
- Narrated PowerPointThe deck that presents itself — every slide carries the digital human's narration video.15 pages · 14.7 MBDownload
- PowerPoint slidesThe full deck as a .pptx — open it in PowerPoint, Keynote, or Google Slides.15 pages · 3.9 MBDownload
Free to use in your own training — please keep the PersonWise credit page at the end.
Have your own deck? Turn it into a course
Sources consulted
Web sources consulted while building this course.
- Descriptive statistics using the summarize command | Stata Annotated Output — stats.oarc.ucla.edu
- Interpret all statistics and graphs for 1-Sample t - Minitab — support.minitab.com
- Descriptive Statistics | NCSS Statistical Analysis & Graphics Software — ncss.com
- Stat Help — statcrunch.pearsoncmg.com
- Standard deviation — en.wikipedia.org
- pandas.DataFrame.std — pandas 3.1.0 documentation — pandas.pydata.org
- STDEV.S function — support.microsoft.com
- R: Standard Deviation — search.r-project.org
- STDEV.P function | Microsoft Support — support.microsoft.com
- Pandas variance and Standard deviation result differing with manual calculation — stackoverflow.com
- Number and Statistics Guide, APA Style 7th Edition — apastyle.apa.org
- Numbers and Statistics - Purdue OWL — owl.purdue.edu
- Statistics in APA - Purdue OWL® - Purdue University — owl.purdue.edu
- Reporting Statistics in APA Style — bpb-us-e2.wpmucdn.com
- Sample tables - APA Style - American Psychological Association — apastyle.apa.org