Begin
14 pages · ~28 min
Measuring Generative AI Outcomes
A training for professionals on measuring the outcomes and impact of generative AI initiatives, covering key metrics and evaluation methods.
A digital instructor presents all 14 pages. Hold “Ask” at any point and ask out loud — the answer comes from this course. No sign-up needed.
What you’ll learn
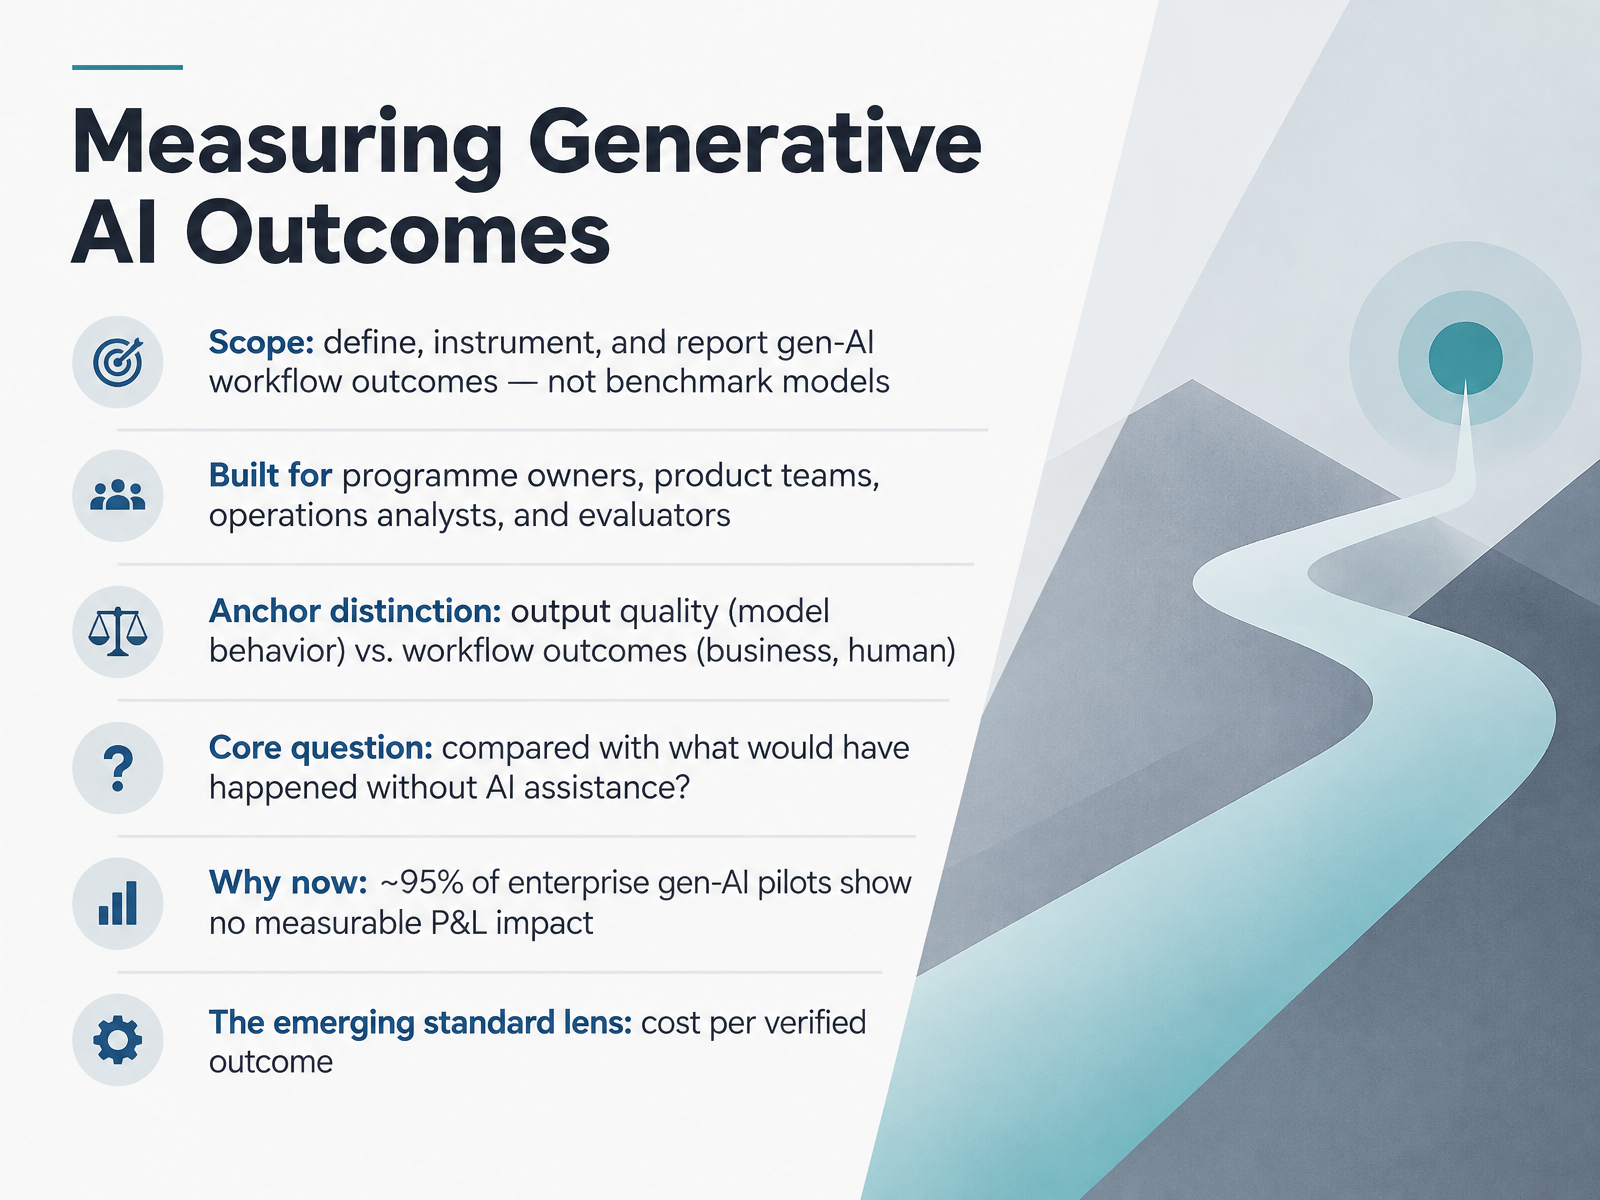
- 01Measuring Generative AI OutcomesWelcome. This course is about measuring generative AI outcomes, and our focus is deliberately narrow. We are not benchmarking models. We are defining, instrumenting, and reporting what happens to real workflows once AI assistance enters them. This is built for programme owners, product teams, operations analysts, and evaluators. The anchor distinction is this: output quality describes model behaviour, while workflow outcomes describe business and human results. The core question is simple and uncomfortable. Compared with what would have happened without AI assistance? That counterfactual is the whole game. Why now? Independent field research suggests roughly ninety five percent of enterprise gen AI pilots show no measurable profit and loss impact. The emerging standard lens is cost per verified outcome. Every dollar traced to a verified result, workflow by workflow. Next, why outcome measurement differs from model evaluation.aws.amazon.comcentreforaileadership.orgcapgemini.com+21 min
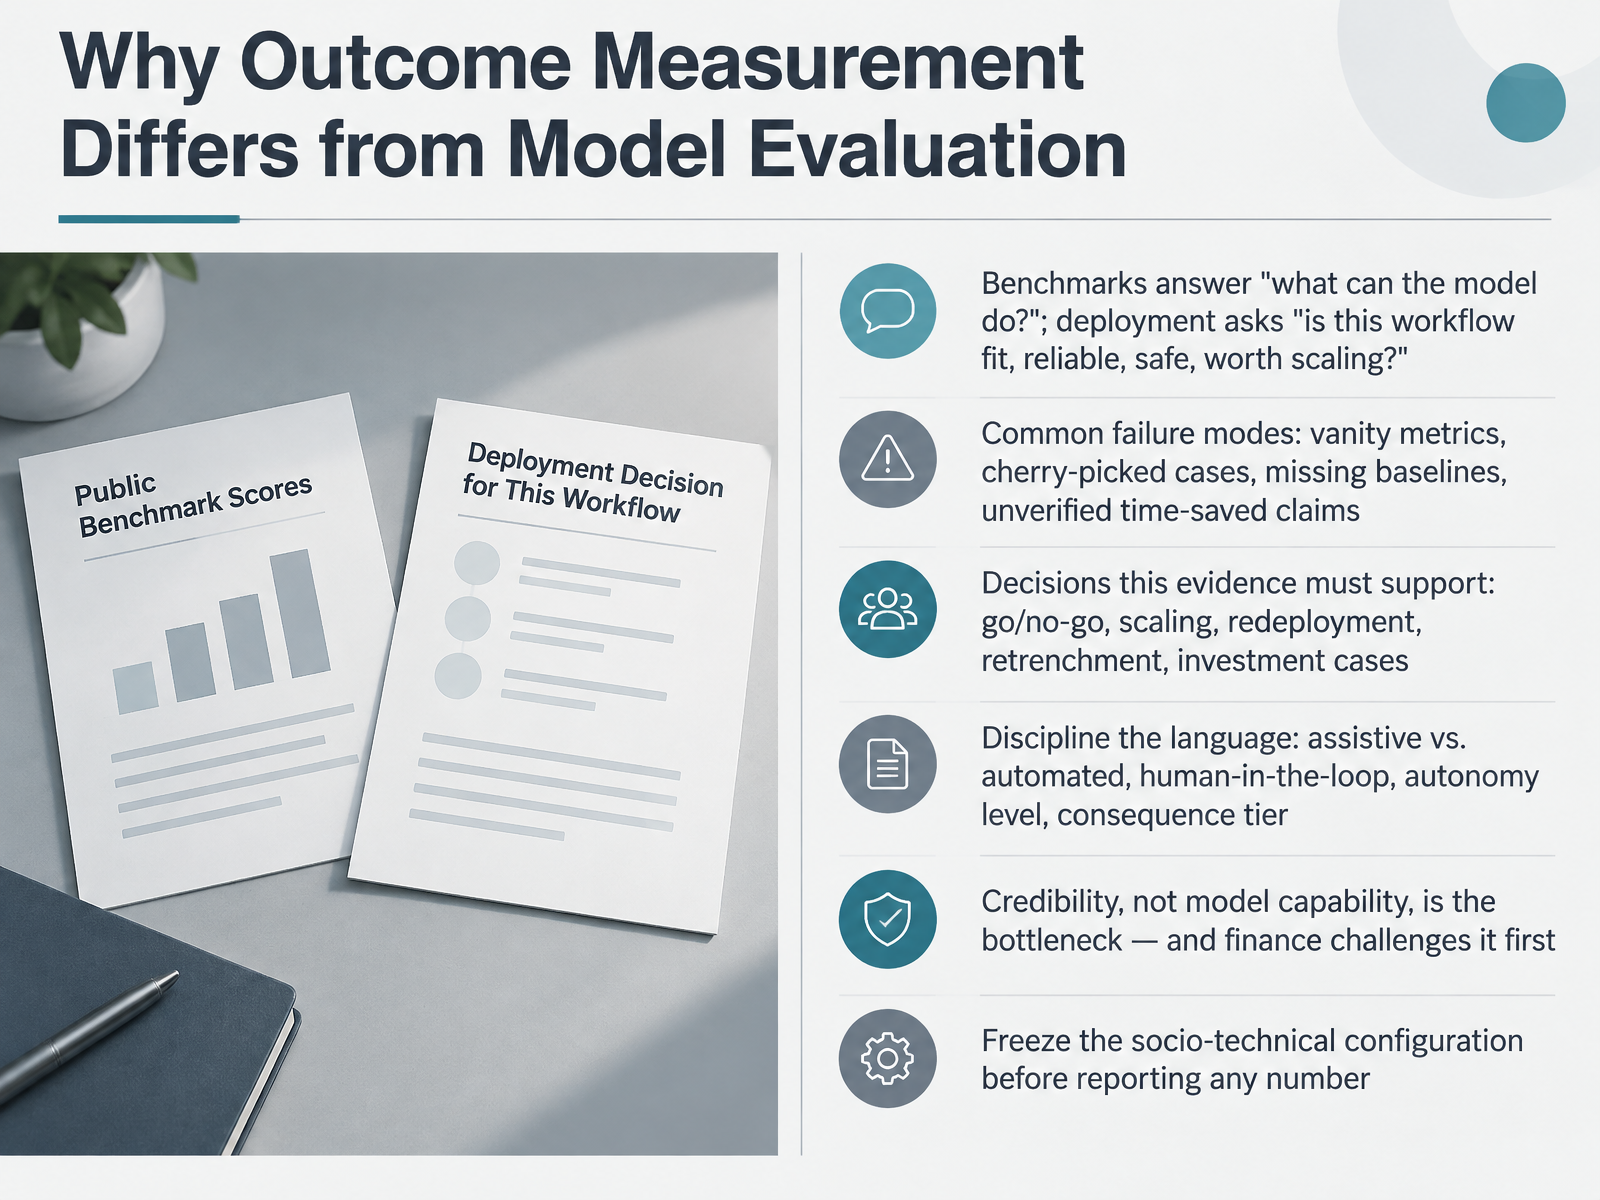
- 02Why Outcome Measurement Differs from Model EvaluationLet's talk about why outcome measurement differs from model evaluation. A benchmark answers a narrow question, what can the model do? Deployment asks a harder one, is this workflow fit, reliable, safe, and worth scaling? Those are not the same test.
Watch for common failure modes. Vanity metrics that look impressive but change no decision. Cherry-picked cases that hide the tail. Missing baselines, so no one can say what improved. And time-saved claims that were never verified against actual workflow data.
Your evidence has to support real decisions. Go or no-go. Scaling. Redeployment. Retrenchment. Investment cases. That means disciplining your language. Assistive versus automated. Human-in-the-loop. Autonomy level. Consequence tier. Ambiguity here costs you credibility, and finance will challenge it first.
So freeze the socio-technical configuration before you report any number. Same model, same prompts, same tools, same staffing, same task mix. Otherwise your results describe a moving target.
Next, let's map the outcome stack, from model behavior to business impact.
 2 min
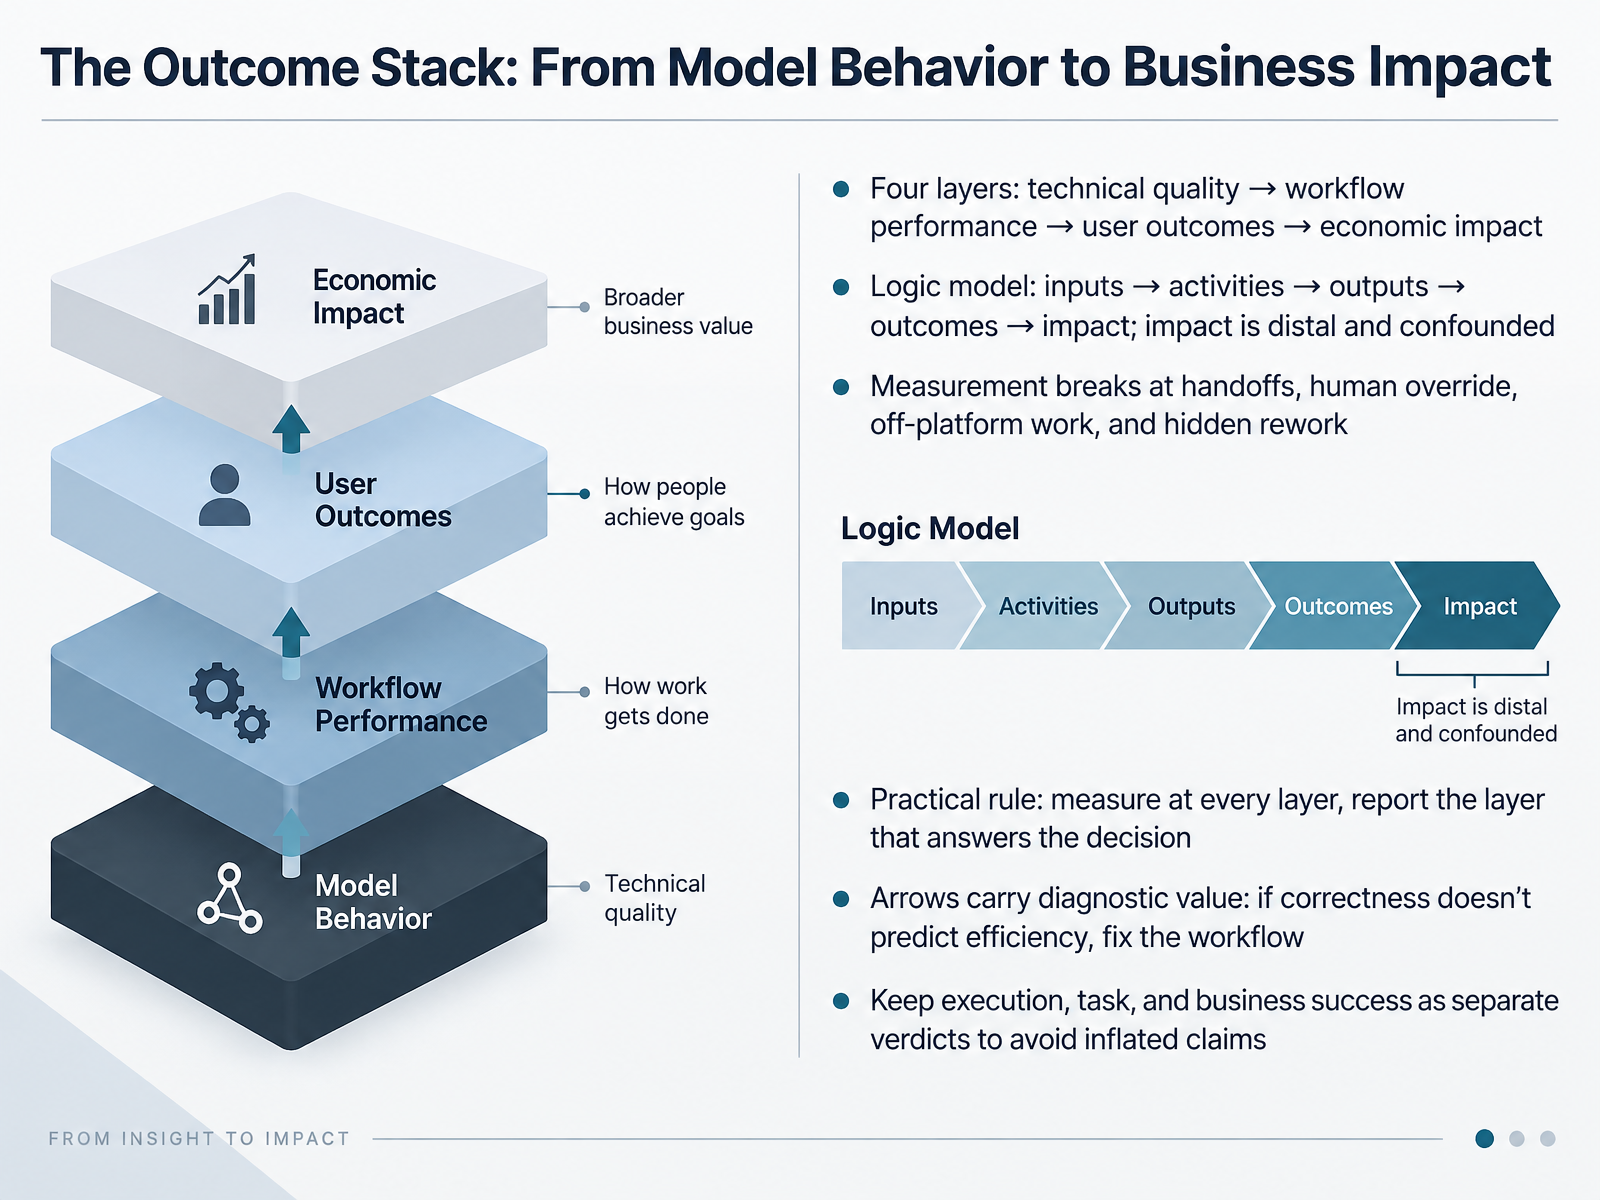
- 03The Outcome Stack: From Model Behavior to Business ImpactLet's look at where outcomes actually live. Think of a four-layer stack. At the bottom is technical quality: accuracy, latency, failure rates. Above it sits workflow performance: cycle time, rework, handoffs. Then user outcomes: what people decide or complete differently. And at the top, economic impact. The logic model runs inputs to activities to outputs to outcomes to impact, but impact is distal and heavily confounded, so attribution gets noisy fast. Measurement tends to break at four places: handoffs between roles, human override of model suggestions, work that moves off-platform, and hidden rework. A practical rule: measure at every layer, then report the layer that answers the decision in front of you. The arrows between layers carry diagnostic value. If correctness doesn't predict efficiency, the problem is usually the workflow, not the model. Keep execution success, task success, and business success as separate verdicts, or you'll inflate the claim. Next, we move into framing outcomes and designing the counterfactual.
 2 min
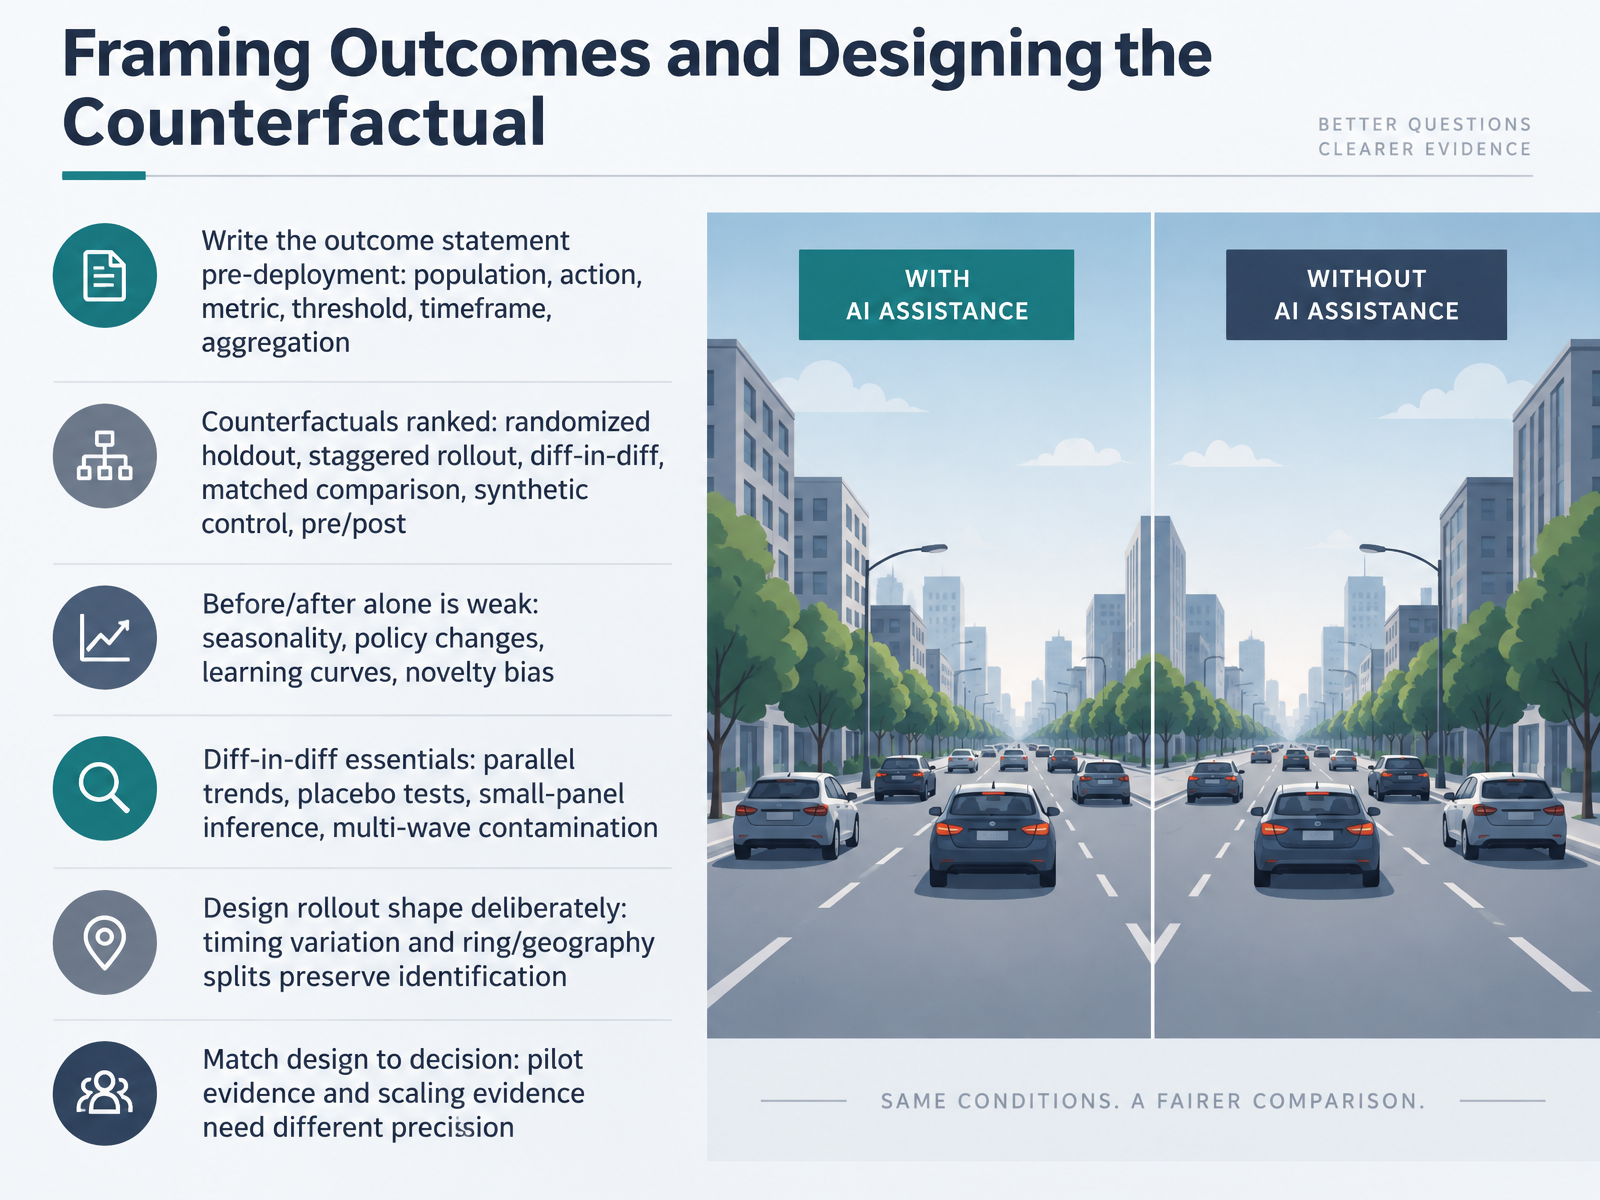
- 04Framing Outcomes and Designing the CounterfactualLet's talk about how to frame outcomes and design the counterfactual before anything ships. Write the outcome statement pre-deployment, and be specific about six things: population, action, metric, threshold, timeframe, and aggregation. For example, not just reduce handling time, but reduce median handling time for tier-two support agents by fifteen percent within ninety days, aggregated per agent. That level of precision determines what you can actually test.
Counterfactuals rank by strength. Randomized holdout first, then staggered rollout, difference-in-differences, matched comparison, synthetic control, and pre-post last. Before-and-after alone is weak because seasonality, policy changes, learning curves, and novelty bias all contaminate it.
If you use difference-in-differences, check parallel trends, run placebo tests, handle small-panel inference, and watch for multi-wave contamination. And design the rollout shape deliberately. Timing variation and ring or geography splits preserve identification.
Finally, match the design to the decision. Pilot evidence and scaling evidence need different precision, so decide what you need to prove before you choose the method.
Next, we'll look at metrics architecture and the tiered scorecard.
 2 min
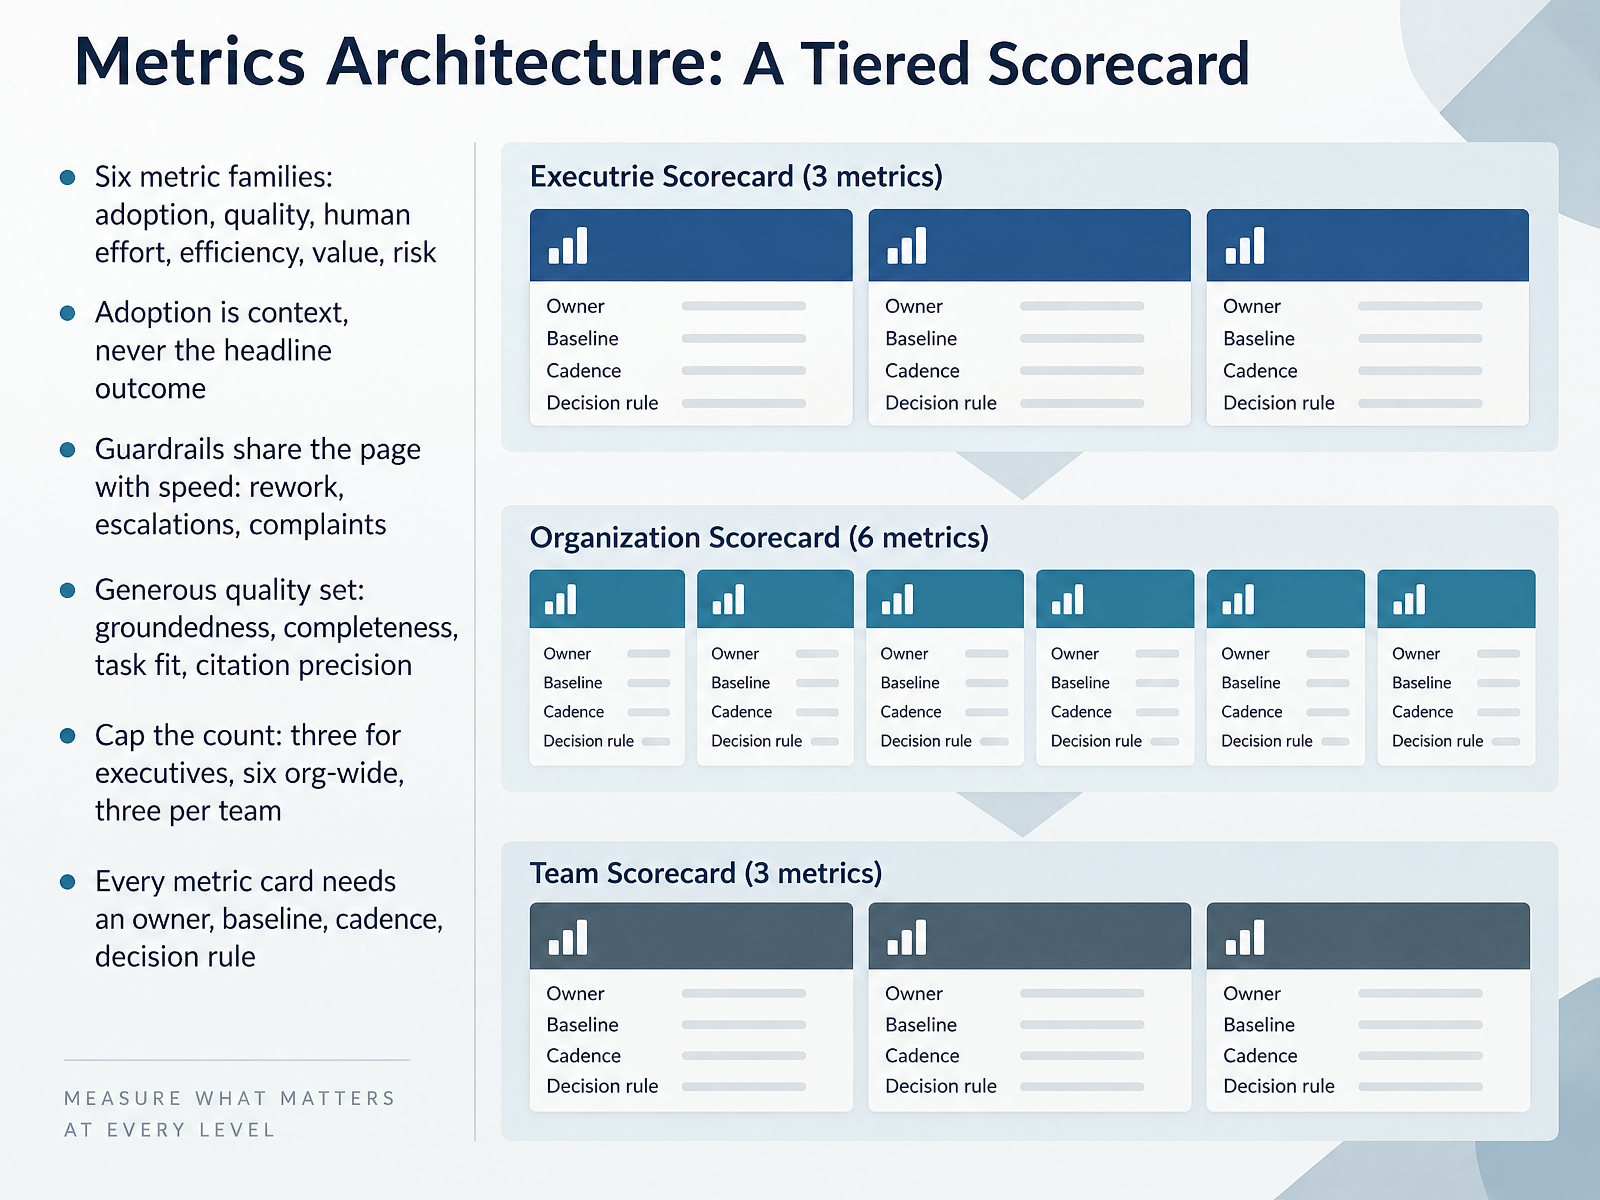
- 05Metrics Architecture: A Tiered ScorecardLet's move on to the metrics architecture, a tiered scorecard. We group measurement into six families: adoption, quality, human effort, efficiency, value, and risk. Adoption tells you the context, who is using the tool and how often, but it is never the headline outcome. It is a leading indicator, not proof of impact. Guardrails share the page with speed. Track rework, escalations, and complaints alongside your throughput gains. For quality, go generous. Groundedness, completeness, task fit, and citation precision each catch different failure modes. Then cap the count. Three metrics for executives, six organization-wide, and three per team. For example, a support team might track resolution time, first-contact quality, and escalation rate. Every metric card needs an owner, a baseline, a cadence, and a decision rule. Without a decision rule, the metric just sits there. With one, you know what action to take when the number moves. Baselines keep you honest, because AI gains are easy to overstate in noisy data. Next, we look at work units, cost per outcome, and unit economics.
 2 min
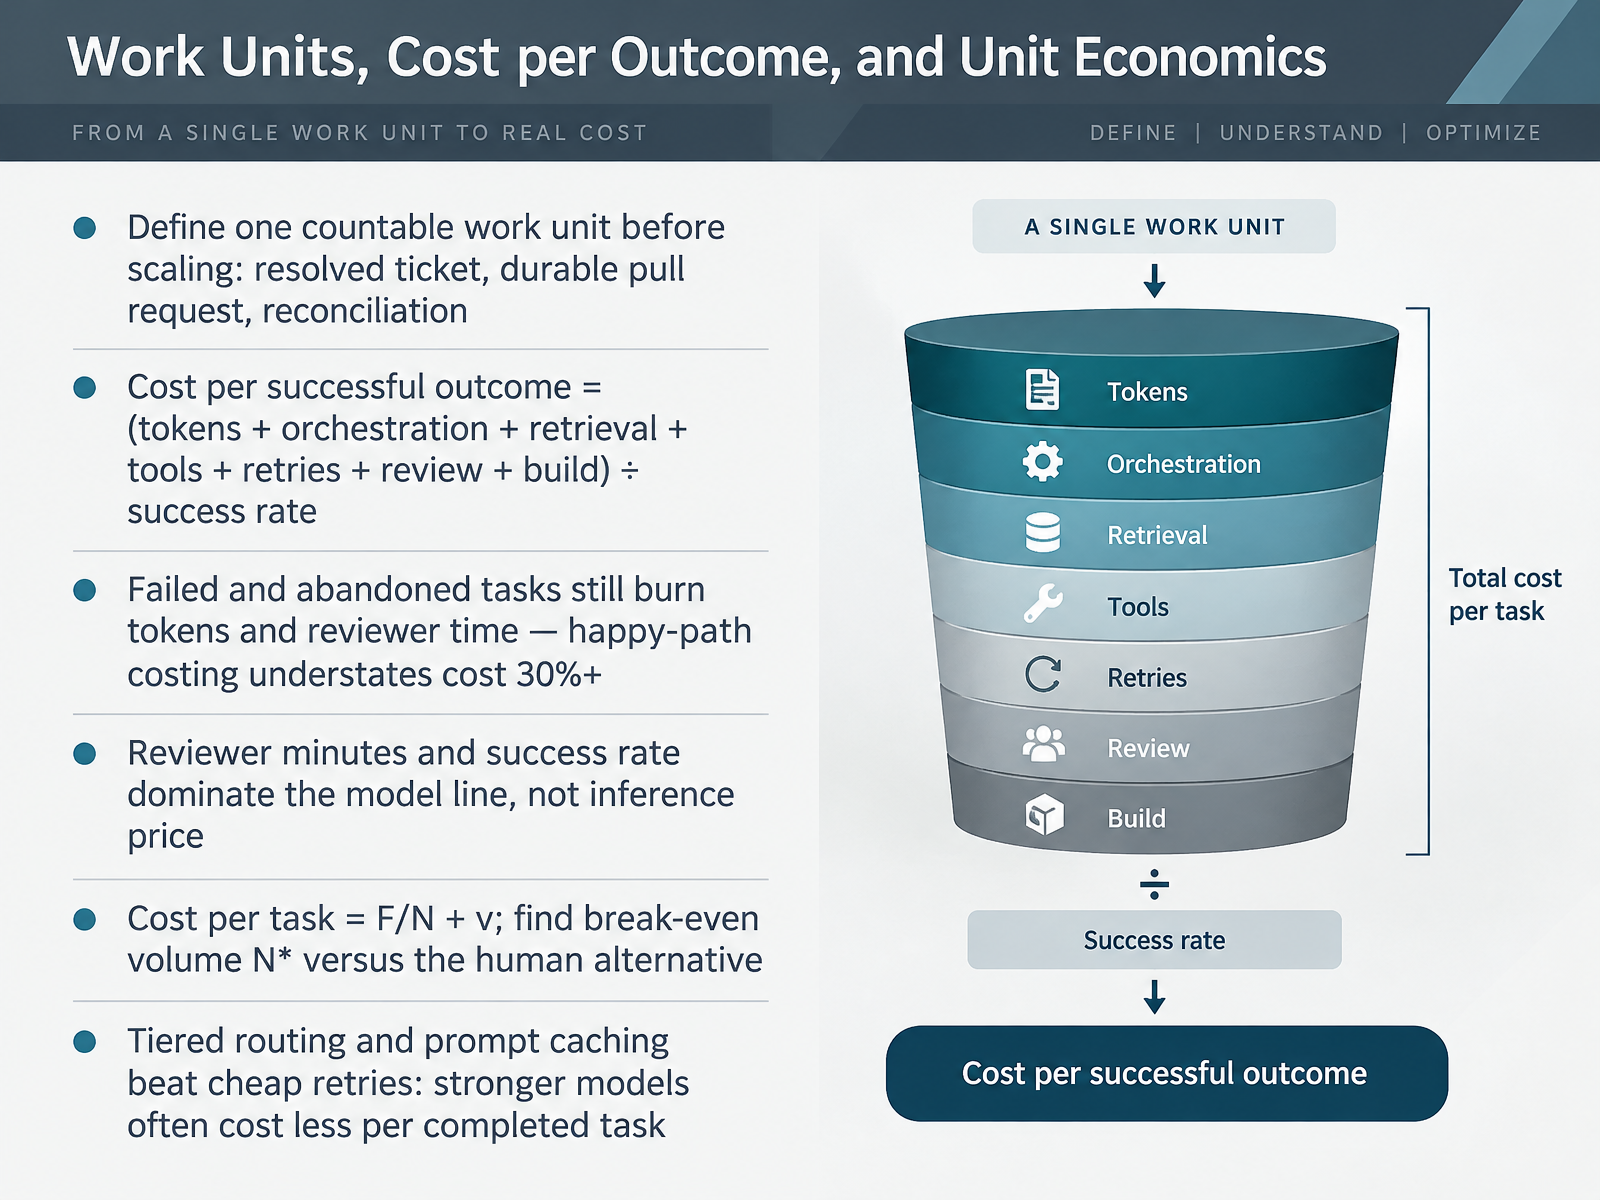
- 06Work Units, Cost per Outcome, and Unit EconomicsNow let's talk about the unit economics that make or break an AI programme. Before you scale anything, define one countable work unit. It could be a resolved ticket, a durable pull request, or a completed reconciliation. Without that definition, every cost conversation drifts. Cost per successful outcome equals the sum of tokens, orchestration, retrieval, tools, retries, review, and build, divided by your success rate. And here's the part teams miss: failed and abandoned tasks still burn tokens and reviewer time. Happy-path costing understates real cost by thirty percent or more. In practice, reviewer minutes and success rate dominate the model line, not inference price. So think of cost per task as fixed platform cost divided by volume, plus variable cost per task. That lets you find your break-even volume versus the human alternative. One practical lever: tiered routing and prompt caching beat cheap retries, because stronger models often cost less per completed task. That sets up our next topic: measurement methods and evidence quality.
 2 min
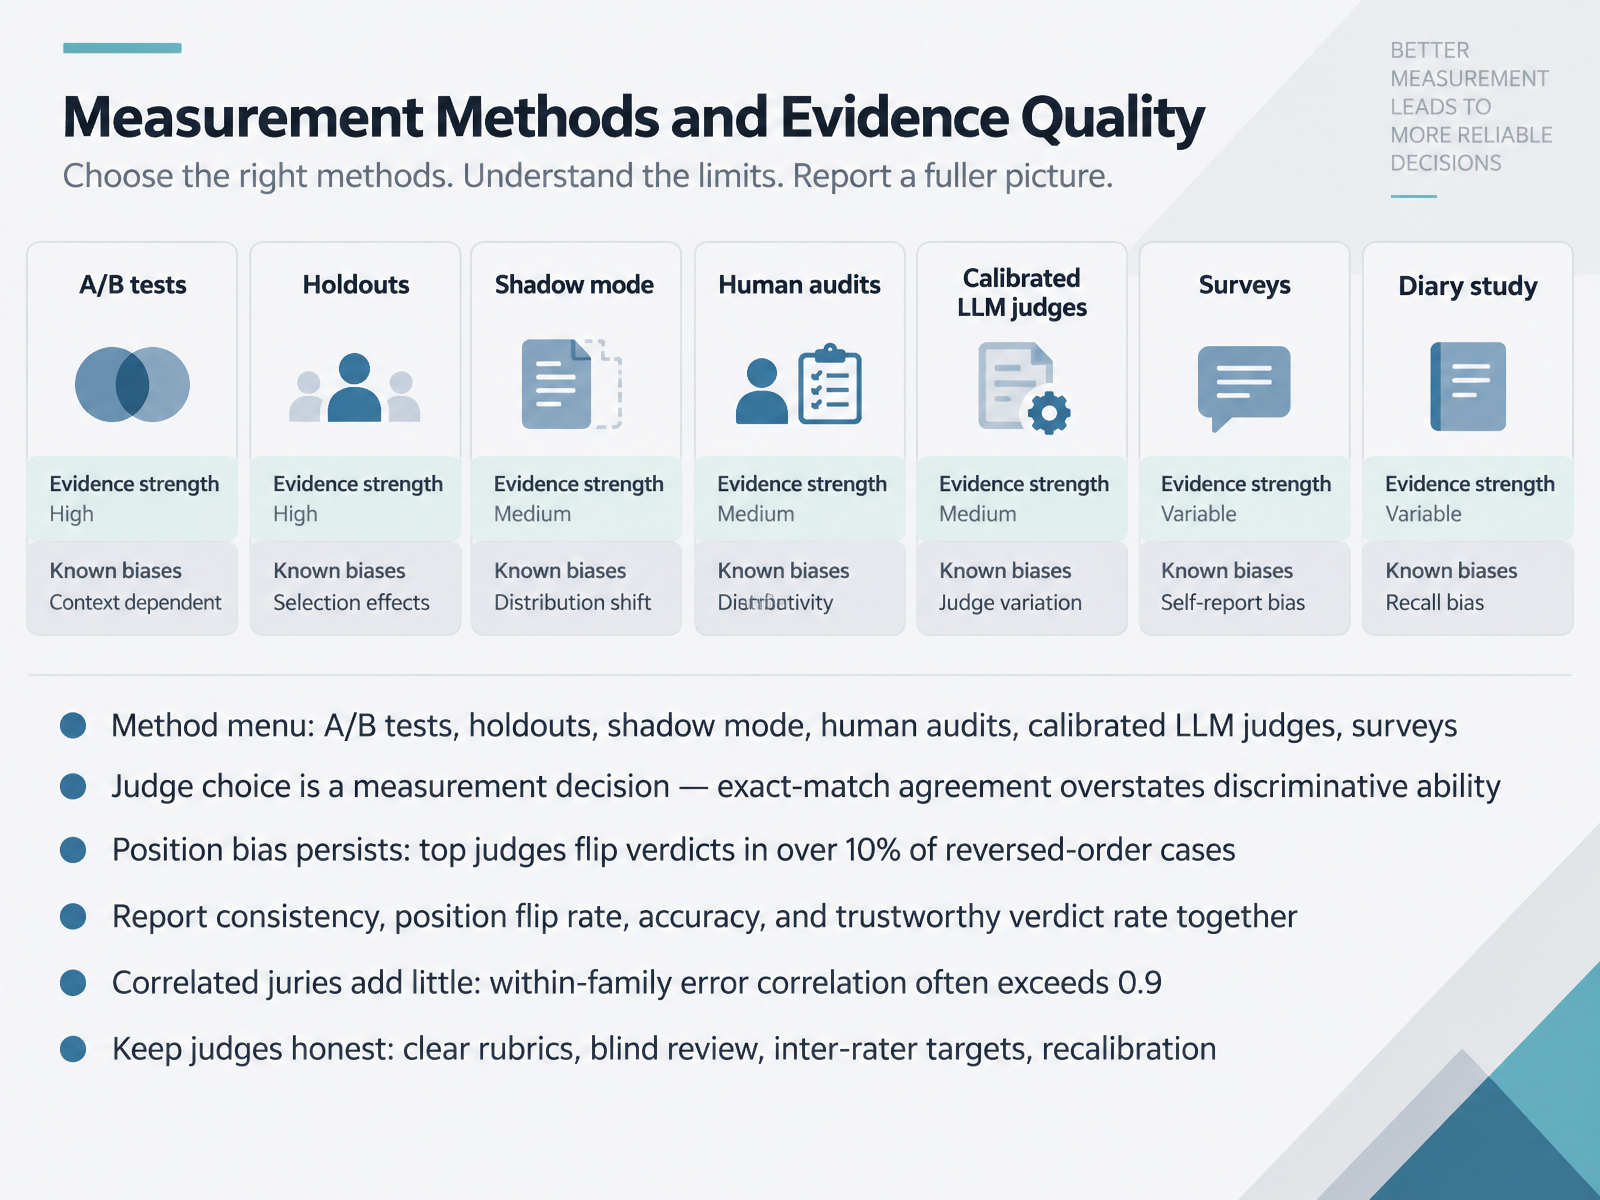
- 07Measurement Methods and Evidence QualityLet's turn to measurement methods and how to judge the quality of your evidence. You have a menu to work from. A B tests, holdouts, shadow mode, human audits, calibrated large language model judges, and surveys. Each answers a different question, so match the method to the decision you need to make. Now, judge choice is itself a measurement decision. If you validate a judge using exact match agreement, you will overstate its discriminative ability. Order matters too. Position bias persists, and top judges can flip verdicts in more than ten percent of reversed order cases. So report several numbers together. Consistency, position flip rate, accuracy, and trustworthy verdict rate. Be cautious about stacking many judges. If their errors are correlated within the same model family, with correlation often above zero point nine, the jury adds little. Keep judges honest with clear rubrics, blind review, inter rater targets, and regular recalibration. Next, we look at instrumentation and data readiness.
 1 min
- 08Instrumentation and Data ReadinessLet's turn to instrumentation and data readiness, because measurement only works when the data underneath it is trustworthy.
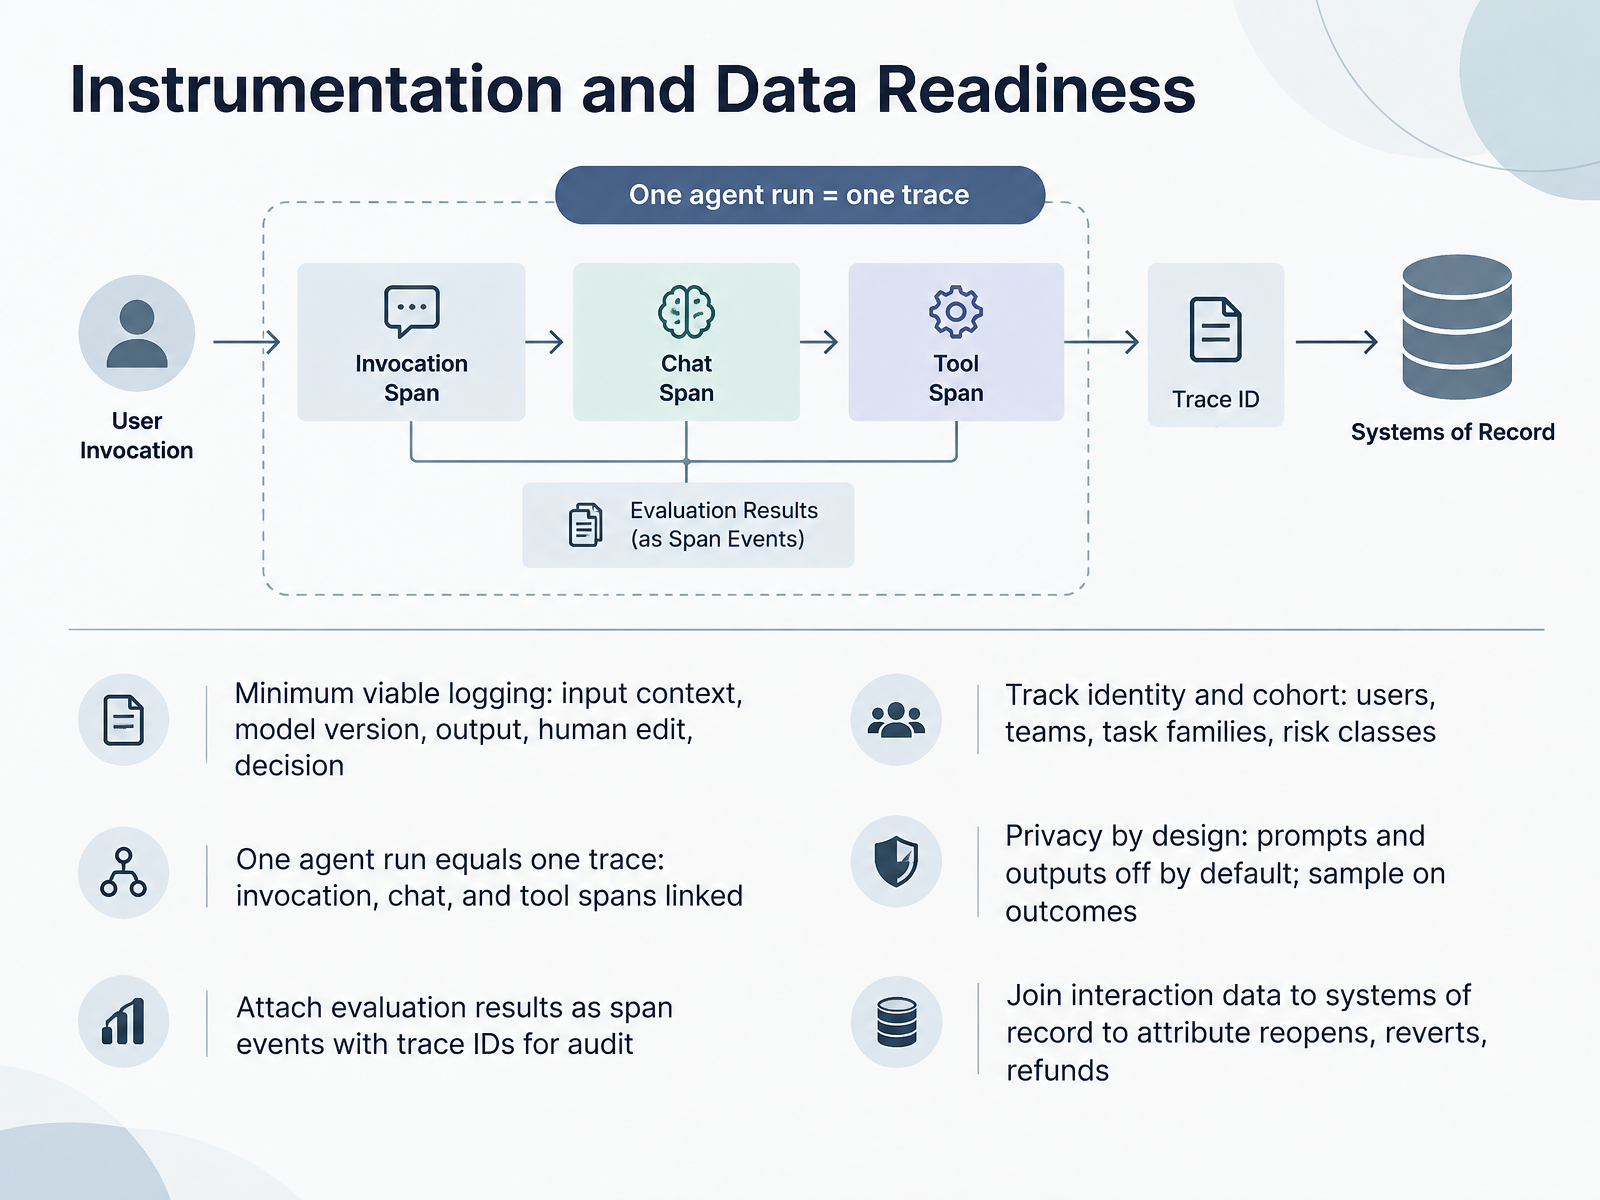
Start with minimum viable logging. For every interaction, capture the input context, the model version, the output, any human edits, and the final decision. That set lets you reconstruct what the system saw, what it produced, and what a person changed. One agent run should equal one trace, with invocation, chat, and tool spans linked, so a single identifier connects the whole chain of reasoning and action.
Attach evaluation results as span events, tied to those trace IDs, so scores and judgments stay auditable. Track identity and cohort as well: users, teams, task families, and risk classes. A workflow with high volume and low stakes needs different scrutiny than a low volume, high risk one.
Apply privacy by design. Keep prompts and outputs off by default, and sample on outcomes instead. Finally, join interaction data to systems of record to attribute downstream effects like reopens, reverts, and refunds. Noisy joins are normal, so document where attribution is weak.
With traces, cohorts, and downstream joins in place, you have a foundation for the next question: cost, productivity, and value realization.
 2 min
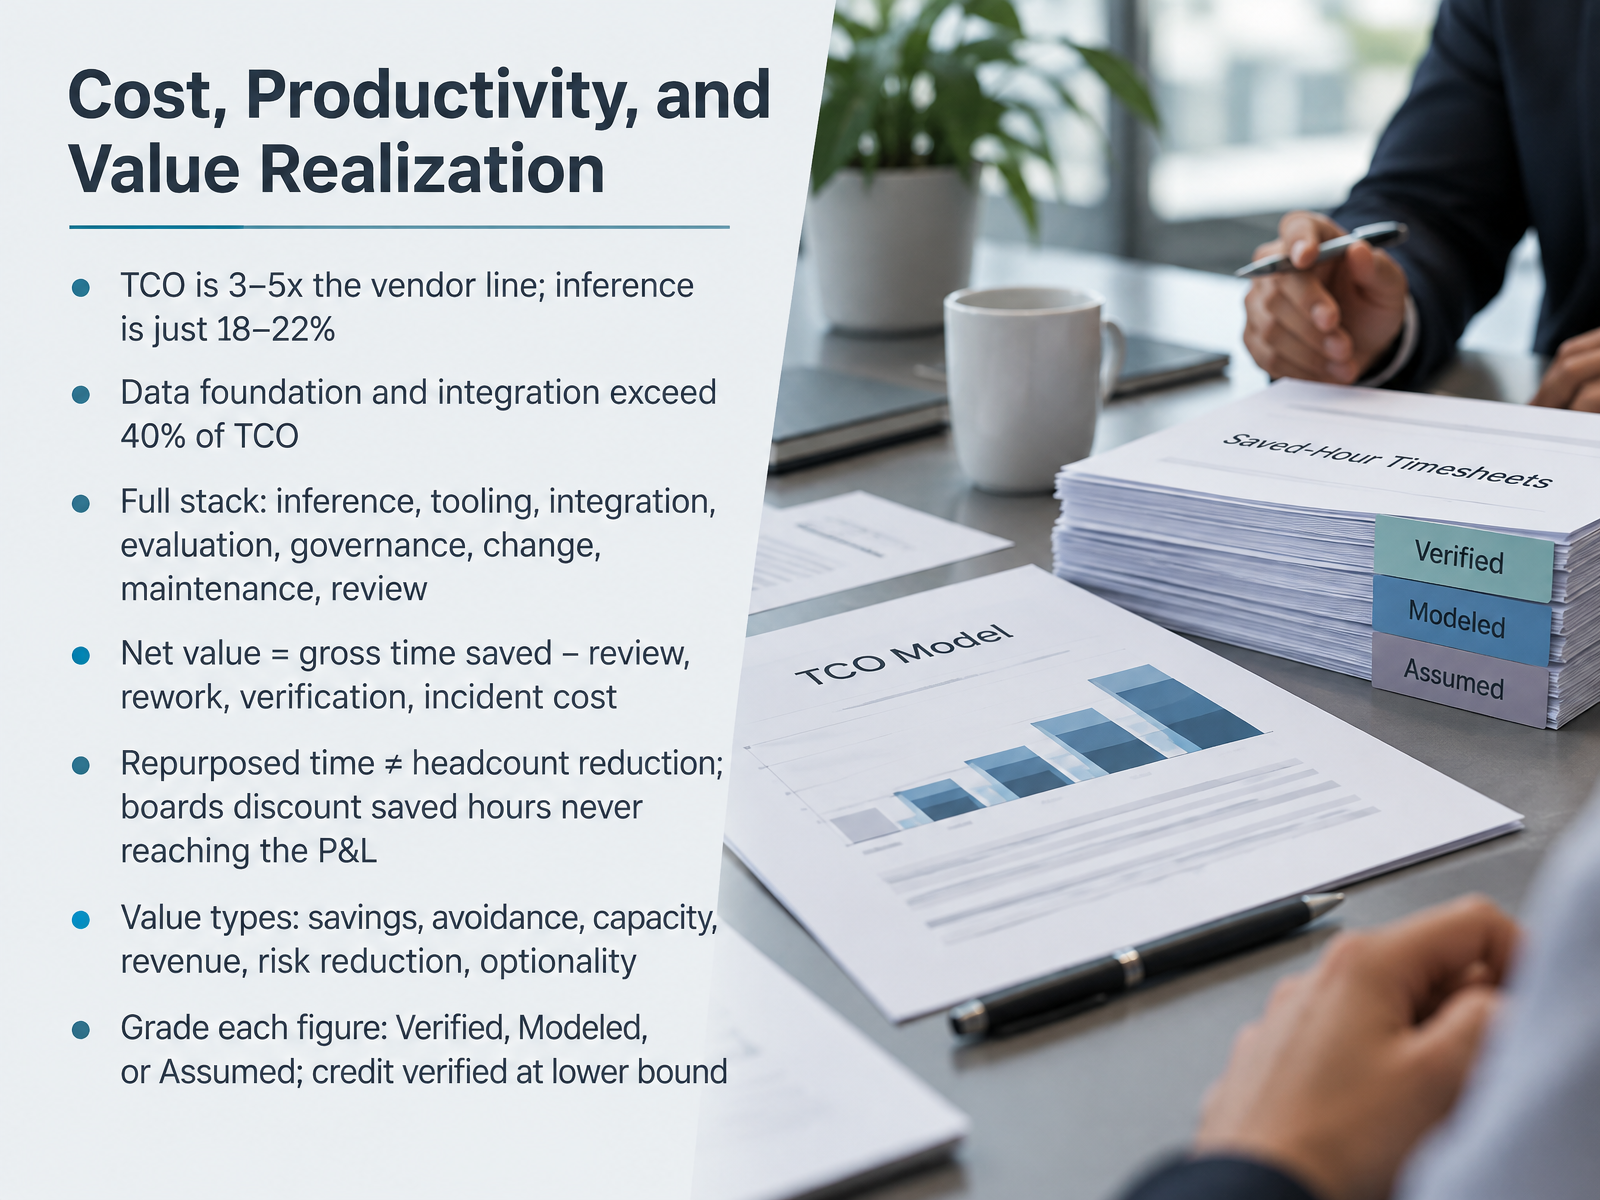
- 09Cost, Productivity, and Value RealizationLet's turn to cost, productivity, and value realization. Start with total cost of ownership. Vendor pricing is rarely the whole story. In practice, TCO runs three to five times the vendor line, and inference is only about eighteen to twenty-two percent of it. Data foundation and integration typically exceed forty percent. So build your model across the full stack: inference, tooling, integration, evaluation, governance, change management, maintenance, and human review.
Now, net value. Gross time saved is not the number you report. Net value equals gross time saved minus review, rework, verification, and incident cost. That subtraction is where programs live or die.
Also, be precise about repurposed time. It is not headcount reduction. Boards discount saved hours that never reach the P and L. So classify value honestly: savings, avoidance, capacity, revenue, risk reduction, and optionality. Then grade every figure as Verified, Modeled, or Assumed, and credit verified values at the lower bound.
Here is the takeaway. Measure the full stack, subtract the friction, and label your evidence. That keeps your business case credible. Next, we move to human factors, trust, and workforce outcomes.
 2 min
- 10Human Factors, Trust, and Workforce OutcomesLet's turn to human factors, trust, and workforce outcomes. These effects are harder to quantify than latency or accuracy, but they often determine whether an AI workflow actually holds up in production.
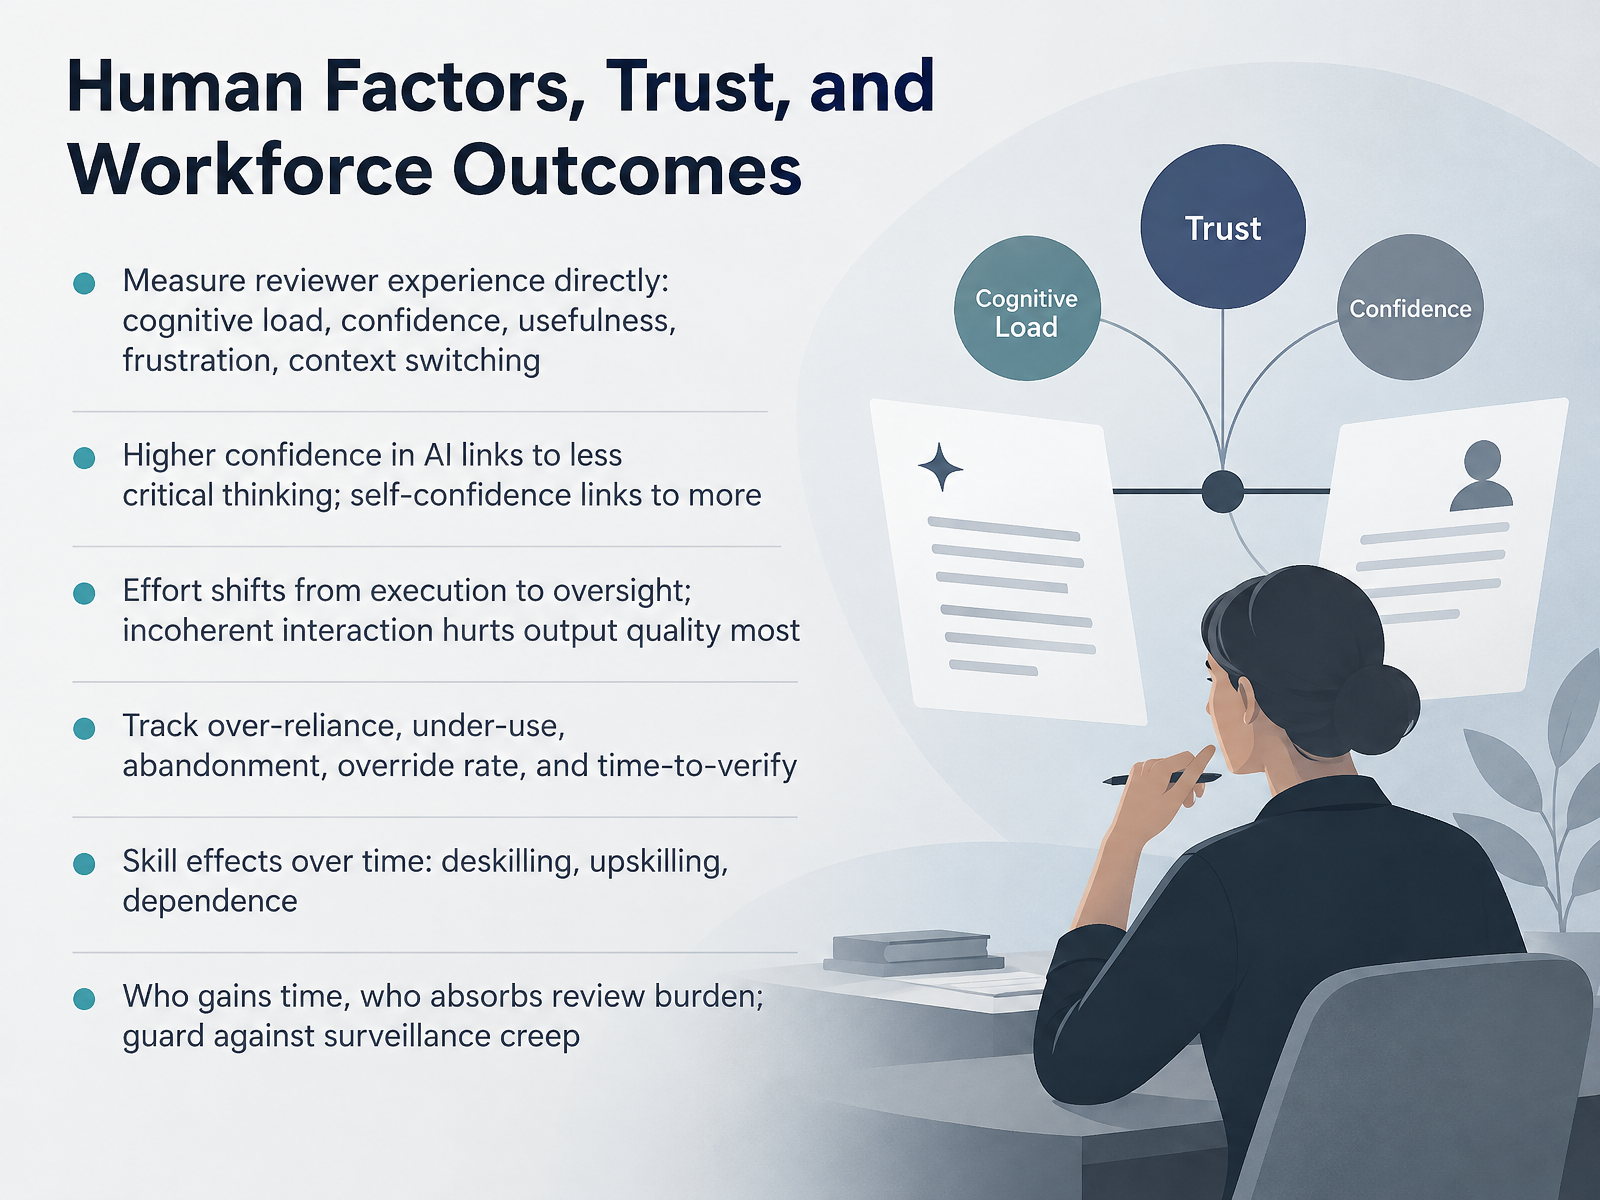
Start by measuring reviewer experience directly. Cognitive load, confidence in the output, perceived usefulness, frustration, and context switching. A short survey after each review session can capture these cheaply and consistently.
Watch the trust dynamic carefully. Higher confidence in the AI tends to correlate with less critical thinking. Higher confidence in one's own judgment links to more. So track over-reliance, under-use, abandonment, override rate, and time-to-verify.
As effort shifts from execution to oversight, incoherent interaction patterns hurt output quality more than raw model errors. Also monitor skill effects over time: deskilling, upskilling, and dependence. And be deliberate about who gains time and who absorbs the review burden. Guard against surveillance creep.
Next, we'll look at reporting, review cadence, and decision rituals.
 2 min
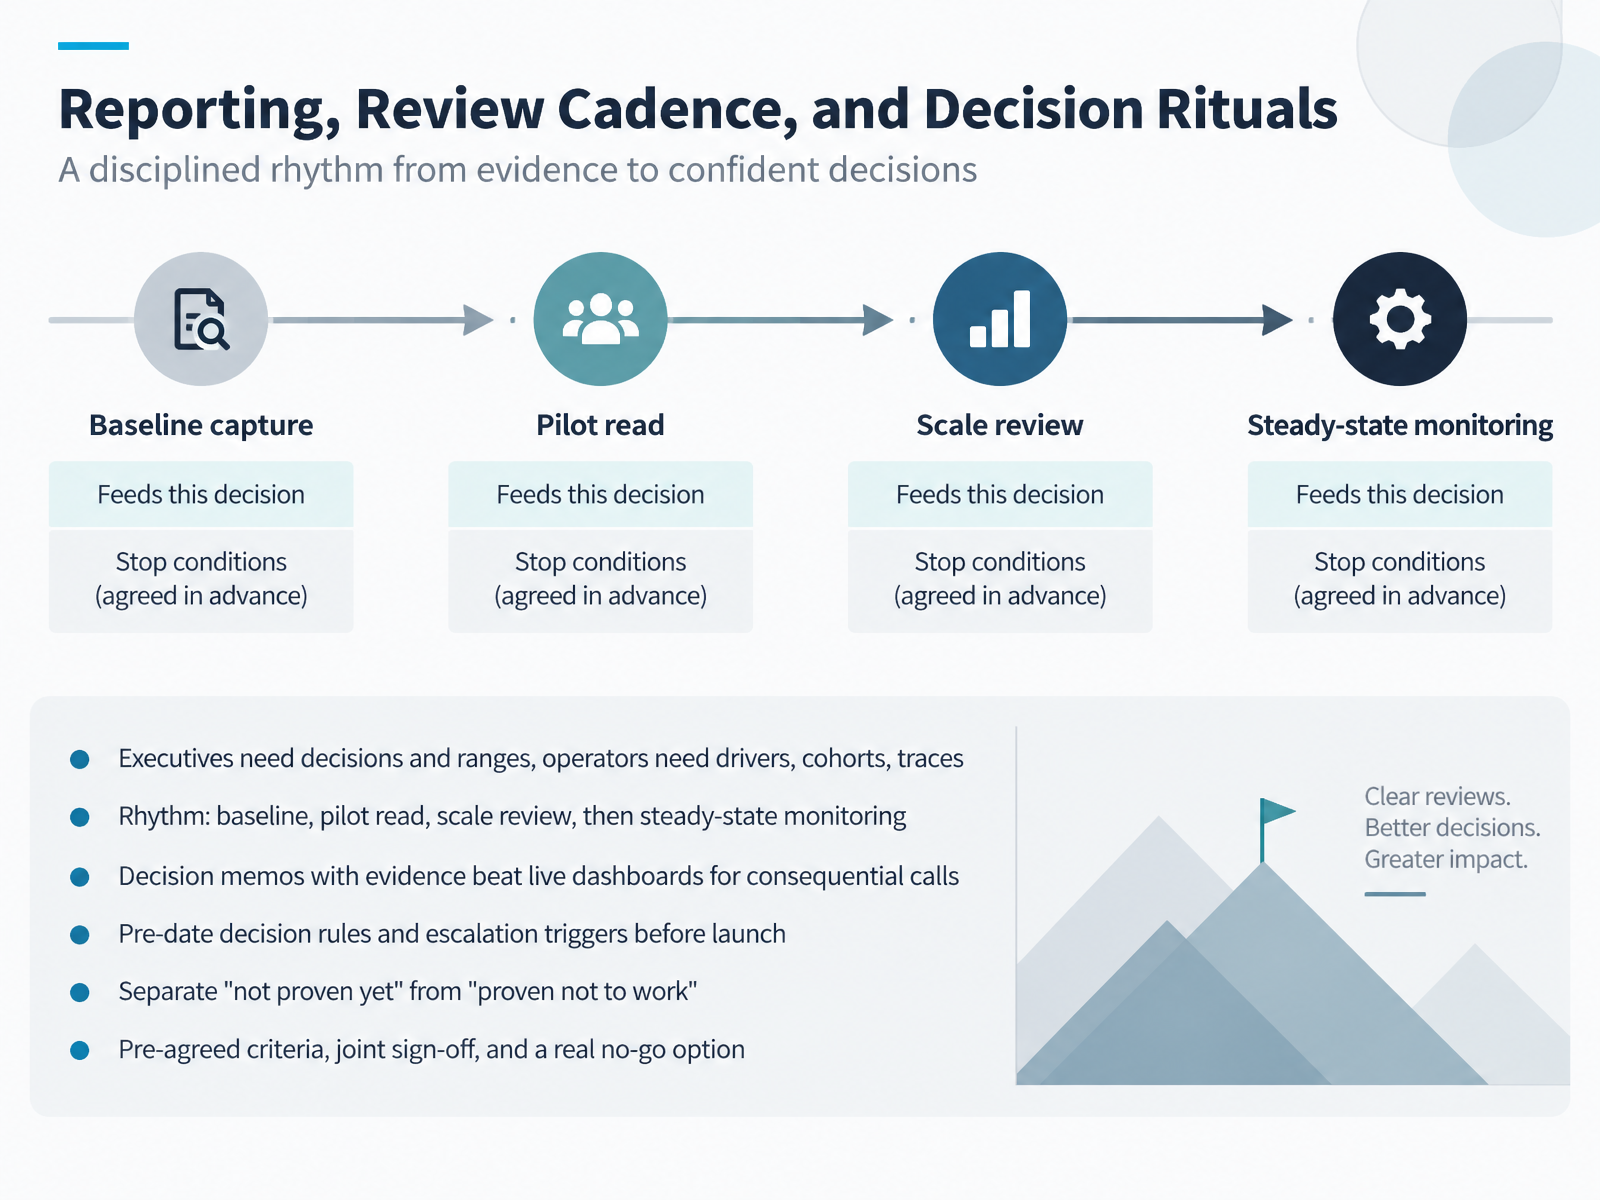
- 11Reporting, Review Cadence, and Decision RitualsLet's talk about how measurement actually gets used. Start with your audience. Executives want a decision and a confidence range, not a dashboard tour. Operators need the mechanics: drivers, cohorts, and traces they can act on. The same pilot read can serve both, but only if you shape the output for each group.
Then set the rhythm. Baseline, pilot read, scale review, and steady state monitoring. Keep those dates fixed, because cadence is what turns measurement into a habit rather than a one-off.
For consequential calls, a decision memo with evidence beats a live dashboard. A dashboard shows movement. A memo states the claim, the evidence, the range, and the recommendation. Live views are for monitoring, not for sign-off.
Before launch, predate your decision rules and escalation triggers. And keep two categories separate: not proven yet, versus proven not to work. That distinction decides whether you keep iterating or stop spending.
Close with pre-agreed criteria, joint sign-off across product and operations, and a real no-go option. If no-go was never viable, the review is theater.
Next, we'll look at drift, governance, and regulatory context.
 2 min
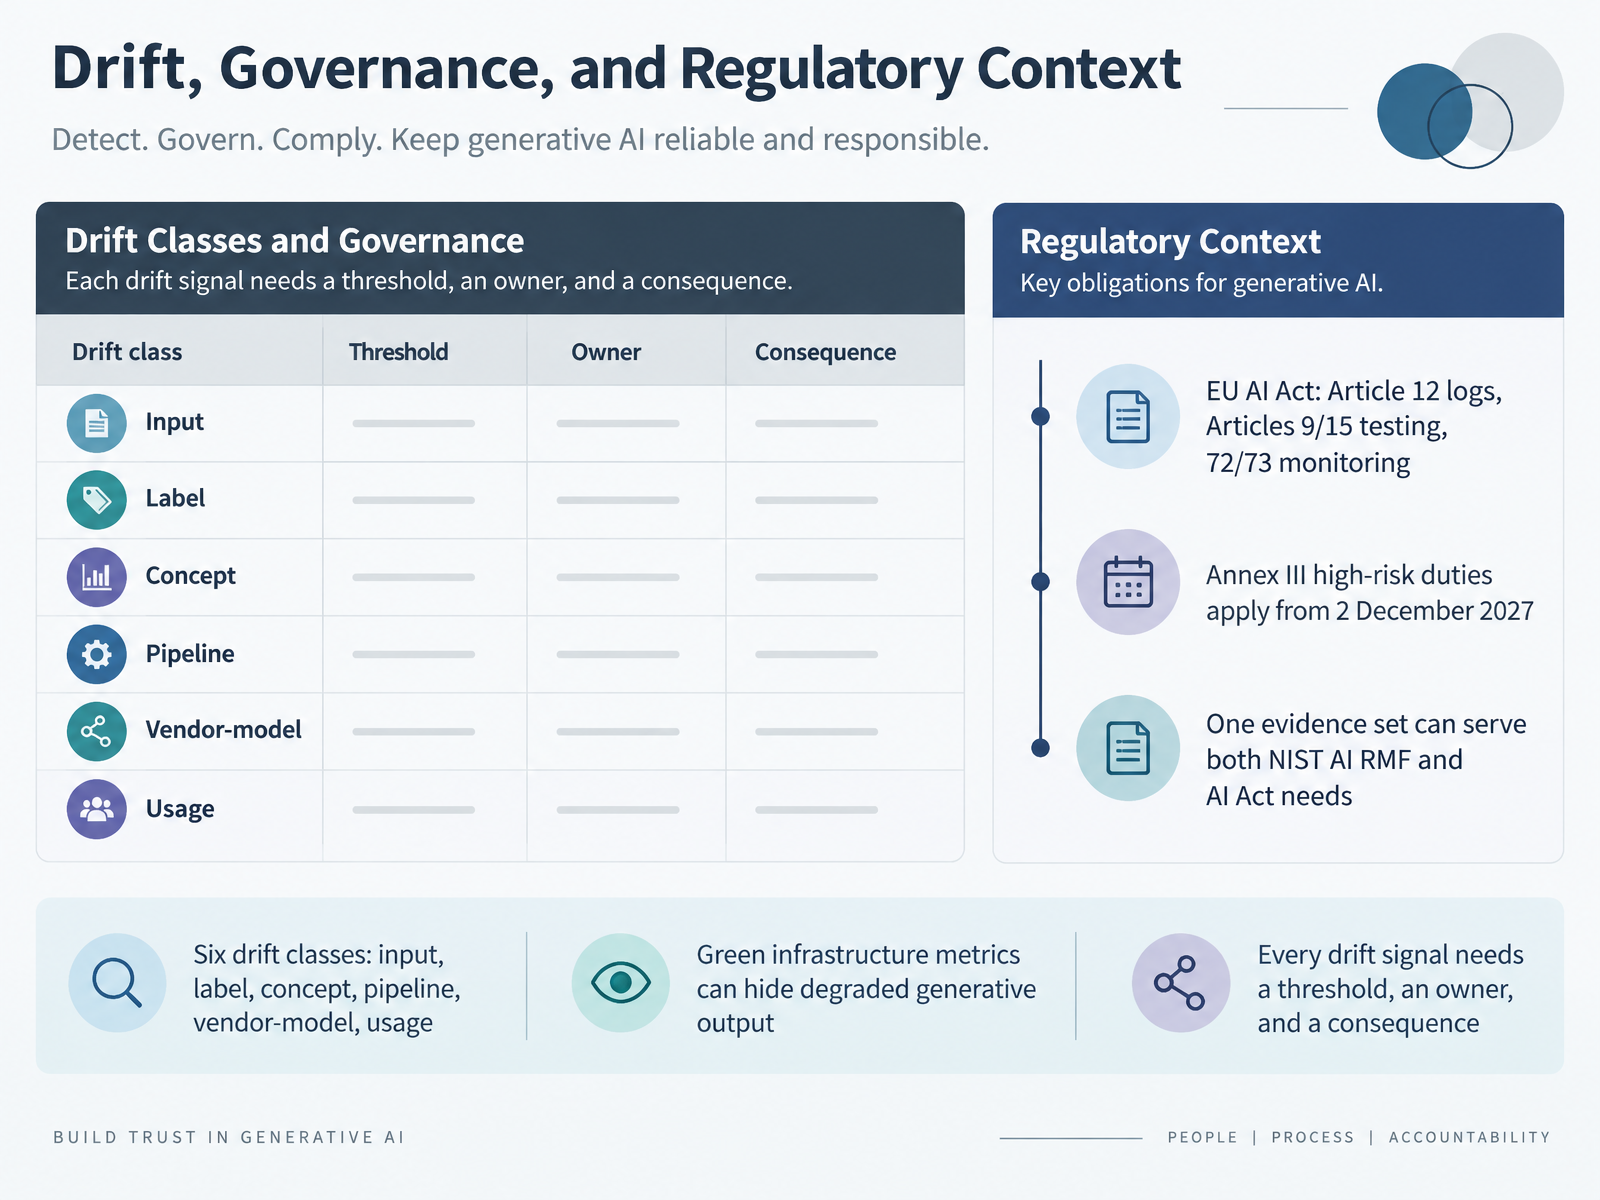
- 12Drift, Governance, and Regulatory ContextNow, let's look at drift, governance, and regulatory context. Drift isn't a single failure mode. Track six classes: input, label, concept, pipeline, vendor-model, and usage. Input drift might be a new customer segment with different phrasing. Usage drift might be a new workflow that sends summarization prompts where classification prompts used to go. Here's the trap: your infrastructure dashboards stay green while generative output quietly degrades. Latency and uptime don't measure whether a summary is now subtly wrong. So every drift signal needs three things: a threshold, an owner, and a consequence. Without a consequence, nothing changes. On the regulatory side, the EU AI Act expects logging under Article twelve, testing under Articles nine and fifteen, and post-market monitoring under Articles seventy-two and seventy-three. Annex three high-risk duties apply from the second of December, twenty twenty-seven. The practical move is consolidation: one evidence set can serve both the NIST AI Risk Management Framework and AI Act needs. Build the log, the test, and the monitoring trail once, then map it to both. That saves duplicated effort and keeps your audit story coherent. Next, let's turn that into action with building a ninety-day measurement plan.
 2 min
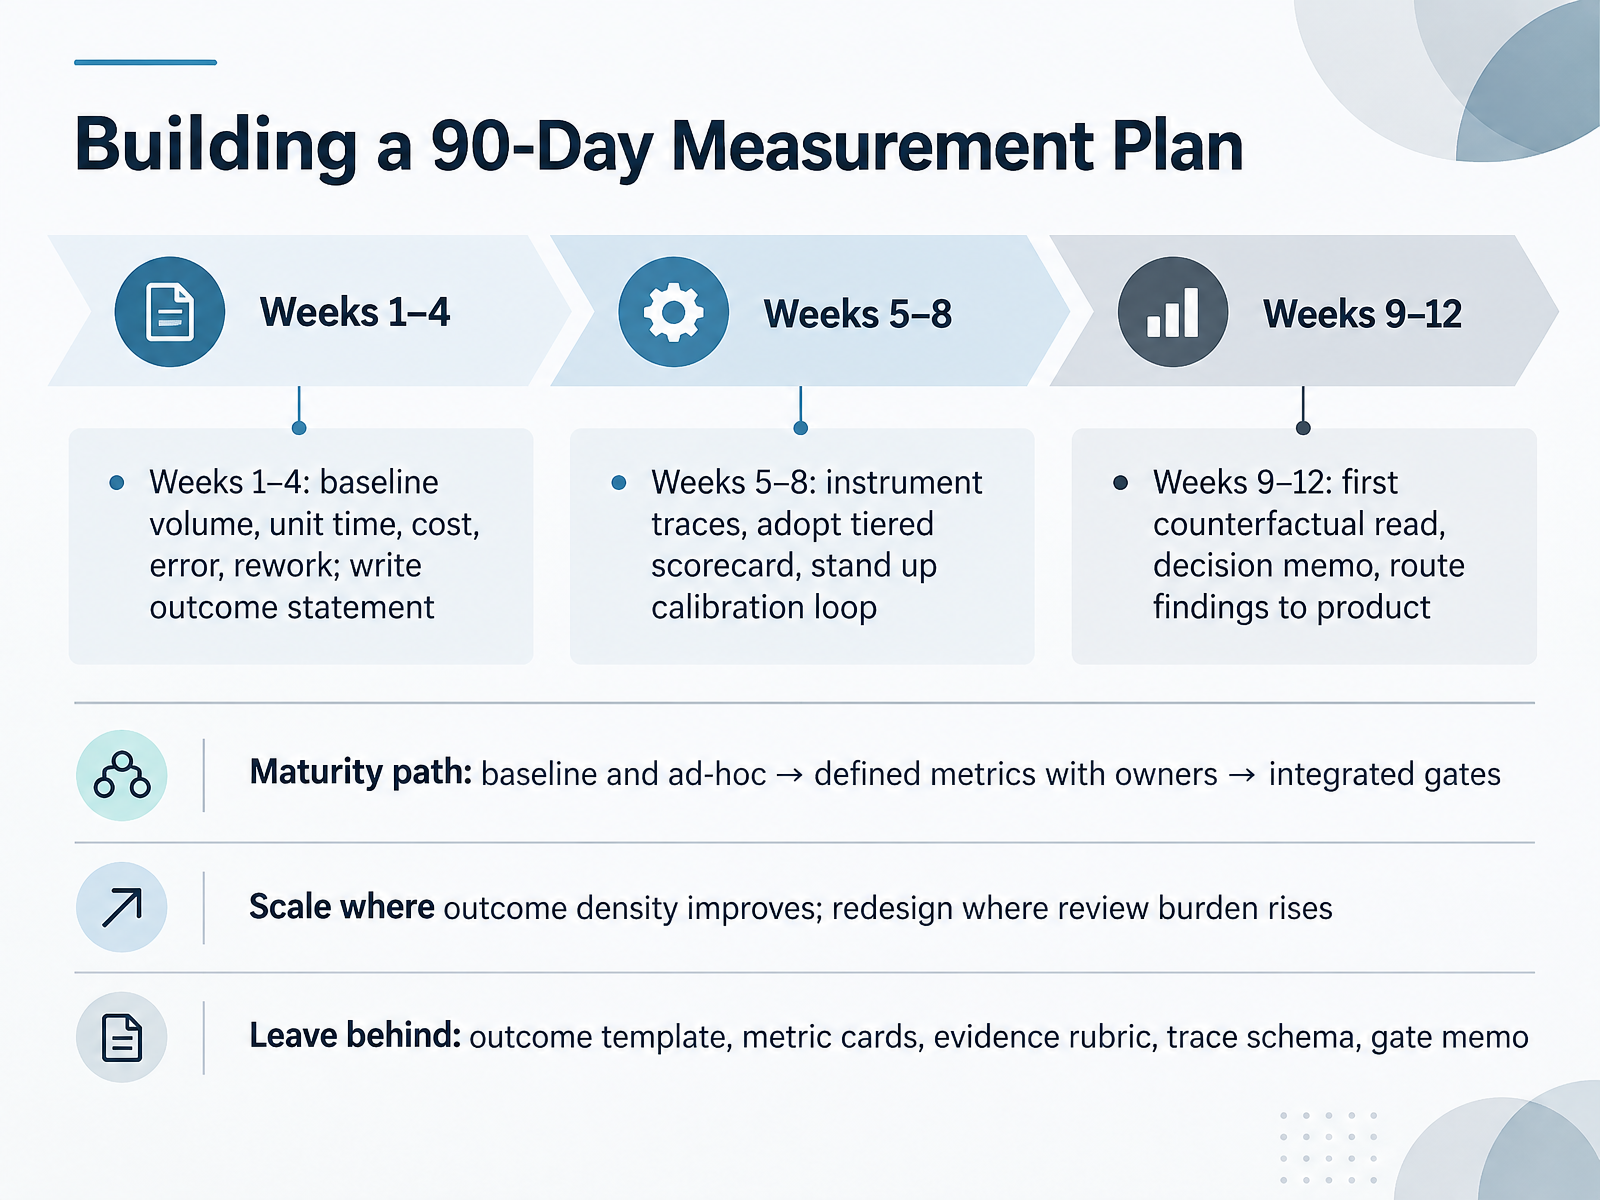
- 13Building a 90-Day Measurement PlanNow let's put that into a concrete ninety-day measurement plan. Weeks one through four are about establishing your baseline. Capture volume, unit time, cost, error rate, and rework before you change anything, and write a clear outcome statement that names the decision this data will inform. Without a clean baseline, every later comparison is guesswork.
Weeks five through eight are where instrumentation happens. Start capturing traces, adopt a tiered scorecard so lightweight checks sit alongside deep evaluations, and stand up a calibration loop so reviewers score consistently. This is also where you name metric owners.
Weeks nine through twelve produce your first counterfactual read. Compare assisted and unassisted work, write a decision memo, and route findings back to the product team. Expect noisy data and imperfect attribution here. Document the uncertainty rather than hiding it.
The maturity path runs from baseline and ad-hoc measurement, to defined metrics with named owners, to integrated gates in the release process. Scale where outcome density improves. Redesign where review burden rises.
Before you close out, leave behind reusable artifacts, an outcome template, metric cards, an evidence rubric, a trace schema, and the gate memo. They turn a one-off study into repeatable practice.
Let's bring this together in our next slide, Key Takeaways and Decision Checklist.
 2 min
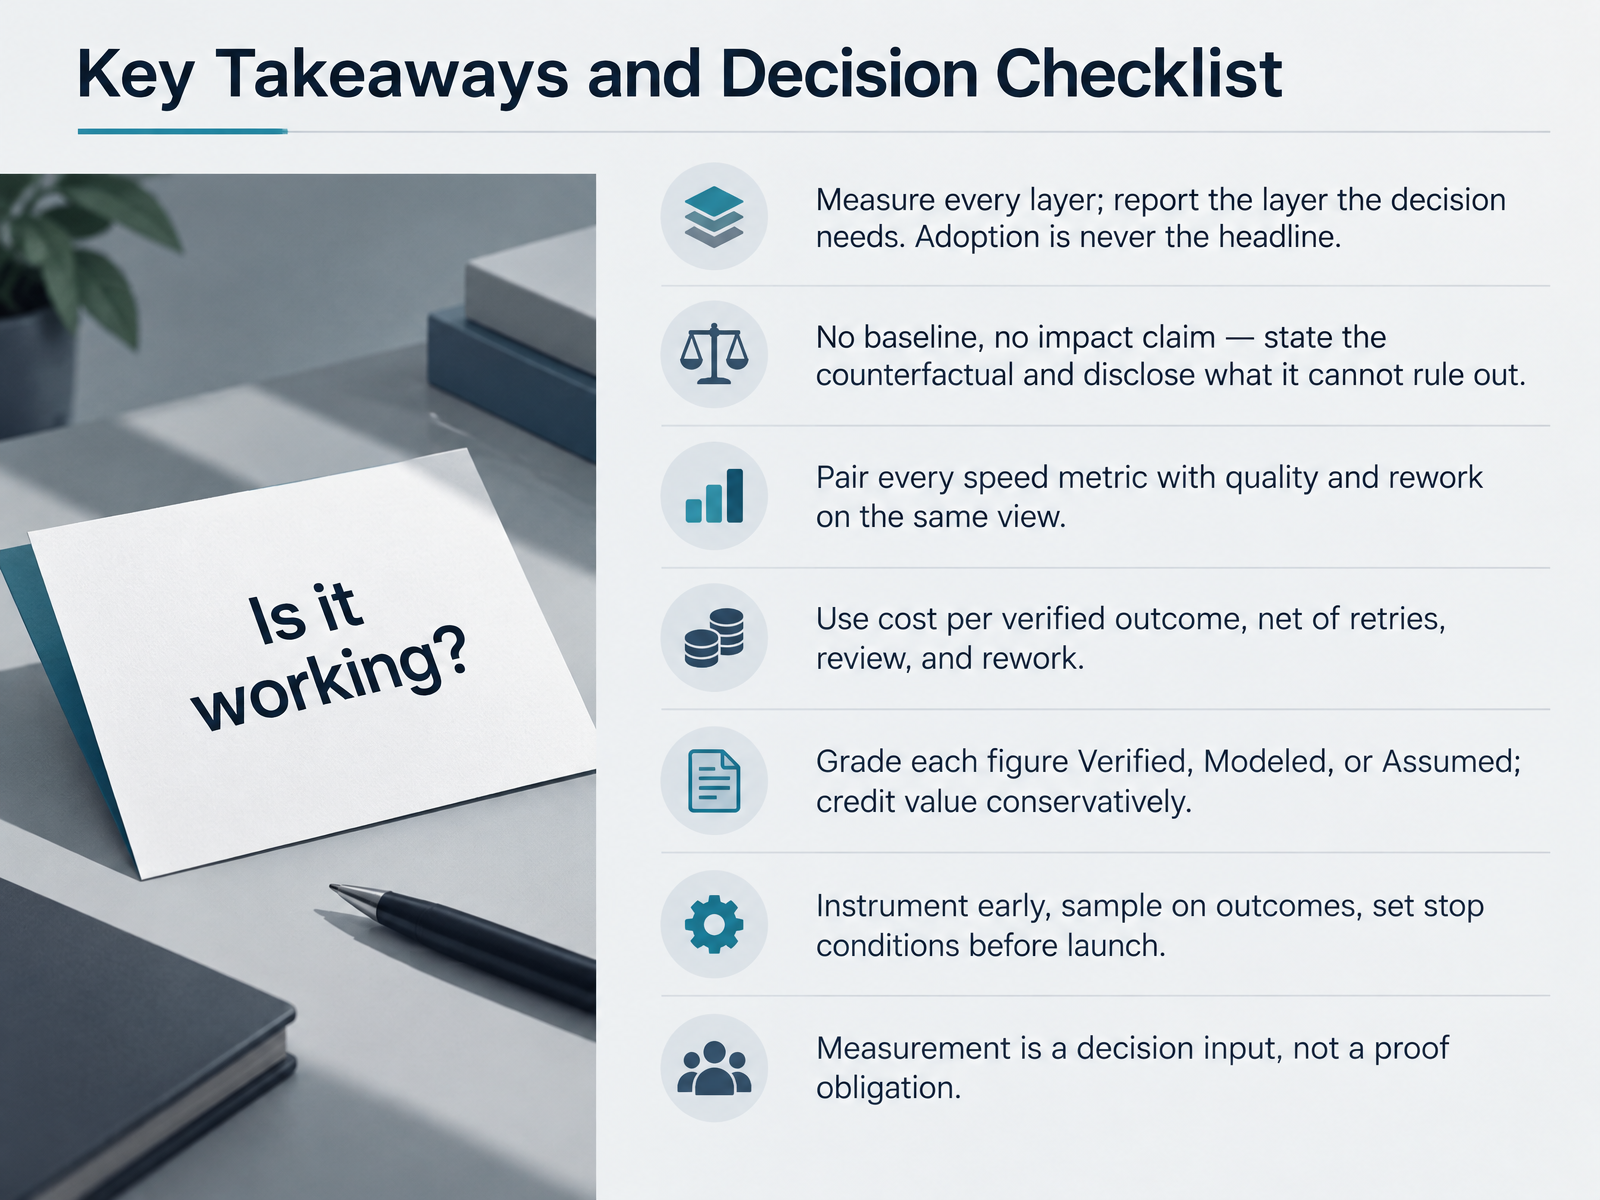
- 14Key Takeaways and Decision ChecklistAs we close, here's the working checklist. First, measure every layer, but report the layer the decision needs. Adoption is never the headline. Second, no baseline, no impact claim. State the counterfactual and disclose what your design cannot rule out. Third, pair every speed metric with quality and rework on the same view, so a faster cycle doesn't hide a lower pass rate. Fourth, use cost per verified outcome, net of retries, human review, and rework. Fifth, grade each figure as Verified, Modeled, or Assumed, and credit value conservatively. Sixth, instrument early, sample on outcomes, and set stop conditions before launch. And finally, treat measurement as a decision input, not a proof obligation. You're not here to prove AI works. You're here to make better calls about where it does, for whom, and at what cost. Keep the discipline. Thank you for working through this, and good luck.
 2 min
Take the deck with you
Download this course as a file — free, no sign-up needed.
- PDF handoutEvery slide page, ready to print or share.15 pages · 3.3 MBDownload
- Narrated PowerPointThe deck that presents itself — every slide carries the digital human's narration video.15 pages · 15.3 MBDownload
- PowerPoint slidesThe full deck as a .pptx — open it in PowerPoint, Keynote, or Google Slides.15 pages · 3.2 MBDownload
Free to use in your own training — please keep the PersonWise credit page at the end.
Have your own deck? Turn it into a course
Sources consulted
Web sources consulted while building this course.
- Navigating the generative AI journey: The Path-to-Value framework from AWS | Artificial Intelligence — aws.amazon.com
- Measuring What Matters — centreforaileadership.org
- AI Yield: A new framework for Enterprise AI economics and value creation — capgemini.com
- From GenAI Ambition to Enterprise Value — bcg.com
- The Formula for Winning Enterprise AI Adoption in 2026 | BCG — bcg.com