Begin
14 pages · ~28 min
Data Science Types Overview
This training introduces the main types of data science and is designed for learners new to the field. Participants will gain a clear understanding of how these types differ and where each applies.
A digital instructor presents all 14 pages. Hold “Ask” at any point and ask out loud — the answer comes from this course. No sign-up needed.
What you’ll learn
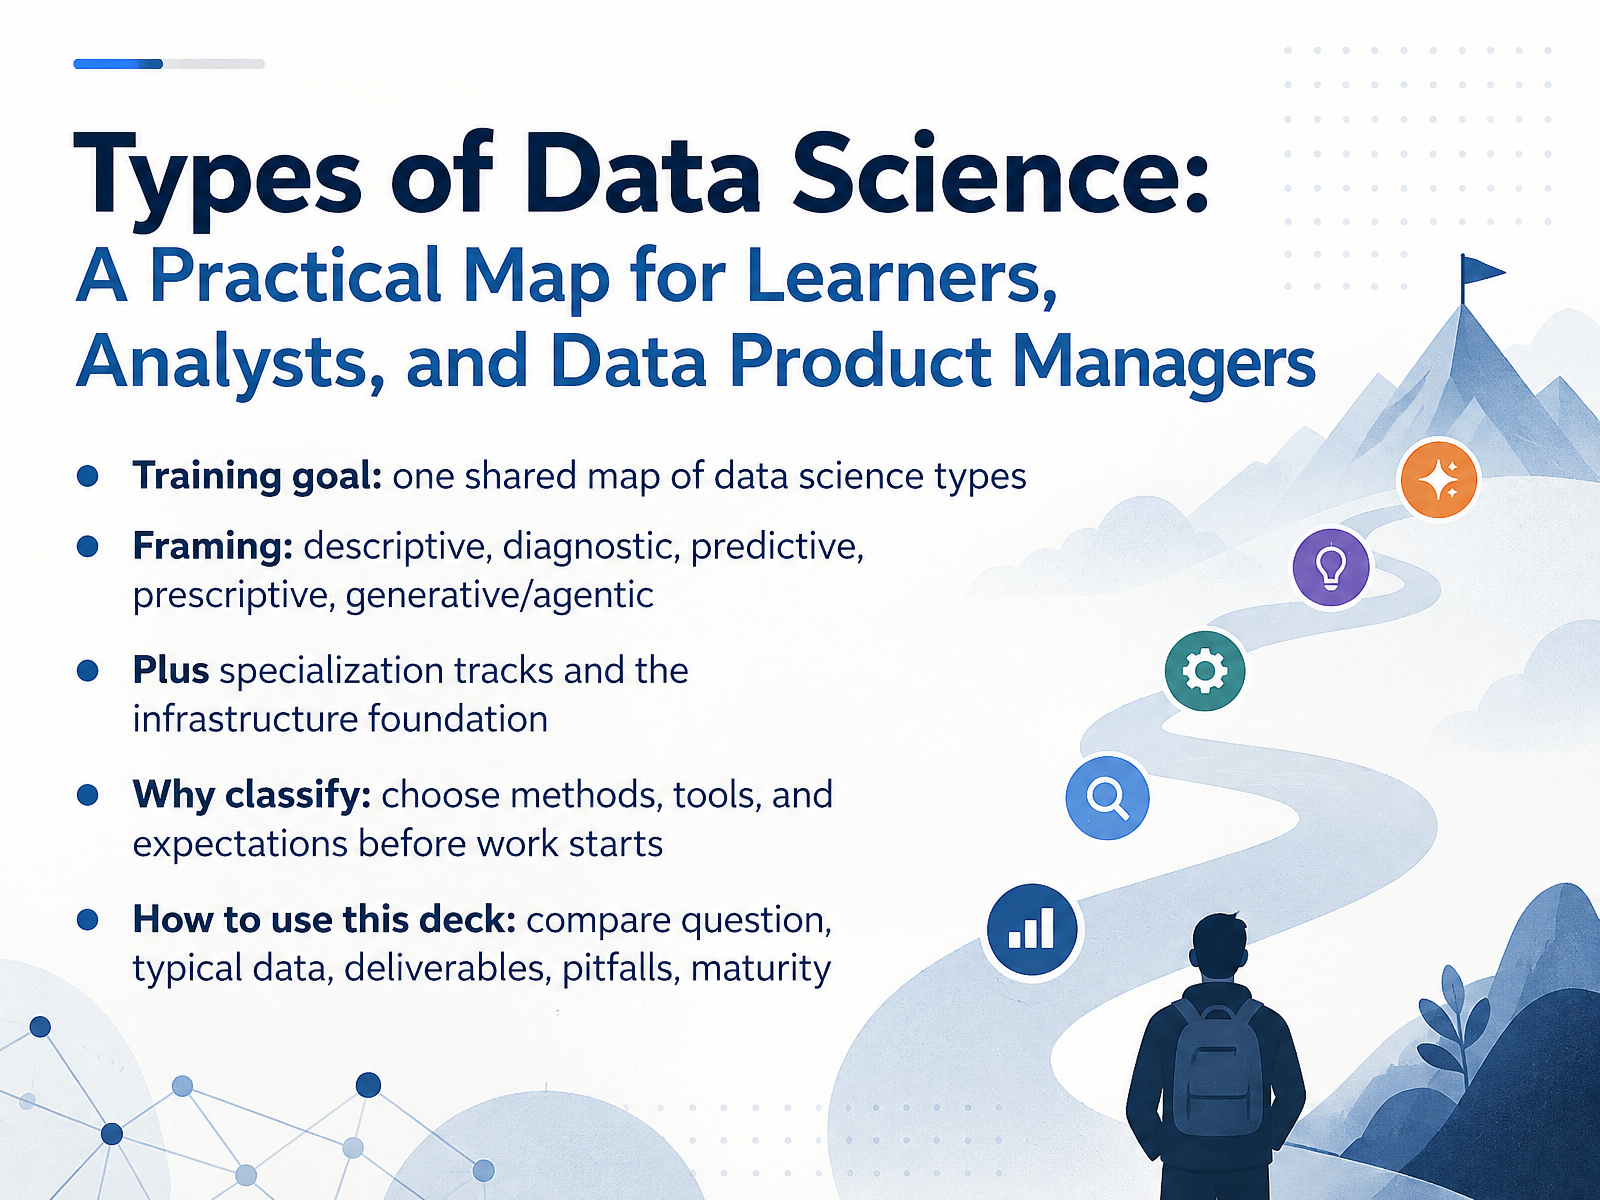
- 01Types of Data Science: A Practical Map for Learners, Analysts, and Data Product ManagersWelcome. Over the next few slides, we'll build one shared map of the types of data science. It's for learners, analysts, and data product managers who want a common vocabulary before choosing methods, tools, or expectations.
Here's the framing. We'll walk through five working types: descriptive, diagnostic, predictive, prescriptive, and generative or agentic. Descriptive answers what happened. Diagnostic asks why. Predictive estimates what will happen next. Prescriptive recommends what to do. And generative or agentic systems create content and act with some autonomy. We'll also cover specialization tracks, like data engineering and machine learning engineering, plus the infrastructure foundation they all rest on.
Why classify at all? Because naming the type of work up front helps you pick the right tools, set realistic expectations, and avoid the classic mismatch of promising a prediction when the real need is a better dashboard.
As we go, compare five dimensions: the question being asked, the typical data involved, the deliverable, the common pitfalls, and the maturity required. Categories overlap, and that can be confusing, so map them onto your own projects as we move. Next, why data science is an umbrella, not a single job.export.arxiv.orgdatascience.virginia.eduadyen.com+22 min
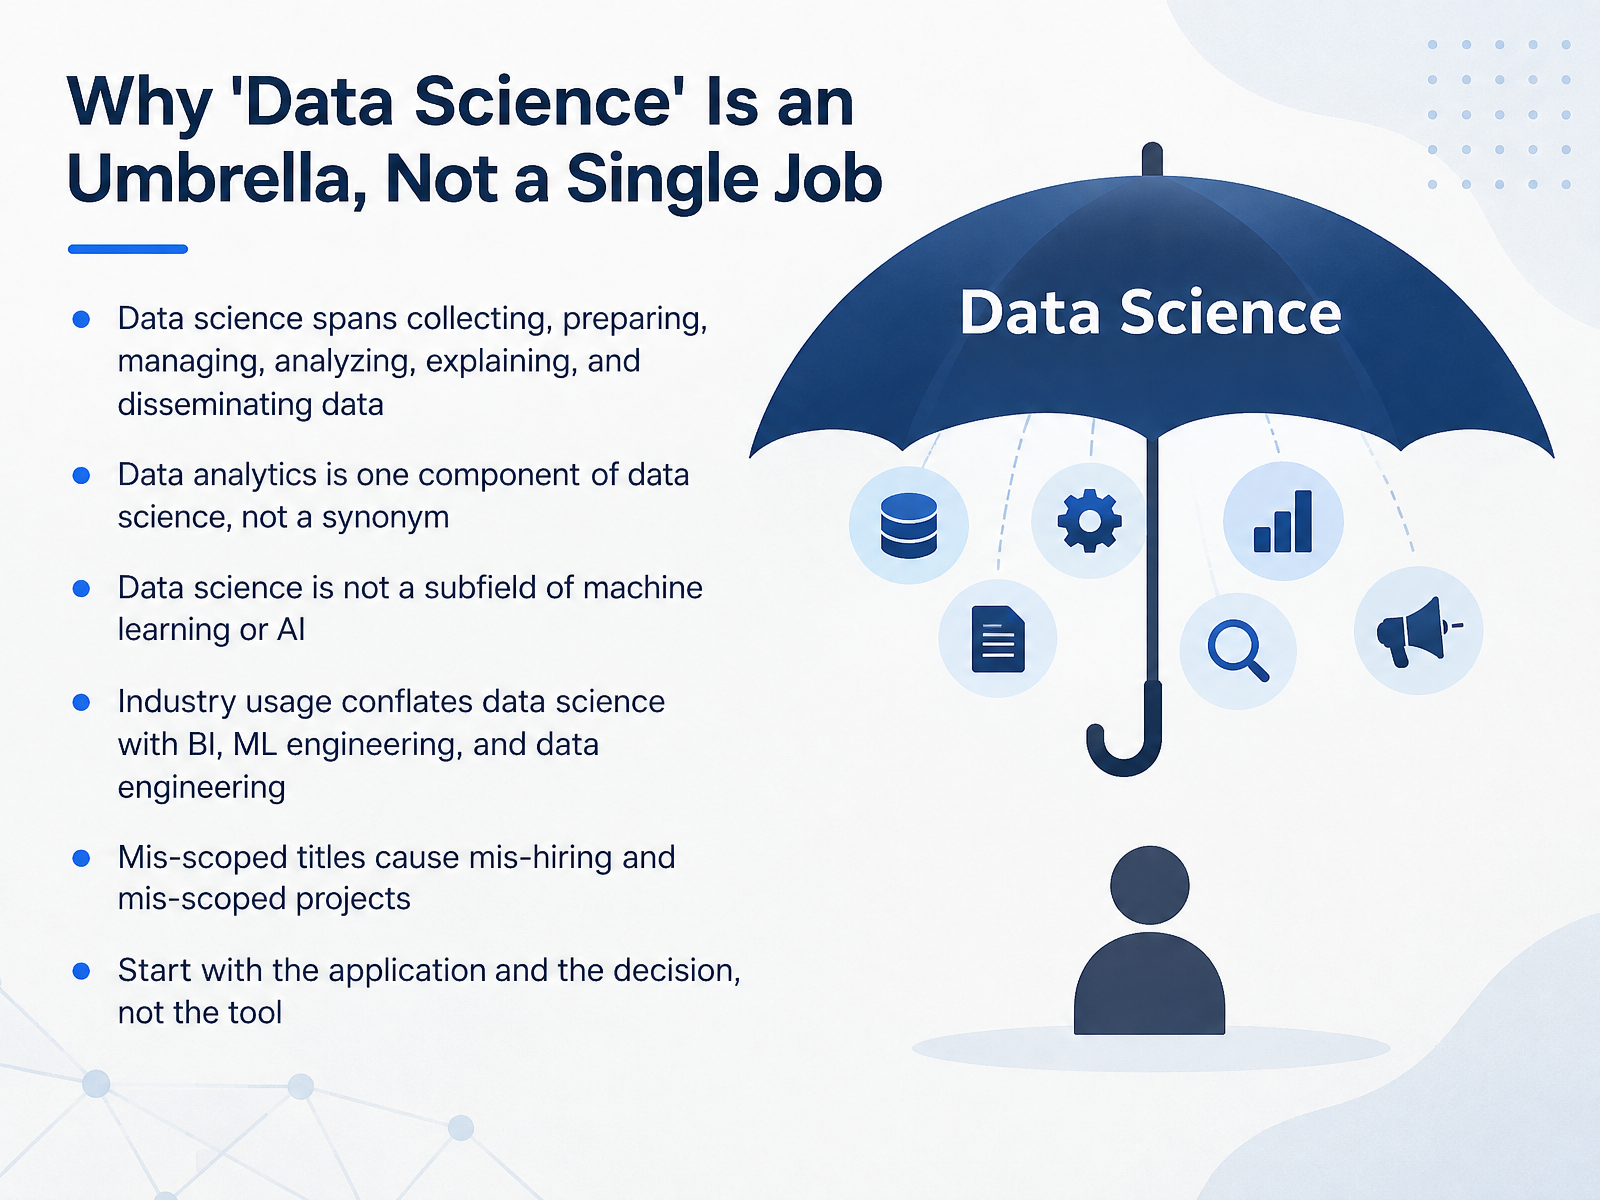
- 02Why 'Data Science' Is an Umbrella, Not a Single JobLet's start with an important clarification. Data science is an umbrella, not a single job. It spans collecting, preparing, managing, analyzing, explaining, and disseminating data. Data analytics is one component of that umbrella, not a synonym for it. And data science is not a subfield of machine learning or AI; the fields overlap, but neither contains the other. Here is where confusion creeps in. Industry usage often conflates data science with business intelligence, machine learning engineering, and data engineering. A data engineer builds pipelines, an analyst explains what happened, a scientist builds models, and an ML engineer ships them to production. When titles are mis-scoped, you get mis-hiring and mis-scoped projects. So a practical habit: start with the application and the decision you need to support, not the tool. Ask what decision this work will change, then choose the right role. Next, we look at the Analytics Maturity Ladder: Five Levels of Questions.
 export.arxiv.orgdatascience.virginia.eduadyen.com+22 min
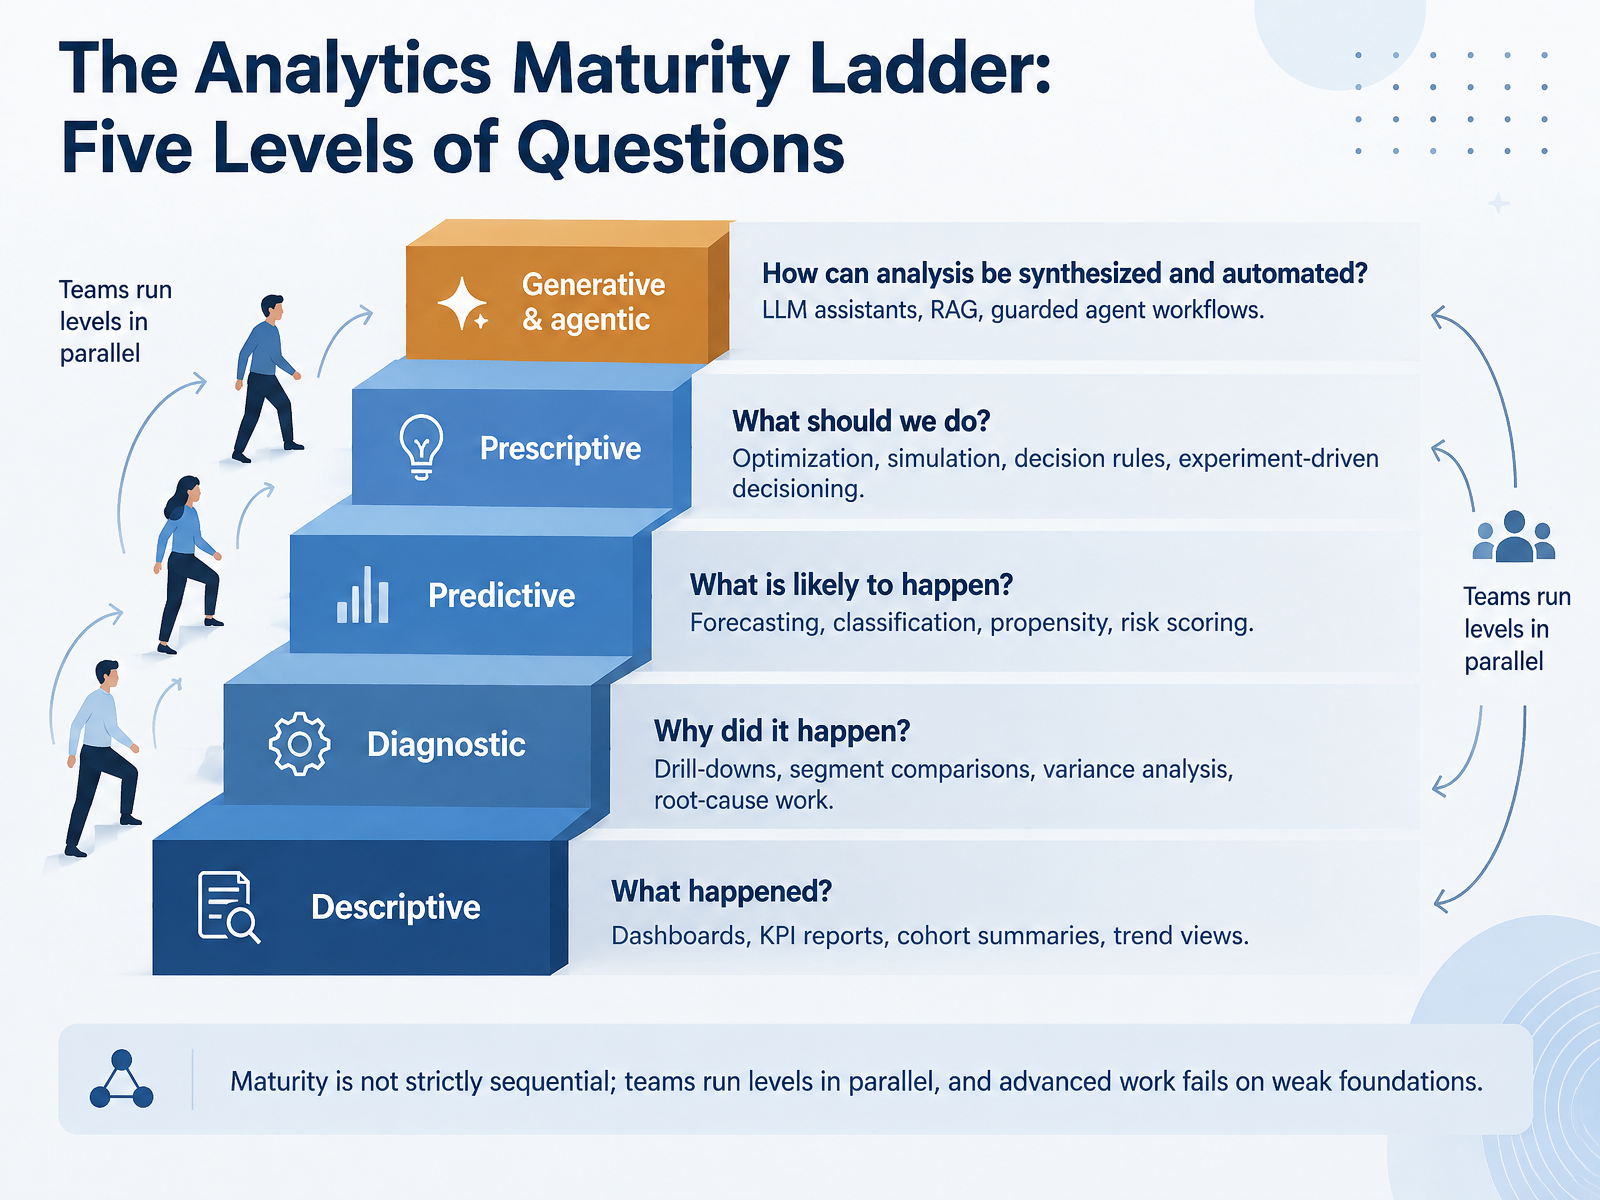
- 03The Analytics Maturity Ladder: Five Levels of QuestionsNext, let's look at how these question types stack into a maturity ladder. Descriptive analytics asks what happened, through dashboards, K P I reports, cohort summaries, and trend views. Diagnostic asks why it happened, using drill-downs, segment comparisons, variance analysis, and root-cause work. Predictive asks what is likely to happen, through forecasting, classification, propensity, and risk scoring. Prescriptive asks what we should do, using optimization, simulation, decision rules, and experiment-driven decisioning. And generative and agentic analytics asks how analysis can be synthesized and automated, through L L M assistants, retrieval-augmented generation, and guarded agent workflows. One caveat: maturity is not strictly sequential. Teams often run several levels in parallel, and advanced work fails on weak foundations. So map these five levels onto your own projects, and note where your data foundations still need work. Coming up next, Shared Vocabulary: Data Types, Method Families, and Deliverables.
 thoughtspot.comtechtarget.comalteryx.com+22 min
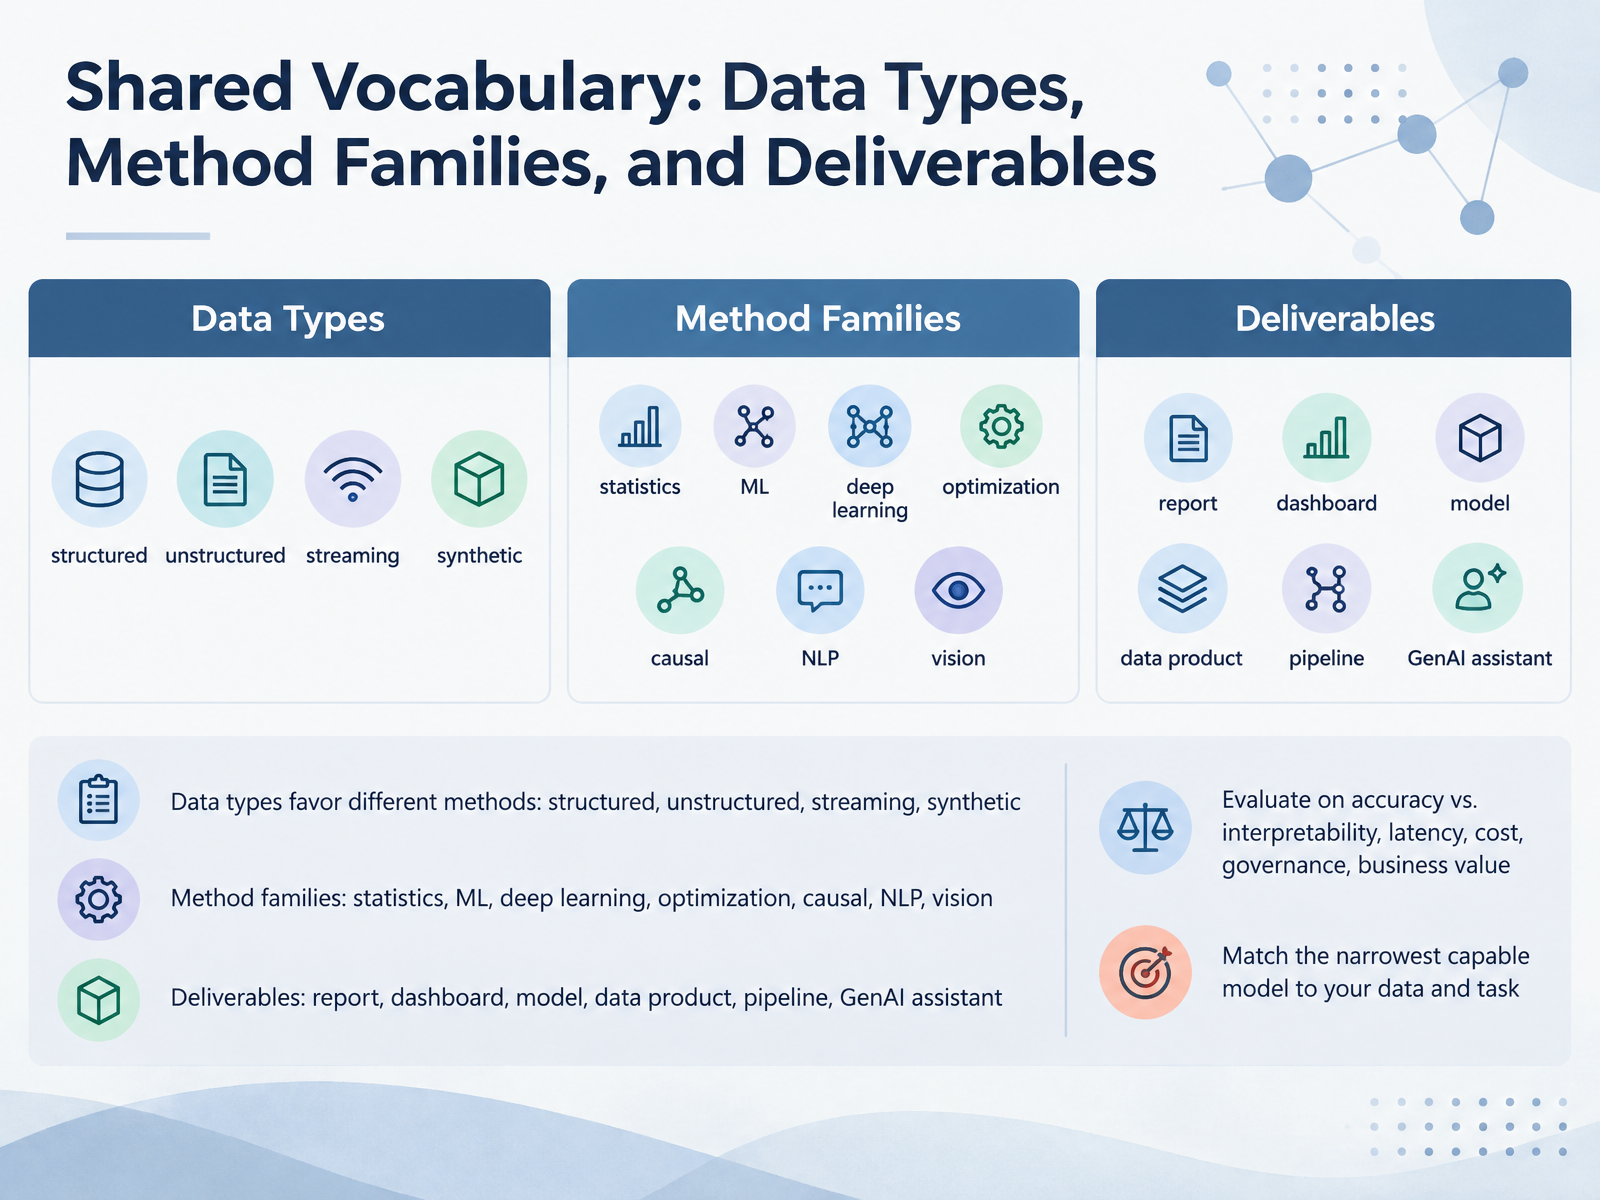
- 04Shared Vocabulary: Data Types, Method Families, and DeliverablesBefore we compare specific analysis types, let's settle on a shared vocabulary. It helps because these categories often overlap, and that overlap can be confusing. First, data types. Structured data, like spreadsheets and tables, favors classical machine learning and statistics. Unstructured data, like text or images, pushes you toward natural language processing or computer vision. Streaming data calls for methods that handle events as they arrive. Synthetic data, which is generated rather than collected, helps when real data is scarce or sensitive. Second, method families: statistics, machine learning, deep learning, optimization, causal inference, NLP, and vision. Third, deliverables: reports, dashboards, models, data products, pipelines, and GenAI assistants. Finally, evaluate along accuracy versus interpretability, latency, cost, governance, and business value. One practical rule ties it together: match the narrowest capable model to your data and task. A simple regression may beat a large language model for tabular prediction. Now let's look at descriptive and diagnostic analytics in practice.
 export.arxiv.orgdatascience.virginia.eduadyen.com+22 min
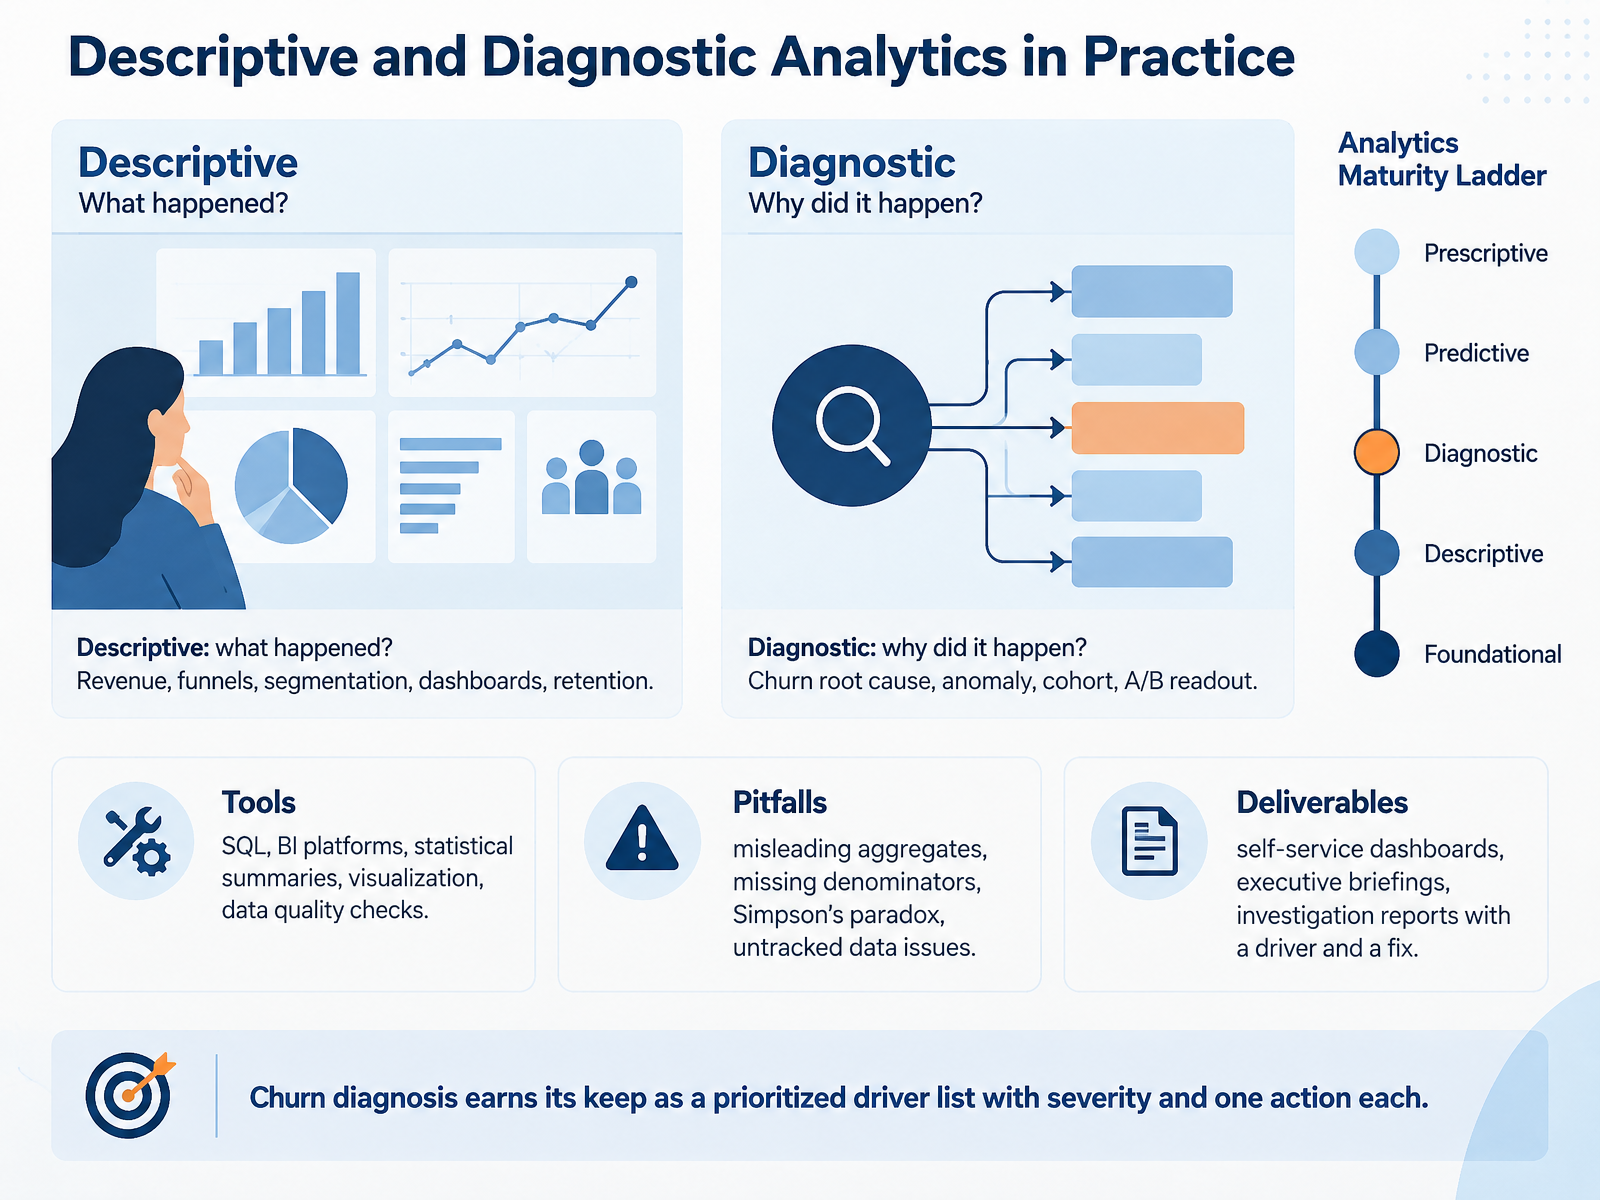
- 05Descriptive and Diagnostic Analytics in PracticeLet's move on to descriptive and diagnostic analytics in practice. These two are close cousins, and they're easy to mix up, so here's the plain version. Descriptive analytics answers, what happened? Revenue, funnel conversion, segmentation, dashboards, retention. Diagnostic analytics answers, why did it happen? Churn root cause, anomaly investigation, cohort comparison, and A/B readouts. A/B, by the way, means comparing two versions to see which performs better. The tools are familiar ones: SQL, BI platforms, statistical summaries, visualization, and data quality checks. Now the pitfalls. Misleading aggregates, missing denominators, Simpson's paradox, where a trend flips once you split by segment, and untracked data issues. On deliverables, you'll produce self-service dashboards, executive briefings, and investigation reports that name a driver and a fix. A good churn diagnosis is a prioritized driver list with severity and one action each. Not a chart. An action plan. From here, let's walk through a concrete example: from churn dashboard to churn diagnosis, a worked example.
 thoughtspot.comamplitude.comskopx.com+22 min
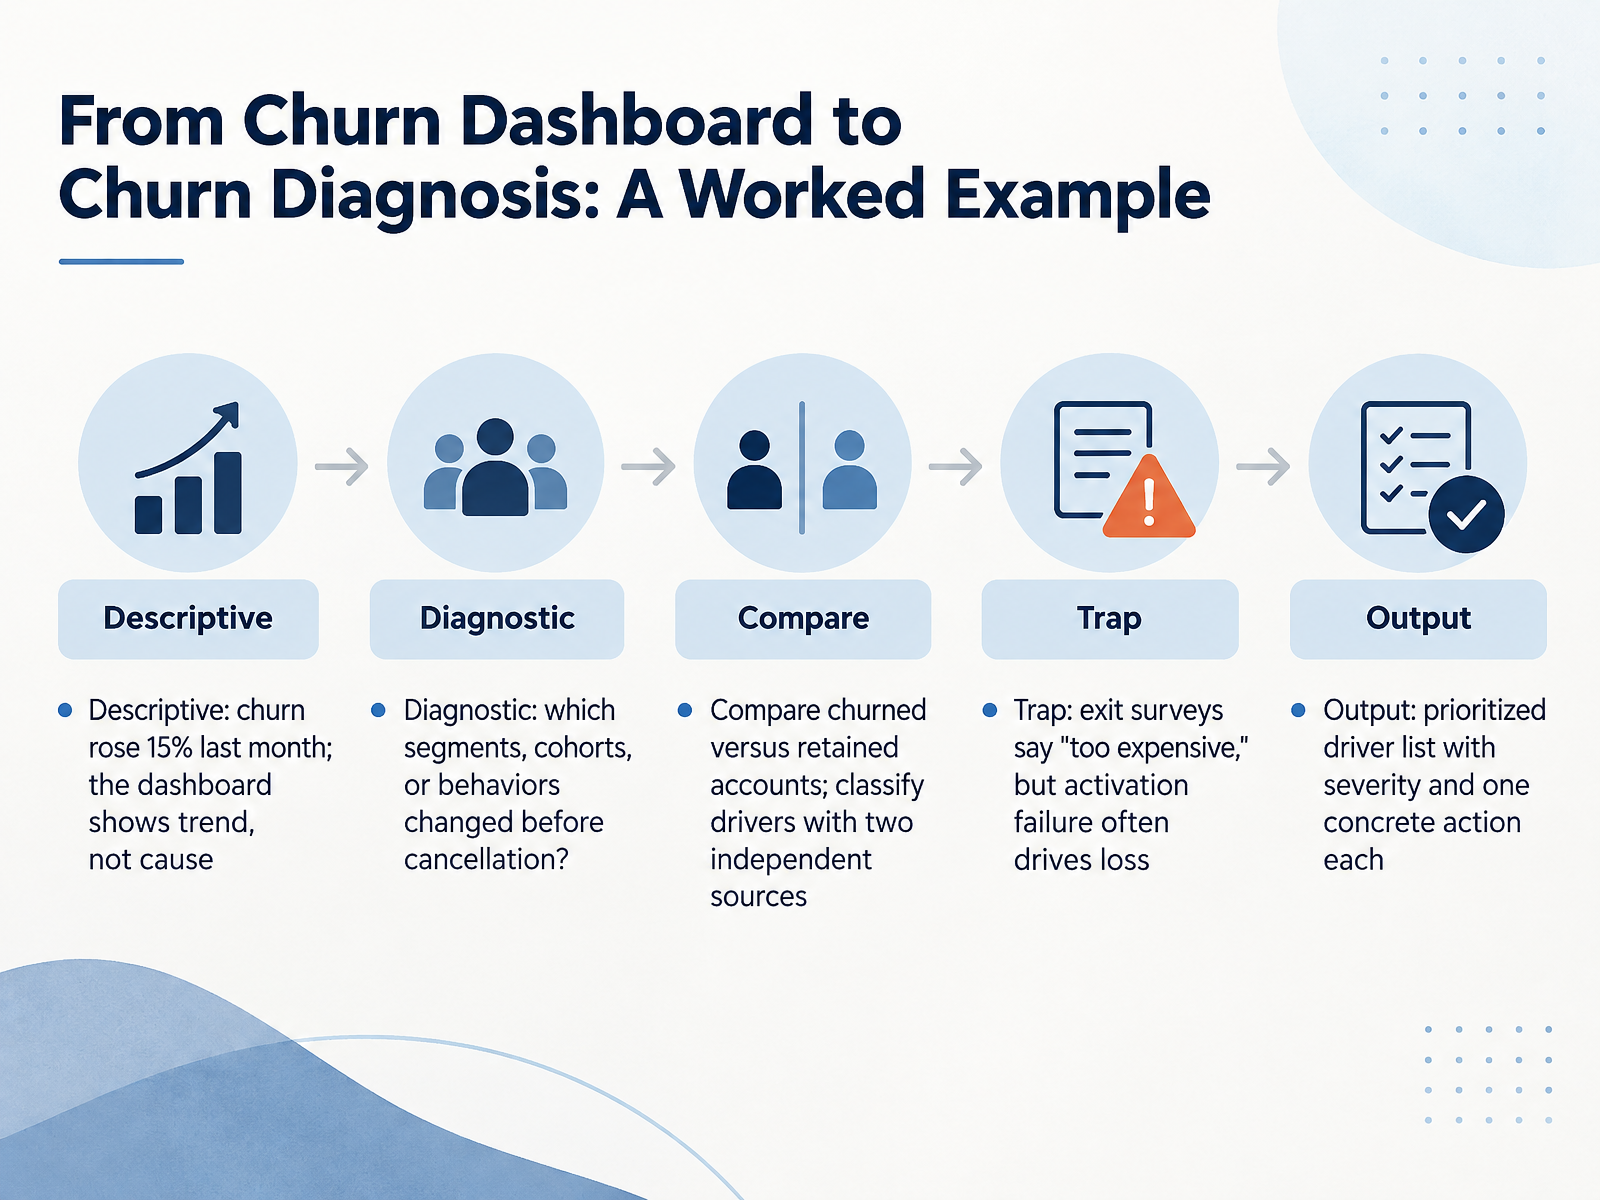
- 06From Churn Dashboard to Churn Diagnosis: A Worked ExampleLet's make this concrete with a worked example. Your churn dashboard shows churn rose fifteen percent last month. That is descriptive. It shows the trend, not the cause. The dashboard is the autopsy, not the diagnosis. So you move to diagnostic work. Which segments, cohorts, or behaviors changed before cancellation? Compare churned accounts against retained ones, and classify the drivers using at least two independent sources, such as product analytics and customer success notes. Here is a trap worth flagging. Exit surveys often say too expensive, but activation failure frequently drives the loss. Price objections are usually the polite exit. The output is not another chart. It is a prioritized driver list, with severity and one concrete action for each driver. As we continue, try mapping descriptive and diagnostic questions onto one of your own projects. Next, we turn to predictive analytics: forecasting, scoring, and classification.
 thoughtspot.comamplitude.comskopx.com+21 min
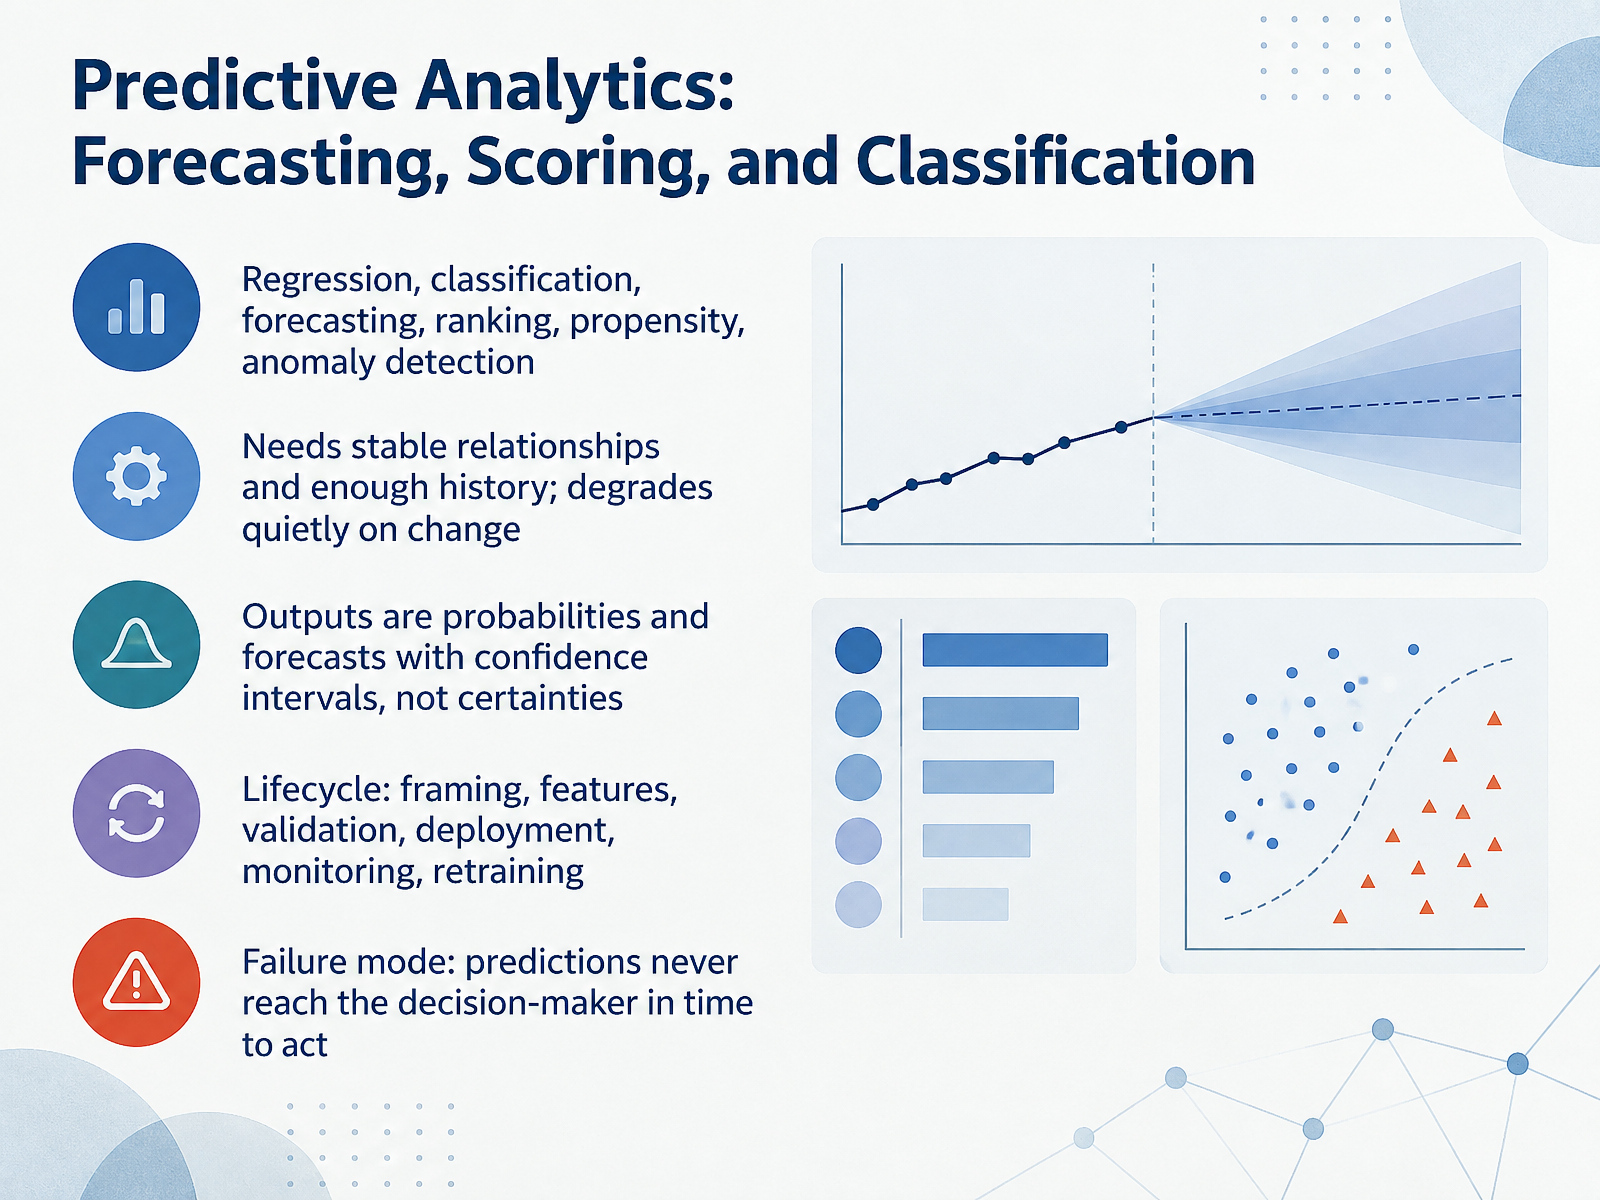
- 07Predictive Analytics: Forecasting, Scoring, and ClassificationNow let's look at predictive analytics, the type that answers: what will happen next? In practice, it covers a family of tasks. Regression estimates a number, like next month's revenue. Classification assigns a category, such as churn or not. Forecasting projects a time series. Ranking orders options, propensity scoring estimates the chance a customer will act, and anomaly detection flags what looks wrong. Two conditions matter. Predictive models need stable relationships and enough history. And they degrade quietly when the world changes, so monitoring is not optional. Treat outputs as probabilities and forecasts with confidence intervals, not certainties. The lifecycle runs from framing the question, to features, validation, deployment, monitoring, and retraining. And watch one common failure: predictions that never reach the decision-maker in time to act. So ask yourself, where in your own projects does a prediction actually change a decision? That leads us to the next slide, Prescriptive Analytics and Causal Reasoning: From Prediction to Action.
 sumboard.ioibm.comwisdom.ai+22 min
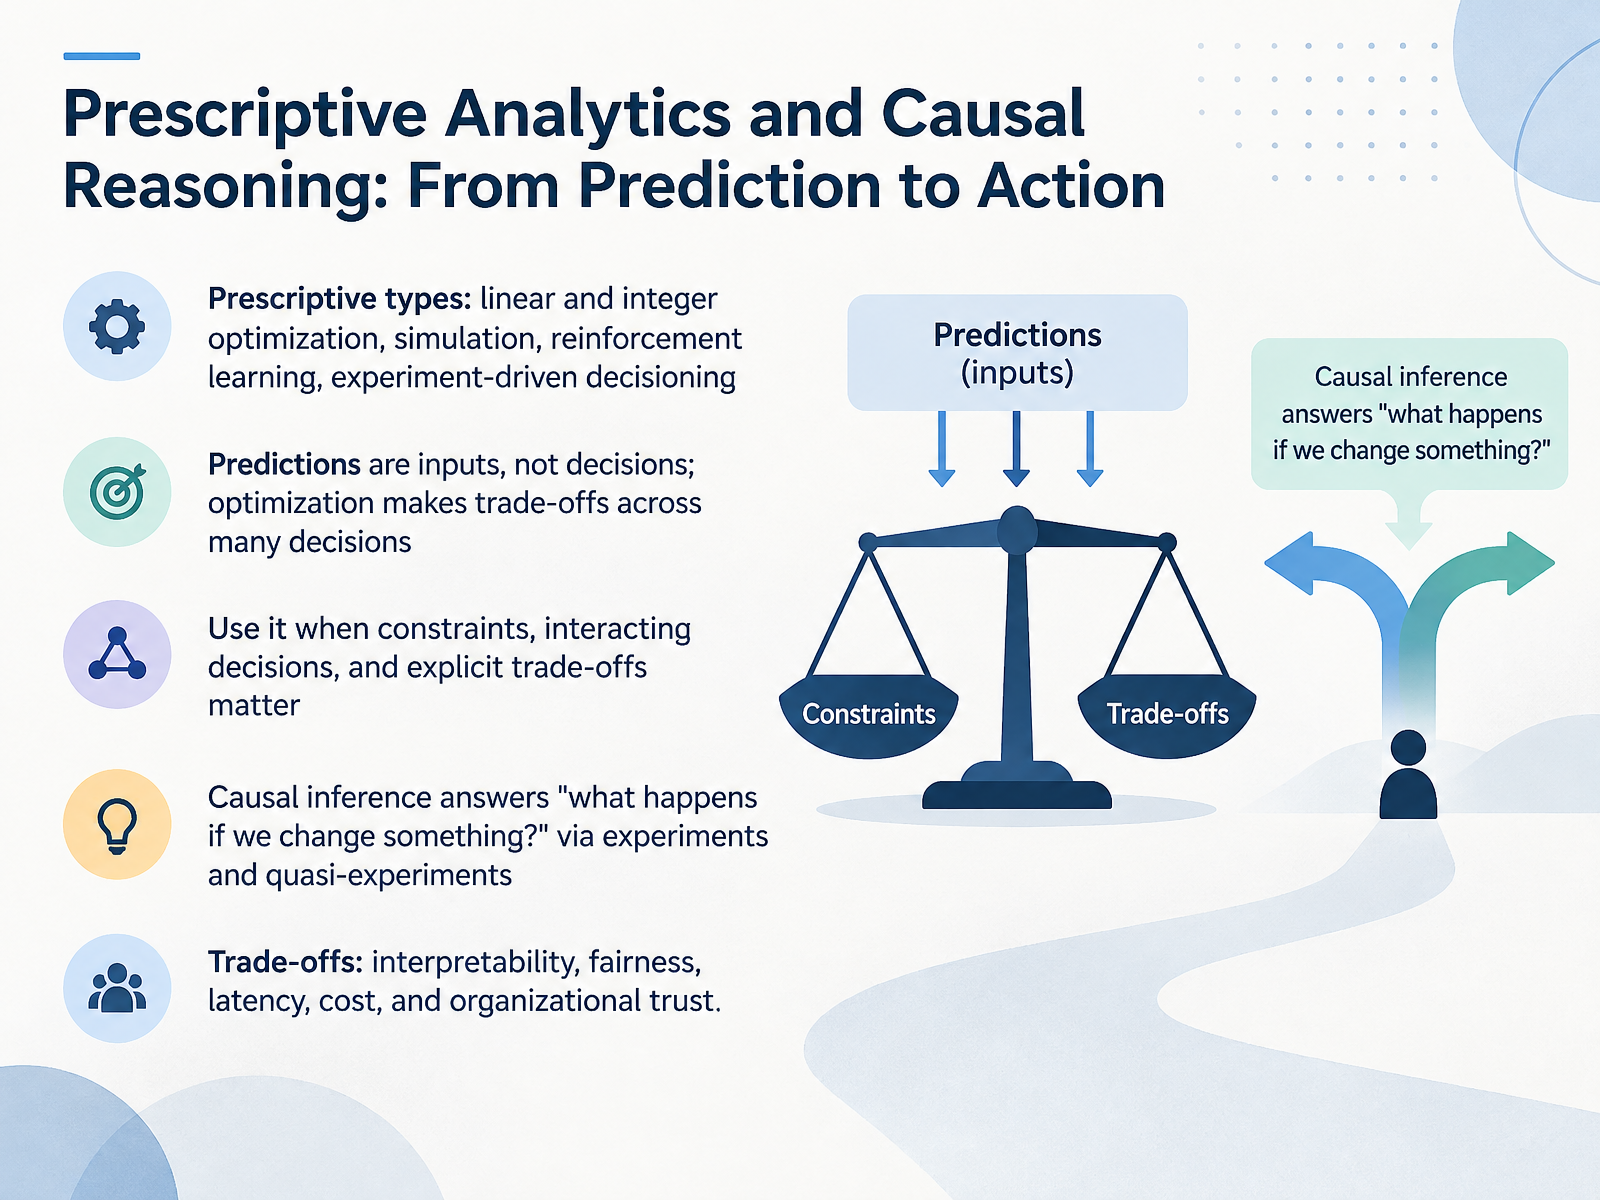
- 08Prescriptive Analytics and Causal Reasoning: From Prediction to ActionLet's move from prediction to action, into prescriptive analytics and causal reasoning. Prescriptive methods include linear and integer optimization, simulation, reinforcement learning, and experiment-driven decisioning. The key idea is that predictions are inputs, not decisions. Optimization makes trade-offs across many decisions at once. Use it when constraints, interacting decisions, and explicit trade-offs matter. Causal inference answers a different question: what happens if we change something? We get that through experiments and quasi-experiments. And the trade-offs are real: interpretability, fairness, latency, cost, and organizational trust. A quick example: a retailer forecasts demand, then optimizes inventory and routes under capacity limits. And a causal test tells you whether a discount actually caused the lift. As we close, try mapping these types onto your own projects. Which decisions need optimization, and which need a causal answer? Next, we look at specialized tracks: natural language processing, computer vision, and generative AI.
 infinisynapse.com2 min
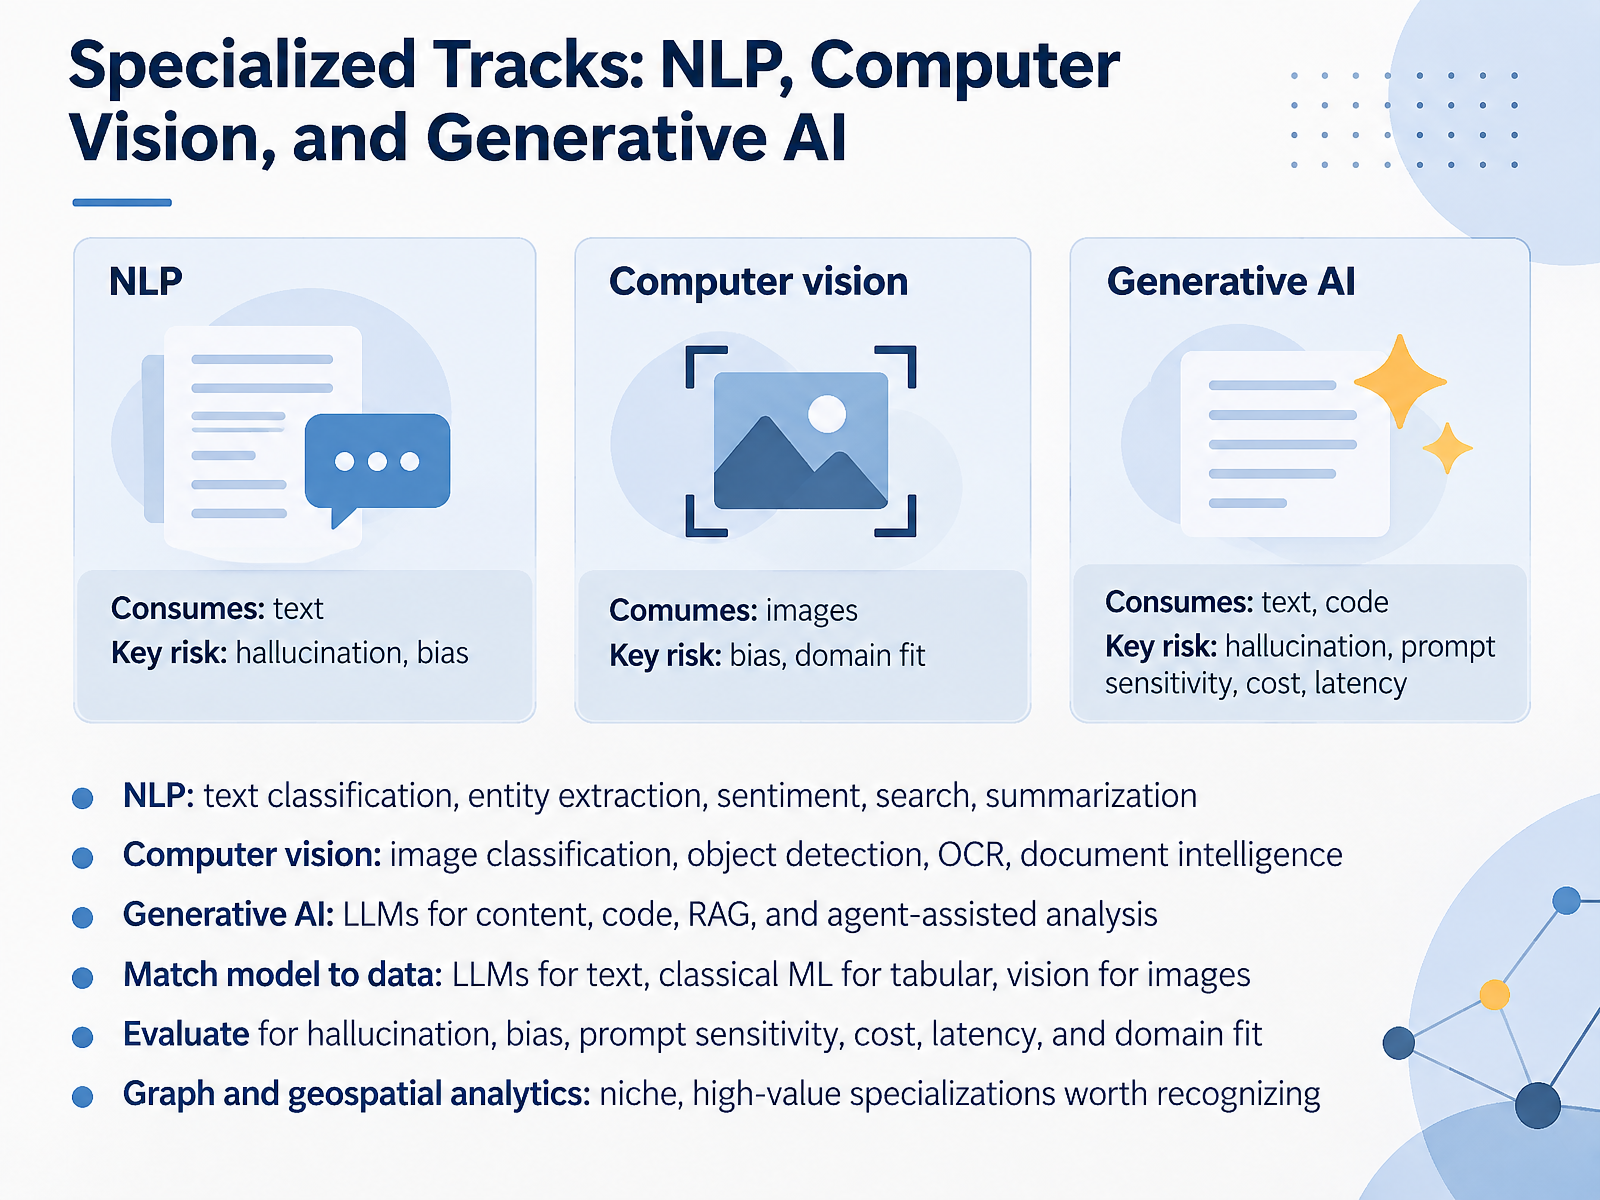
- 09Specialized Tracks: NLP, Computer Vision, and Generative AINow let's look at the specialized tracks, where the data type really narrows your choice of model. Natural language processing handles text: classification, entity extraction, sentiment, search, and summarization. Computer vision handles images and video: image classification, object detection, optical character recognition, and document intelligence. Generative AI, built largely on large language models, produces content, code, retrieval-augmented answers, and agent-assisted analysis. Here's the practical rule. Match the model to the data. Use a large language model for text and reasoning, classical machine learning for tabular data, and vision models for images. And evaluate carefully. Check for hallucination, bias, prompt sensitivity, cost, latency, and domain fit. Two niche specializations are also worth recognizing: graph analytics for connected data, and geospatial analytics for location. Ask yourself which of these tracks your own projects already touch. Next, we move into the infrastructure track: data engineering, analytics engineering, and MLOps.
 2 min
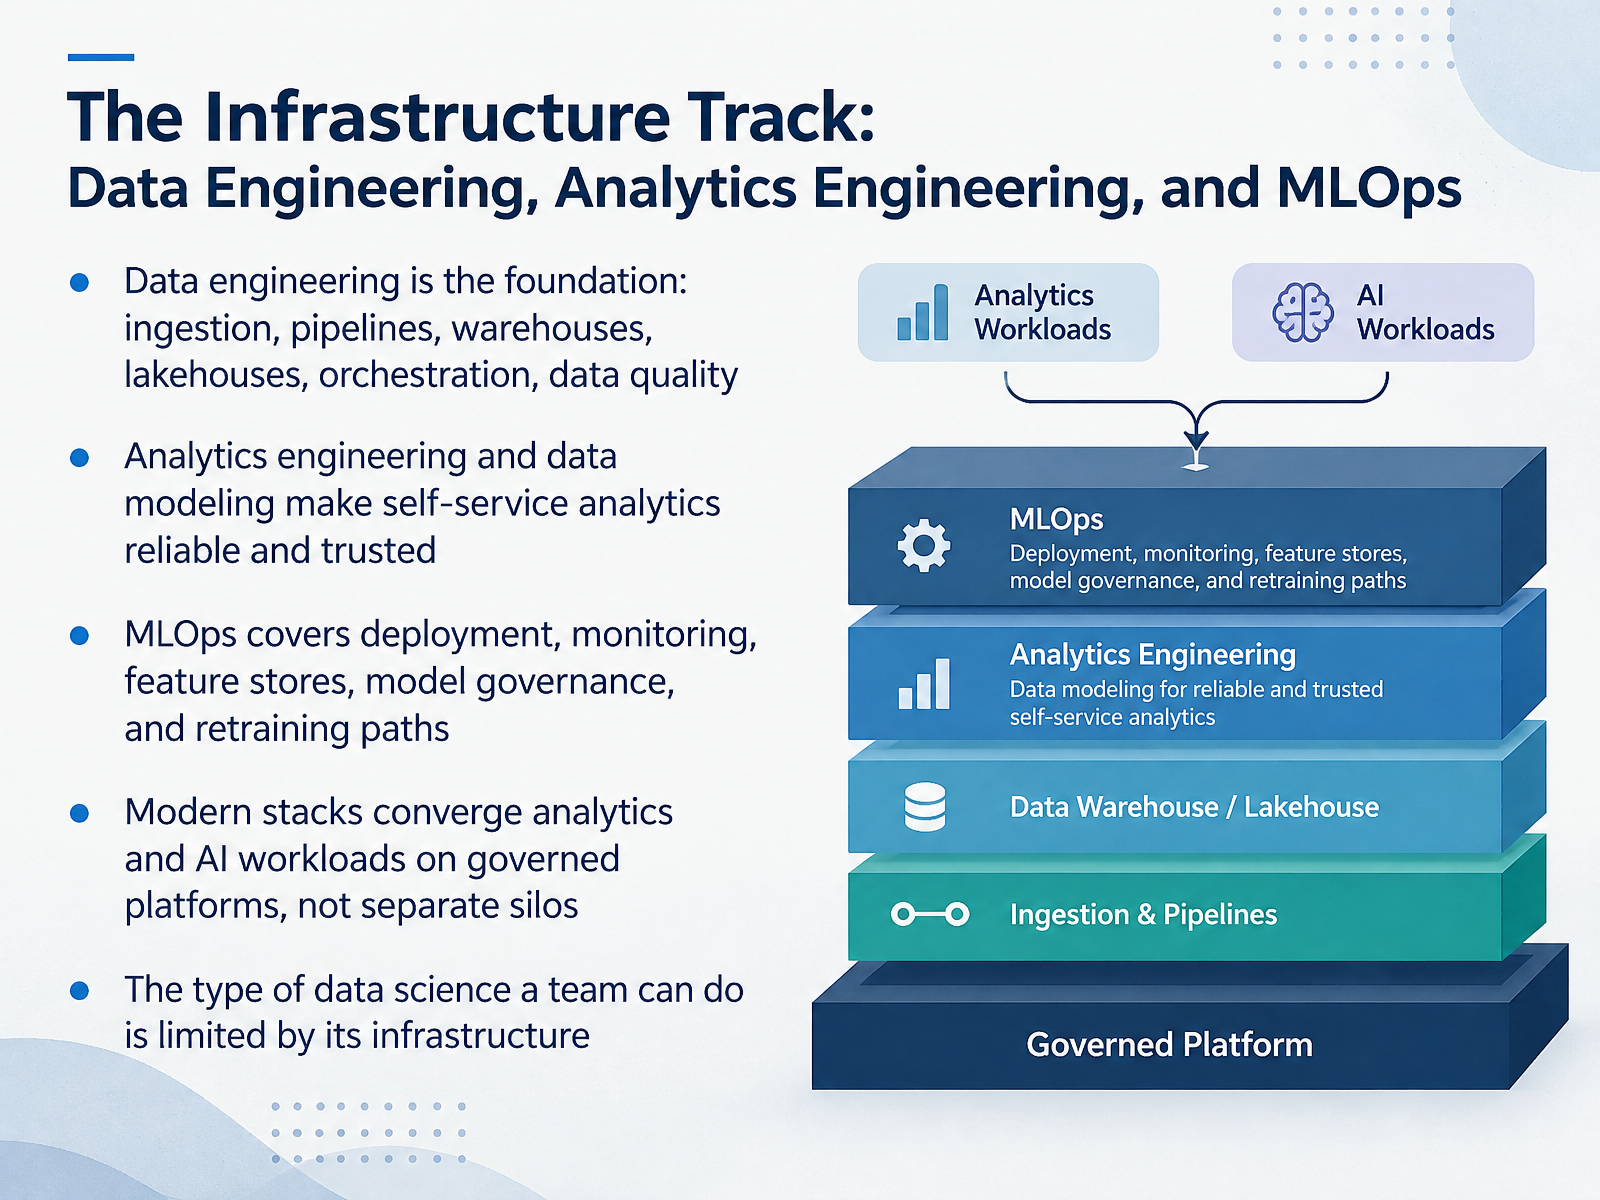
- 10The Infrastructure Track: Data Engineering, Analytics Engineering, and MLOpsNow let's look at the infrastructure track, because the type of data science a team can do is limited by its infrastructure. Data engineering is the foundation: ingestion, pipelines, warehouses, lakehouses, orchestration, and data quality. If the pipelines are unreliable, nothing above them can be trusted. Next, analytics engineering and data modeling make self-service analytics reliable and trusted. Think of well-documented, tested models that product teams can query without filing a ticket. MLOps covers deployment, monitoring, feature stores, model governance, and retraining paths. It is the operating model that moves a model from a notebook into production and keeps it healthy. One important trend: modern stacks converge analytics and AI workloads on governed platforms, not separate silos. A single governed lakehouse can serve dashboards and models from the same data, which reduces cost and drift. So as you map these roles onto your own projects, ask a simple question. Is our infrastructure mature enough for the data science we want to do? That leads us naturally to the next slide, Choosing the Right Type: A Decision Framework.
 techtarget.comexport.arxiv.orgdatascience.virginia.edu+22 min
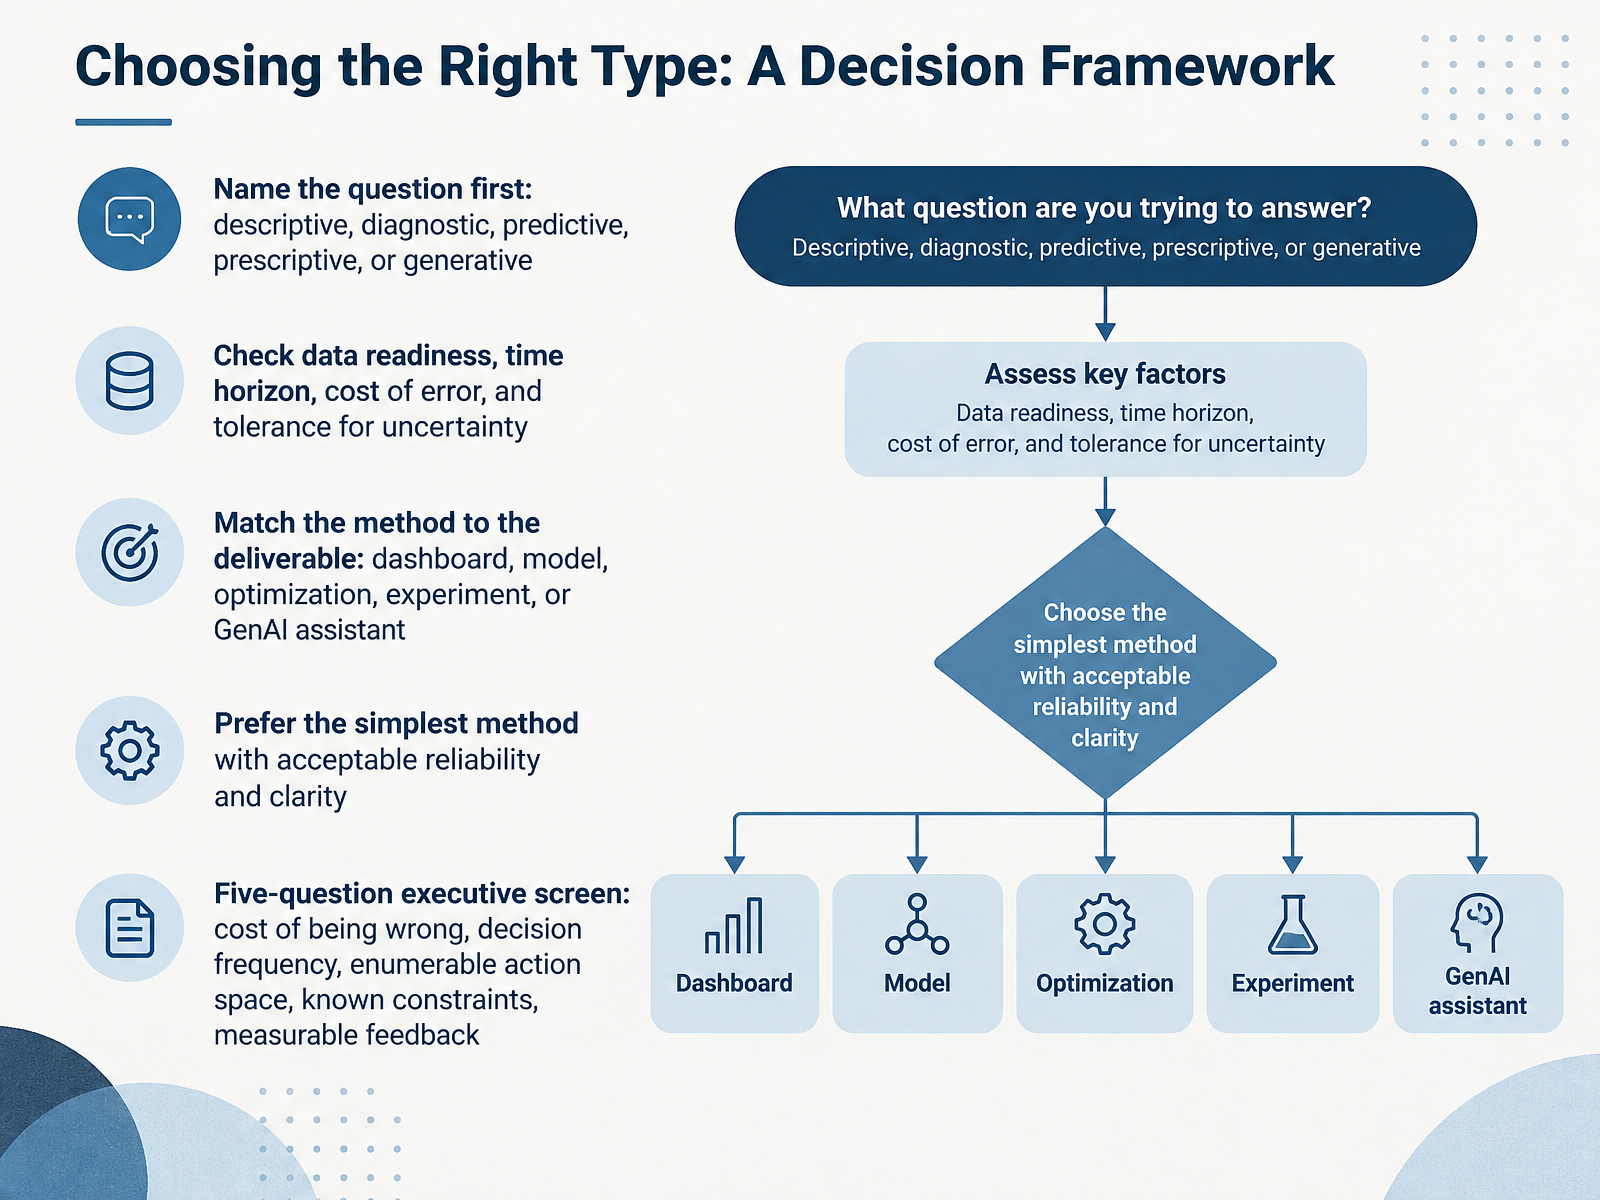
- 11Choosing the Right Type: A Decision FrameworkSo how do you actually choose among these types? Start by naming the question. Is it descriptive, asking what happened? Diagnostic, asking why? Predictive, asking what may happen next? Prescriptive, asking what action to take? Or generative, asking the model to create or summarize content? Then check four practical things: data readiness, your time horizon, the cost of being wrong, and your tolerance for uncertainty. Next, match the method to the deliverable. A dashboard fits descriptive work. A model fits prediction. Optimization fits prescription. An experiment fits causal questions. And a GenAI assistant fits generative or conversational tasks. Here is the principle I would underline: prefer the simplest method with acceptable reliability and clarity. Complexity is not a business outcome. For a quick executive screen, ask five questions. What is the cost of being wrong? How often is the decision made? Can the action space be enumerated? Do we know the constraints? And can outcomes be measured and fed back? If the last three answers are no, build observability and prediction first. Now let's look at who does what, in Roles and Skill Expectations Across the Types.
 infinisynapse.comthoughtspot.comtechtarget.com+22 min
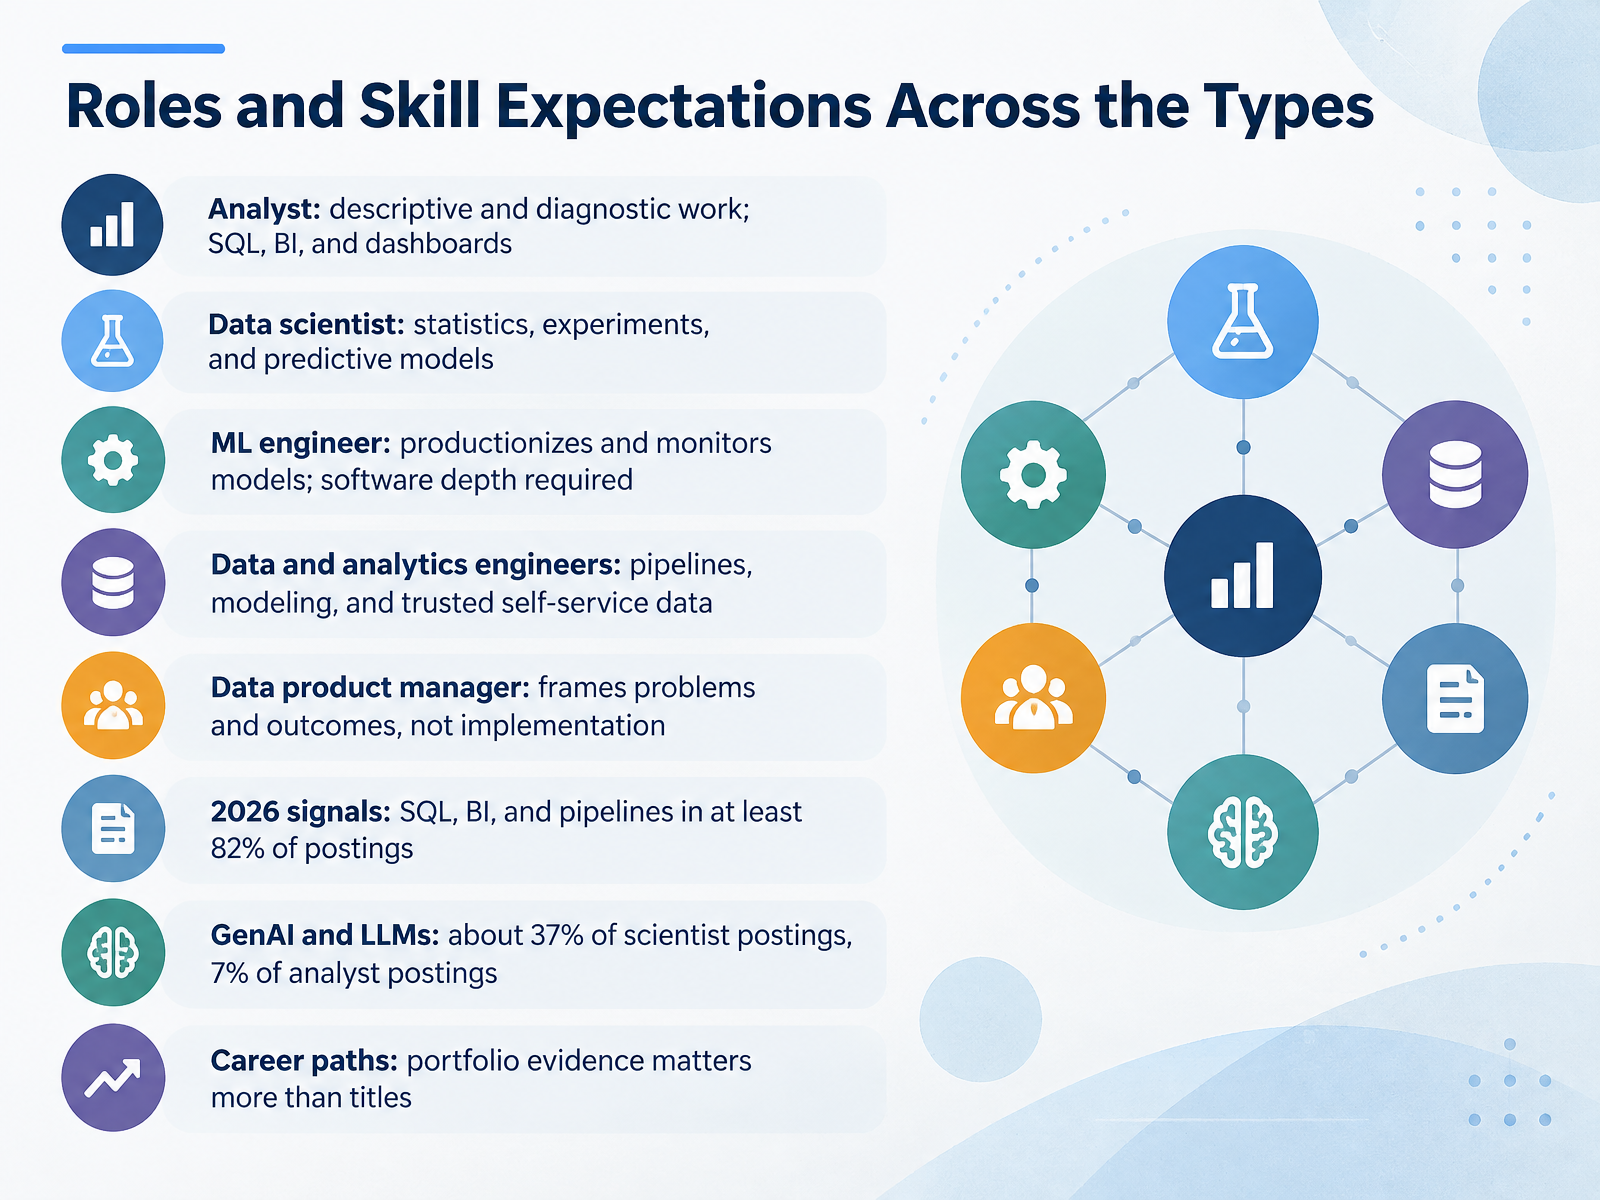
- 12Roles and Skill Expectations Across the TypesLet's connect the types to the people who do the work. An analyst handles descriptive and diagnostic questions, using SQL, business intelligence tools, and dashboards. A data scientist leans on statistics, experiments, and predictive models. An ML engineer, meaning machine learning engineer, takes those models into production and monitors them, which demands real software depth. Data and analytics engineers build pipelines, data models, and trusted self-service data. And a data product manager frames problems and outcomes, not implementation. Overlapping titles can be confusing, so focus on the work behind the title. In twenty twenty six postings, SQL, BI, and pipelines appear in at least eighty two percent of roles. Gen AI and LLMs show up in about thirty seven percent of data scientist postings, but only seven percent for analysts. So when you map these onto your own projects, portfolio evidence matters more than titles. That brings us to the next slide, Applying the Map: Misapplied Methods and Their Consequences.
 techtarget.com1 min
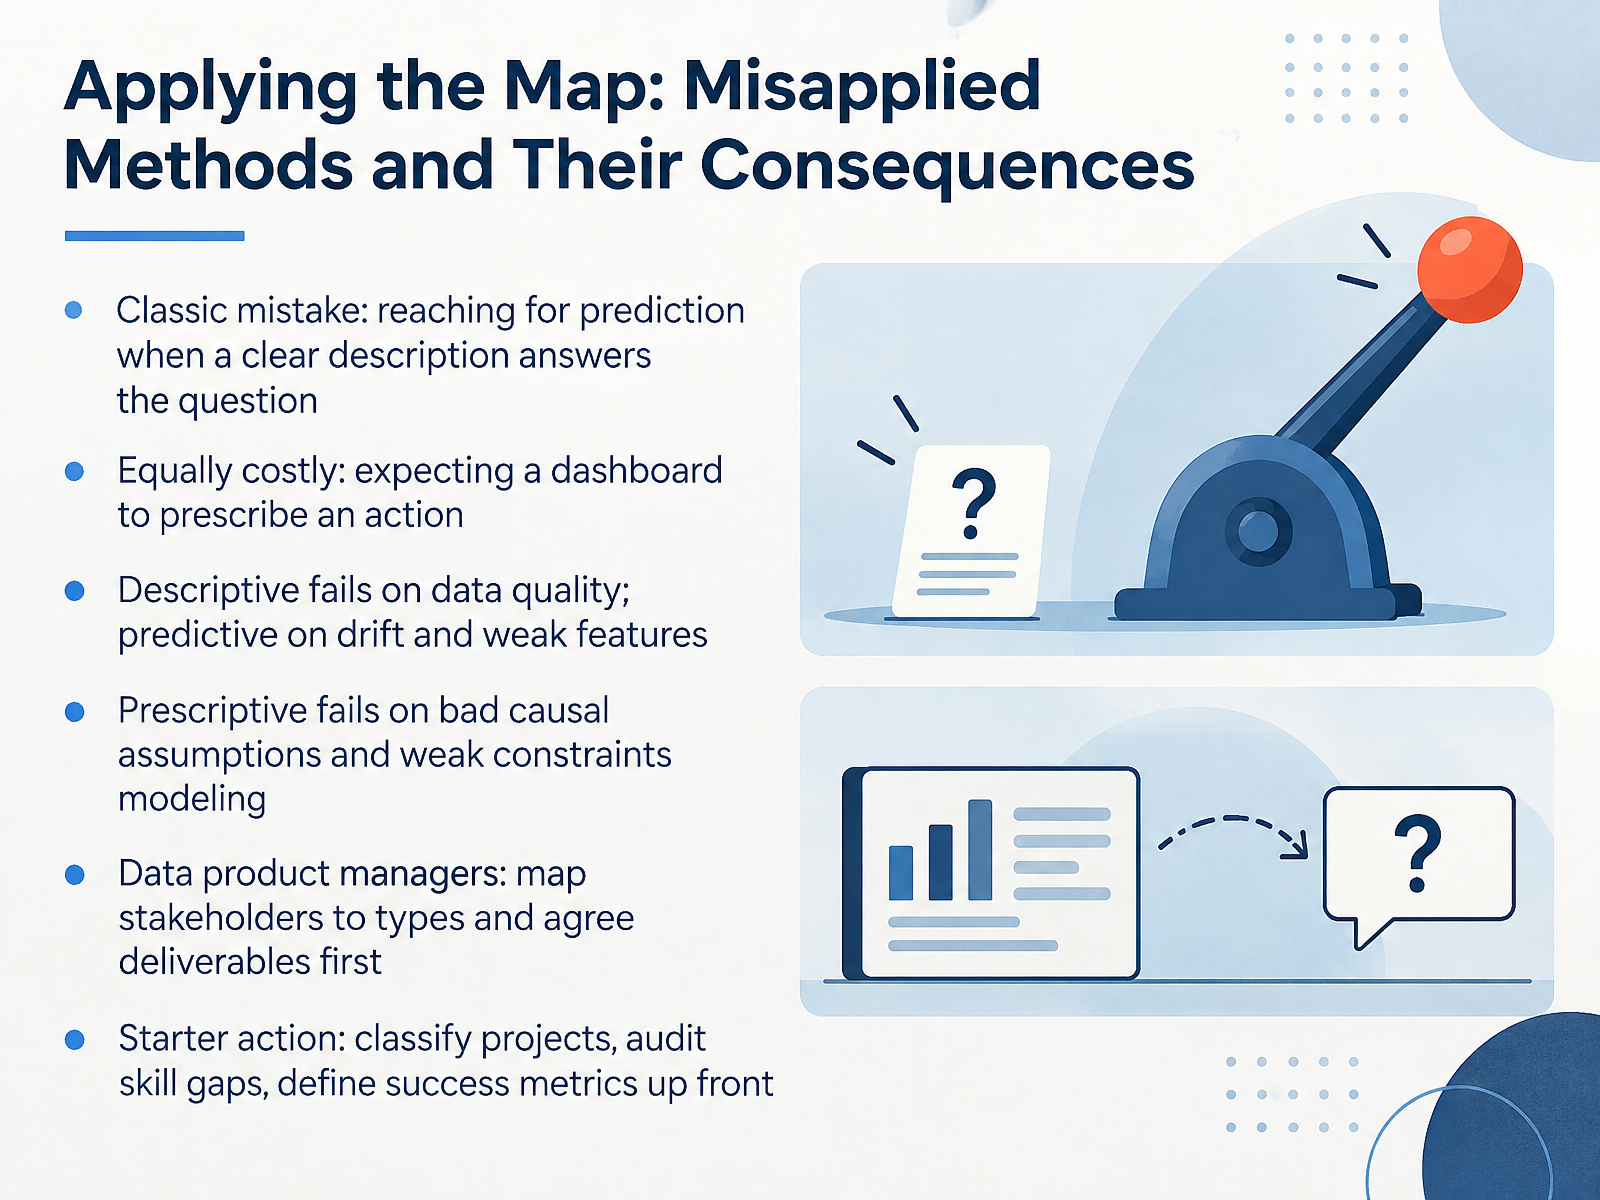
- 13Applying the Map: Misapplied Methods and Their ConsequencesNow let's talk about what happens when methods get misapplied, because that is where these categories stop being abstract. A classic mistake is reaching for prediction when a clear description already answers the question. If your team just needs to know what happened last quarter, a solid report will do. The equally costly flip side is expecting a dashboard to prescribe an action. A dashboard shows you the numbers. It does not tell you what to do next. Each type also has its own failure mode. Descriptive work fails on data quality. Predictive work fails on drift and weak features. Prescriptive work fails on bad causal assumptions and weak constraints modeling. So if you are a data product manager, map your stakeholders to types, and agree on deliverables before any modeling starts. And here is a starter action. Classify your current projects by type, audit the skill gaps, and define success metrics up front. That simple habit prevents most of these mistakes. Next, we'll pull this together in Key Takeaways and Next Steps for Each Audience.
 infinisynapse.comthoughtspot.comamplitude.com+22 min
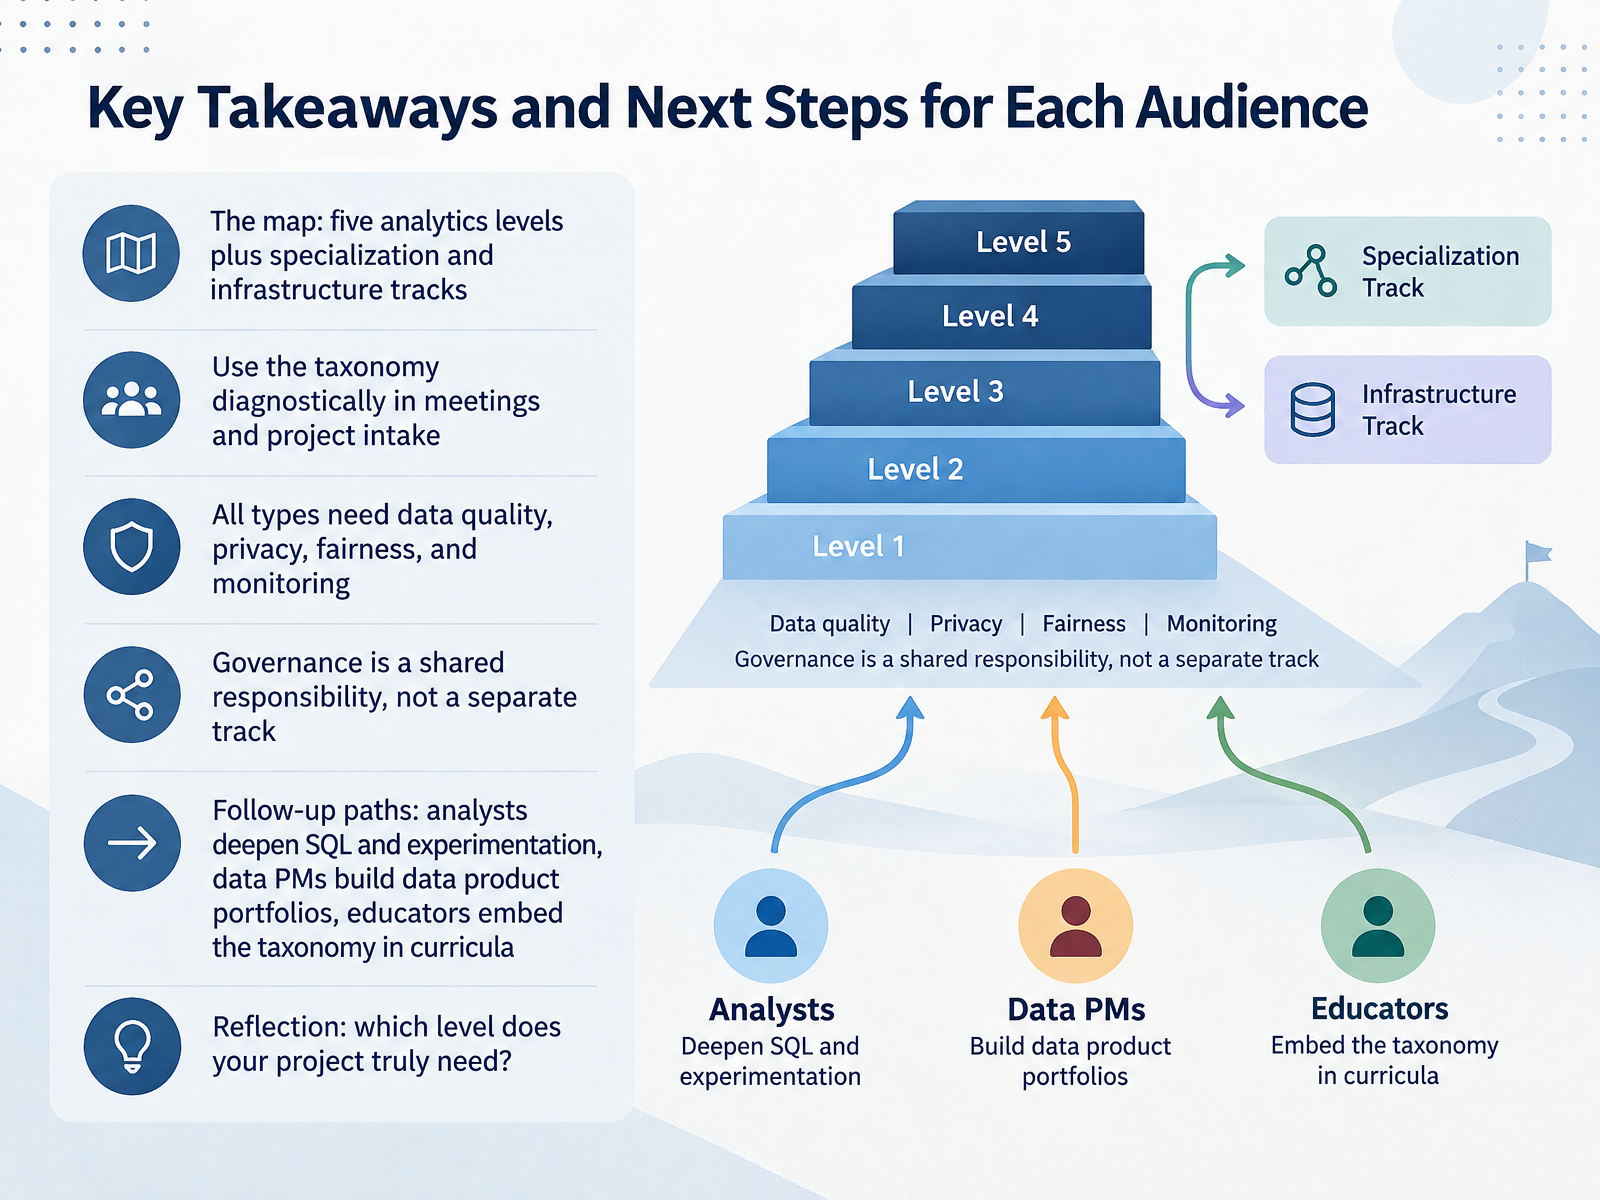
- 14Key Takeaways and Next Steps for Each AudienceAs we close, here is your map. Five analytics levels, from descriptive through diagnostic, predictive, prescriptive, and decision support, plus specialization and infrastructure tracks. Use this taxonomy diagnostically. In meetings and project intake, ask which level the decision actually needs before someone reaches for a model. And remember, every type depends on data quality, privacy, fairness, and ongoing monitoring. Governance is a shared responsibility, not a separate track. For follow-up paths, analysts can deepen SQL and experimentation, data product managers can build portfolios of shipped data products, and educators can embed the taxonomy in curricula. Here is your reflection question: which level does your project truly need? Thank you for joining this course. Keep mapping, keep asking that question, and you will choose the right work with confidence.
 infinisynapse.com1 min
Take the deck with you
Download this course as a file — free, no sign-up needed.
- PDF handoutEvery slide page, ready to print or share.15 pages · 3.5 MBDownload
- Narrated PowerPointThe deck that presents itself — every slide carries the digital human's narration video.15 pages · 15.3 MBDownload
- PowerPoint slidesThe full deck as a .pptx — open it in PowerPoint, Keynote, or Google Slides.15 pages · 3.5 MBDownload
Free to use in your own training — please keep the PersonWise credit page at the end.
Have your own deck? Turn it into a course
Sources consulted
Web sources consulted while building this course.
- Data Science: A Systematic Treatment — export.arxiv.org
- Understanding the differences: data science, data analytics, and machine learning — School of Data Science — datascience.virginia.edu
- Defining data roles when scaling data culture - Adyen — adyen.com
- Data engineers, data scientists and data analysts explained | TechTarget — techtarget.com
- Data Engineering vs. Data Science vs. Machine Learning Engineering | Course Report — coursereport.com
- Analytics Maturity Model: Where Does Your Team Sit? | ThoughtSpot — thoughtspot.com
- How to improve analytics maturity | TechTarget — techtarget.com
- From Descriptive to Prescriptive: A Step-by-Step Guide to the Alteryx Analytics Maturity Model - Alteryx — alteryx.com
- The Analytics & AI Maturity Canvas from Datentreiber — datentreiber.com
- The AIOps Journey: The Analytics Maturity Curve, Extended – MyYearInData — myyearindata.com
- Diagnostic Analytics? Benefits, Techniques, and Examples — thoughtspot.com
- What is Diagnostic Analytics? A Quick Guide with Examples — amplitude.com
- Data Analysis Methodology: Choosing the Right Method — skopx.com
- SaaS Churn Analysis: Finding the Real Reasons Customers Leave — peppereffect.com
- Data-Driven Churn Diagnostics: Pinpointing Feature Performance Bottlenecks Before Users Drop · Prodstack — prod-stack.ai
- AI Analytics: Complete Guide to AI-Powered BI [2026] — sumboard.io
- What Is AI Analytics? | IBM — ibm.com
- AI for Data Analysis: Best Practices for Descriptive, Diagnostic, Predictive, and Prescriptive Analytics — wisdom.ai
- The 4 Types of Data Analysis (2026 Guide) — infinisynapse.com
- Types of Data Analytics: 4 Categories + When to Use Them — domo.com