Learning and Development Metrics
Begin
13 pages · ~26 min
Learning and Development Metrics
This training teaches HR and L&D professionals how to measure and interpret learning and development metrics to evaluate training effectiveness and business impact.
What you’ll learn
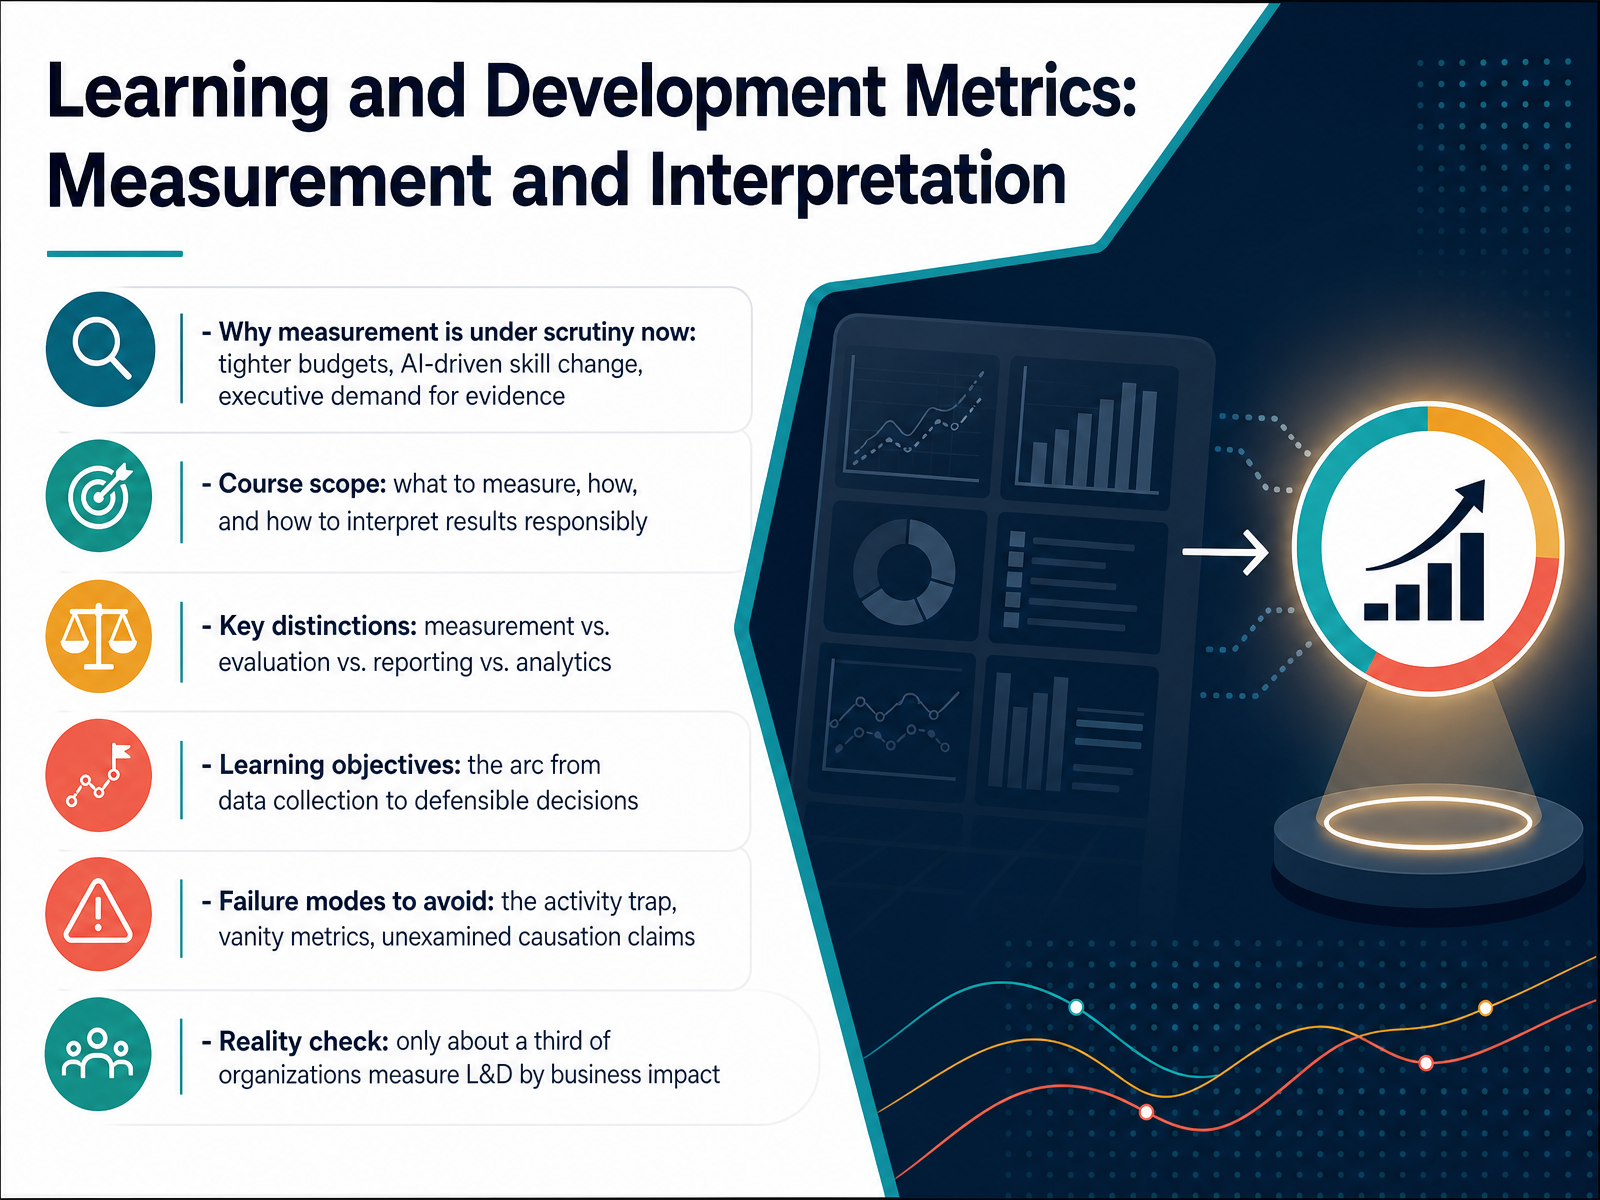
- 01Learning and Development Metrics: Measurement and InterpretationWelcome. Over the next few slides, we will sharpen how your team measures learning and development, and how you interpret what the numbers actually say. Measurement is under real scrutiny right now. Budgets are tighter, AI is reshaping the skills you need, and executives want evidence, not activity. So here is our goal for this course. We will cover what to measure, how to measure it, and how to interpret results responsibly. First, a few distinctions worth holding onto. Measurement is collecting data. Evaluation is judging value. Reporting is communicating. Analytics is finding patterns across all of it. They are not the same job. We will also map the arc from data collection to defensible decisions, and we will name the failure modes to avoid. The activity trap. Vanity metrics. And causation claims you cannot support. One reality check to frame everything: only about a third of organizations measure learning and development by business impact. That gap is your opportunity. Let's start with why the activity trap persists, and what it costs.nanolms.aitalaera.comtrainingindustry.com+22 min
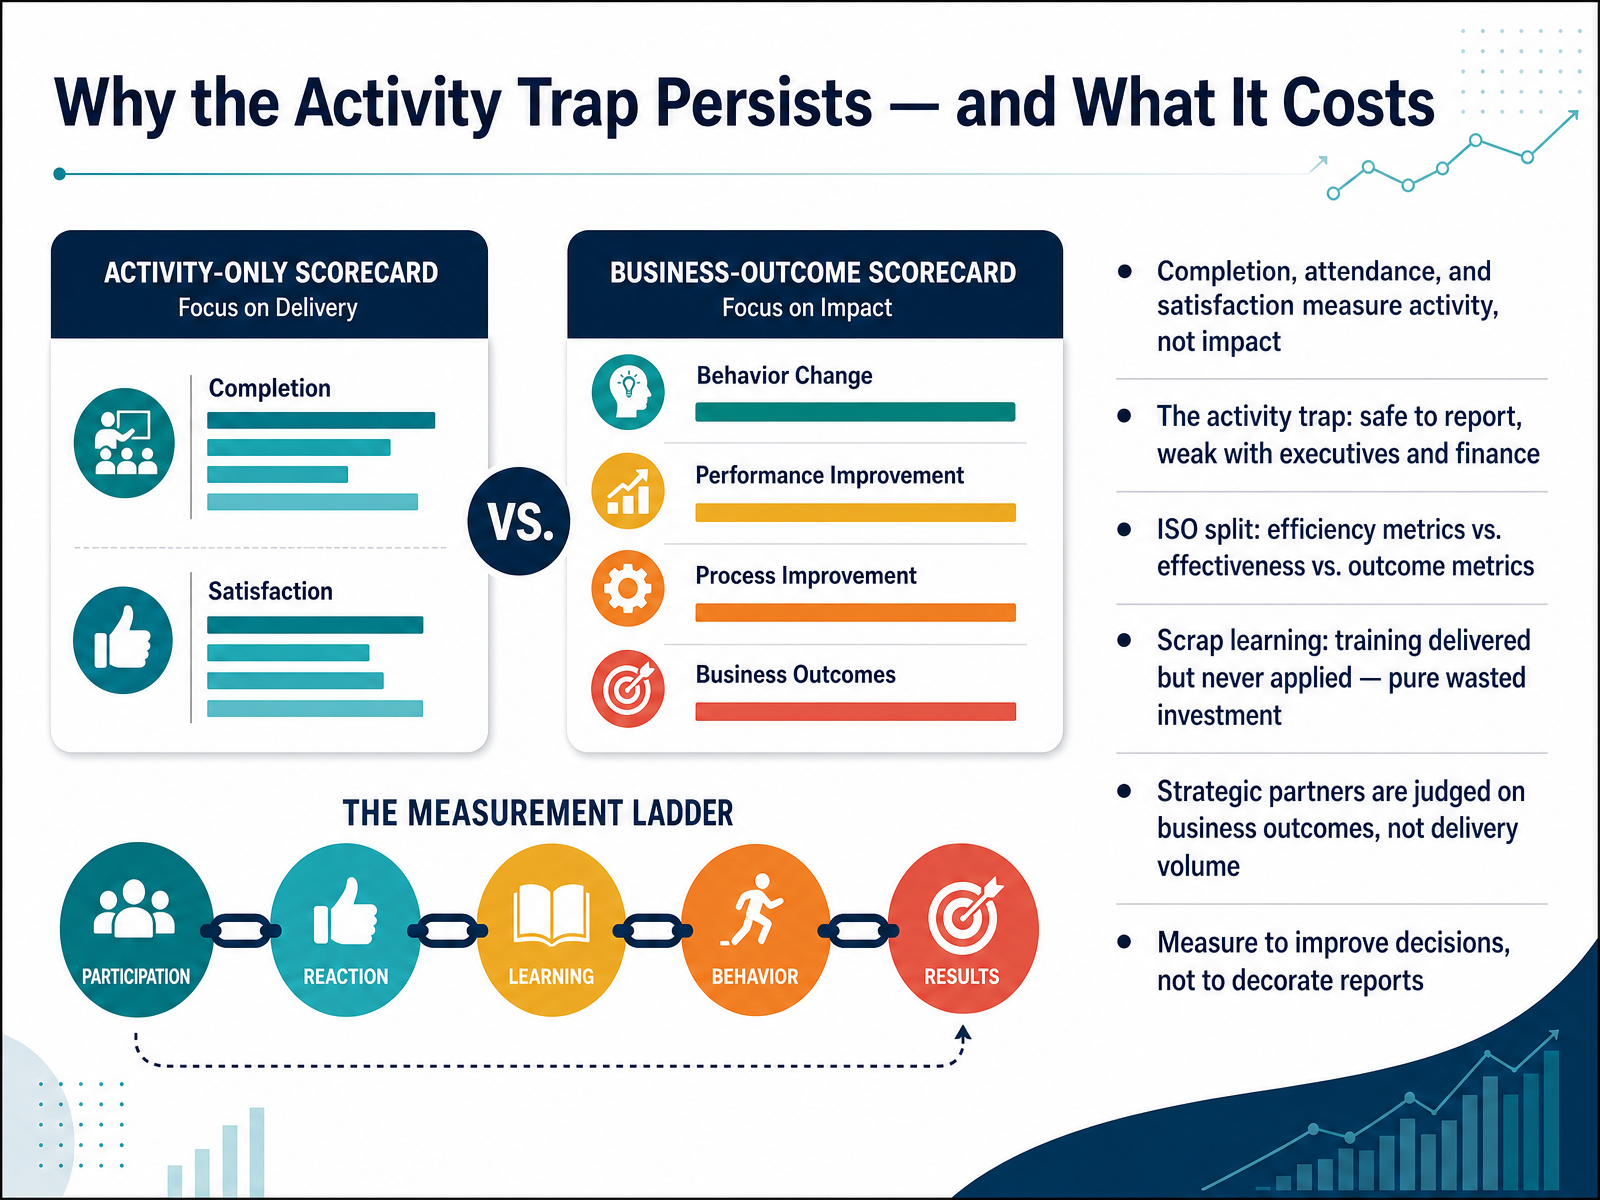
- 02Why the Activity Trap Persists — and What It CostsLet's talk about why the activity trap persists, and what it costs you. Completion, attendance, and satisfaction measure activity, not impact. They're safe to report, but they land weakly with executives and finance. The ISO standards split metrics into three categories: efficiency, which counts activity like completions and cost; effectiveness, which covers reactions, knowledge, and behavior change; and outcome metrics, tied to revenue, retention, risk, and productivity. There's also scrap learning, training delivered but never applied. That is pure wasted investment, calculated as total cost multiplied by the share of learners who didn't apply the skills. Strategic partners are judged on business outcomes, not delivery volume. So measure to improve decisions, not to decorate reports. That shift in purpose changes which numbers earn a place in front of you. Next, frameworks that still hold: Kirkpatrick, Phillips, and ROE.
 nanolms.aitalaera.comtrainingindustry.com+21 min
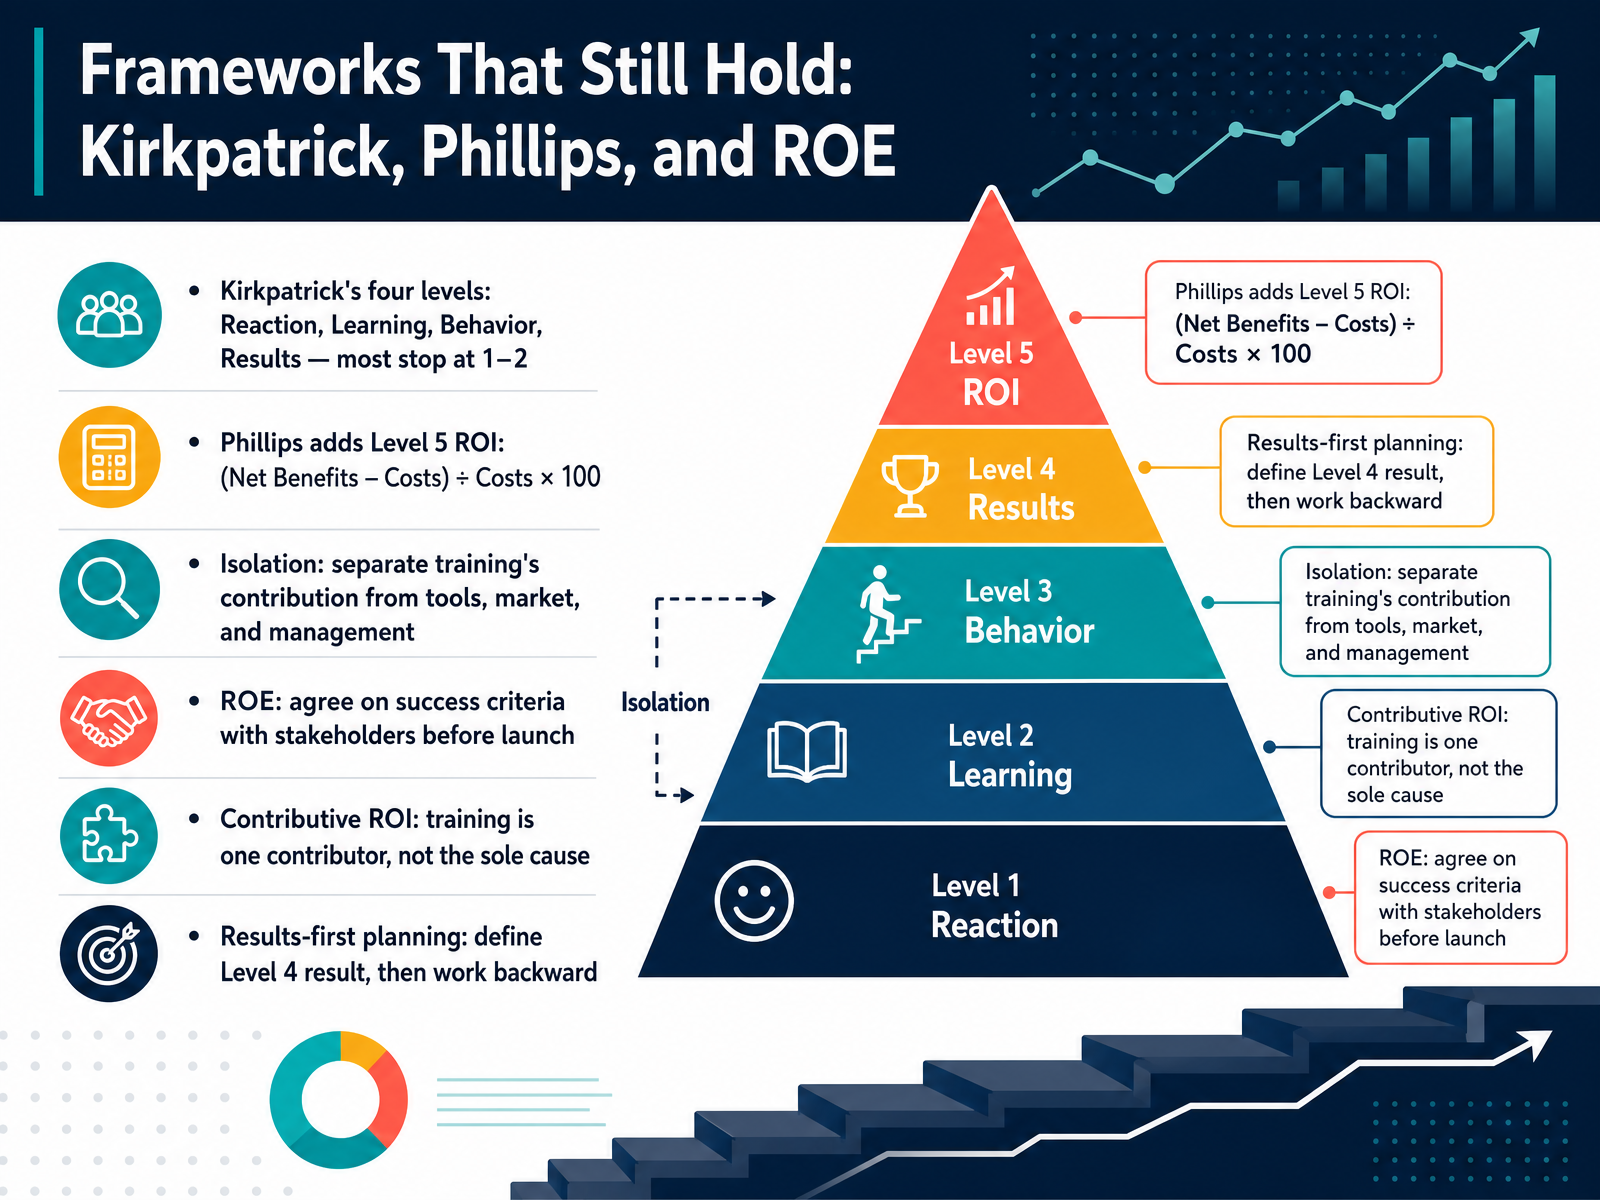
 - 03Frameworks That Still Hold: Kirkpatrick, Phillips, and ROENow let's look at the frameworks that still hold up, and how to choose between them. Kirkpatrick gives you four levels: Reaction, Learning, Behavior, and Results. Most teams stop at one and two, which tells you people showed up and passed the quiz, not that anything changed on the job.
Phillips adds a fifth level: ROI, calculated as net benefits minus costs, divided by costs, times one hundred. The formula is easy. The hard part is isolation, separating training's contribution from the new tool, the market shift, or a management change.
That's where Return on Expectations and contributive ROI come in. ROE means agreeing on success criteria with stakeholders before launch. Contributive ROI treats training as one contributor, not the sole cause. When the data allow, plan results-first: define the Level four result, then work backward to behavior, learning, and engagement.
The takeaway: pick a framework, but commit to the conversation before the program, not the calculation after.
Next, The Measurement Landscape: From Participation to Business Value.
 nanolms.aitalaera.comtrainingindustry.com+22 min
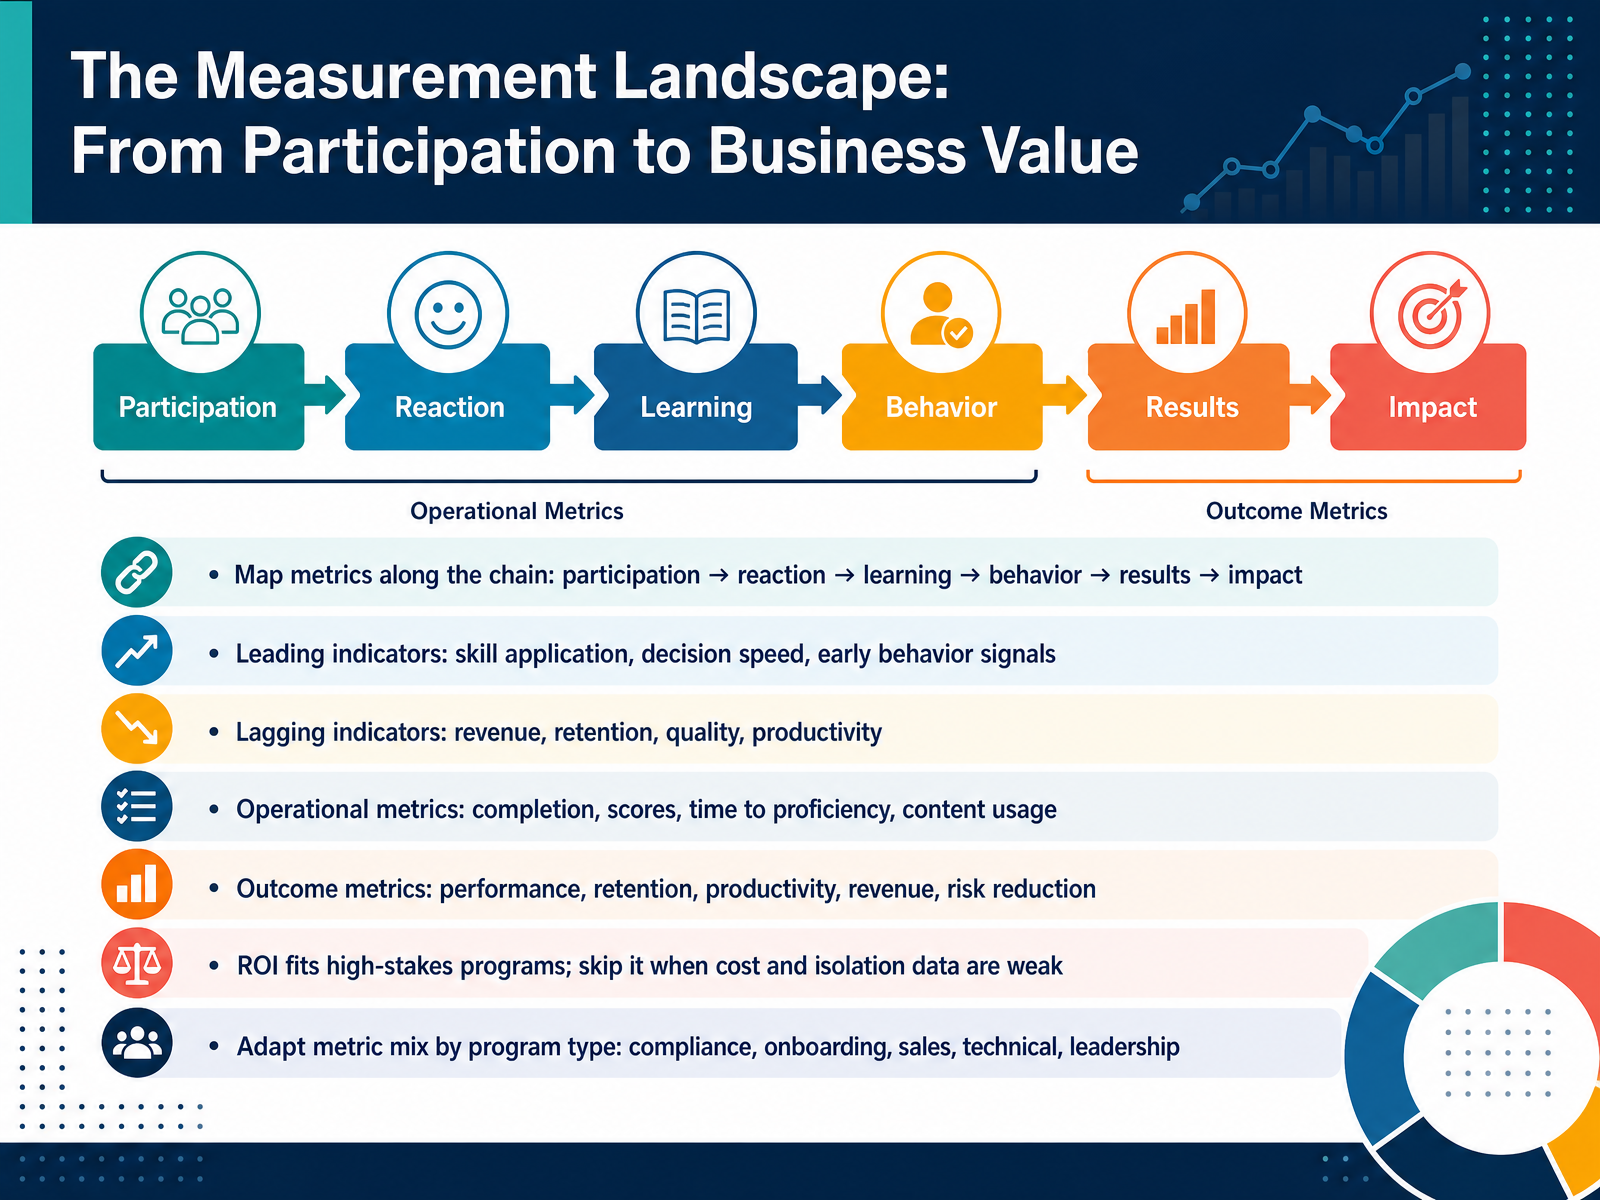
 - 04The Measurement Landscape: From Participation to Business ValueLet's map the measurement landscape, from participation all the way to business value. Picture a chain. It starts with participation, then reaction, learning, behavior, results, and impact. Each link answers a different question. Participation tells you who showed up. Behavior tells you whether anything changed on the job. Now, two signals you will use constantly. Leading indicators show up early, like skill application, faster decisions, or early behavior signals. Lagging indicators confirm value later, such as revenue, retention, quality, and productivity. Then there are operational metrics: completion, scores, time to proficiency, content usage. Useful for running programs, but weak as evidence of value. Outcome metrics are the ones executives actually track. ROI fits high-stakes programs, and skip it when cost or isolation data are weak. Finally, adapt your metric mix by program type, whether that's compliance, onboarding, sales, technical, or leadership. That brings us to selecting metrics. Next up, Selecting Metrics: Business Questions, Baselines, and Targets.
 nanolms.aitalaera.comtrainingindustry.com+22 min
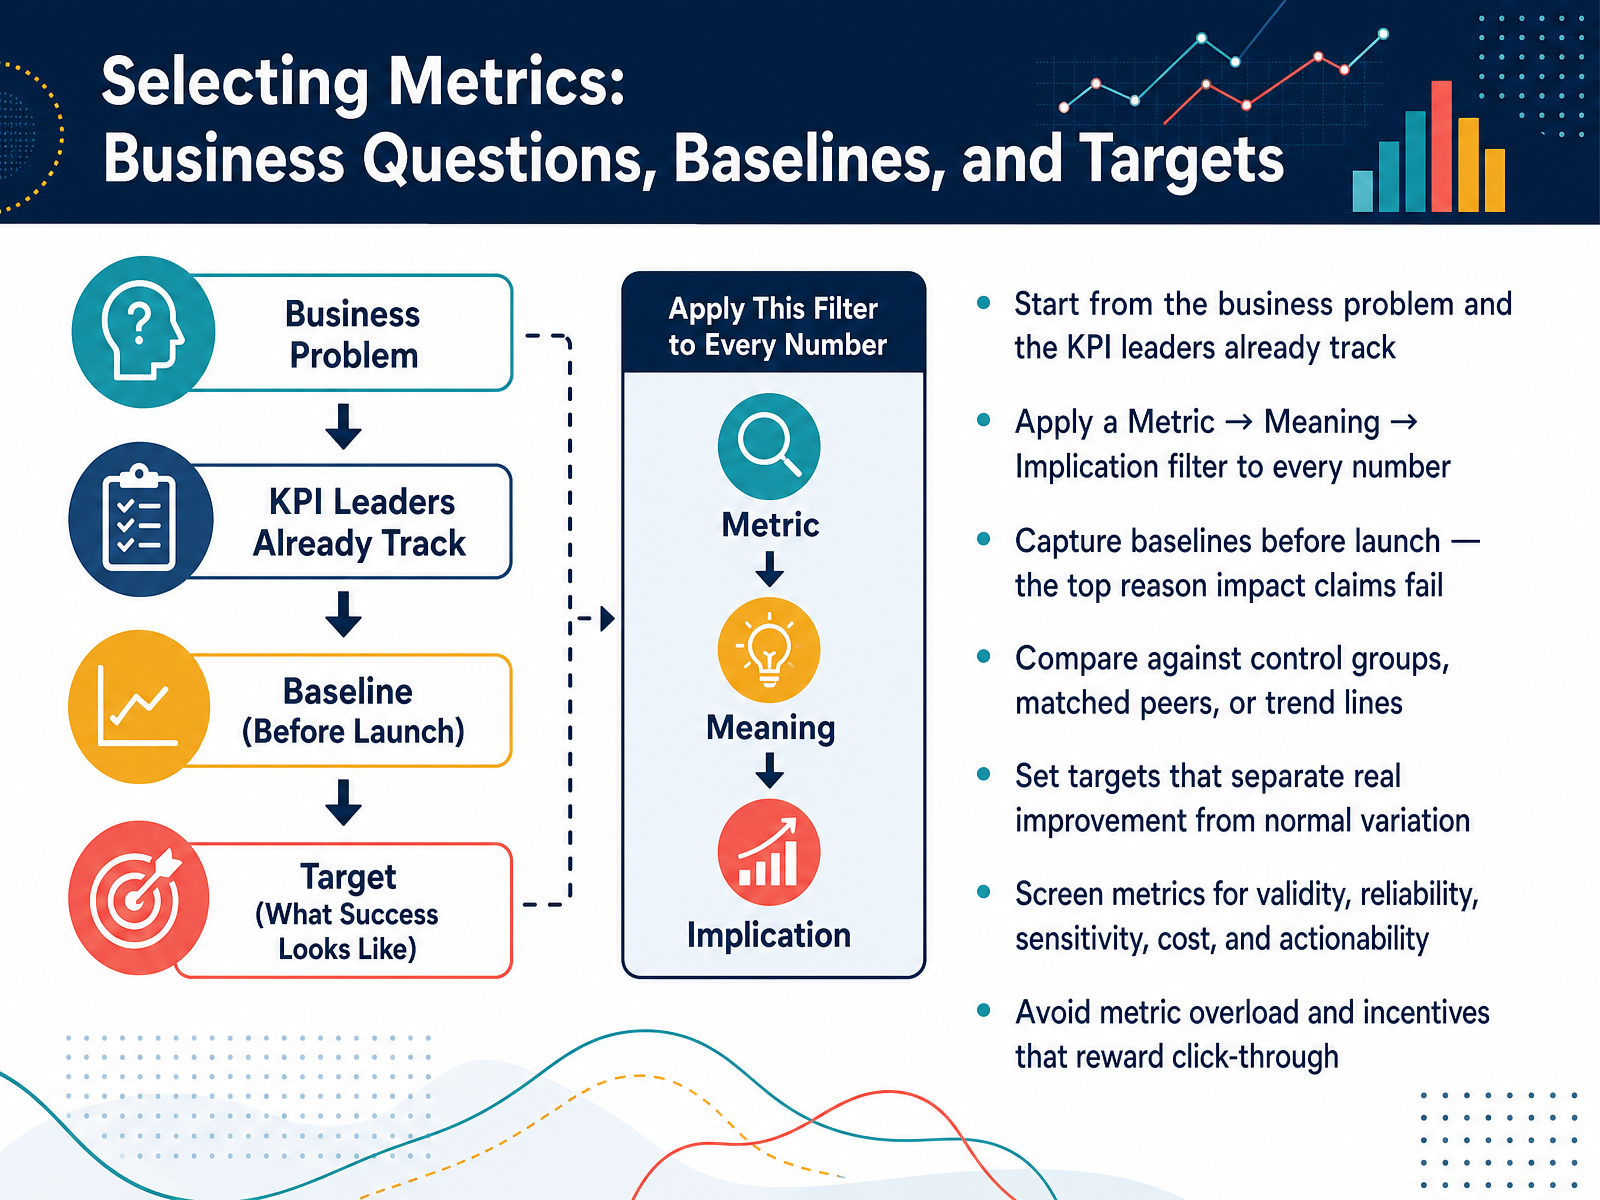
 - 05Selecting Metrics: Business Questions, Baselines, and TargetsLet's talk about selecting metrics, because this is where most measurement strategies succeed or fail. Start from the business problem, not the course. What KPI do your leaders already track? Build your measurement plan around that. Then run every number through a simple filter: Metric, Meaning, Implication. What did you measure, what does it signal, and what should leadership do about it? Next, capture baselines before launch. This is the top reason impact claims fail, because you cannot prove a change without a starting point. When you compare results, use control groups, matched peers, or trend lines, so you separate real improvement from normal variation. Screen each metric for validity, reliability, sensitivity, cost, and actionability. And avoid metric overload. Too many numbers dilute the story, and incentives tied to click-through reward activity, not outcomes. Next, we will look at data sources and measurement methods.
 nanolms.aitalaera.comtrainingindustry.com+22 min
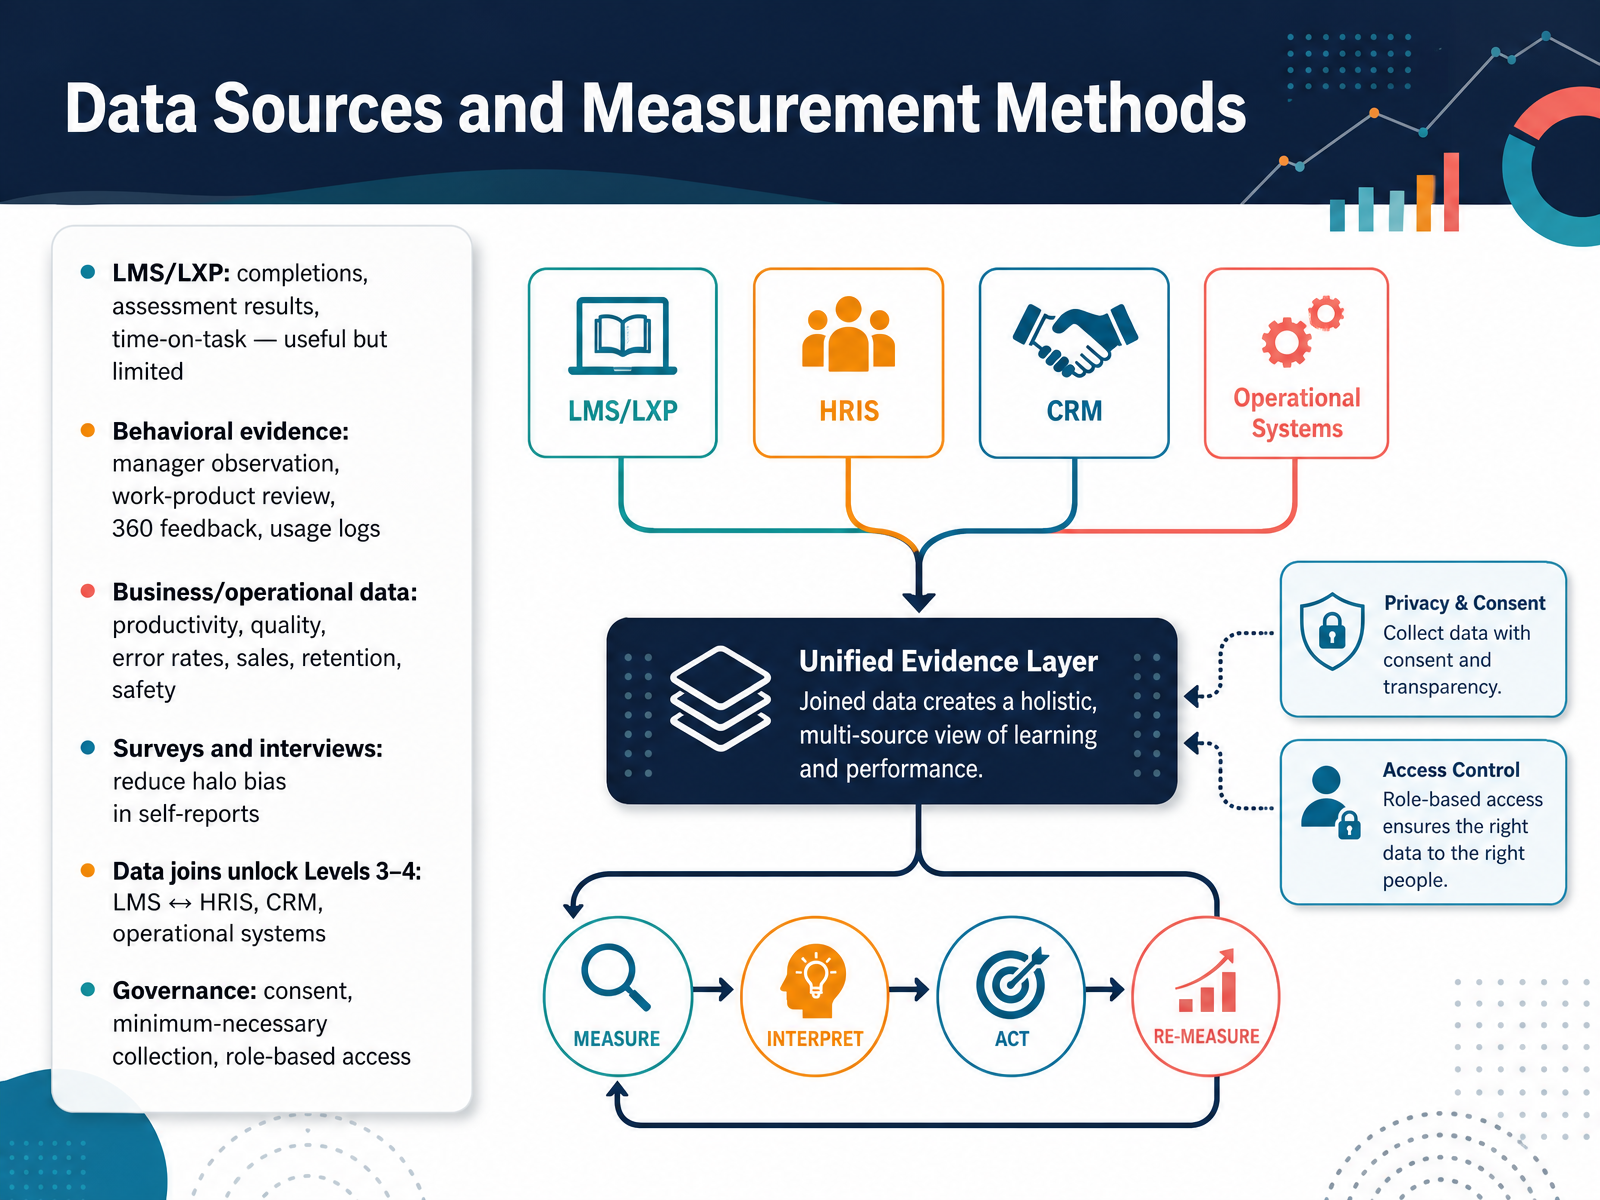
 - 06Data Sources and Measurement MethodsLet's look at where your evidence actually comes from, and how far each source can take you. LMS and LXP data gives you completions, assessment results, and time on task. It's easy to pull, and it's genuinely useful, but it's limited. Completion tells you someone showed up, not that anything changed on the job. Behavioral evidence gets you closer. Manager observation, work product review, three sixty feedback, and usage logs show whether skills are being applied. Then there's business and operational data: productivity, quality, error rates, sales, retention, safety. This is what your executives already track. Surveys and interviews still have a place, especially for reducing halo bias in self-reports. The real unlock is joining data across systems. When you link your LMS to your HRIS, your CRM, or operational systems, Levels Three and Four become measurable rather than aspirational. And one non-negotiable: governance. Consent, minimum necessary collection, and role-based access aren't paperwork. They're what keeps your analytics credible. With your sources mapped, the harder question is what the numbers actually mean. That brings us to interpreting evidence: correlation, causation, and confounders.
 nature.comdoi.orgdoi.org+22 min
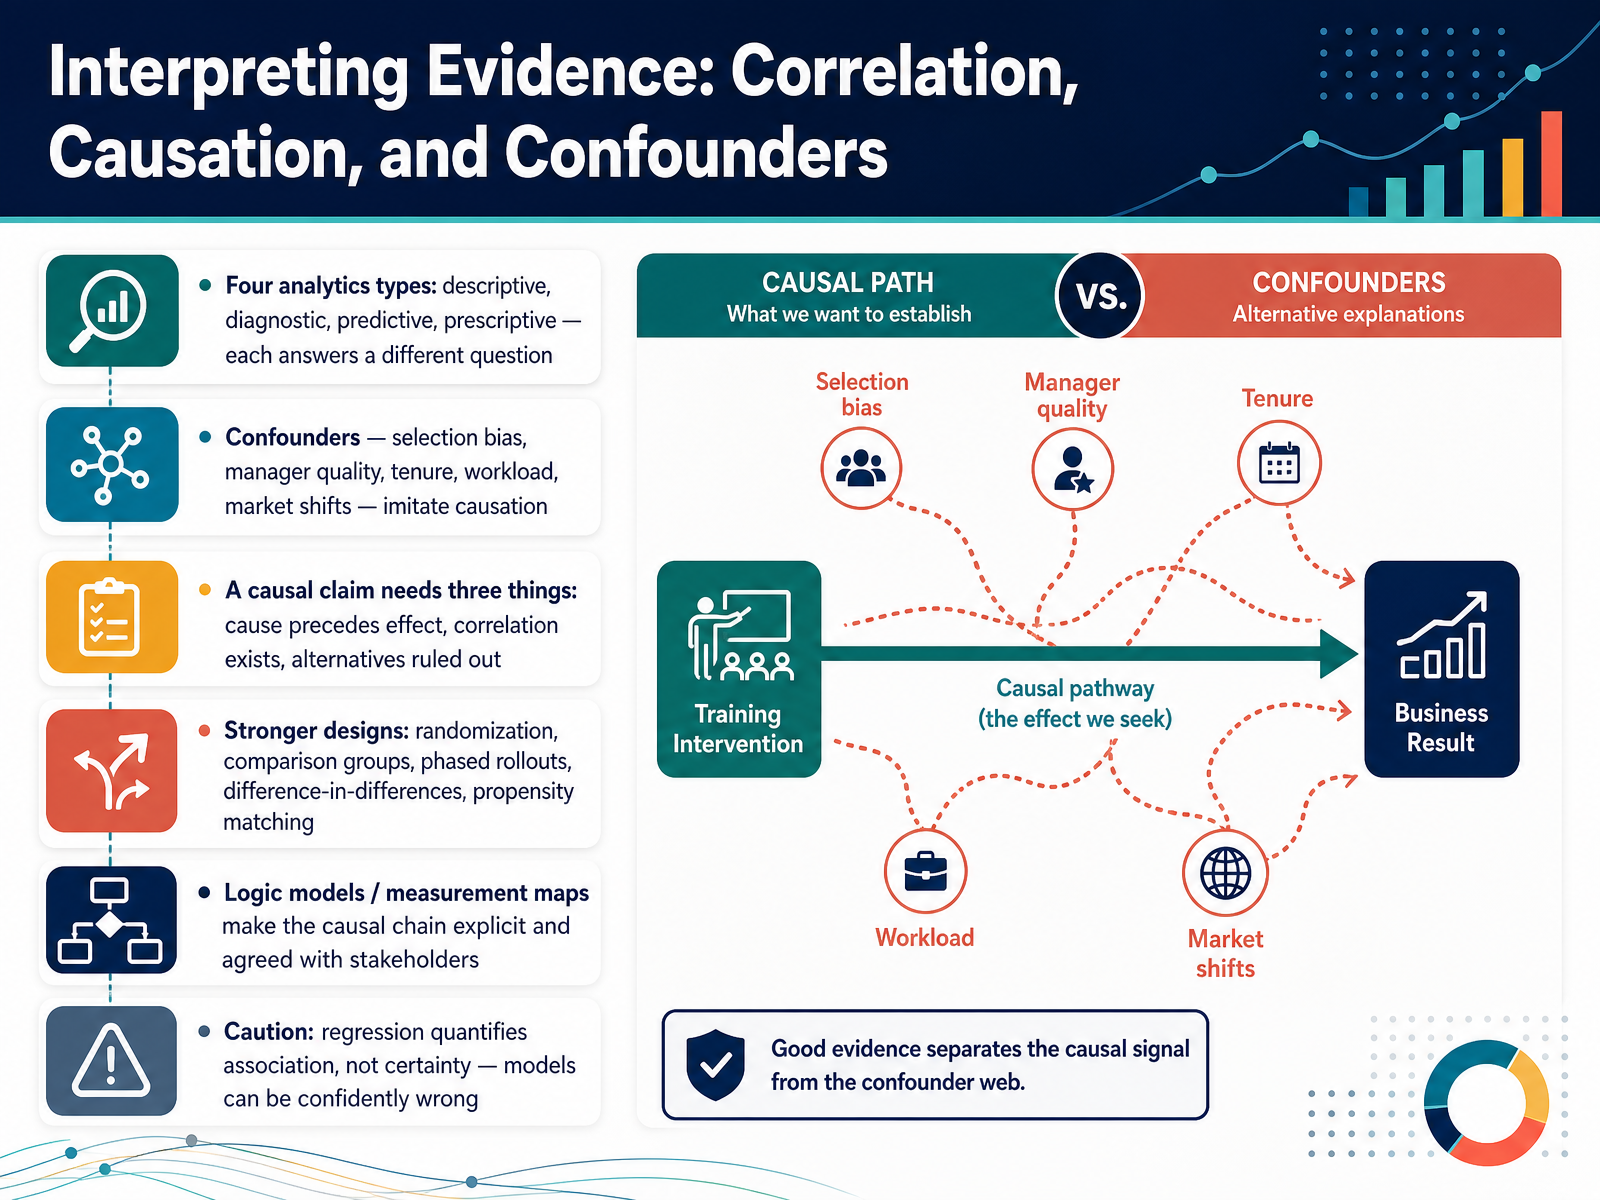
 - 07Interpreting Evidence: Correlation, Causation, and ConfoundersNow, let's sharpen how you interpret evidence. Start with the four analytics types. Descriptive answers what happened, diagnostic answers why, predictive answers what comes next, and prescriptive answers what to do about it. Each answers a different question, so know which one you actually need. Then watch for confounders. Selection bias, manager quality, tenure, workload, market shifts. They imitate causation convincingly, and they are usually the reason a clean story falls apart under scrutiny. A causal claim needs three things. The cause precedes the effect. A correlation exists. And plausible alternatives are ruled out. The third one is where most L&D claims break. Stronger designs get you closer. Randomization, comparison groups, phased rollouts, difference-in-differences, propensity matching. Logic models and measurement maps make the causal chain explicit and agreed with stakeholders before you analyze anything. One caution. Regression quantifies association, not certainty. Models can be confidently wrong. So when you share results, match your language to the strength of your design. That is more credible, not less. Next, we look at making findings decision-ready through effect sizes, segments, and rules.
 sanalabs.comtrainingindustry.comldaccelerator.com+22 min
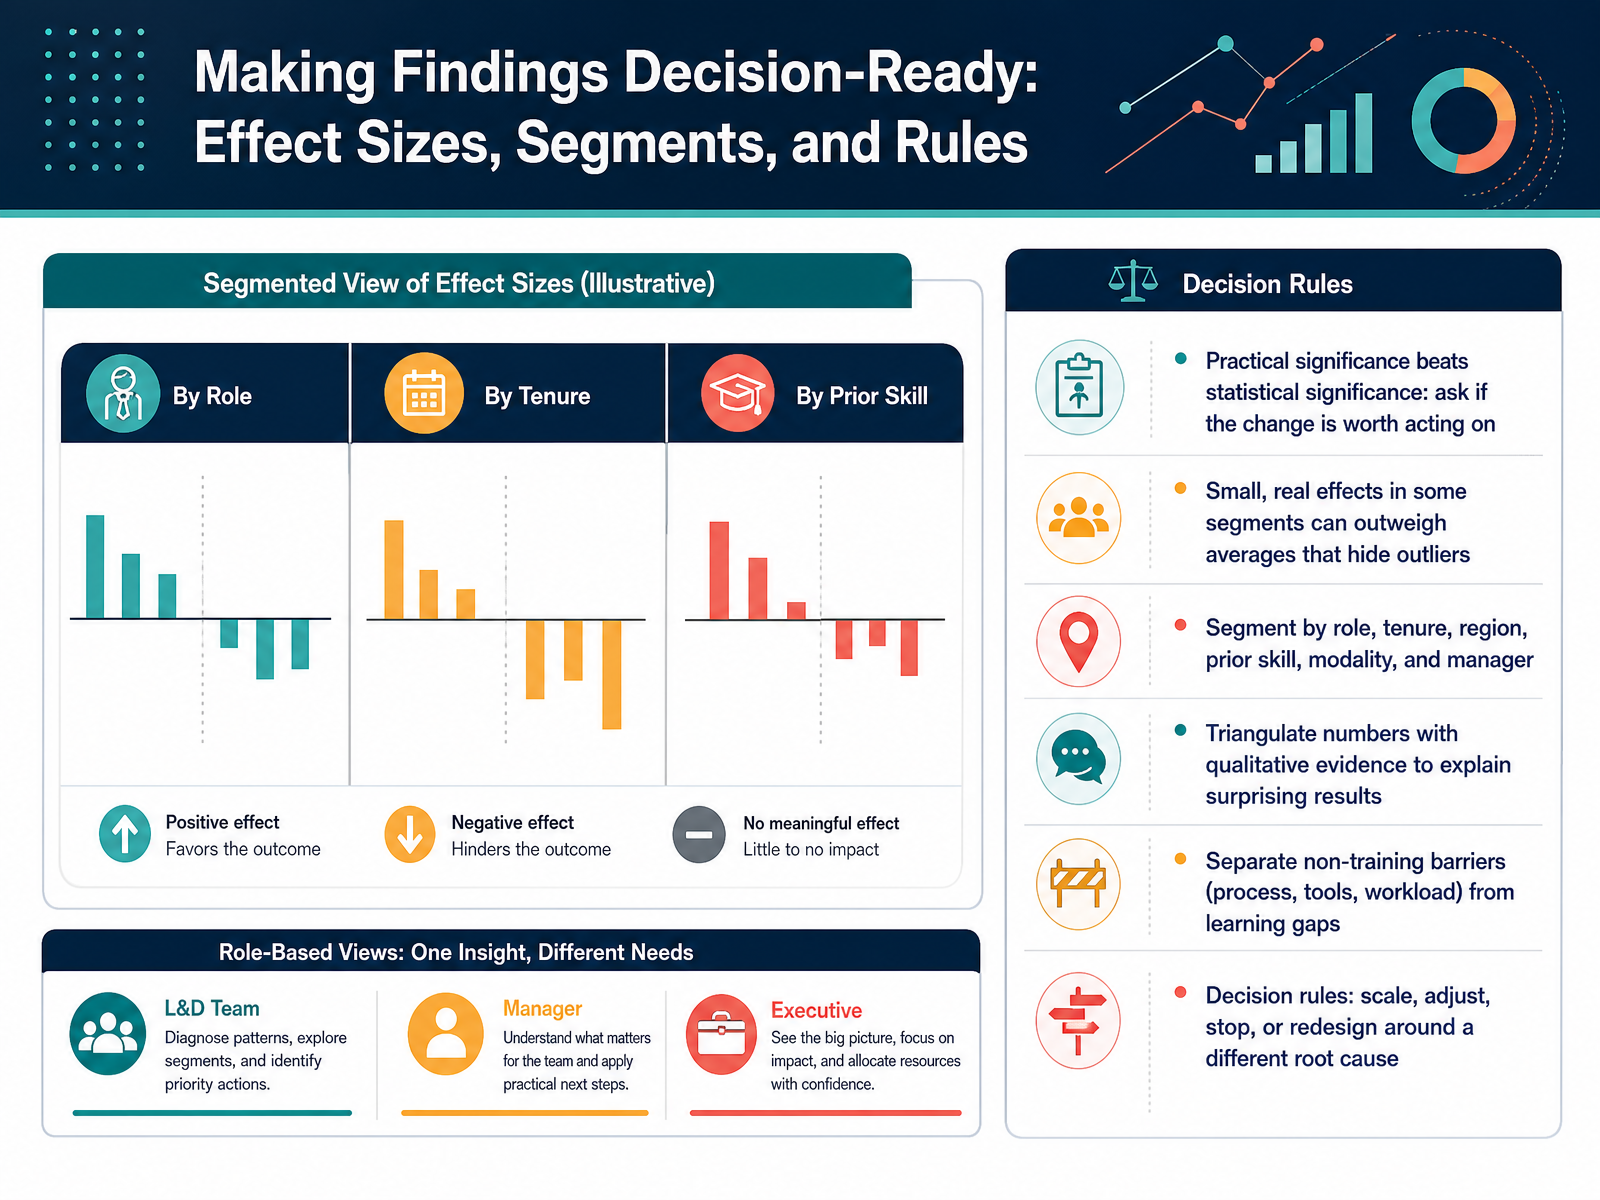
 - 08Making Findings Decision-Ready: Effect Sizes, Segments, and RulesNow let's make your findings decision ready. Start with practical significance over statistical significance: ask whether the change is big enough to justify action. A small but real effect in one segment can outweigh an average that hides outliers, so segment by role, tenure, region, prior skill, modality, and manager. Then triangulate the numbers with qualitative evidence; interviews and manager observations often explain surprising results. Crucially, separate non training barriers, like process, tools, or workload, from genuine learning gaps. That distinction changes your action. Finally, agree decision rules in advance: scale, adjust, stop, or redesign around a different root cause. A clear rule keeps the conversation about evidence and choices, not opinions. Next, we turn to reporting and communicating results to stakeholders.
 sanalabs.comtrainingindustry.comldaccelerator.com+21 min
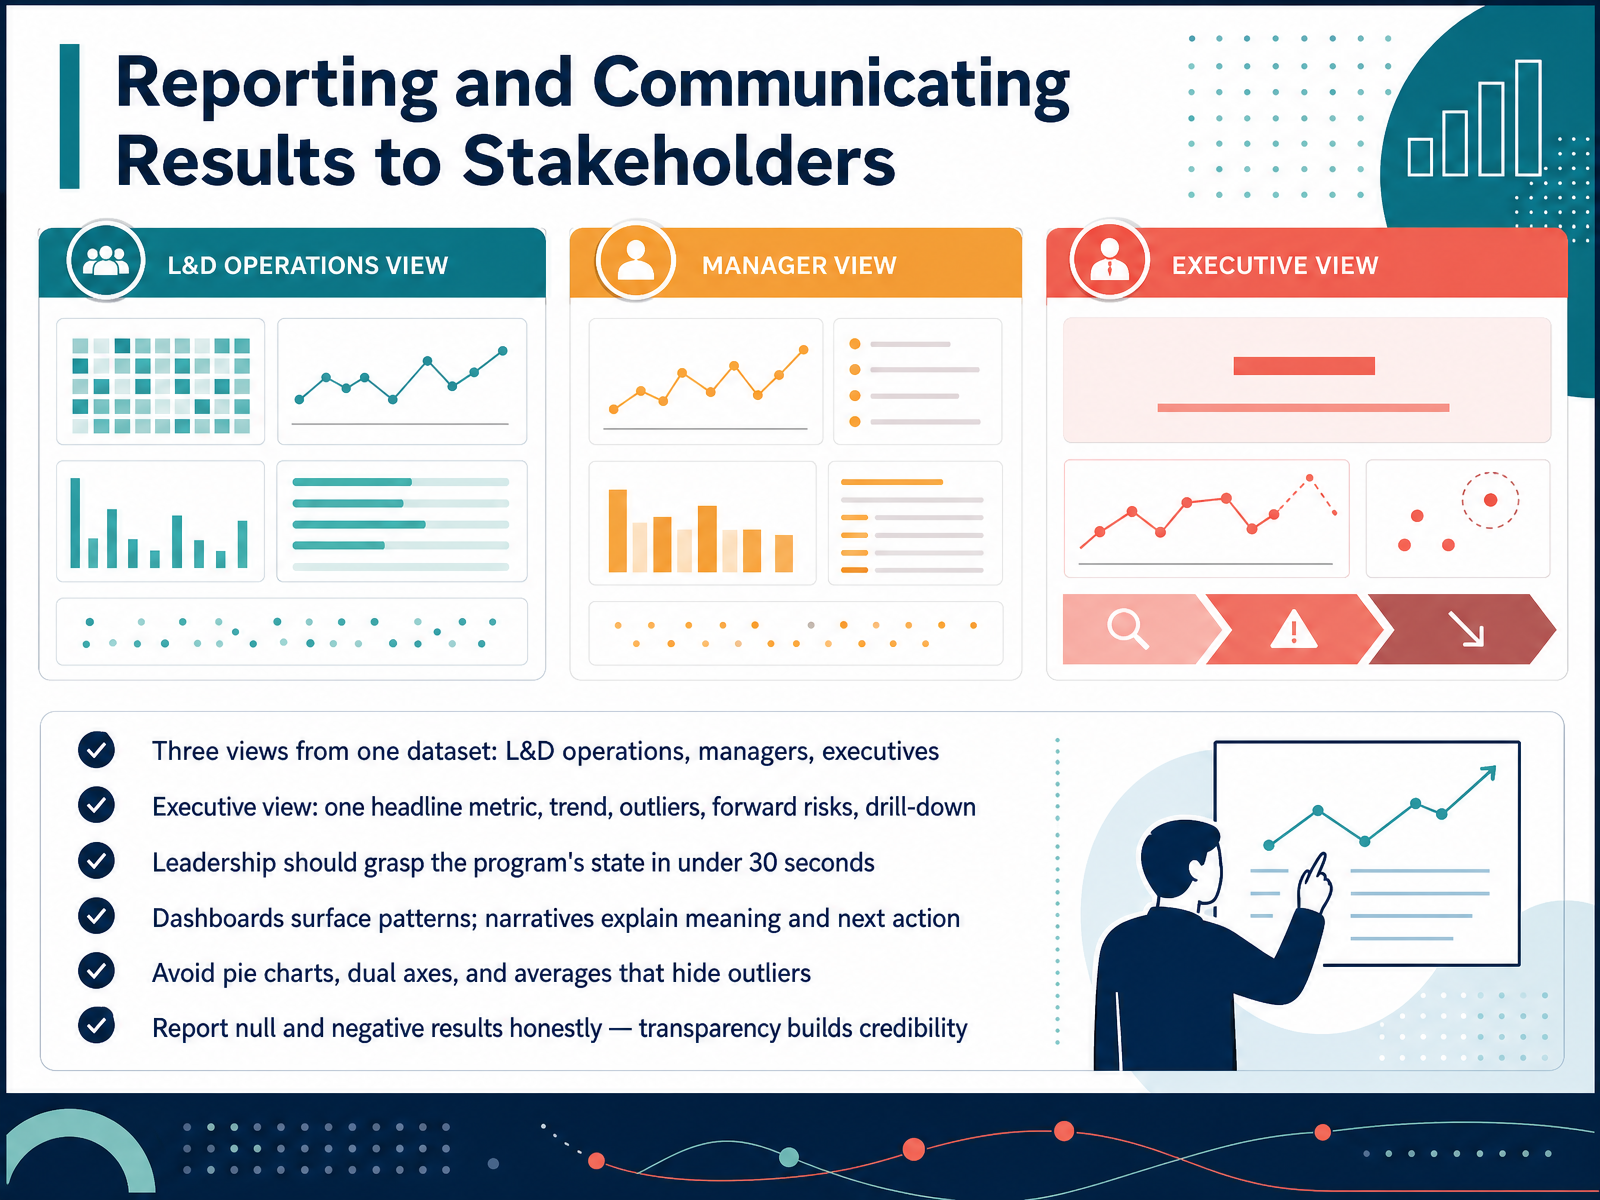
 - 09Reporting and Communicating Results to StakeholdersLet's move from measurement to reporting, and this is where good analysis often falls apart. One dataset, three views. Your operations team needs granular detail, managers need team-level trends, and executives need the business story. Resist the urge to send one dashboard to everyone. An effective executive view is tight: one headline metric tied to a business goal, a trend line, outliers by business unit, forward risks, and one click to drill down. The test is simple. Leadership should grasp the state of the program in under thirty seconds. Dashboards surface patterns, but narratives explain meaning and next action. Skip pie charts, dual axes, and company-wide averages that hide the outliers that matter most, like the one site at sixty percent compliance. And report null and negative results honestly. Transparency builds credibility, and it is the strongest argument for continued investment in measurement. Next, from insight to action: improving programs and learning transfer.
 alphalearningcentre.comcognota.comaquilonlms.com+22 min
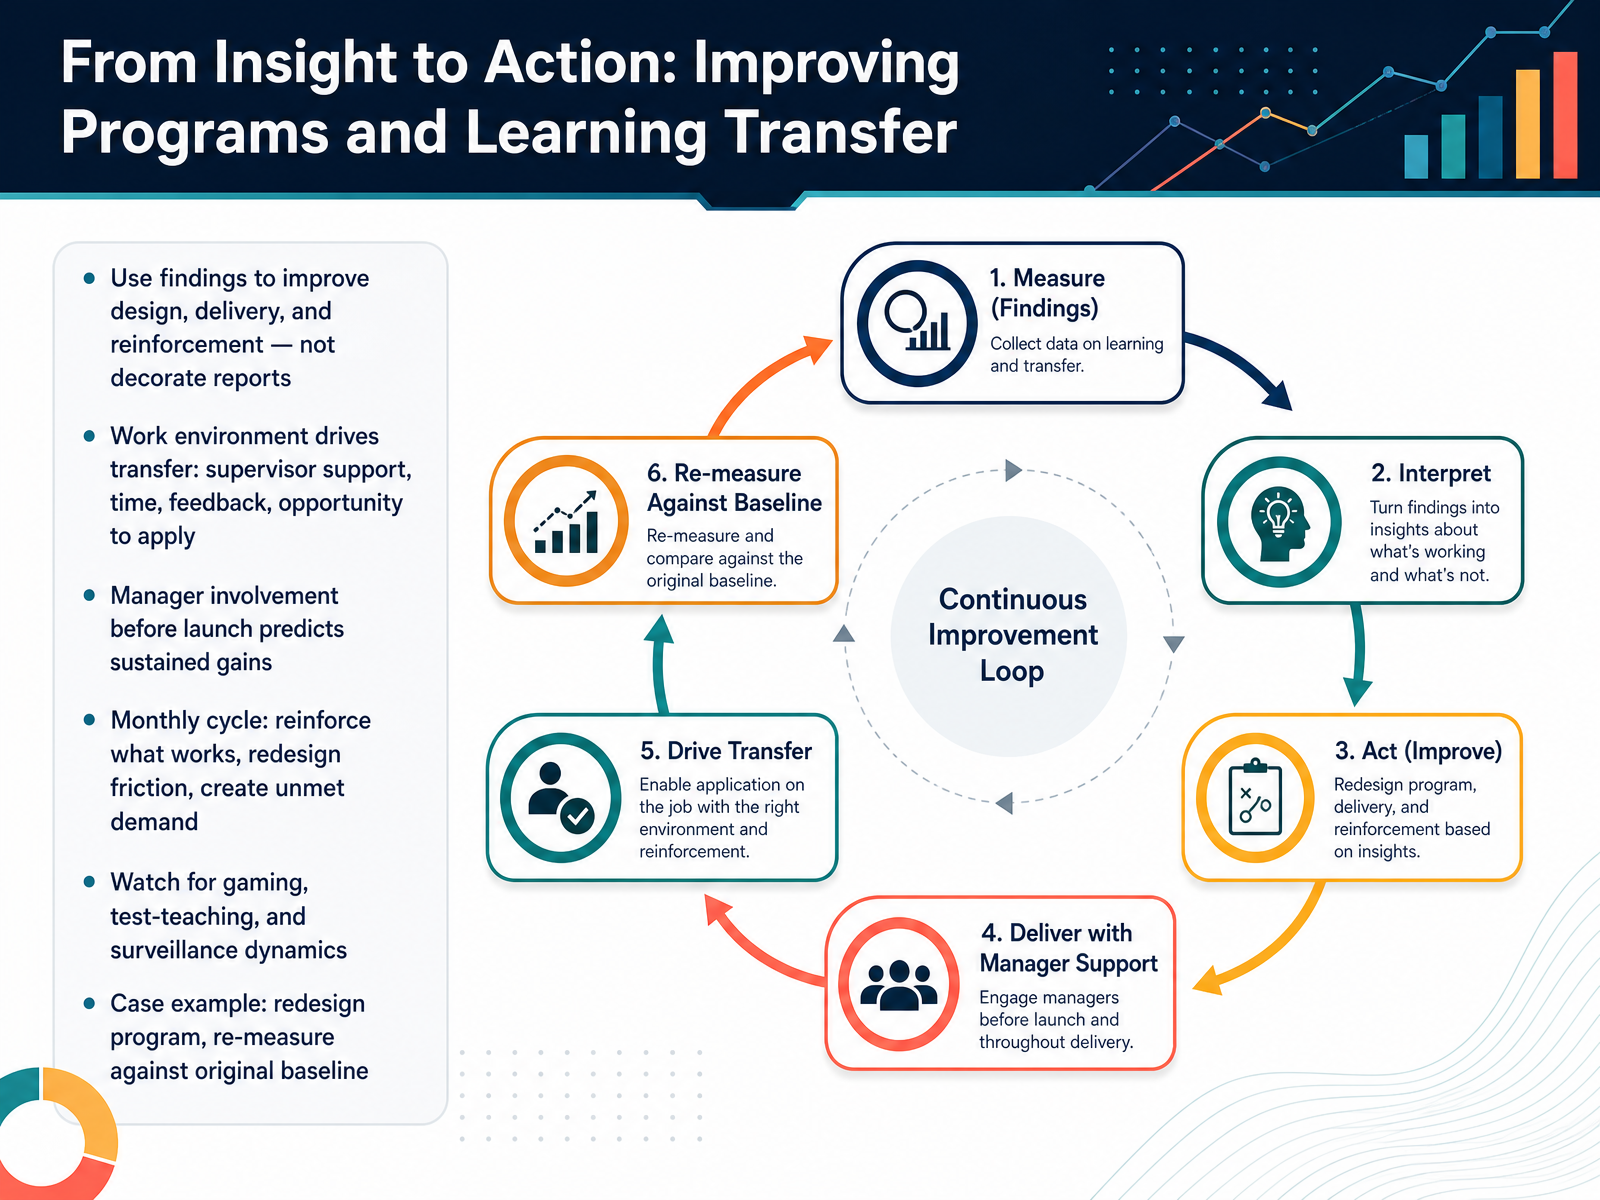
 - 10From Insight to Action: Improving Programs and Learning TransferLet's move from insight to action. Findings should improve design, delivery, and reinforcement. They should not decorate reports. Your work environment drives transfer: supervisor support, time, feedback, and real opportunity to apply what was learned. Manager involvement before launch typically predicts sustained gains, so bring supervisors in early. Run a monthly cycle. Reinforce what works, redesign the friction, and create demand where it is unmet. Watch for gaming, test-teaching, and surveillance dynamics. If metrics drive behavior, people will optimize for the metric. In one case, a team redesigned a program and re-measured against the original baseline. That comparison, not a new dashboard, showed what actually changed. Next, we turn to benchmarking, maturity, and governance.
 sanalabs.comtrainingindustry.comldaccelerator.com+22 min
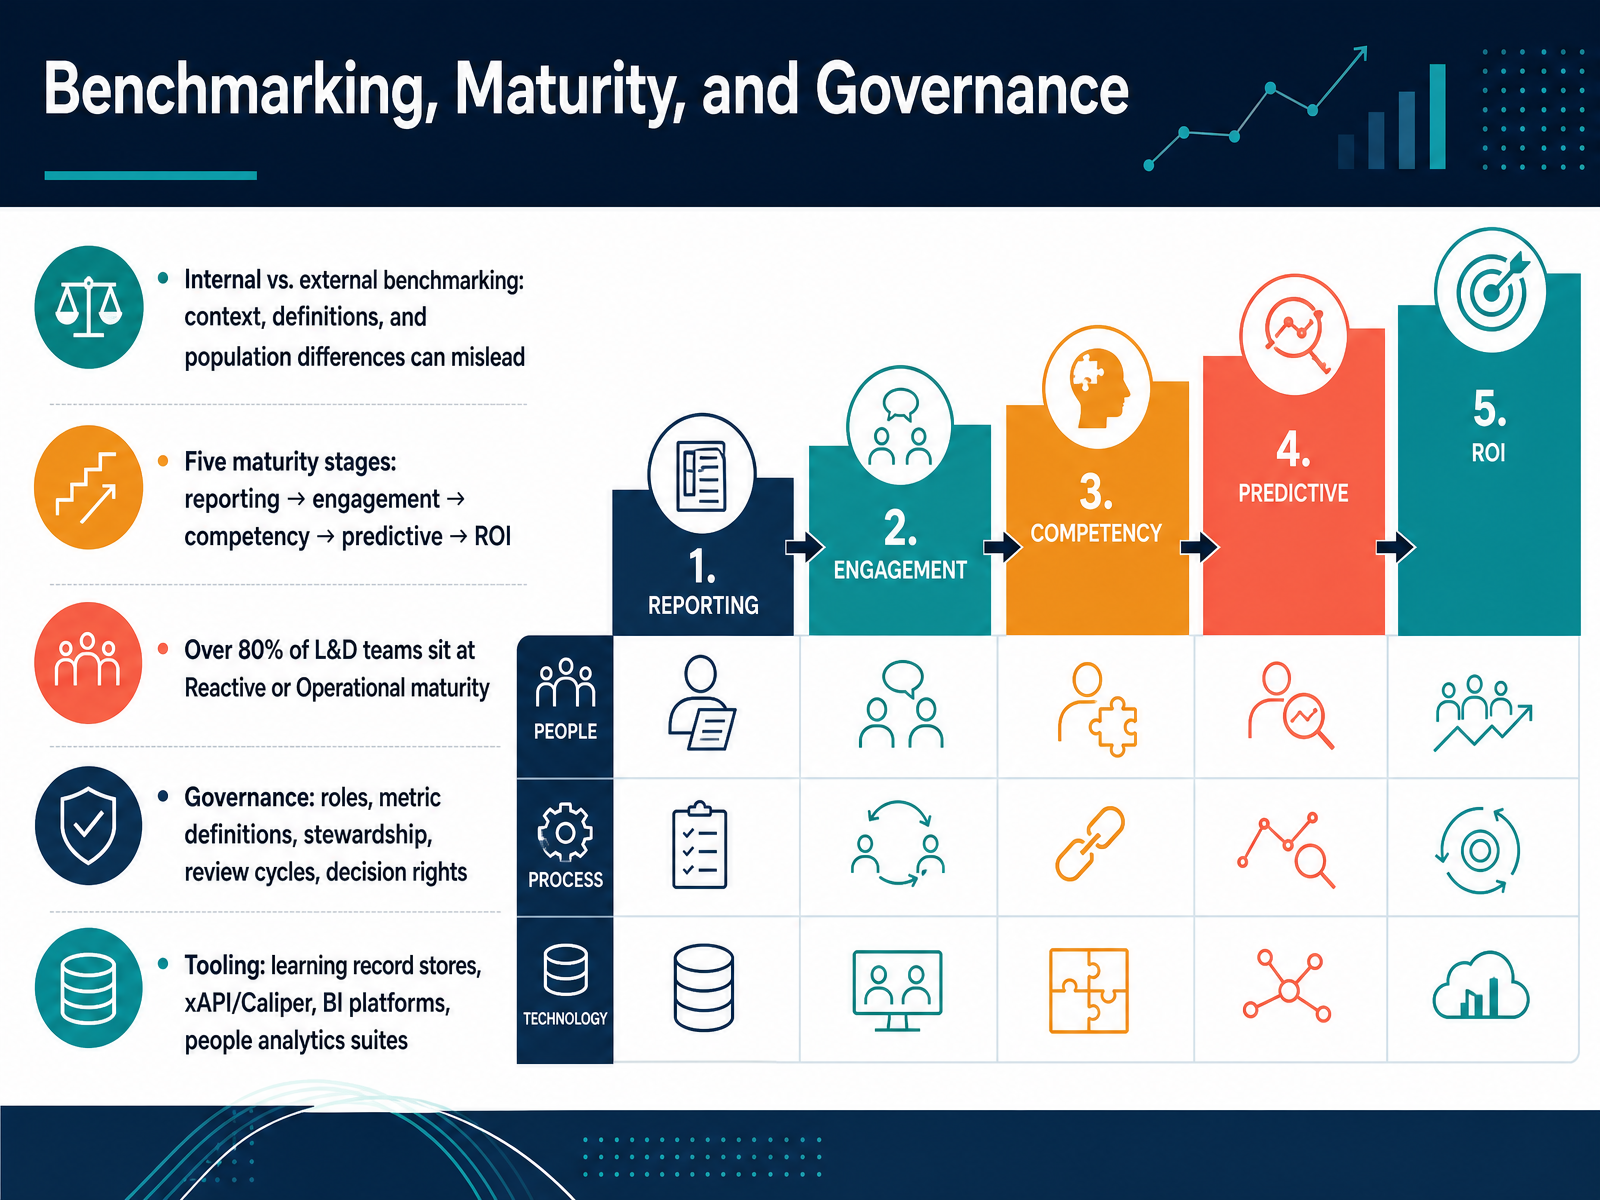
 - 11Benchmarking, Maturity, and GovernanceNow let's talk about benchmarking, maturity, and governance, because this is where measurement becomes a management system rather than a reporting task. External benchmarks are tempting, but context, definitions, and population differences can mislead you, so use an internal baseline to confirm the external story before you commit to it. Most frameworks describe five maturity stages: reporting, engagement, competency, predictive, and finally ROI. In practice, over eighty percent of L and D teams sit at Reactive or Operational maturity, which means reporting activity, not outcomes. That is normal, and it is fixable. Governance is what moves you forward: clear roles, agreed metric definitions, data stewardship, review cycles, and decision rights. Tooling supports this through learning record stores, xAPI or Caliper standards, BI platforms, and people analytics suites. The practical takeaway is simple: pick one outcome metric, define it precisely, assign an owner, and review it on a fixed cycle. Next, we turn to emerging trends: AI, skills intelligence, and continuous measurement.
 d2l.comalphalearningcentre.comcognota.com+22 min
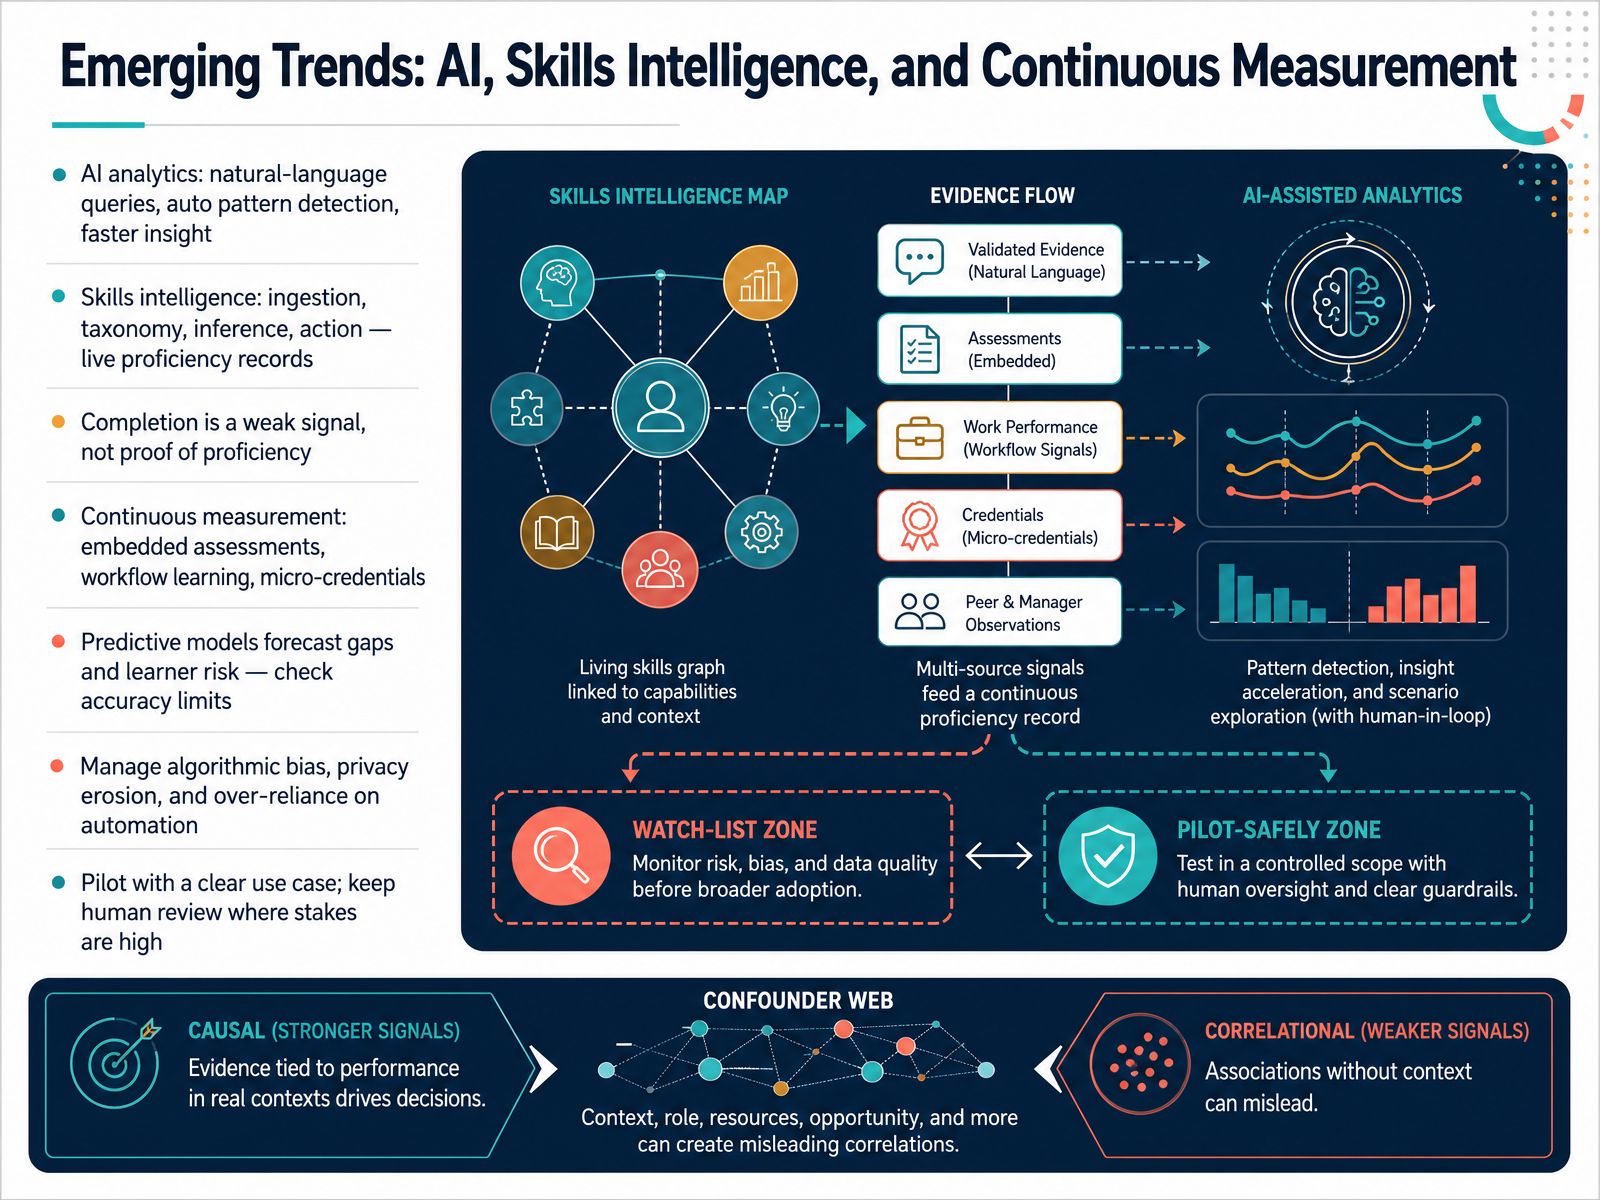
 - 12Emerging Trends: AI, Skills Intelligence, and Continuous MeasurementTurning now to emerging trends, the direction is clear: measurement is becoming continuous. AI analytics lets you query your data in plain language and detects patterns automatically, so insight arrives faster. Skills intelligence goes further, keeping a live record of what people can actually do. It works in four stages: ingestion, taxonomy, inference, and action. And here is the caution: completion is a weak signal, not proof of proficiency. A course completion means someone reached the end, nothing more. Continuous measurement fills that gap through embedded assessments, workflow learning, and micro-credentials. Predictive models can forecast skill gaps and learner risk, but check their accuracy limits before you act. Typically they run around seventy-five to eighty percent accurate. Then manage the harder risks: algorithmic bias, privacy erosion, and over-reliance on automation. Your practical move is to pilot with one clear use case, and keep human review where the stakes are high. In short, let AI widen your insight, but keep judgment with your team. Next, we'll build this into Action Planning: A 90-Day Measurement Improvement Plan.
 nature.comdoi.orgdoi.org+22 min
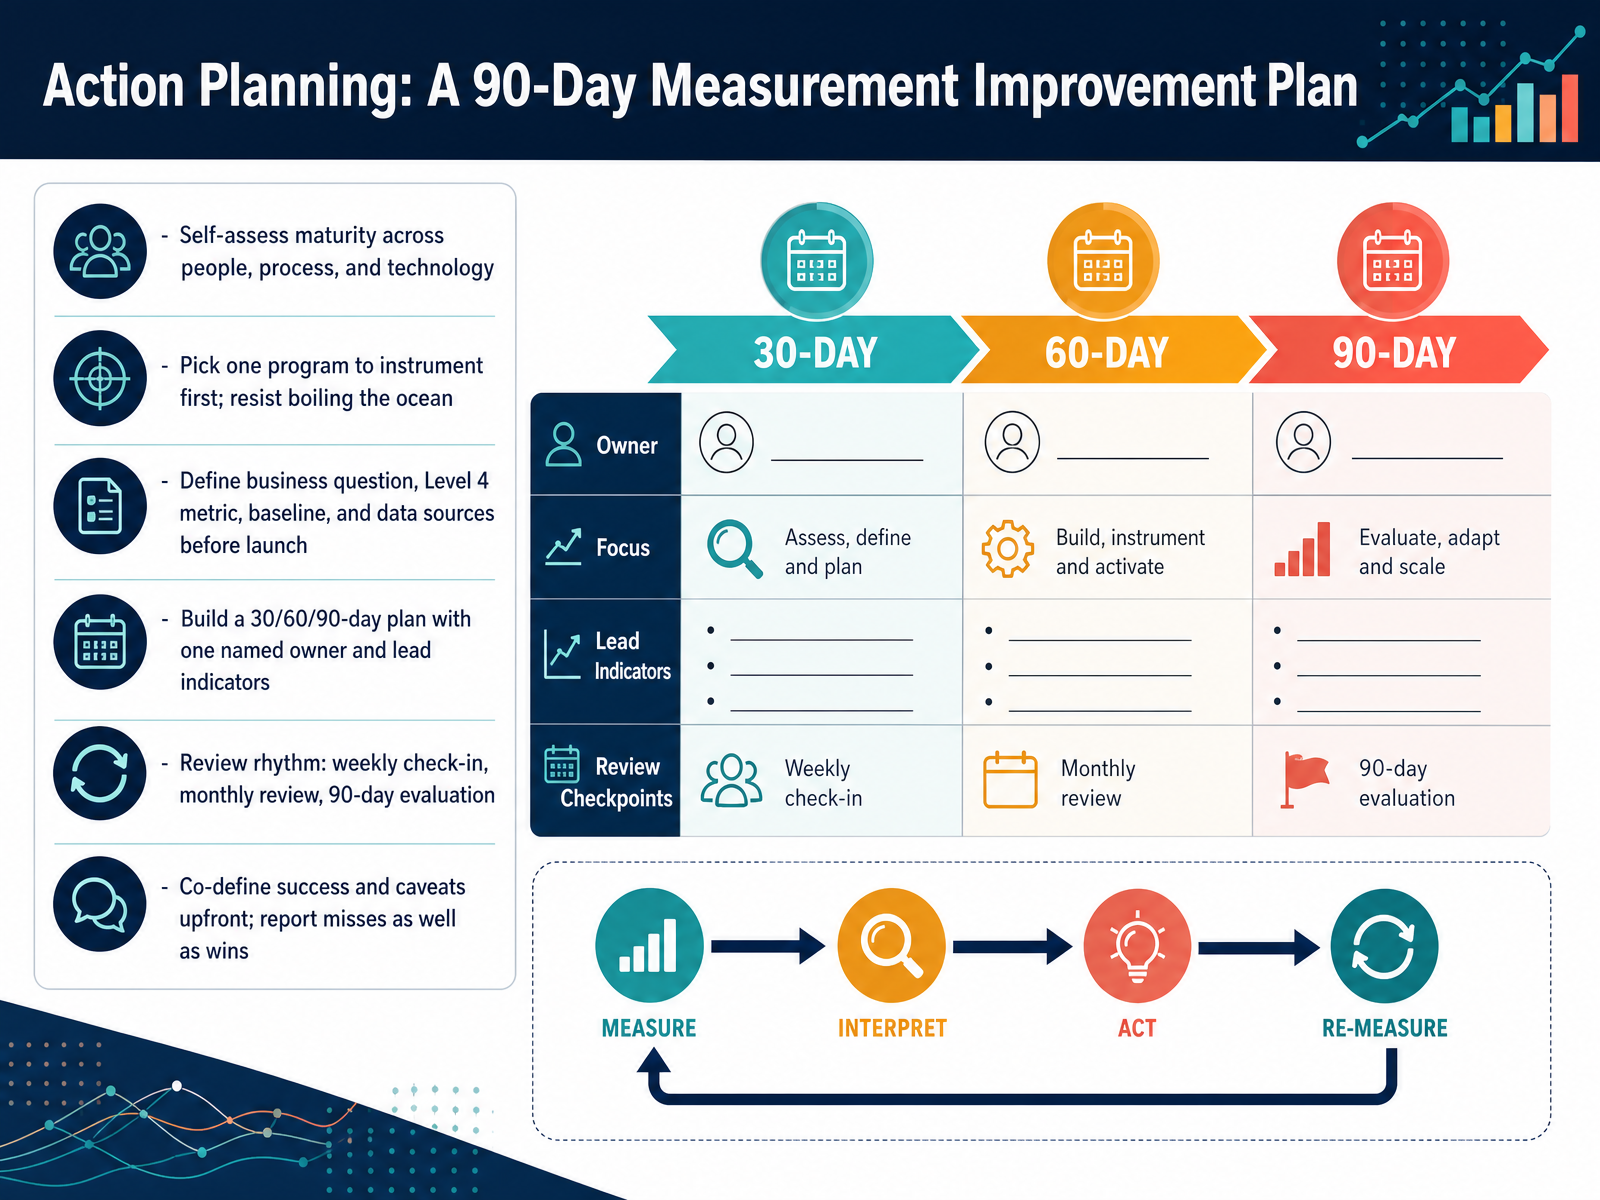
 - 13Action Planning: A 90-Day Measurement Improvement PlanSo here is where we land: a ninety-day plan to improve your measurement practice. Start with an honest self-assessment across people, process, and technology, because your starting point shapes your next move. Then pick one program to instrument first. Resist boiling the ocean; a single well-measured program beats five vague dashboards. Before launch, define the business question, the Level Four metric, the baseline, and your data sources. Work backward from the outcome. Build a plan with milestones at thirty, sixty, and ninety days, one named owner, and a few lead indicators you can act on weekly. Set a review rhythm: a brief weekly check-in, a monthly review, and a full evaluation at ninety days. And co-define success and caveats upfront with your business partners. Report misses as clearly as wins. That honesty is what earns credibility. Start small, stay consistent, and let the data guide your next cycle. Thank you for your attention, and good luck putting this into practice.
 chieflearningofficer.comd2l.com2 min
Take the deck with you
Download this course as a file — free, no sign-up needed.
- PDF handoutEvery slide page, ready to print or share.14 pages · 3.8 MBDownload
- Narrated PowerPointThe deck that presents itself — every slide carries the digital human's narration video.14 pages · 13.7 MBDownload
- PowerPoint slidesThe full deck as a .pptx — open it in PowerPoint, Keynote, or Google Slides.14 pages · 3.7 MBDownload
Free to use in your own training — please keep the PersonWise credit page at the end.
Have your own deck? Turn it into a course
Sources consulted
Web sources consulted while building this course.
- L&D Metrics: Measure Learning & Business Impact - NanoLMS Blog — nanolms.ai
- The Impact of Learning and Development: How to Define It, Measure It, and Prove It to Leadership — talaera.com
- How to Measure Training ROI and Prove L&D Business Value — trainingindustry.com
- How to Measure L&D ROI and Show Impact to Leadership | Cognota — cognota.com
- SUCCESS METRICS TEMPLATE — learninguncut.global
- A privacy preserving synthetic learner dataset for learning analytics in technology enhanced higher education | Scientific Reports — nature.com
- Open data, private learners: a de-identified student activity and performance dataset for learning analytics — doi.org
- Data Infrastructure Application in Education: An Integrated Architecture for Secure Learning Analytics and Student Performance Prediction — doi.org
- Ethical Learning Analytics in Higher Education: From Principles to Stakeholder-Centered Implementation — doi.org
- Beyond Compliance: A Proposed Framework for Ethical Governance of Student Data in Learning Analytics — arxiv.org
- Enabling the learning analytics of tomorrow — sanalabs.com
- Making the Leap: Correlation to Causation — trainingindustry.com
- The Mirage of Metrics: Chasing Causality in L&D — Learning Development Accelerator — ldaccelerator.com
- Causal Inference and Bias in Learning Analytics — learning-analytics.info
- Data Interpretation in L&D part II: To cause or ... - SLT Consulting — strategiclearningtransformation.com
- From Data to Decisions: Building an L&D Dashboard That Proves Impact - Alpha Learning Centre — alphalearningcentre.com
- Enterprise Learning Dashboard Metrics That Matter - Cognota — cognota.com
- Learning Analytics: Training Dashboards Execs Will Read — Aquilon LMS — aquilonlms.com
- Beyond basic metrics: Proving impact before business metrics move – Chief Learning Officer — chieflearningofficer.com
- Corporate Learning Analytics: 2026 Guide to AI and ROI — d2l.com