Customer Service Quality Evaluation
Begin
14 pages · ~28 min
Customer Service Quality Evaluation
This training teaches customer service professionals how to evaluate service quality, identify strengths and improvement areas, and apply assessment techniques to enhance customer satisfaction.
What you’ll learn
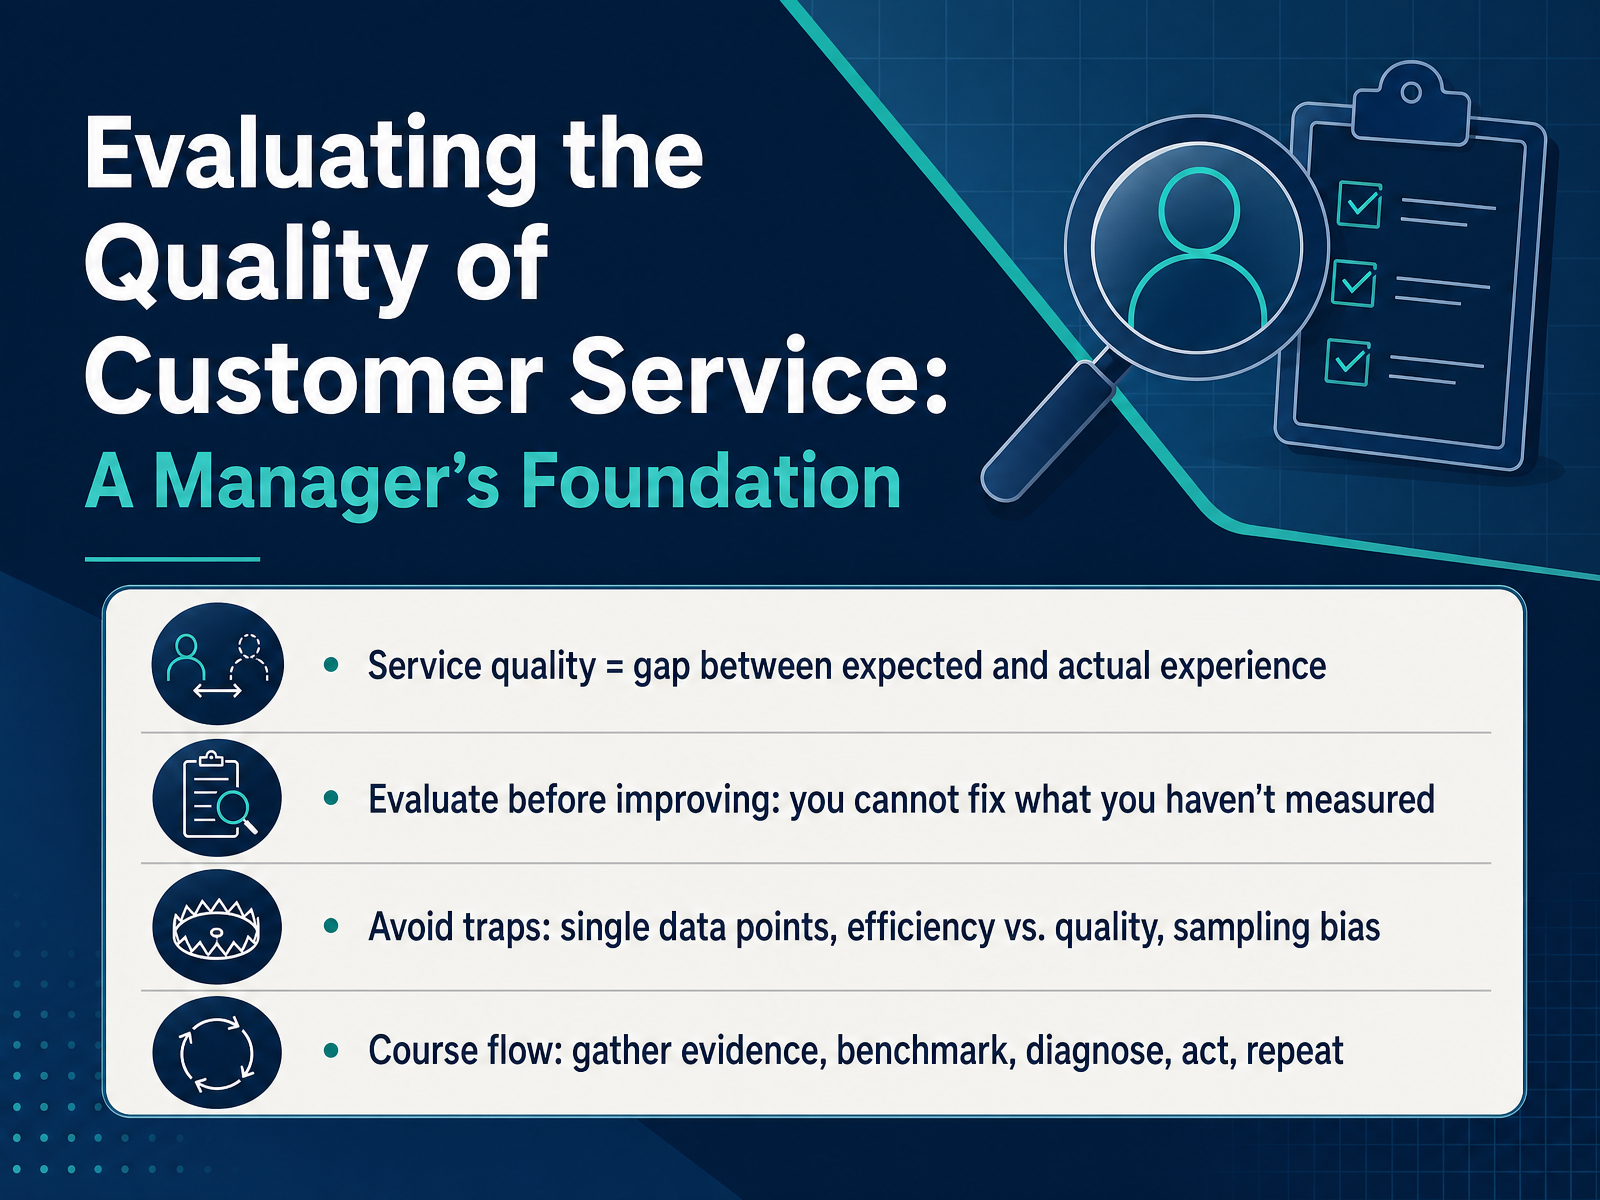
- 01Evaluating the Quality of Customer Service: A Manager's FoundationWelcome. If you lead a service team, you already know the difference between a customer who walks away satisfied and one who leaves frustrated. But evaluating the quality of your service isn't about guessing or relying on a gut feeling. It's about understanding the gap between what customers expect and what they actually experience. That gap is the foundation of service quality, and closing it is your goal. Before we can improve anything, we have to measure it. You cannot fix what you haven't measured. So in this course, we'll build that foundation together. We'll look at how to gather solid evidence, benchmark against meaningful standards, diagnose the real issues, and then act and repeat the cycle. Along the way, we'll avoid the common traps that trip up even experienced managers. Like trusting a single data point, or chasing efficiency at the expense of quality, or drawing conclusions from a biased sample. These pitfalls can send you in the wrong direction fast. The good news is, with the right framework, you'll be able to evaluate your team's performance with confidence and turn those insights into real improvement. Let's start by exploring the five dimensions of service quality, the building blocks your customers use to judge every interaction.salesforce.comblog.hubspot.comsalesforce.com+21 min
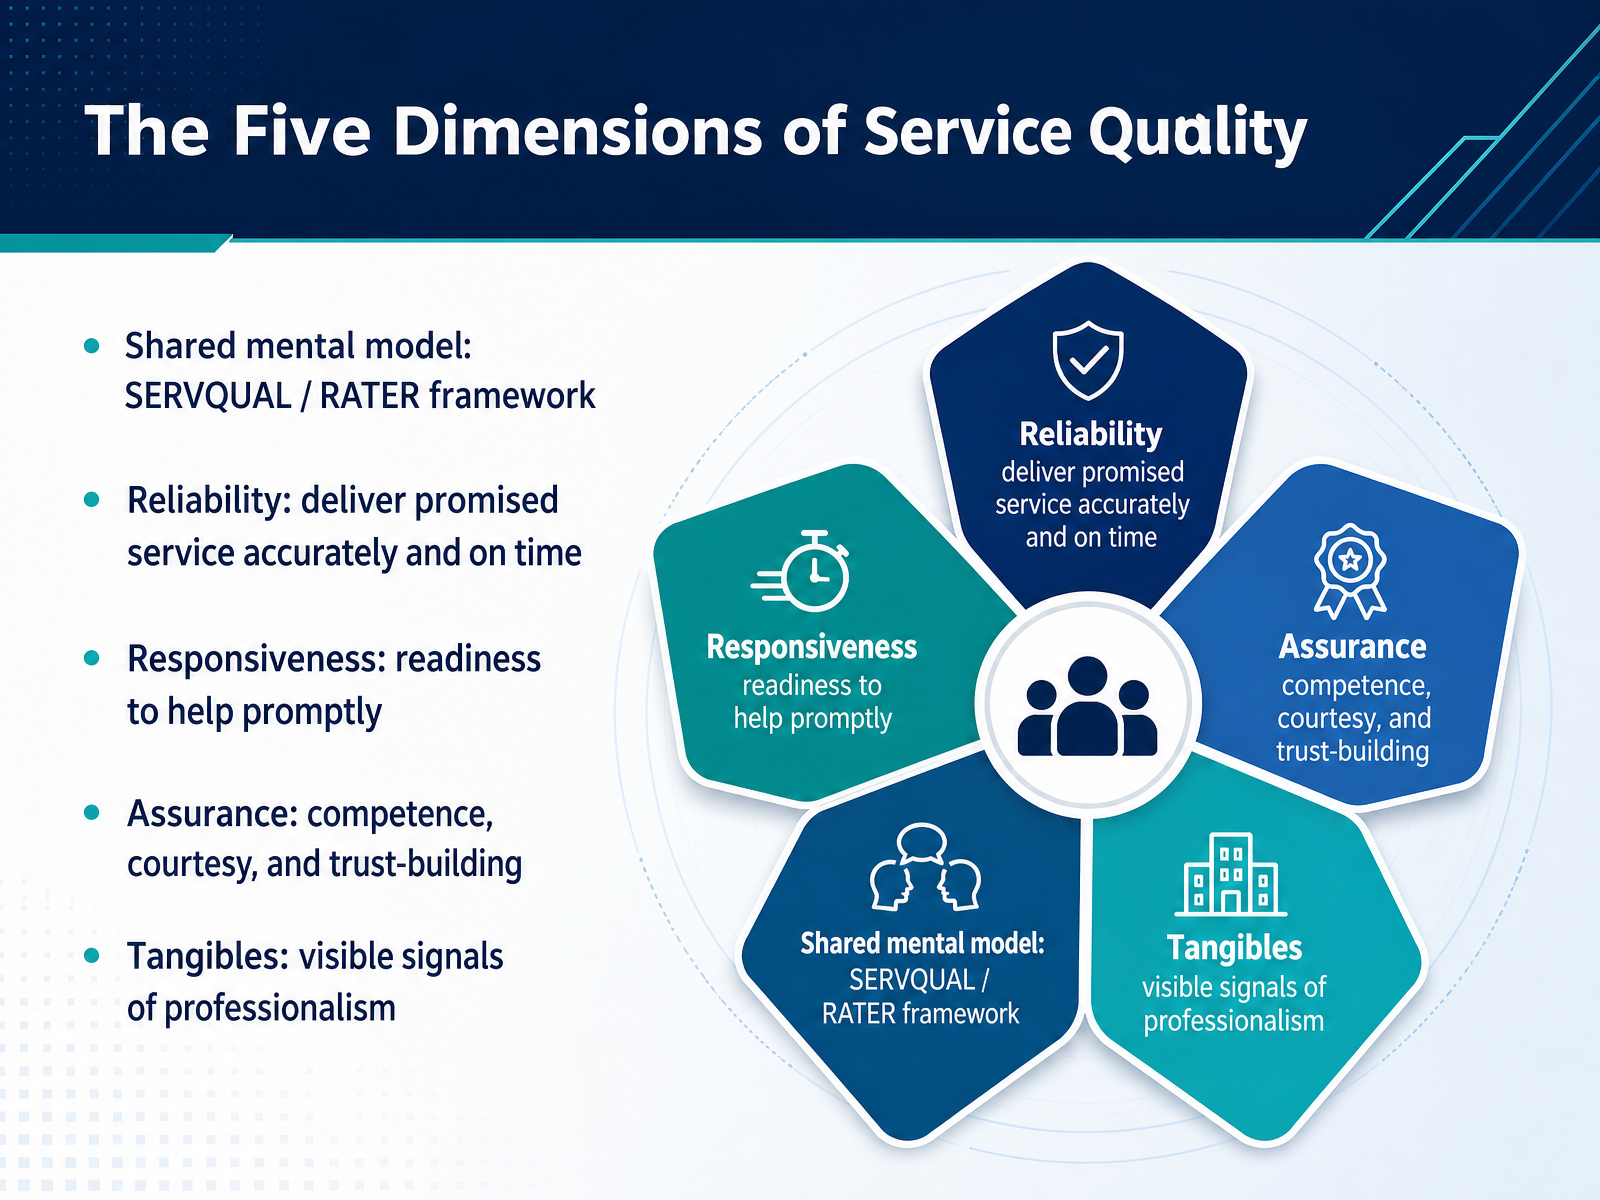
- 02The Five Dimensions of Service QualityLet's build a shared mental model for evaluating service quality. The framework we'll use is called SERVQUAL, also known by the acronym RATER. It breaks service quality down into five dimensions that customers use to judge every interaction. First, reliability: delivering the promised service accurately and on time. If you say a resolution will happen by Tuesday, it happens by Tuesday. Second, responsiveness: the readiness to help promptly. Think of it as how quickly your team picks up the phone or answers a ticket. Third, assurance: competence, courtesy, and the ability to build trust. Customers need to feel confident in your expertise. Fourth, tangibles: the visible signals of professionalism, from your software interface to how your team presents itself. And fifth, empathy: caring, individualized attention. While empathy isn't on this slide's focus list, it completes the RATER model and matters deeply in service. Keep these five pillars in mind as we move forward. Next, we'll look at choosing the dimensions that matter most for your team's specific context.
 en.wikipedia.orgen.m.wikipedia.orgsurveymonkey.com+22 min
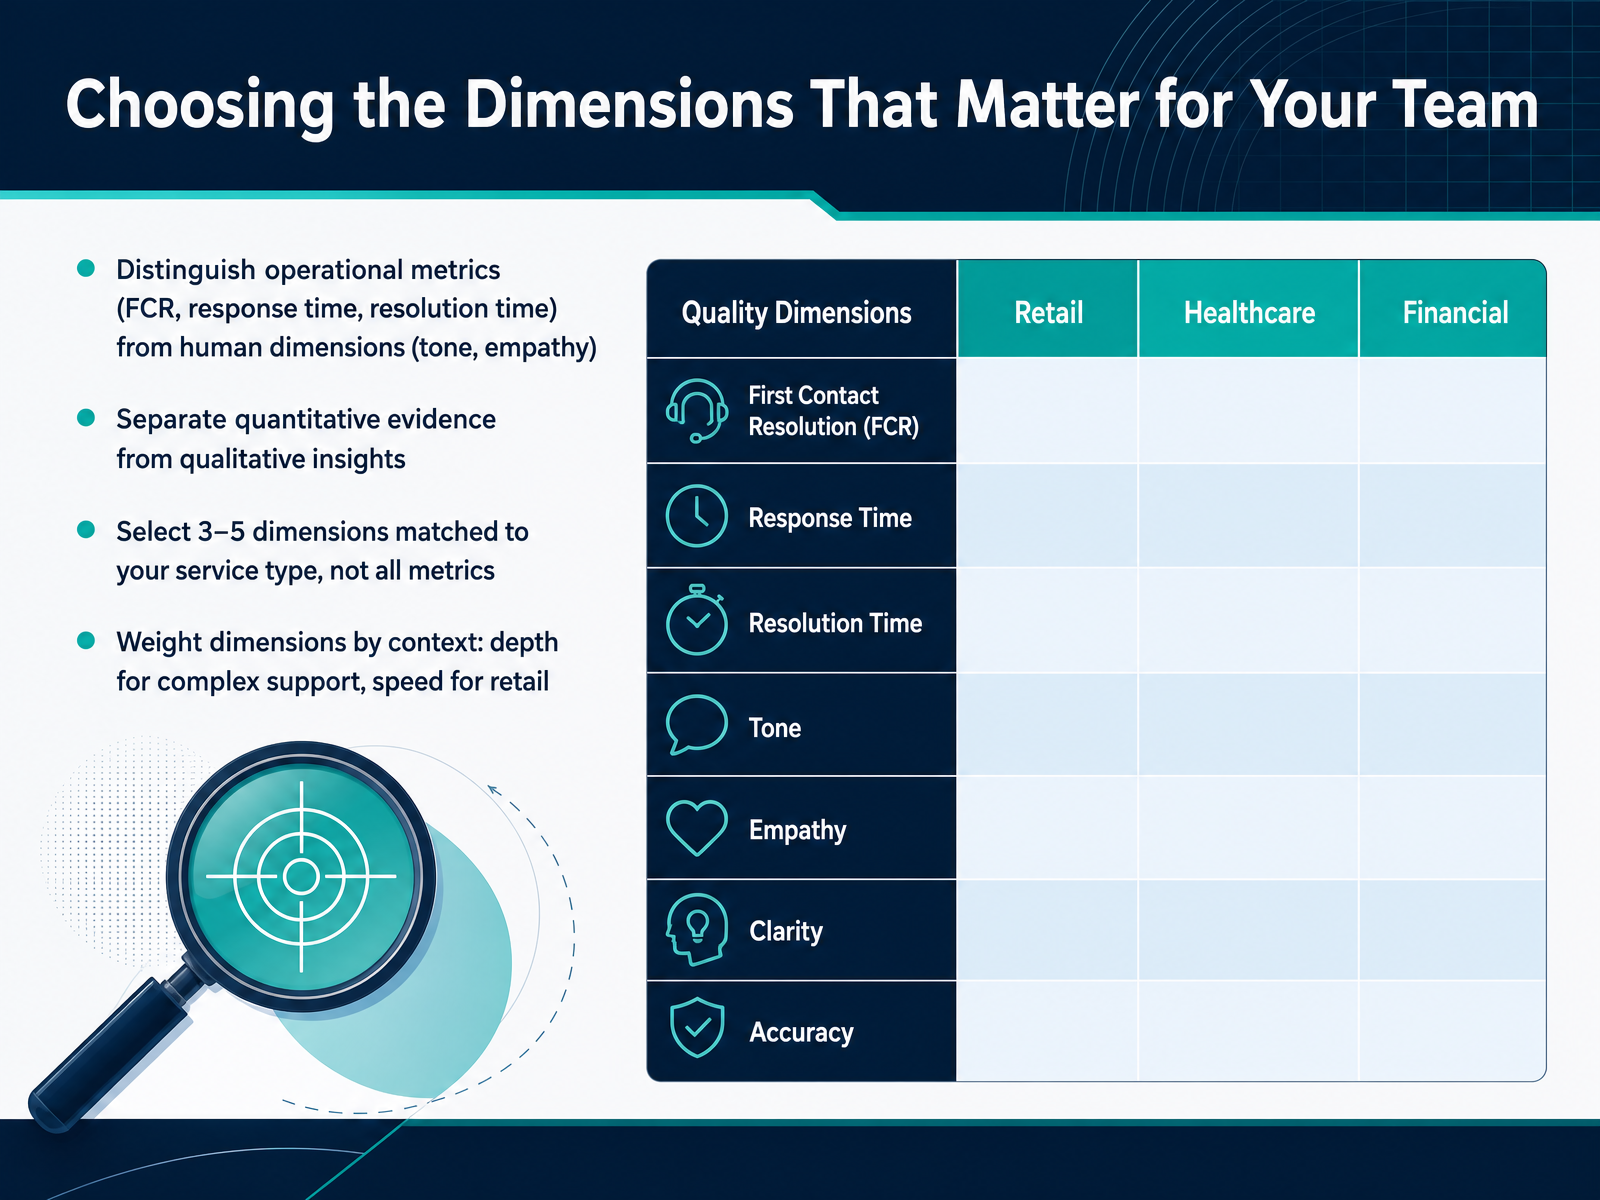
 - 03Choosing the Dimensions That Matter for Your TeamNow let's talk about choosing the dimensions that actually matter for your team. The trap is trying to track everything. Instead, separate your operational metrics, like first contact resolution or response time, from the human dimensions like tone and empathy. The numbers tell you what happened; the qualitative side tells you why. But here's the key—you don't need all of them. Select just three to five dimensions that match your service type. If you run complex technical support, weight your score toward resolution depth and problem-solving. If you're in retail, speed and convenience are what your customers expect. Context is everything. The same score that's excellent for a financial services desk might be average for an e-commerce chat. Benchmark against your own baseline first, and use industry data as a secondary reference. What matters is that your scorecard reflects the experience your customers are actually paying for. Next, we'll look at how to read the quantitative signals behind those choices.
 salesforce.comblog.hubspot.comsalesforce.com+22 min
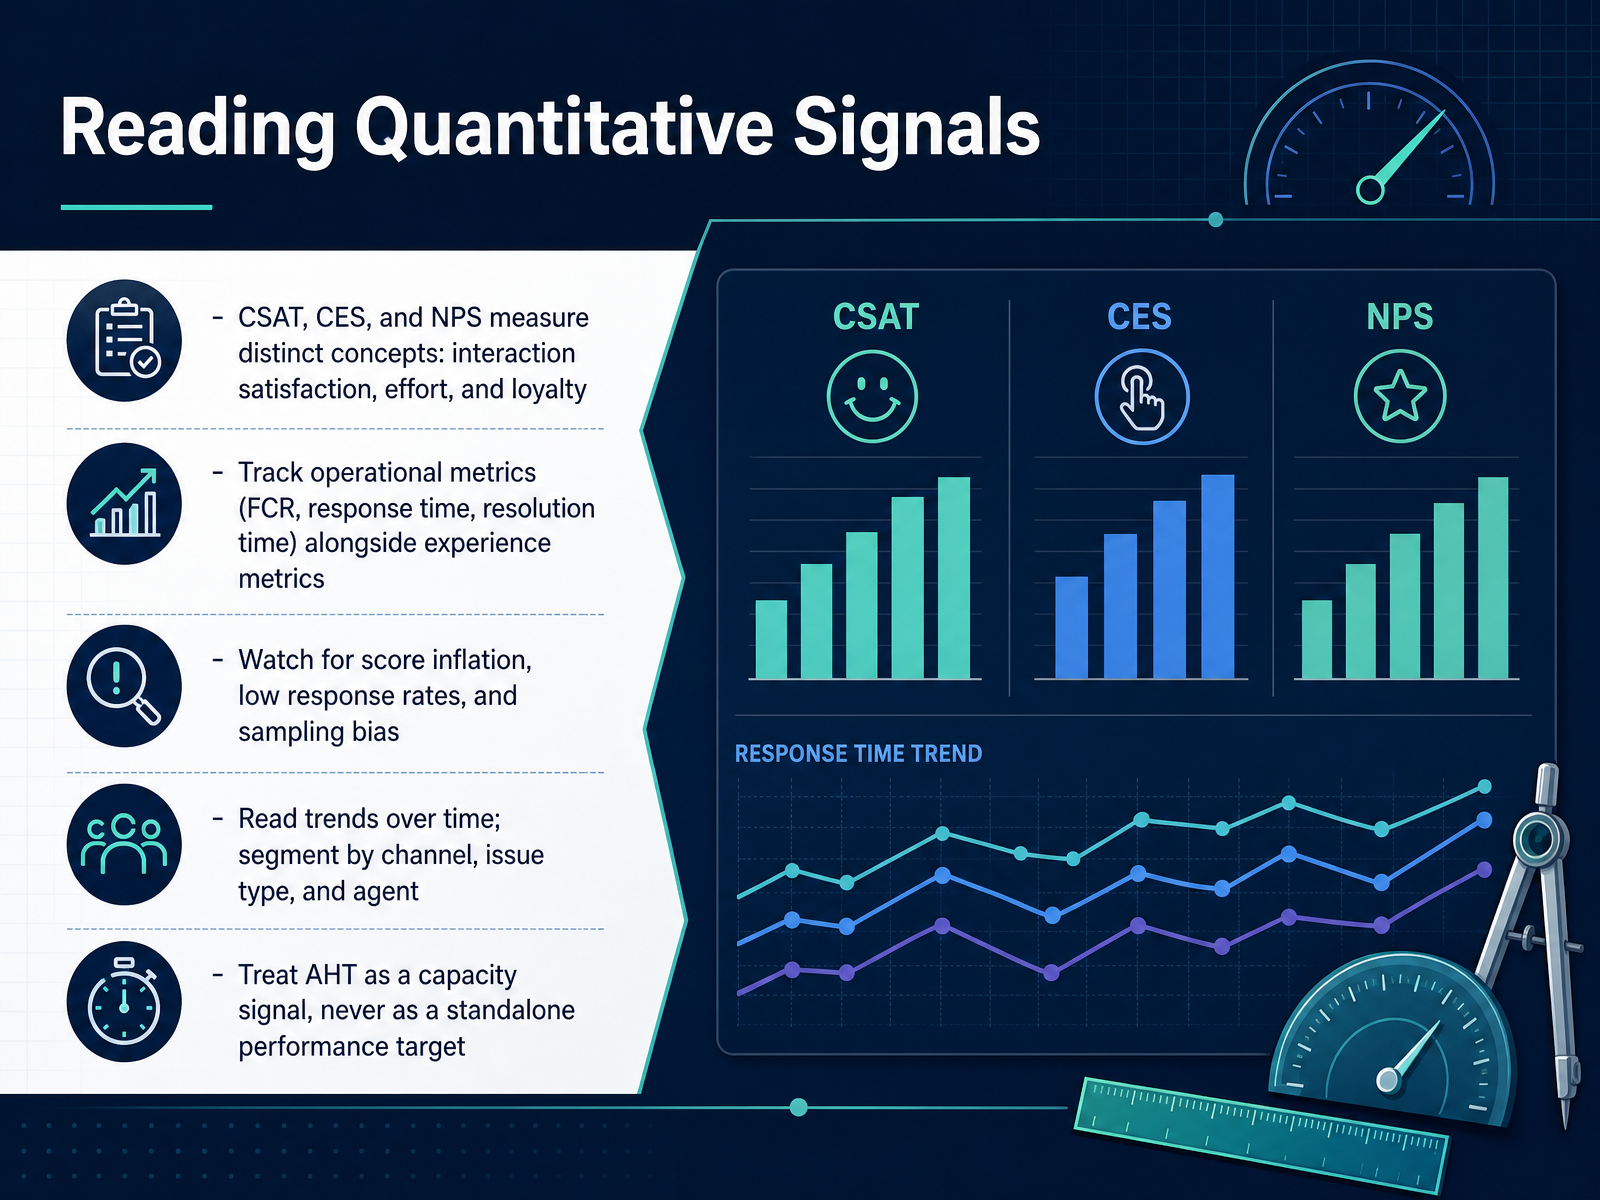
 - 04Reading Quantitative SignalsLet’s talk about reading quantitative signals. CSAT, CES, and NPS each measure a different concept. CSAT captures satisfaction with a specific interaction, CES measures the effort a customer had to exert, and NPS reflects overall loyalty to your brand. Don’t treat them as interchangeable—use each for the question it’s designed to answer. Alongside these experience metrics, track operational ones like first contact resolution, response time, and resolution time. They reveal whether your team is solving issues efficiently while keeping customers satisfied. Watch for pitfalls. Score inflation is common because surveys attract the extremes. Low response rates bias your data, so check how many customers actually responded. Read trends over time rather than fixating on a single snapshot, and segment results by channel, issue type, and agent. That’s where the actionable insights hide. One warning: average handle time is a capacity signal, not a performance target. Pressuring agents to shorten calls risks rushed service and lower first contact resolution. Use AHT to plan staffing, not to grade your team. If you take one thing from this, it’s to pair the operational mechanics with the customer’s voice. Now let’s move on to matching metrics to decisions.
 salesforce.comblog.hubspot.comsalesforce.com+22 min
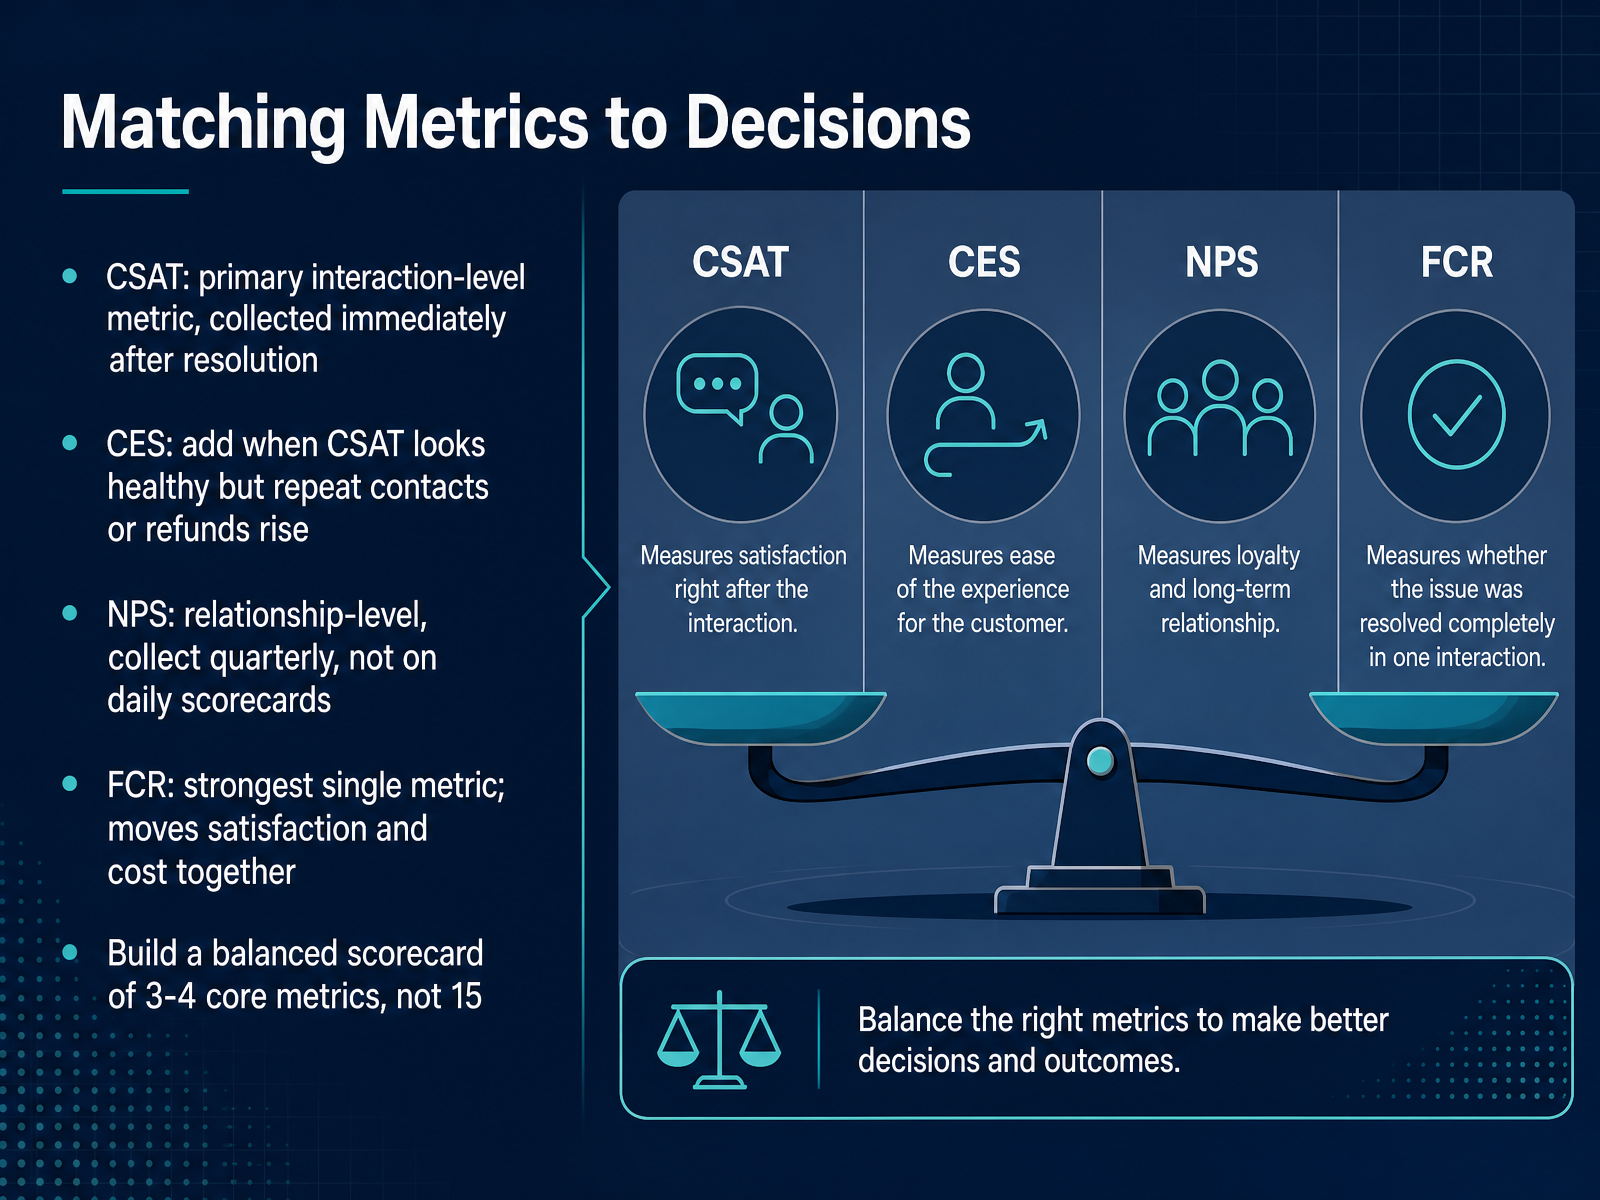
 - 05Matching Metrics to DecisionsLet’s talk about matching the right metric to the right decision. CSAT is your primary interaction-level metric. Collect it immediately after resolution to capture how the customer felt about that specific moment. If your CSAT looks healthy but repeat contacts or refunds start rising, add CES. It measures effort, and it catches friction that CSAT misses. NPS is different. It measures the relationship, not the interaction, so collect it quarterly, not on daily scorecards. As for FCR, first contact resolution is the strongest single metric you have. It moves satisfaction and cost together. Every percentage point of improvement reduces repeat contacts and operating costs. Now build a balanced scorecard. Pick three to four core metrics, not fifteen. Too many numbers dilute focus and create dashboards nobody acts on. Start with CSAT and FCR, then add CES or NPS based on the decisions you need to make. That is your foundation. Next, let’s look at how qualitative insights from interaction reviews give you the why behind these numbers.
 salesforce.comblog.hubspot.comsalesforce.com+21 min
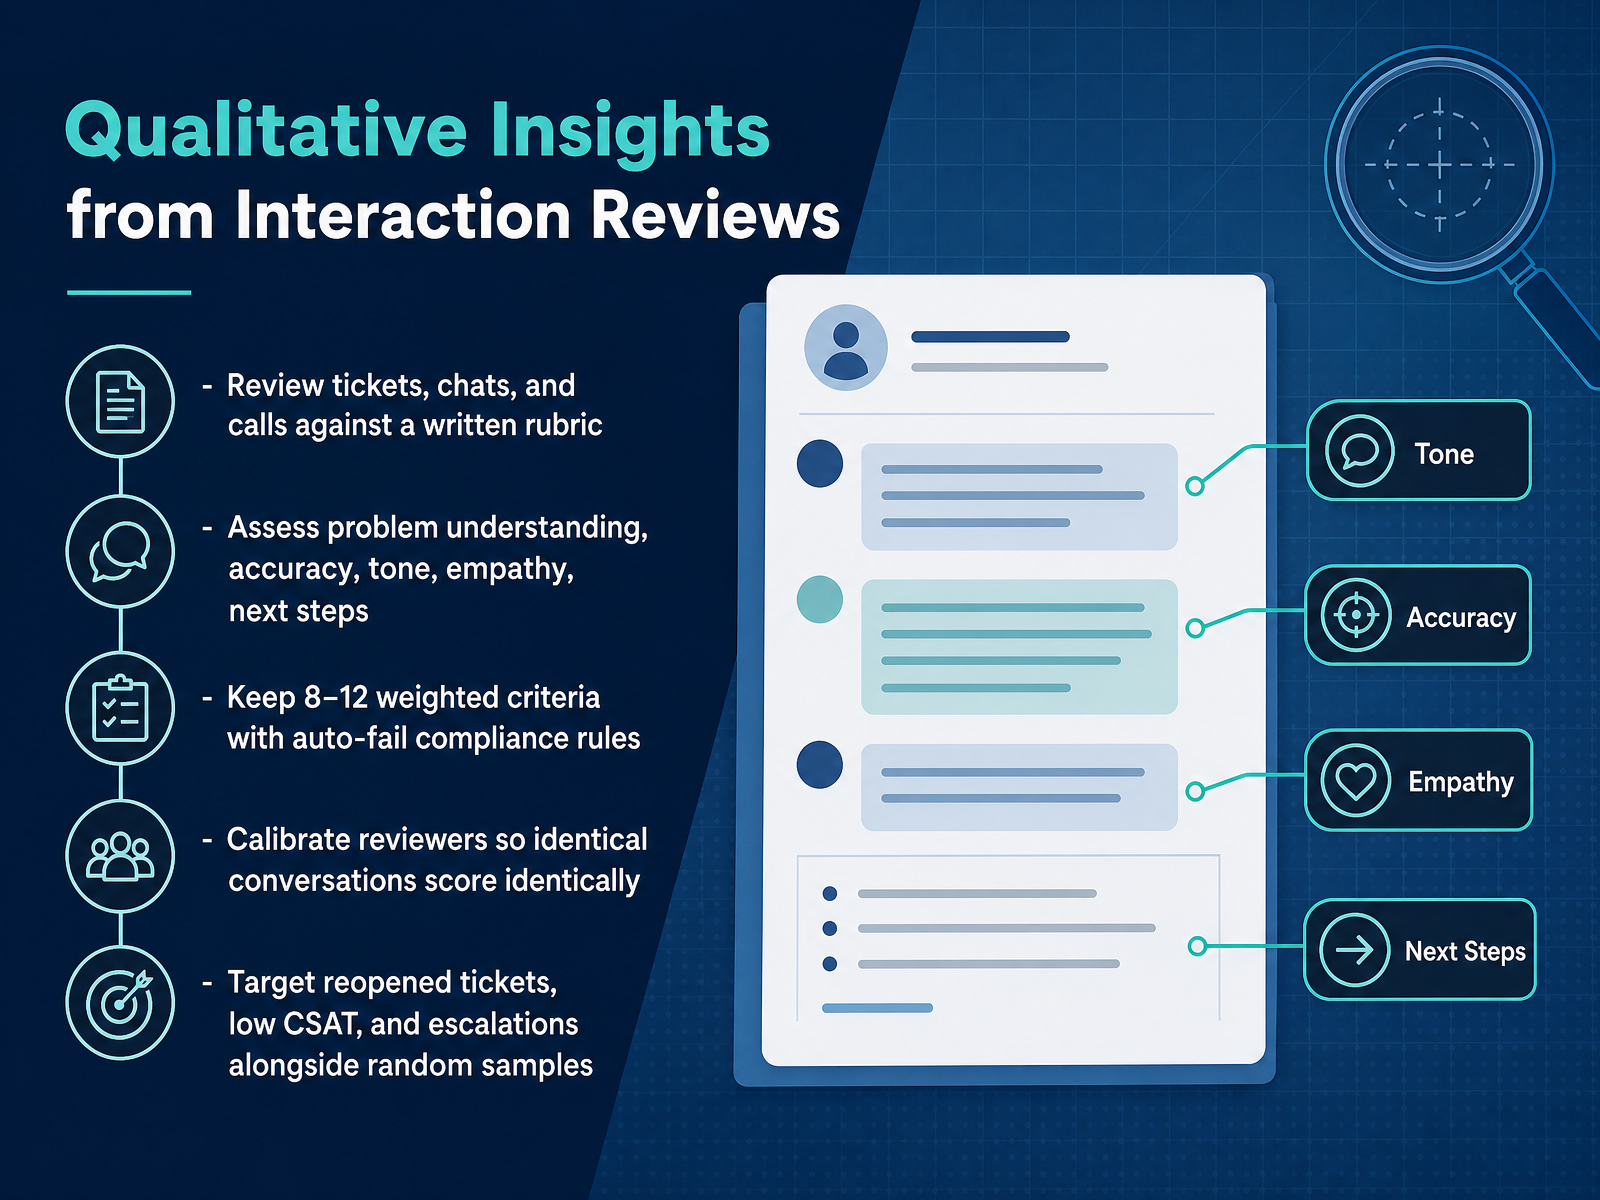
 - 06Qualitative Insights from Interaction ReviewsNow let's turn to the qualitative side of your quality program. This is where the numbers on your dashboard become real conversations. You're going to review tickets, chats, and calls against a written rubric. That means assessing problem understanding, accuracy, tone, empathy, and whether clear next steps were set. Keep your criteria tight—eight to twelve weighted items—and include auto-fail rules for compliance breaches, where the whole evaluation goes to zero. The real discipline here is calibration. Run sessions where your reviewers score the same interactions independently, then compare results. Your target is that the same conversation scores identically, no matter who reviews it. If they don't agree, it's usually the rubric wording that's ambiguous, not the reviewer. And don't just sample randomly. Purposefully pull reopened tickets, low-CSAT interactions, and escalations, alongside your random sample, to learn the most from each review. This mix is where you'll find the root causes your team needs to hear. Next, we'll look at how to run those calibration sessions effectively.
 zendesk.comkaizo.comcekura.ai+22 min
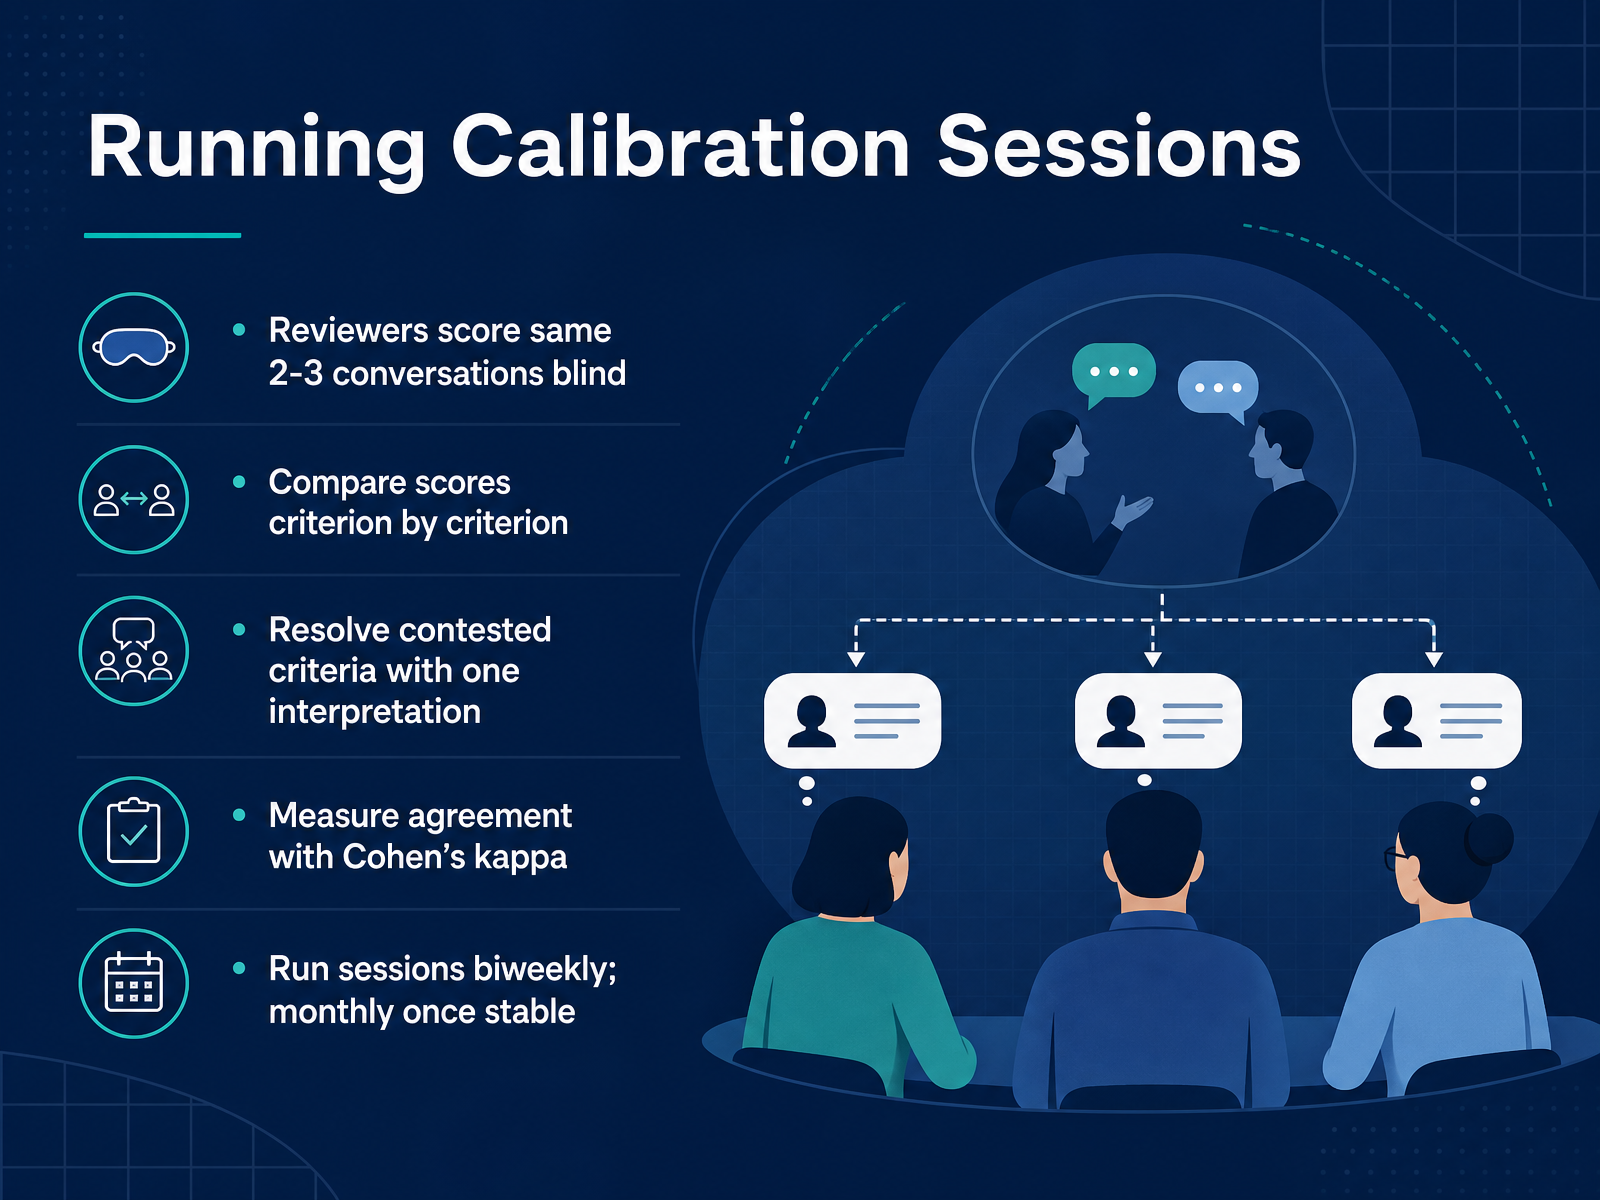
 - 07Running Calibration SessionsNow let’s talk about running calibration sessions. This is where you turn individual opinions into a shared, defensible standard. The mechanics are simple. Before the session, pick two or three conversations. Have each reviewer score them independently, what we call blind scoring, so no one’s opinion anchors anyone else’s. When you meet, compare the scores criterion by criterion, not just the overall total. The goal isn’t to force agreement. It’s to find the criteria whose wording lets two honest people reach different conclusions. When you hit a contested criterion, resolve it with one clear interpretation and document that decision. That becomes your standard for future reviews. To measure whether you’re actually aligned, use Cohen’s kappa rather than a simple percentage. It corrects for agreement by chance, which raw percentages hide. A kappa above zero point eight means good reliability. Below zero point six seven, rewrite the criterion wording, because the rubric is the problem, not your reviewers. Run these sessions every two weeks while your team is stabilizing. Once the scores hold steady, you can drop to monthly. The output isn’t a perfect score. It’s a clearer rubric and a documented decision. Next, let’s look at how the customer’s voice fits into this picture.
 zendesk.comkaizo.comcekura.ai+21 min
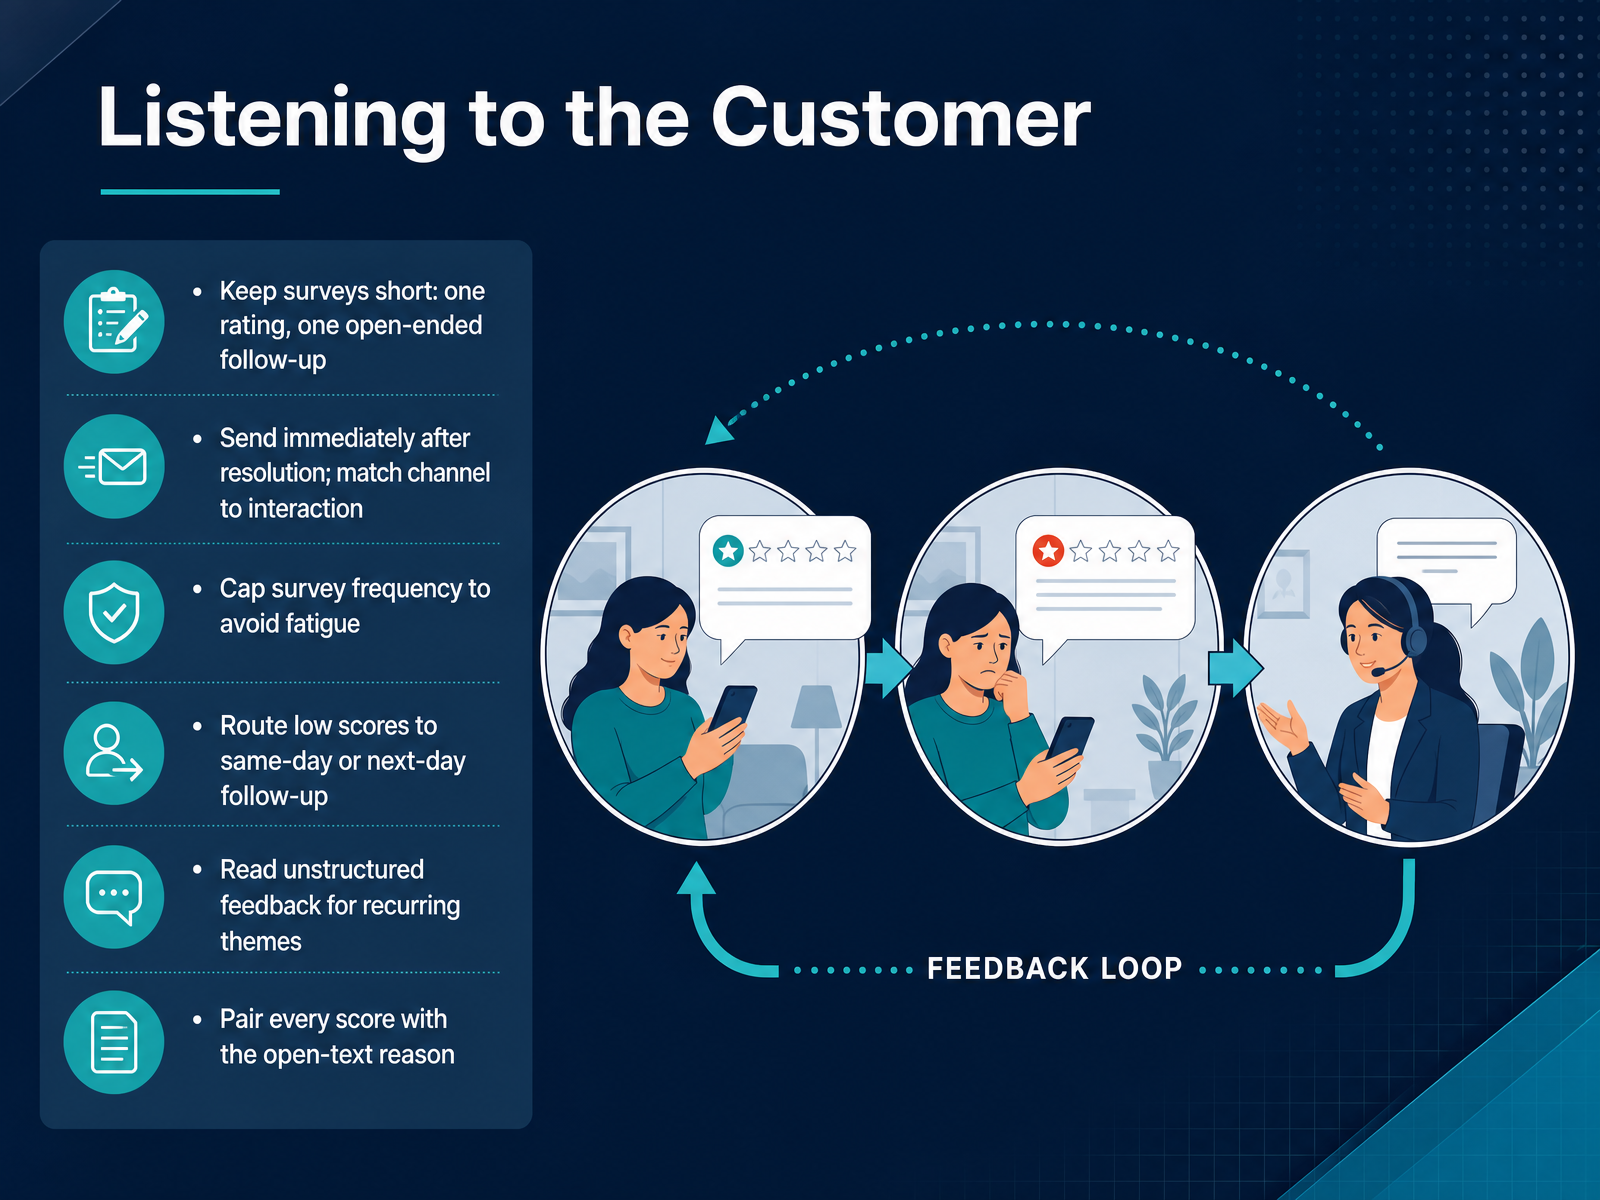
 - 08Listening to the CustomerNow let's talk about one of the most direct ways to hear from your customers: the post-interaction survey. The goal here is not to collect as much data as possible, but to collect the right data at the right time. Keep your surveys short — one rating question and one open-ended follow-up. That's it. The rating tells you how satisfied they were; the open-ended tells you why. Send the survey immediately after resolution, and match the channel to the interaction. If they reached out by chat, send it via chat. If it was a phone call, an SMS might work better. And be careful not to over-survey. Cap the frequency so you don't fatigue your customers. When a low score comes in, route it for same-day or next-day follow-up. That's a critical moment to recover a relationship. Then, read the open-text responses for recurring themes. If multiple customers mention the same issue, that's a systemic problem, not an isolated complaint. Always pair every score with its reason. A number without context is just a statistic. The real insight lives in the comments. So, as you review your survey results, remember: the score tells you where to look; the comment tells you what to change. Next, we'll look at how to assess your service from the inside, through self-assessment and team observation.
 formbricks.comgetperspective.aiagentstack.build+22 min
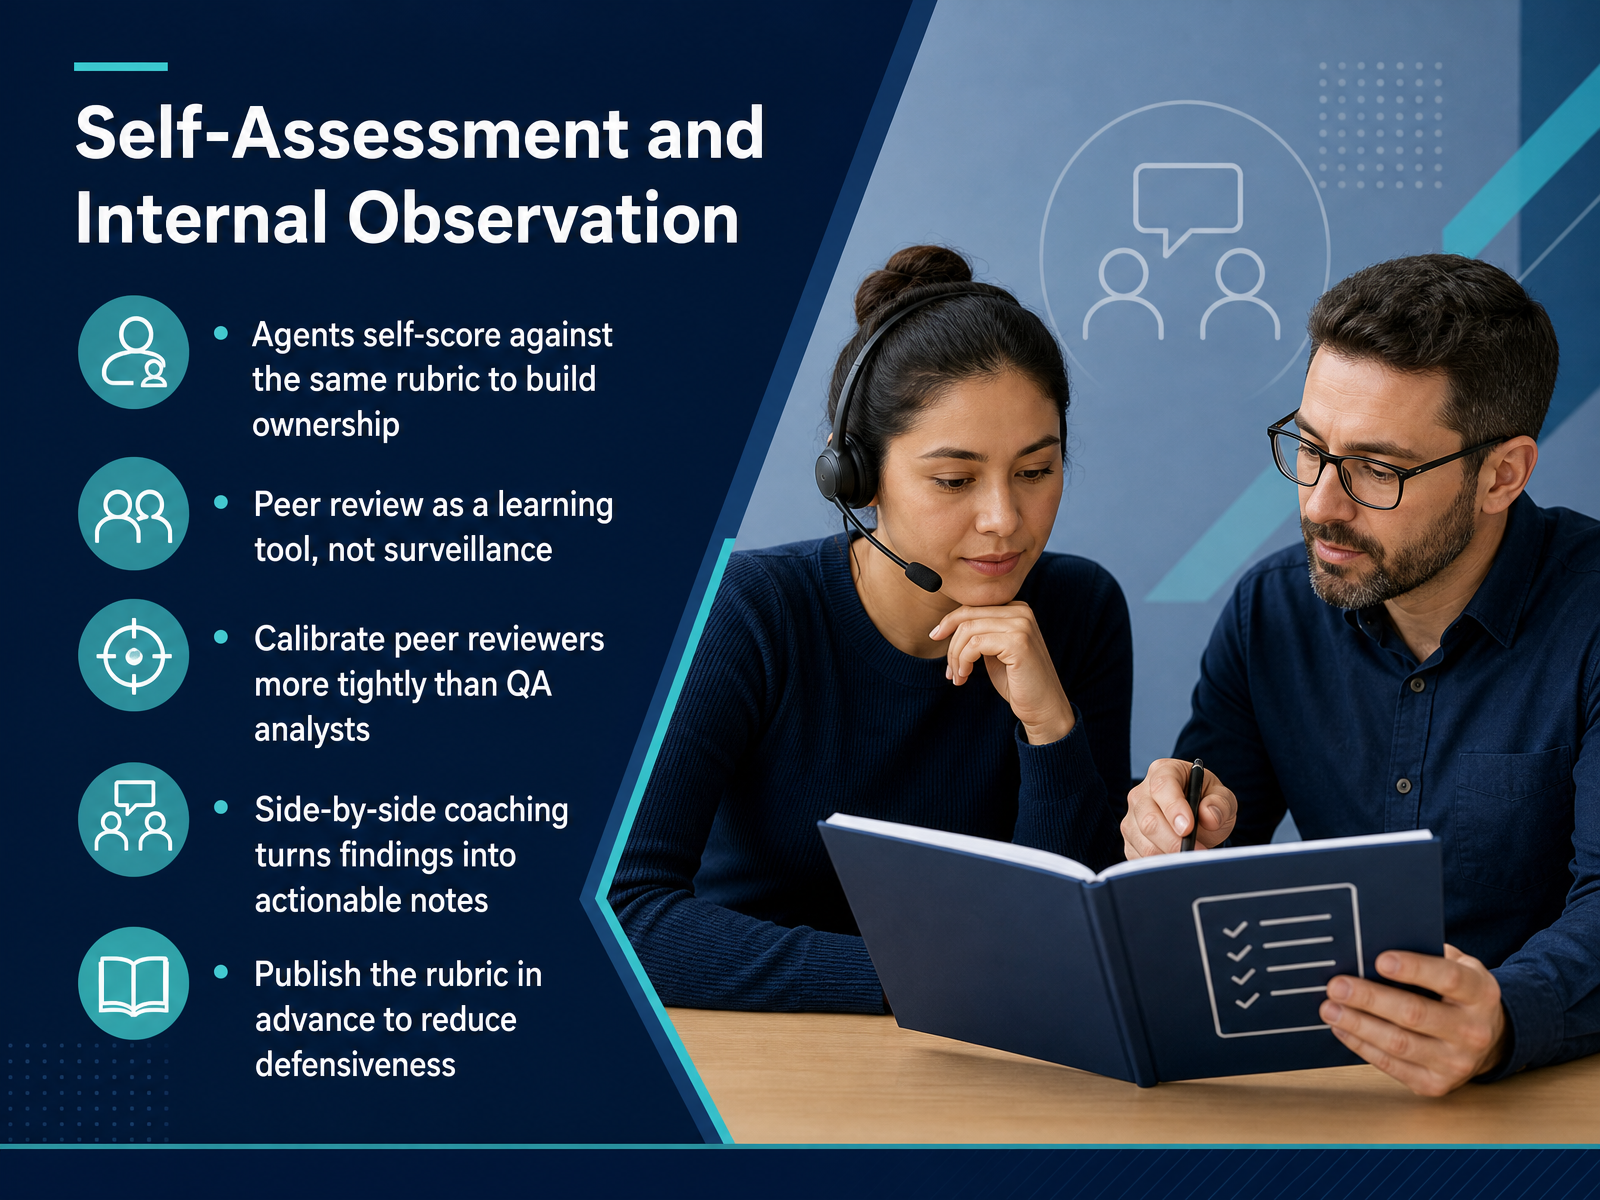
 - 09Self-Assessment and Internal ObservationLet's shift focus from the calibration of your reviewers to something equally important: giving your team a voice in the process. Self-assessment builds ownership. When agents score their own conversations against the same rubric you use, they stop seeing quality as a top-down judgment and start seeing it as a personal standard they can meet. Pair that with peer review. Have agents review each other's work, not as a way to catch mistakes, but as a learning tool. It lets them see how a colleague handled a tricky situation, and it takes away that surveillance feeling. Just remember, peer reviewers need tight calibration, even tighter than your QA analysts, so their feedback stays consistent and fair. Then, turn the insights into action with side-by-side coaching. Sit with the agent, walk through the transcript, and turn abstract scores into concrete notes like 'try mirroring the customer's language here' or 'offer a more specific next step.' And before any of this, publish the rubric in advance. If everyone knows the standard upfront, defensiveness drops and the conversation becomes about growth, not judgment. A transparent process is a trusted one. That's how you build a team that owns its quality. Up next, we'll look at how to benchmark those results against external context.
 1 min
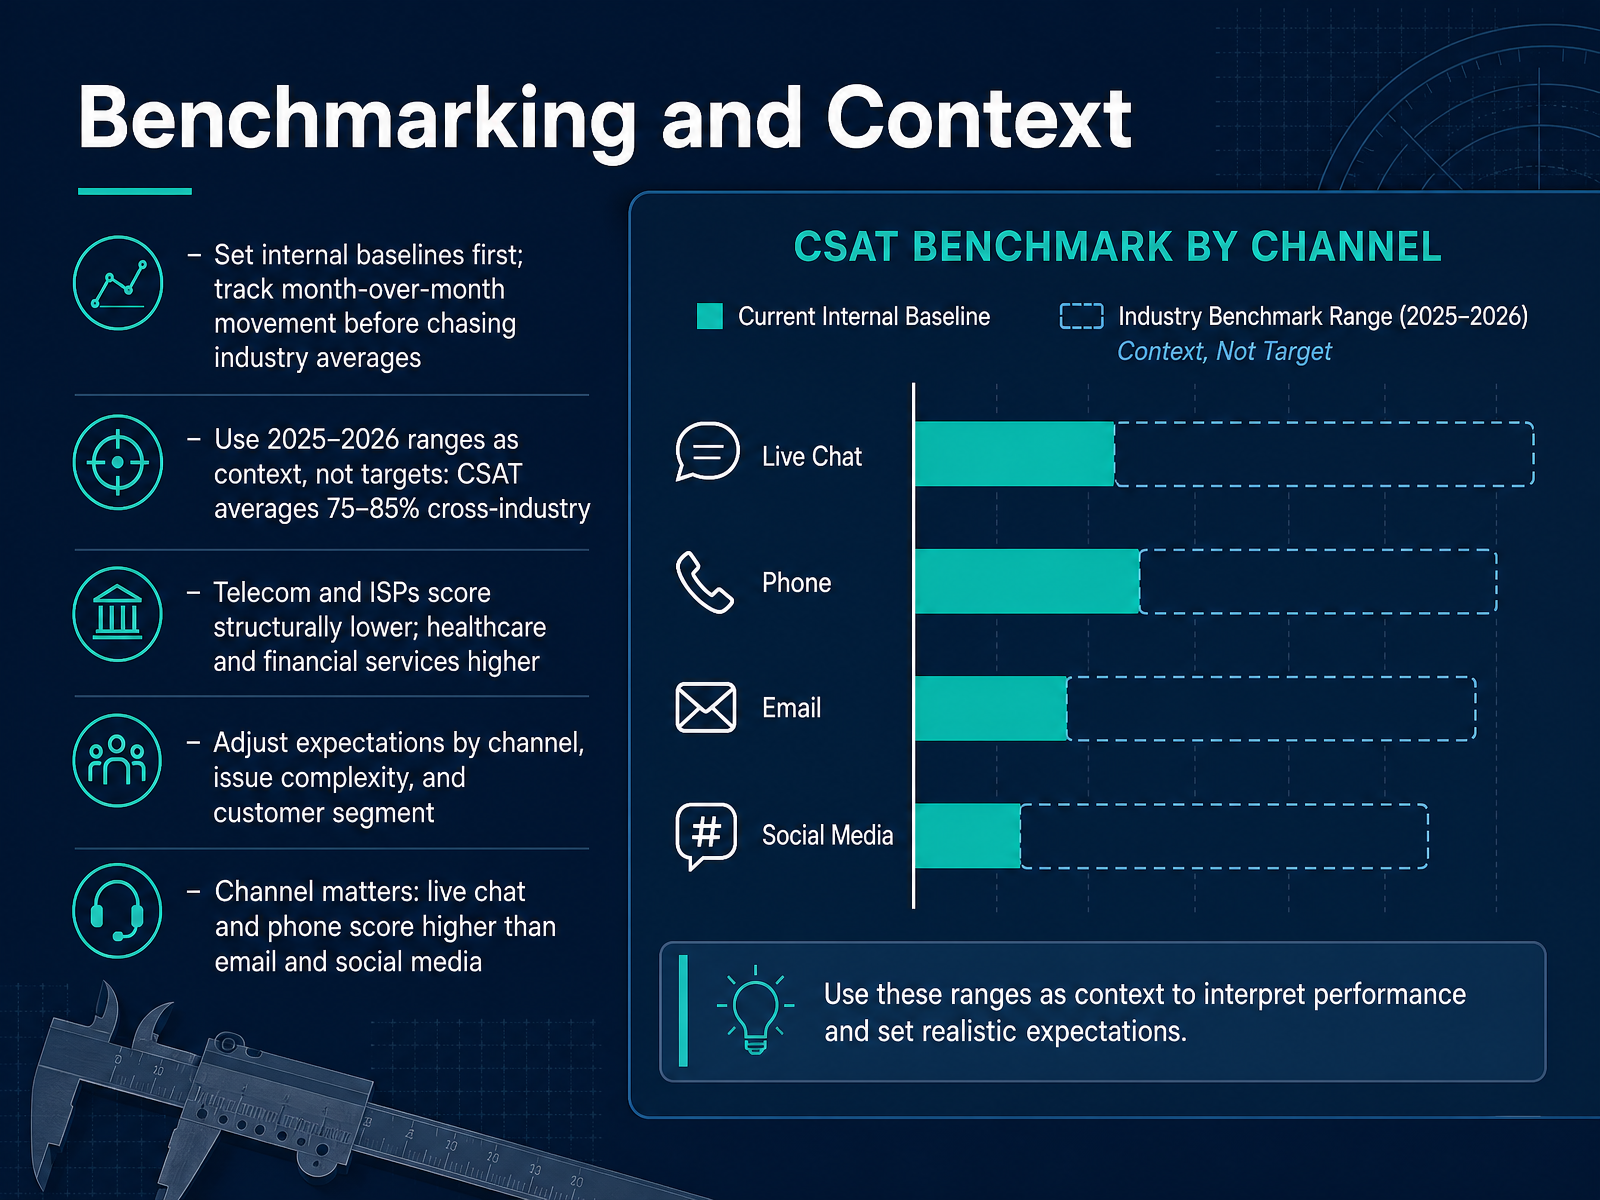
1 min - 10Benchmarking and ContextNow let's talk about benchmarking and context, because a raw score means little without a frame of reference. Start by setting your own internal baselines. Track your team's month-over-month movement before you chase any industry averages. Your trend over time tells you more than a one-off number ever will. When you do look outward, treat industry ranges as context, not targets. The cross-industry CSAT average sits in the 75 to 85 percent range. But that is a blended figure. Telecom and internet providers score structurally lower due to their service complexity, while healthcare and financial services typically run higher. The key is to adjust your expectations by channel, issue complexity, and customer segment. A support interaction via live chat or phone naturally scores higher than one resolved over email or social media. Your benchmark is the floor, not the finish line. Compare against your own sector to know if you are truly leading. This context sets us up to diagnose the root causes behind your numbers next.
 2 min
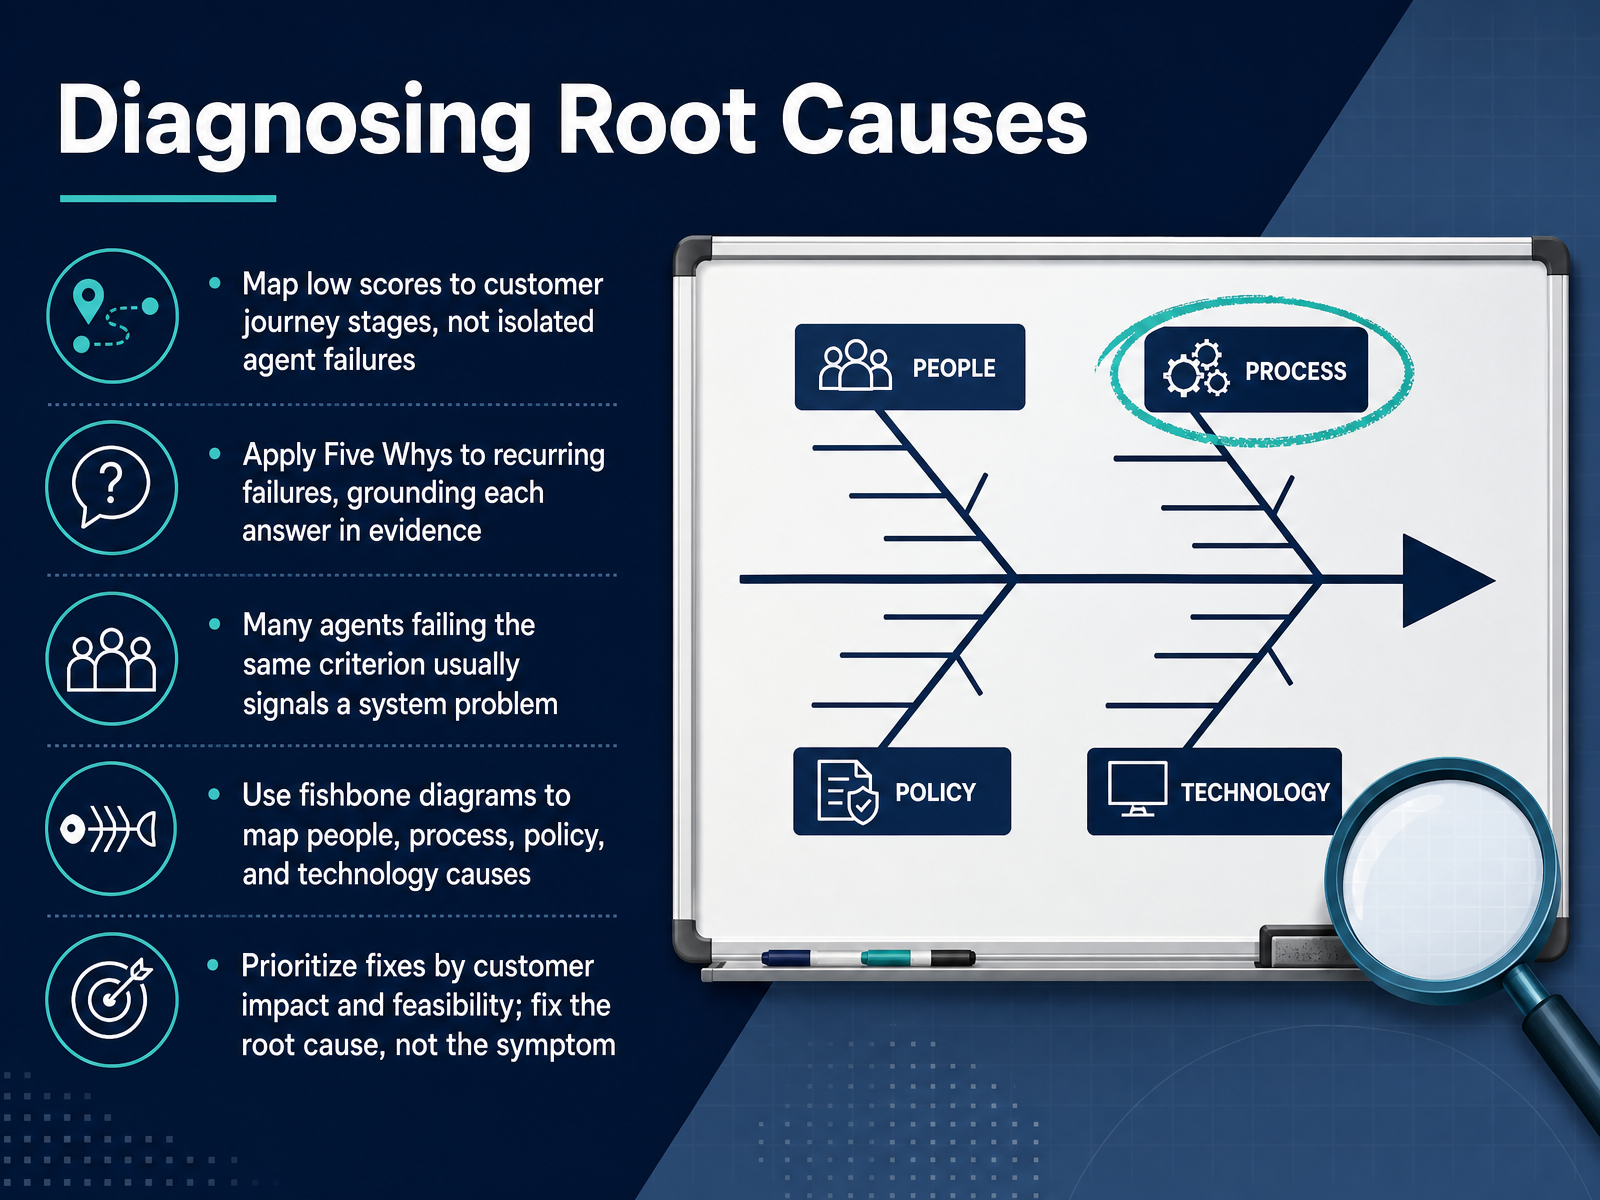
2 min - 11Diagnosing Root CausesNow let's move from spotting low scores to fixing what's really behind them. When you see the same criterion failing again and again, don't blame individual agents. Map those low scores to the customer journey—maybe the problem is at onboarding, during a handoff, or at billing. That's your starting point. Then go deeper with the Five Whys. Ask why five times, but ground each answer in evidence, not guesswork. For example, if customers complain about billing errors, keep asking until you reach a process gap, like no feedback loop between support and billing. That's a system problem, not an agent problem. If several agents fail the same way, that's also a red flag. Use a fishbone diagram to sort causes into people, process, policy, and technology. You might find missing training, a confusing policy, or an outdated system. Once you've mapped the causes, prioritize fixes by customer impact and feasibility. Fix the root cause, not the symptom. That might mean changing a workflow, not adding more scripts. A small number of root causes often drives most complaints, so focus there. When you do, you'll reduce recurring issues and save your team from fighting the same fires. Next, we'll look at building an ongoing evaluation rhythm so these fixes stick.
 1 min
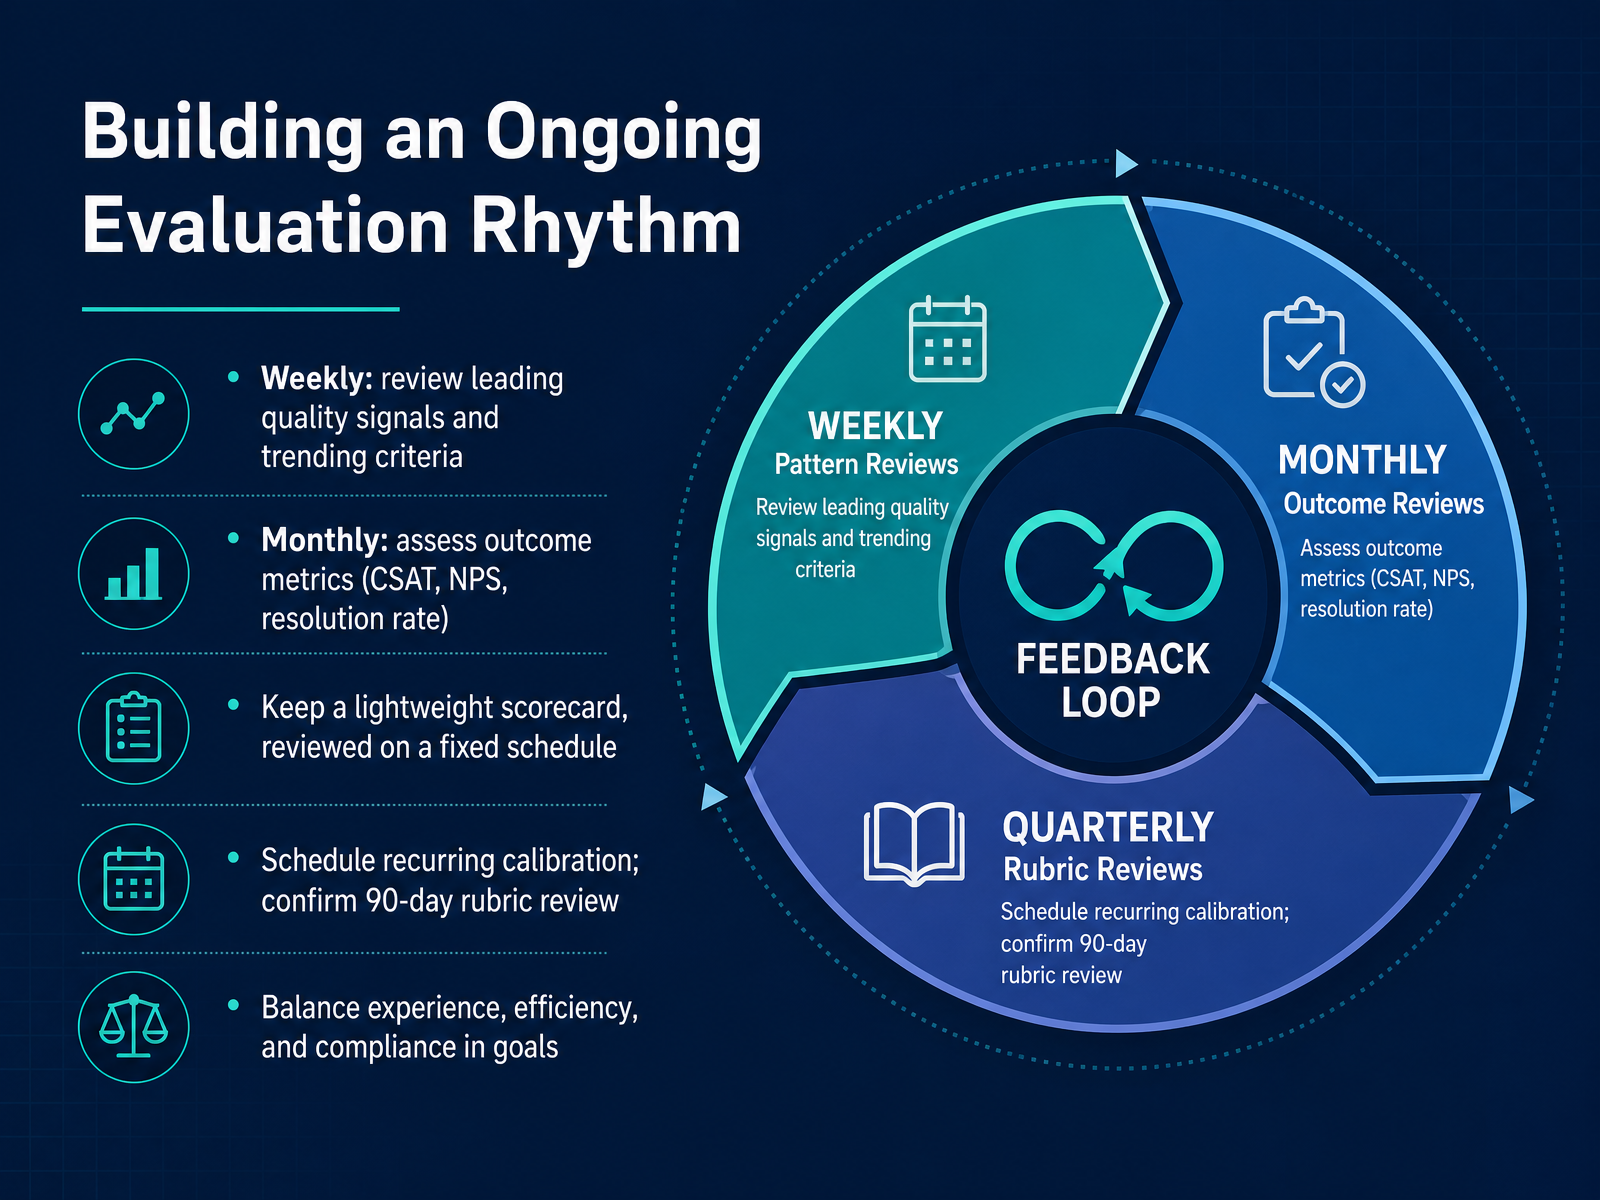
1 min - 12Building an Ongoing Evaluation RhythmLet’s talk about rhythm. Quality isn’t a one-time audit; it’s a cadence you build into your team’s operation. Start weekly. Review the leading signals—the trending criteria on your scorecard that show where quality is shifting in real time. These are the early warnings. Then, go monthly to look at the outcomes: CSAT, NPS, and resolution rate. These tell you whether the customer experience is actually improving. Keep your scorecard lightweight. If it takes more than a few minutes to score a conversation, it’s too heavy to sustain. Review it on a fixed schedule so the habit sticks. And don’t skip calibration. Schedule recurring sessions where reviewers score the same conversation and align their standards. Without this, scores drift and trust erodes. Also, book your ninety-day rubric review now to confirm the criteria still reflect your goals. Finally, keep the three-way balance in mind: experience, efficiency, and compliance. Excellence in one at the expense of another is not quality—it’s a trade-off. Keep the rhythm, and quality becomes a habit, not an exception. Up next, we turn these insights into action.
 cekura.aicustomerexperience.io2 min
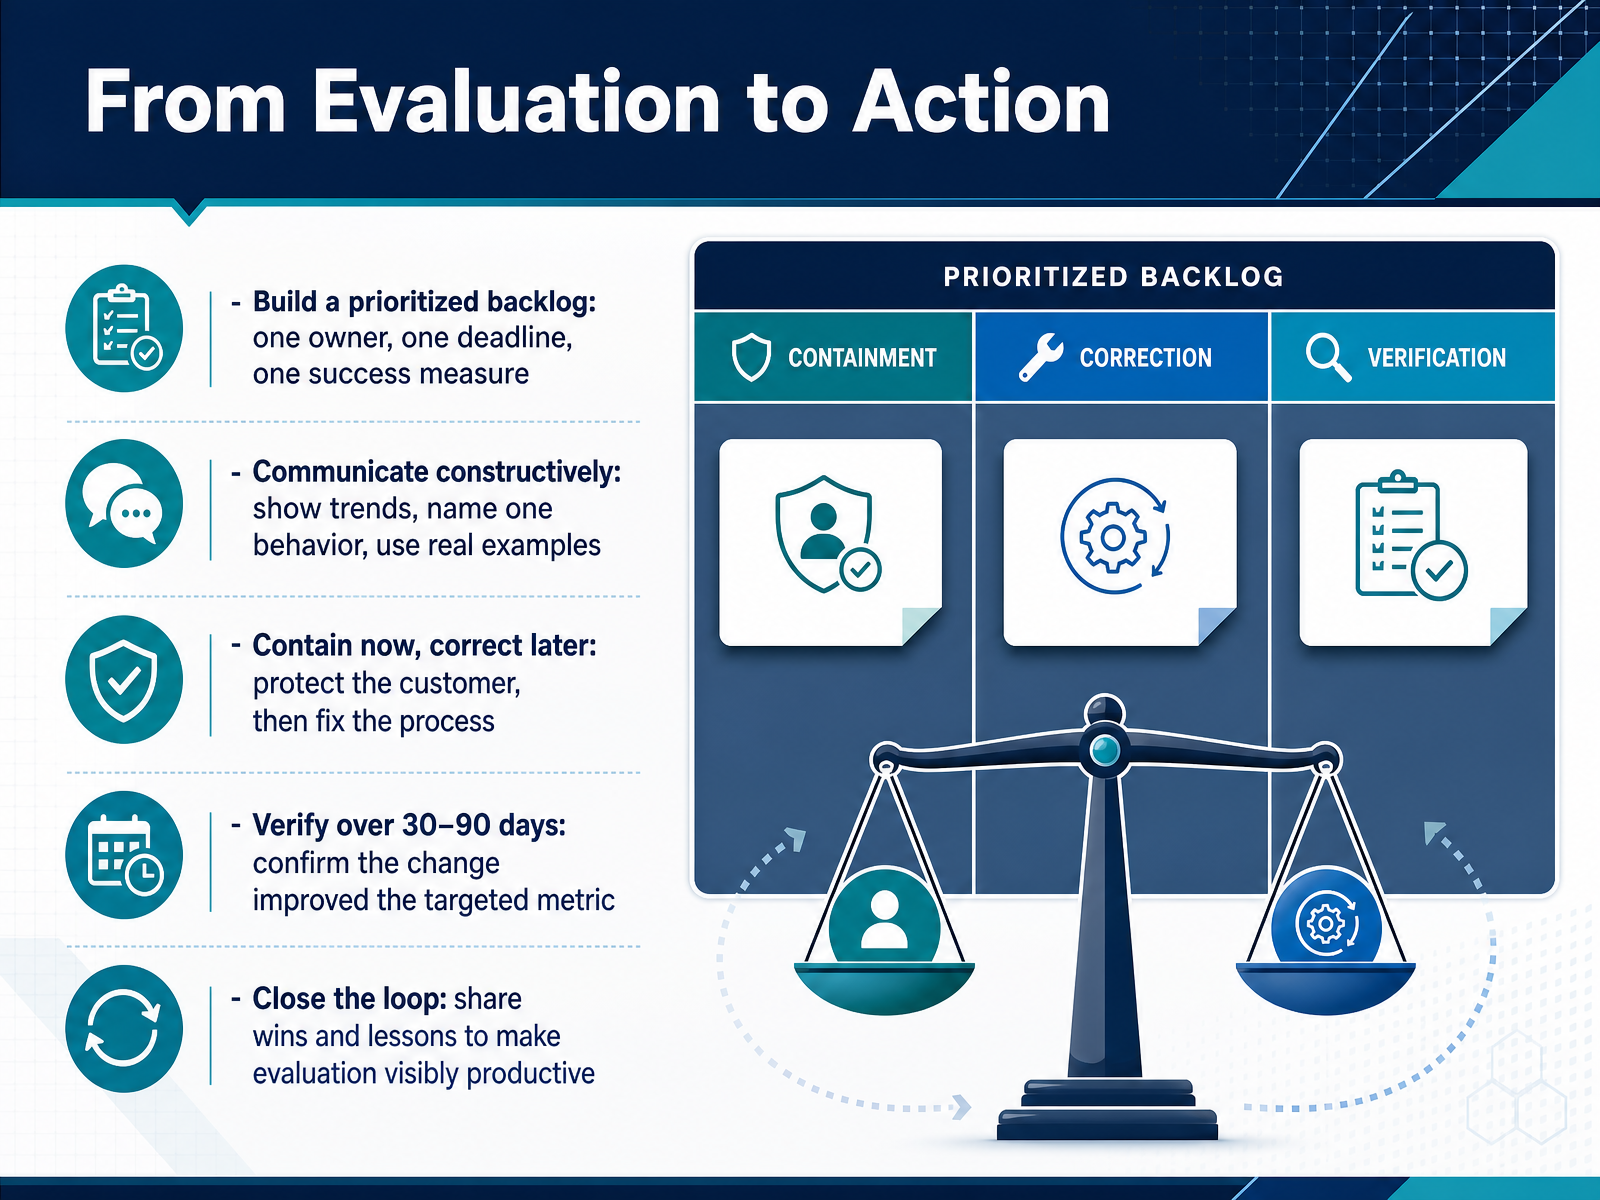
 - 13From Evaluation to ActionSo how do we turn all this evaluation into action that sticks? It starts with a prioritized backlog. For every issue you find, assign one owner, one deadline, and one success measure. If a fix doesn't have all three, it isn't a plan yet. Next, communicate constructively. Don't just point out what went wrong. Show the trend, name one specific behavior to change, and use a real example from a ticket or call. Then, contain now, correct later. If a customer is affected right now, protect them first. Fix the immediate issue, then work on the root cause. Once the fix is in place, verify over thirty to ninety days. Confirm the change actually improved the targeted metric, not just your team's perception of it. Finally, close the loop. Share the wins and the lessons learned. When your team sees that evaluation leads to visible improvement, they'll trust the process and engage with it. That's how you make quality evaluation a productive engine, not just a report. Now, let's wrap up with the key takeaways and your next steps.
 2 min
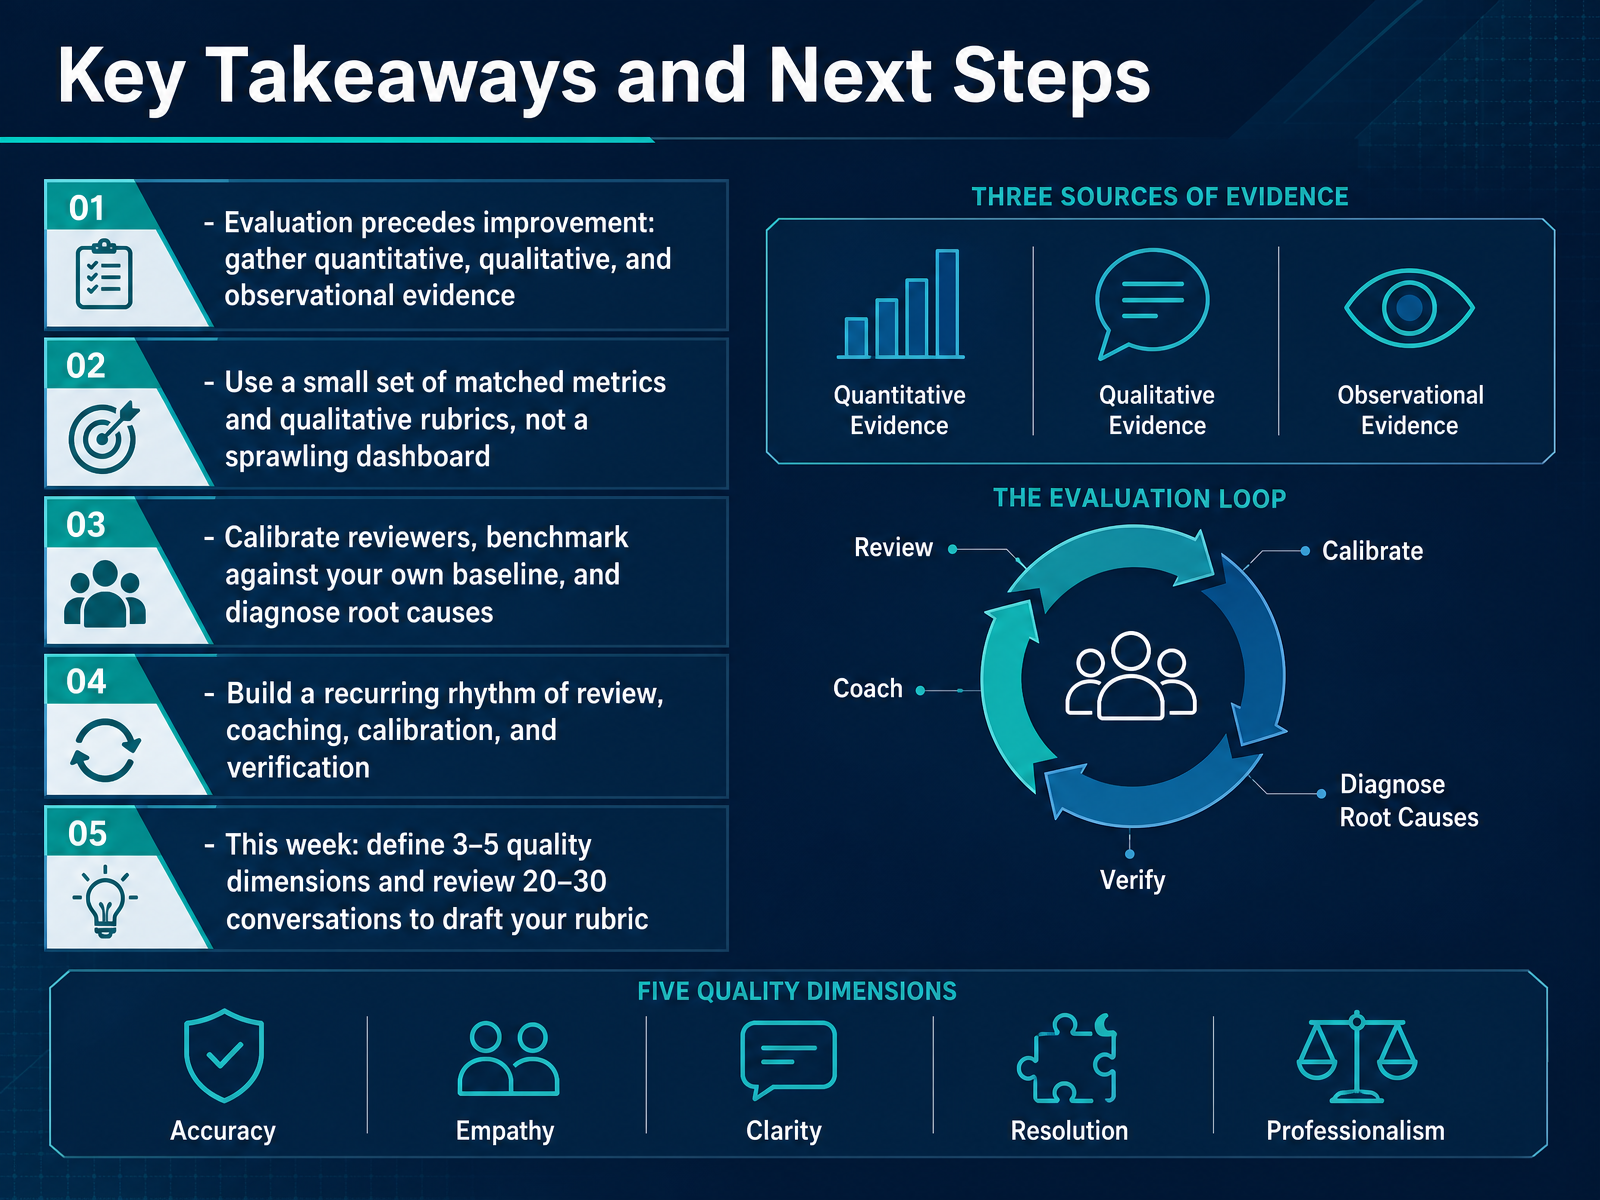
2 min - 14Key Takeaways and Next StepsThis is the moment to turn evaluation into action. Let’s recap what truly moves the needle. First, evaluation always precedes improvement. Gather the numbers, the customer comments, and the actual observations from your team’s work. Second, resist the sprawling dashboard. Pick a small set of matched metrics, and build a qualitative rubric around them. Clarity beats coverage every time. Third, make sure your reviewers are calibrated against each other, benchmark against your own baseline, not some industry ideal, and always push to the root cause of a low score. Finally, build a recurring rhythm. Review, coach, calibrate, and verify. That loop is what sustains quality over time. This week, take one concrete step. Define three to five quality dimensions that matter most to your customers, then review twenty to thirty real conversations and draft your rubric. That single exercise will give you more insight than a month of abstract planning. Thank you for your focus. Now go make your team’s quality visible, measurable, and improvable.
 en.wikipedia.orgen.m.wikipedia.orgsurveymonkey.com+22 min
Take the deck with you
Download this course as a file — free, no sign-up needed.
- PDF handoutEvery slide page, ready to print or share.15 pages · 3.6 MBDownload
- Narrated PowerPointThe deck that presents itself — every slide carries the digital human's narration video.15 pages · 17.5 MBDownload
- PowerPoint slidesThe full deck as a .pptx — open it in PowerPoint, Keynote, or Google Slides.15 pages · 3.5 MBDownload
Free to use in your own training — please keep the PersonWise credit page at the end.
Have your own deck? Turn it into a course
Sources consulted
Web sources consulted while building this course.
- 12 Customer Service KPIs Every Service Team Should Measure | Salesforce — salesforce.com
- Service desk analytics: What to measure and why it matters — blog.hubspot.com
- 11 Top Call Centre Metrics & KPIs to Measure Performance — salesforce.com
- Call center metrics that actually matter (and benchmarks to beat) — ever-help.com
- First Call Resolution (FCR): Measure, Benchmark, and Improve with AI — sqmgroup.com
- SERVQUAL - Wikipedia — en.wikipedia.org
- SERVQUAL - Wikipedia — en.m.wikipedia.org
- The Complete Guide To The 5 Service Quality Dimensions - SurveyMonkey — surveymonkey.com
- SERVQUAL Model: Complete 2026 Guide to 5 Quality Dimensions - FourWeekMBA — fourweekmba.com
- SERVQUAL A Multiple-item Scale for Measuring Consumer Perceptions of Service Quality — researchgate.net
- How to calibrate your customer service QA reviews - Zendesk — zendesk.com
- QA Calibration: How to Run Sessions That Eliminate Scoring Bias - Kaizo — kaizo.com
- Customer Service Quality Assurance: Build a QA Program — cekura.ai
- Customer Service QA Scorecard: Template, Criteria, Examples — customerexperience.io
- Call Calibration: The Complete Guide for 2026 — callflow.dev
- 60+ Customer Service Survey Questions (+ Free Template) — formbricks.com
- How to Ask for Customer Feedback: Timing, Channels, and Templates | Blog | Perspective AI — getperspective.ai
- A Practical Customer Experience Survey Guide for 2026 | AgentStack | Agent Stack — agentstack.build
- How to Create a Customer Satisfaction Survey | Resonate CX — resonate.cx
- Customer feedback survey questions: examples and how to use them | eesel AI — eesel.ai