Begin
14 pages · ~28 min
Measuring UX Design Outcomes
This training helps UX designers and researchers measure and demonstrate the impact of their design work through practical outcome metrics.
A digital instructor presents all 14 pages. Hold “Ask” at any point and ask out loud — the answer comes from this course. No sign-up needed.
What you’ll learn
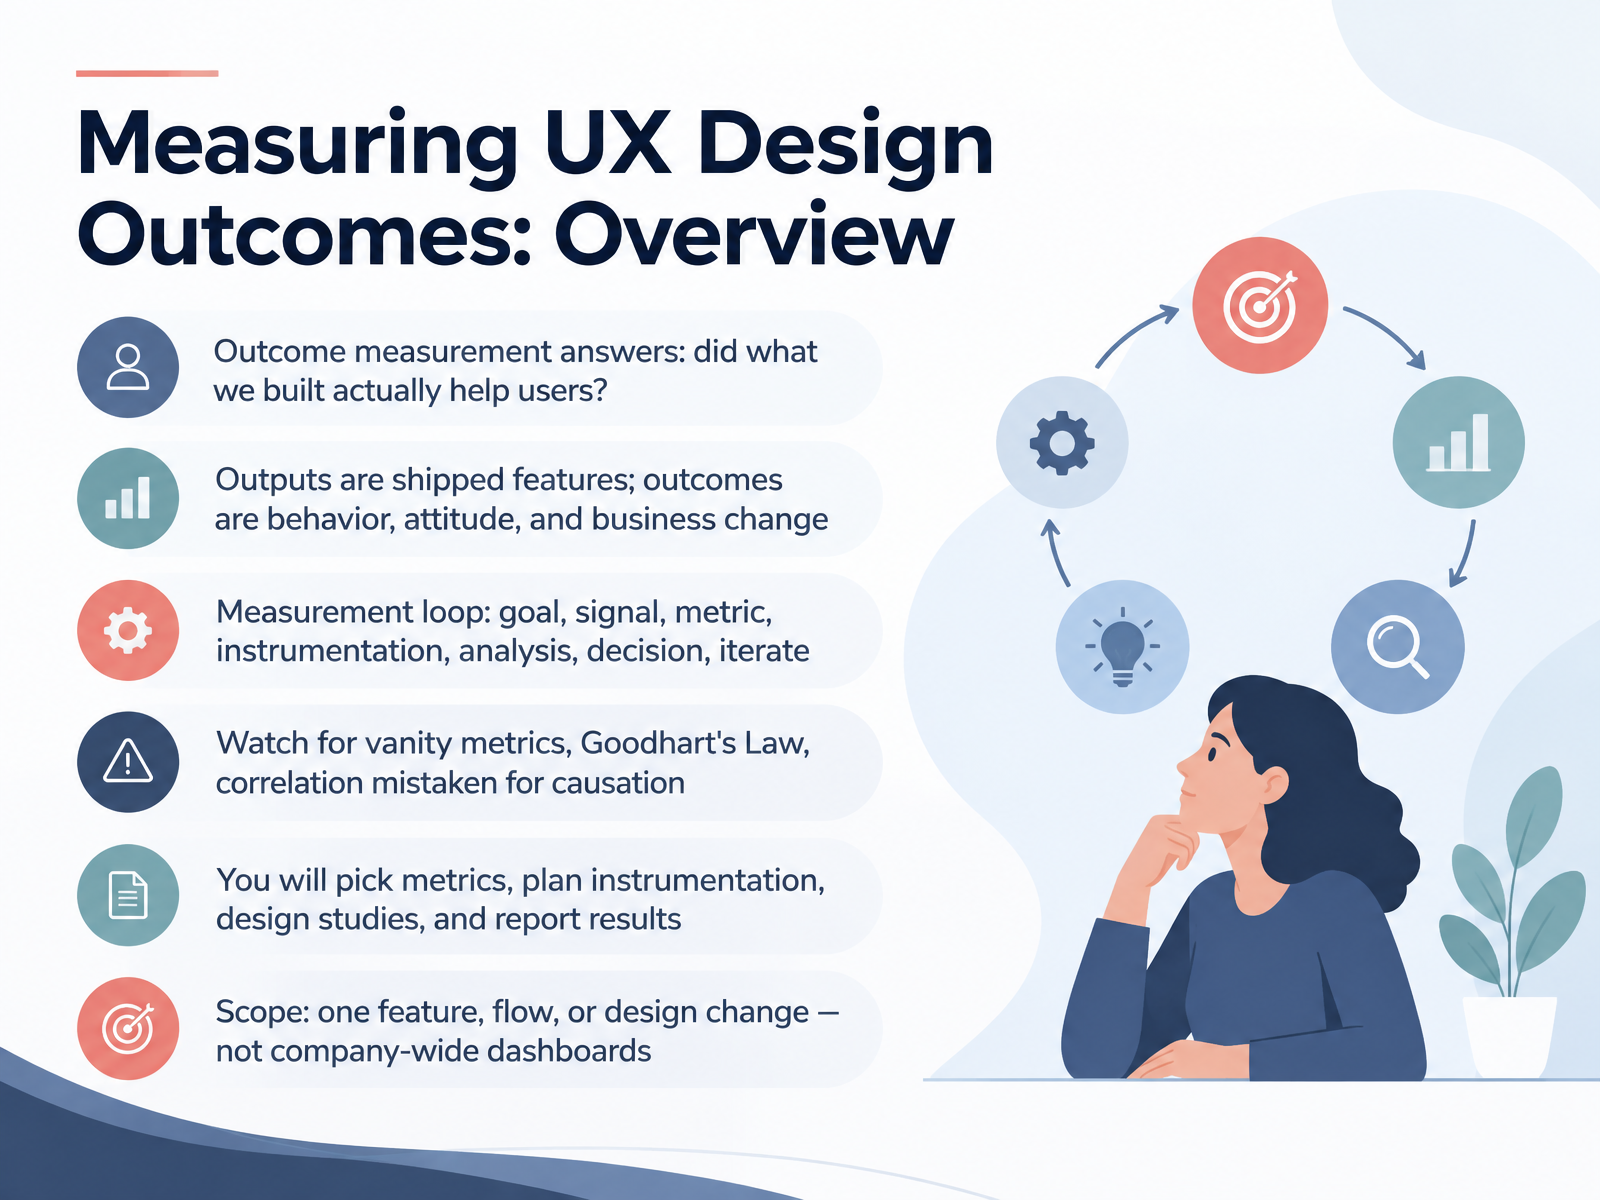
- 01Measuring UX Design Outcomes: OverviewWelcome. Over the next few slides, we are going to look at measuring the outcomes of UX design work. Not just whether we shipped, but whether what we built actually helped users. That distinction matters. Outputs are the features we release. Outcomes are the changes in behavior, attitude, and business results that follow. So how do we measure them? We use a loop: define the goal, choose a signal, turn it into a metric, plan instrumentation, analyze the data, make a decision, and iterate. Along the way, watch for three common traps. First, vanity metrics that look good but do not guide action. Second, Goodhart's Law, where a metric stops being useful once it becomes a target. And third, confusing correlation with causation. In this course, you will practice picking metrics, planning instrumentation, designing studies, and reporting results. Our scope is one feature, flow, or design change at a time, not company-wide dashboards. Let's begin with outputs, outcomes, and the measurement loop.1 min
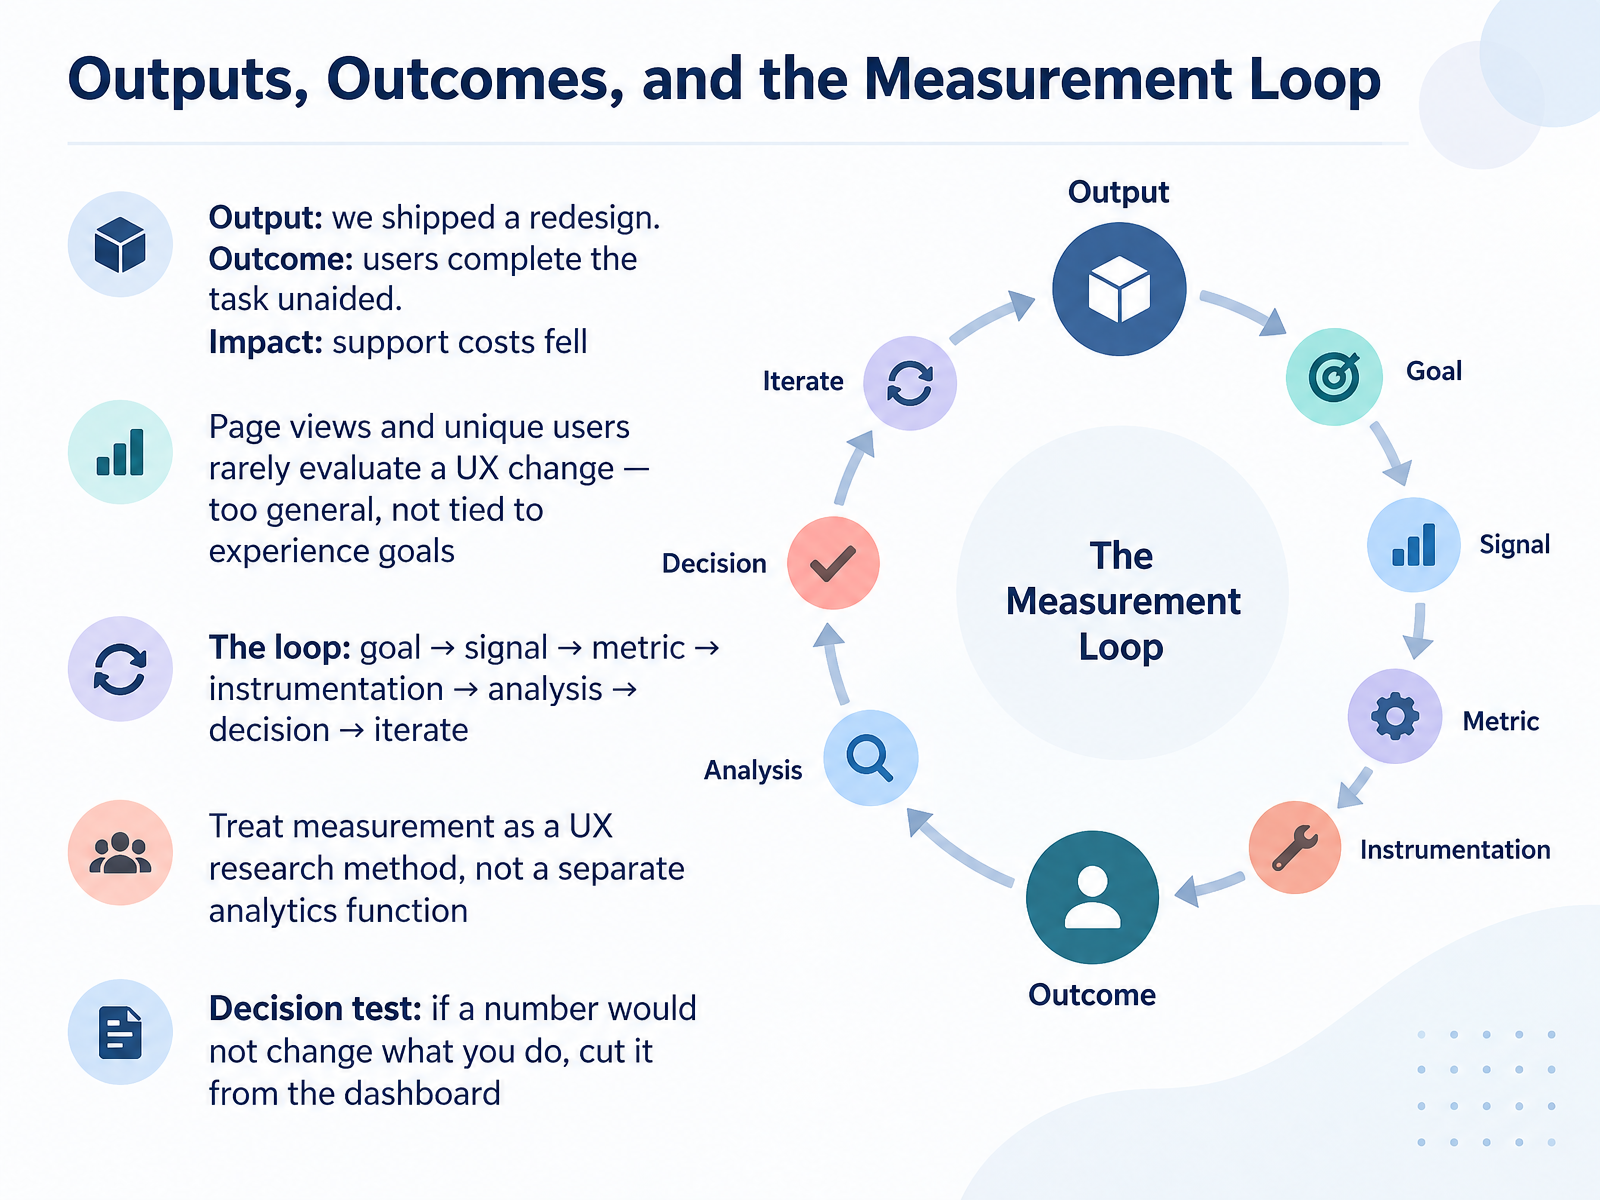
- 02Outputs, Outcomes, and the Measurement LoopLet's separate three things we often blur together. Output is what we shipped, like a redesign. Outcome is what changed for users, like completing the task unaided. Impact is the broader result, like support costs falling. Notice that output tells us nothing about experience on its own. Now, be careful with page views and unique users. They rarely evaluate a UX change. They are too general, and they are not tied to your experience goals. So how do we measure well? We use a loop. Goal, signal, metric, instrumentation, analysis, decision, iterate. That loop is a research method, not a separate analytics function. Treat it that way, and your team stays in the same conversation. Here is a decision test I use. If a number would not change what you do, cut it from the dashboard. That keeps measurement focused on decisions, not decoration. Next, we will look at a framework that helps us choose the right signals and metrics.
 2 min
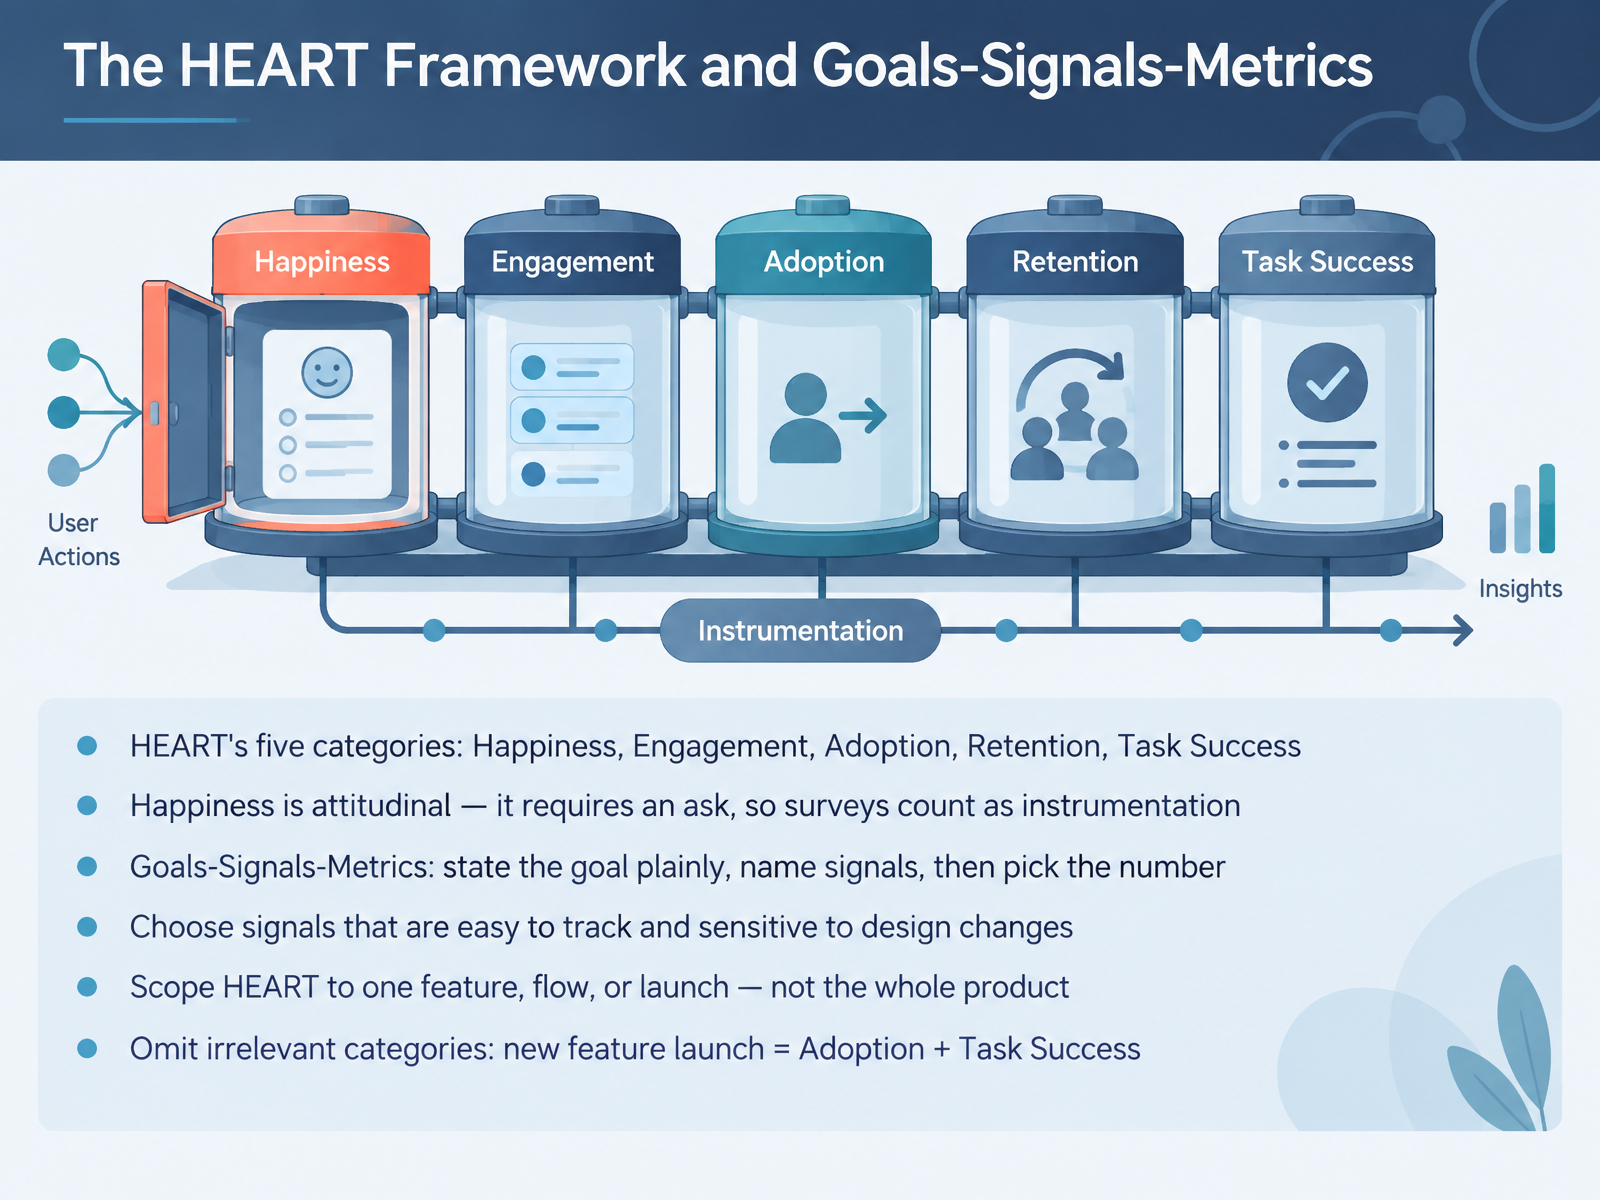
2 min - 03The HEART Framework and Goals-Signals-MetricsNext, let's look at the measurement framework we'll lean on throughout this course. HEART has five categories: Happiness, Engagement, Adoption, Retention, and Task Success. One distinction matters early. Happiness is attitudinal, so it requires an ask. A survey counts as instrumentation, not a soft extra. From there, we move through Goals, Signals, Metrics. State the goal plainly, name the signals that would move if you succeeded or failed, then pick the number. When you choose signals, favor ones that are easy to track and sensitive to design changes. Scope HEART to one feature, flow, or launch, not the whole product, so a movement tells you which change to investigate. And omit categories that don't apply. For a new feature launch, Adoption and Task Success are usually the two that matter most. From Design Intent to Measurable Outcomes.
 library.gv.comdl.acm.orgkerryrodden.com+21 min
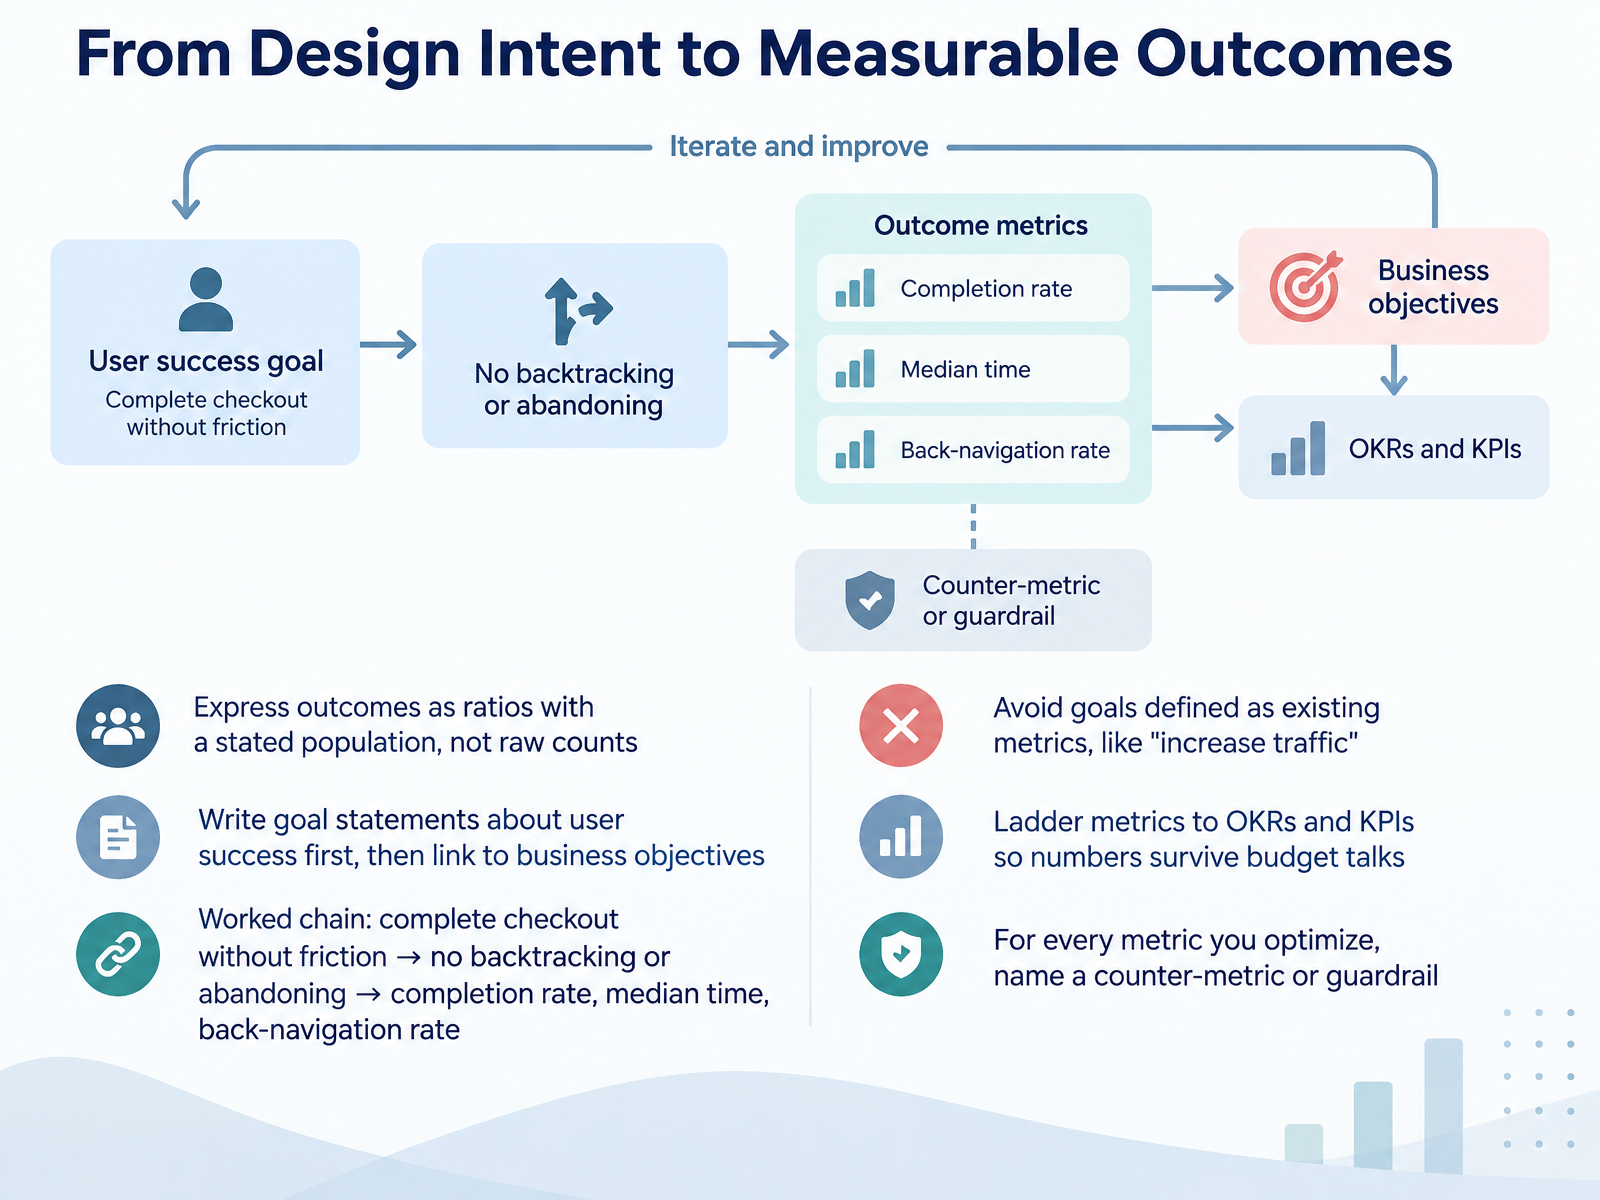
 - 04From Design Intent to Measurable OutcomesLet's talk about turning design intent into measurable outcomes. The first habit is simple: express outcomes as ratios with a stated population, not raw counts. So instead of saying we had two thousand checkouts, say checkout completion rate for users who added an item to cart. Next, write the goal about user success first, then link it to business objectives. Here's a worked chain. Goal: users complete checkout without friction. Signal: they proceed without backtracking or abandoning. Metrics: completion rate, median time, and back-navigation rate. One trap to avoid: goals defined as existing metrics, like increase traffic. That tells us nothing about whether the experience improved. Also, ladder your metrics to OKRs and KPIs so the numbers survive budget talks. And for every metric you optimize, name a counter-metric or guardrail. If completion rate rises but returns spike, you learned something important. Next, we'll look at choosing the right UX metrics.
 library.gv.comkoji.sogithub.com+22 min
 - 05Choosing the Right UX MetricsNow let's talk about choosing the right UX metrics. There are four lenses to work with: behavioral, attitudinal, desirability, and business outcome. Behavioral metrics show what happened. Attitudinal metrics explain how it felt. You need both, because a smooth-looking flow can still leave people frustrated. Take the System Usability Scale. It's ten items, scored from zero to one hundred, and that is a score, not a percentage. Sixty-eight is average. Below fifty-one signals serious usability problems. Then there's NPS, which tracks relationship trends over time, versus CSAT, which scopes to one moment. For task performance, pair task success rate with time on task and error rate. Finally, match your metric set to the product stage and the decision in front of you. A pre-product-market-fit team needs task success. A mature product needs SUS benchmarks and retention. The metric should follow the decision, not the other way around. Next, we'll look at instrumentation and data collection.
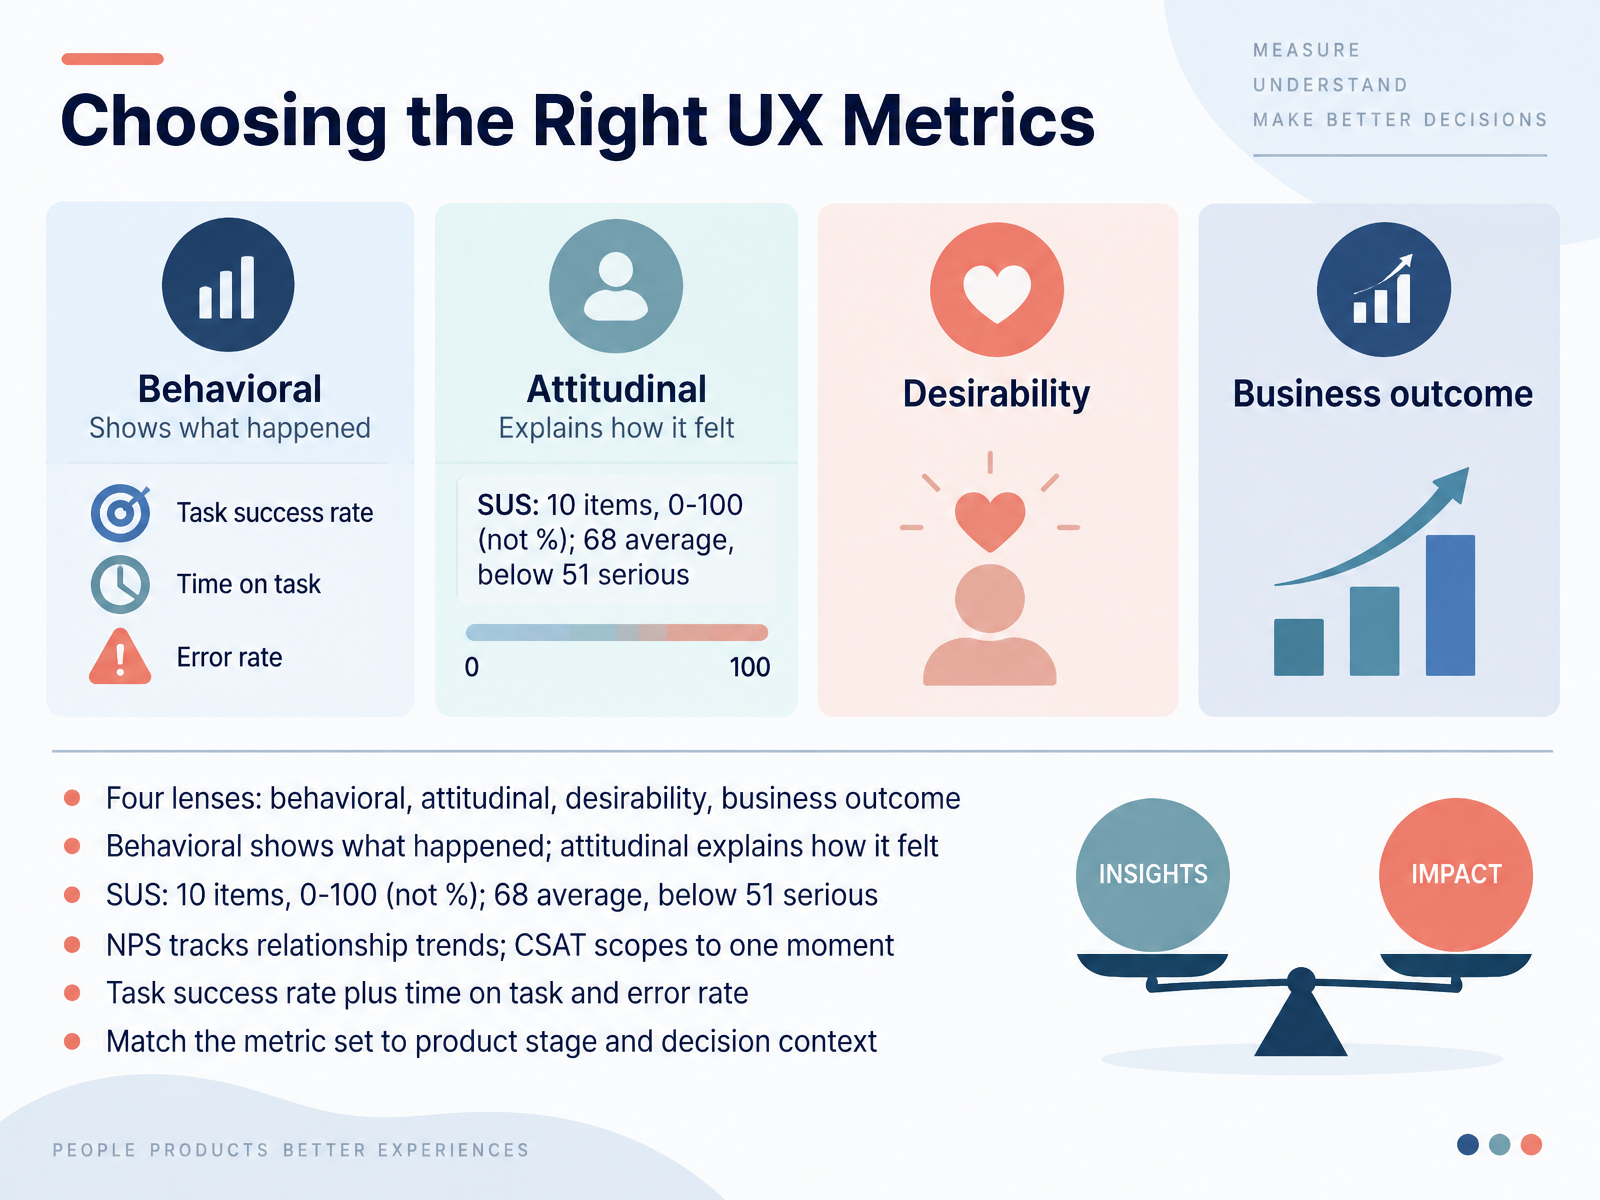 courseux.comvezert.comresources.rework.com+21 min
 - 06Instrumentation and Data CollectionNow let's talk about how we actually collect the data. It starts with an event taxonomy. Turn your hypothesis into named start and complete pairs, and document the funnels between them. Next, not every metric lives in the same place. Behavioral metrics, like clicks and completions, come from analytics. Happiness and perceptual task success need surveys. Keep that split clear. Then apply data minimization by default: collect only events that answer a decision question. If a field doesn't inform a choice, leave it out. For consent, emit state, timestamp, and policy version as events, and enforce them at every export point. When consent gaps appear, segment your populations, use aggregate modes, and track consent trends over time. Finally, run QA checks for missing events, sampling bias, and duplicates. And watch for instrumentation changes that fake product changes. Because a jump in your funnel might be a tracking shift, not a design win. Let's look at baselines, targets, and what to fix first.
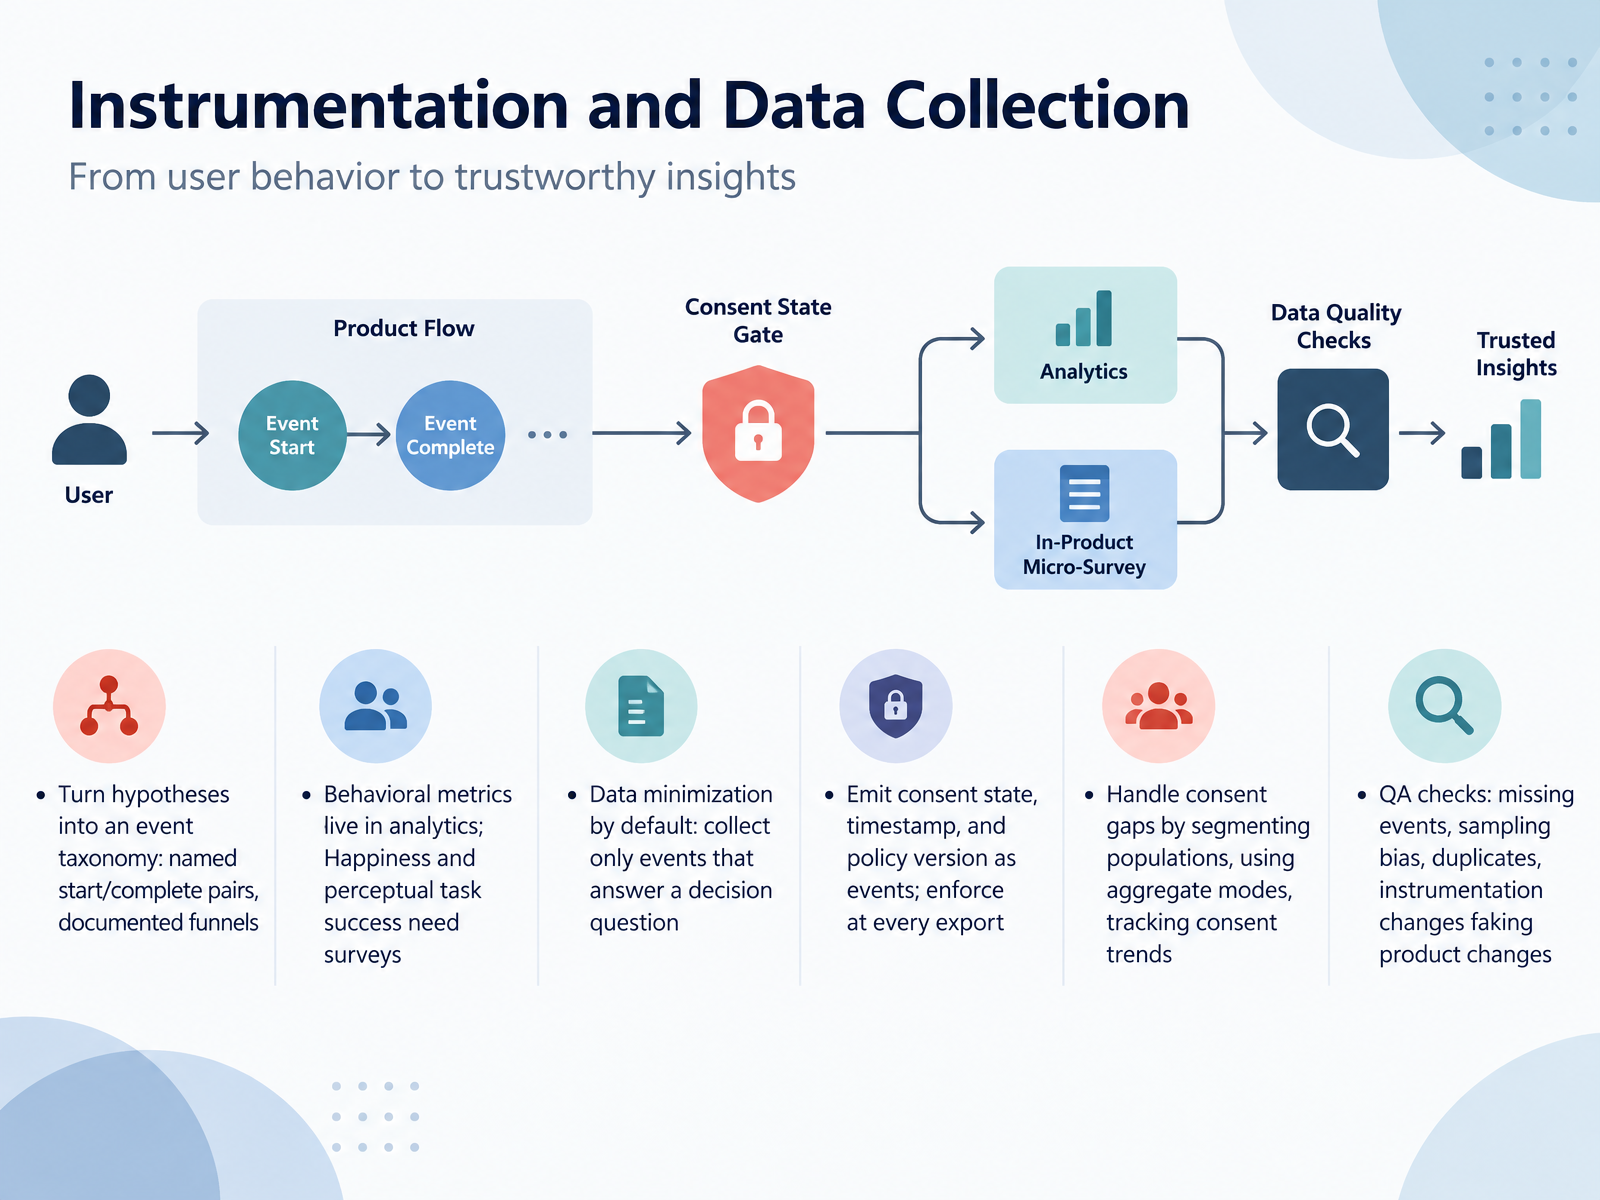 datascale.dewizbrand.comcookie.solutions+22 min
 - 07Baselines, Targets, and What to Fix FirstNow, how do we set baselines, targets, and decide what to fix first? Start with the baseline. Without a pre-redesign reading, your post-launch number is meaningless. Measure before you ship. Then set target bands, not single numbers. For example, aim for ninety to ninety-five percent task success, not exactly ninety-three. When you prioritize fixes, weigh four things: impact, confidence, effort, and measurability. For a minimum viable scorecard, start with one outcome metric, two behavioral, one attitudinal, and one guardrail. Keep your dashboard to six to eight metrics, mixed types, and show trends over snapshots. And pair every number you report with an action, or it won't survive review. That keeps your measurement honest and useful. Next, we'll look at study and experiment designs for design changes.
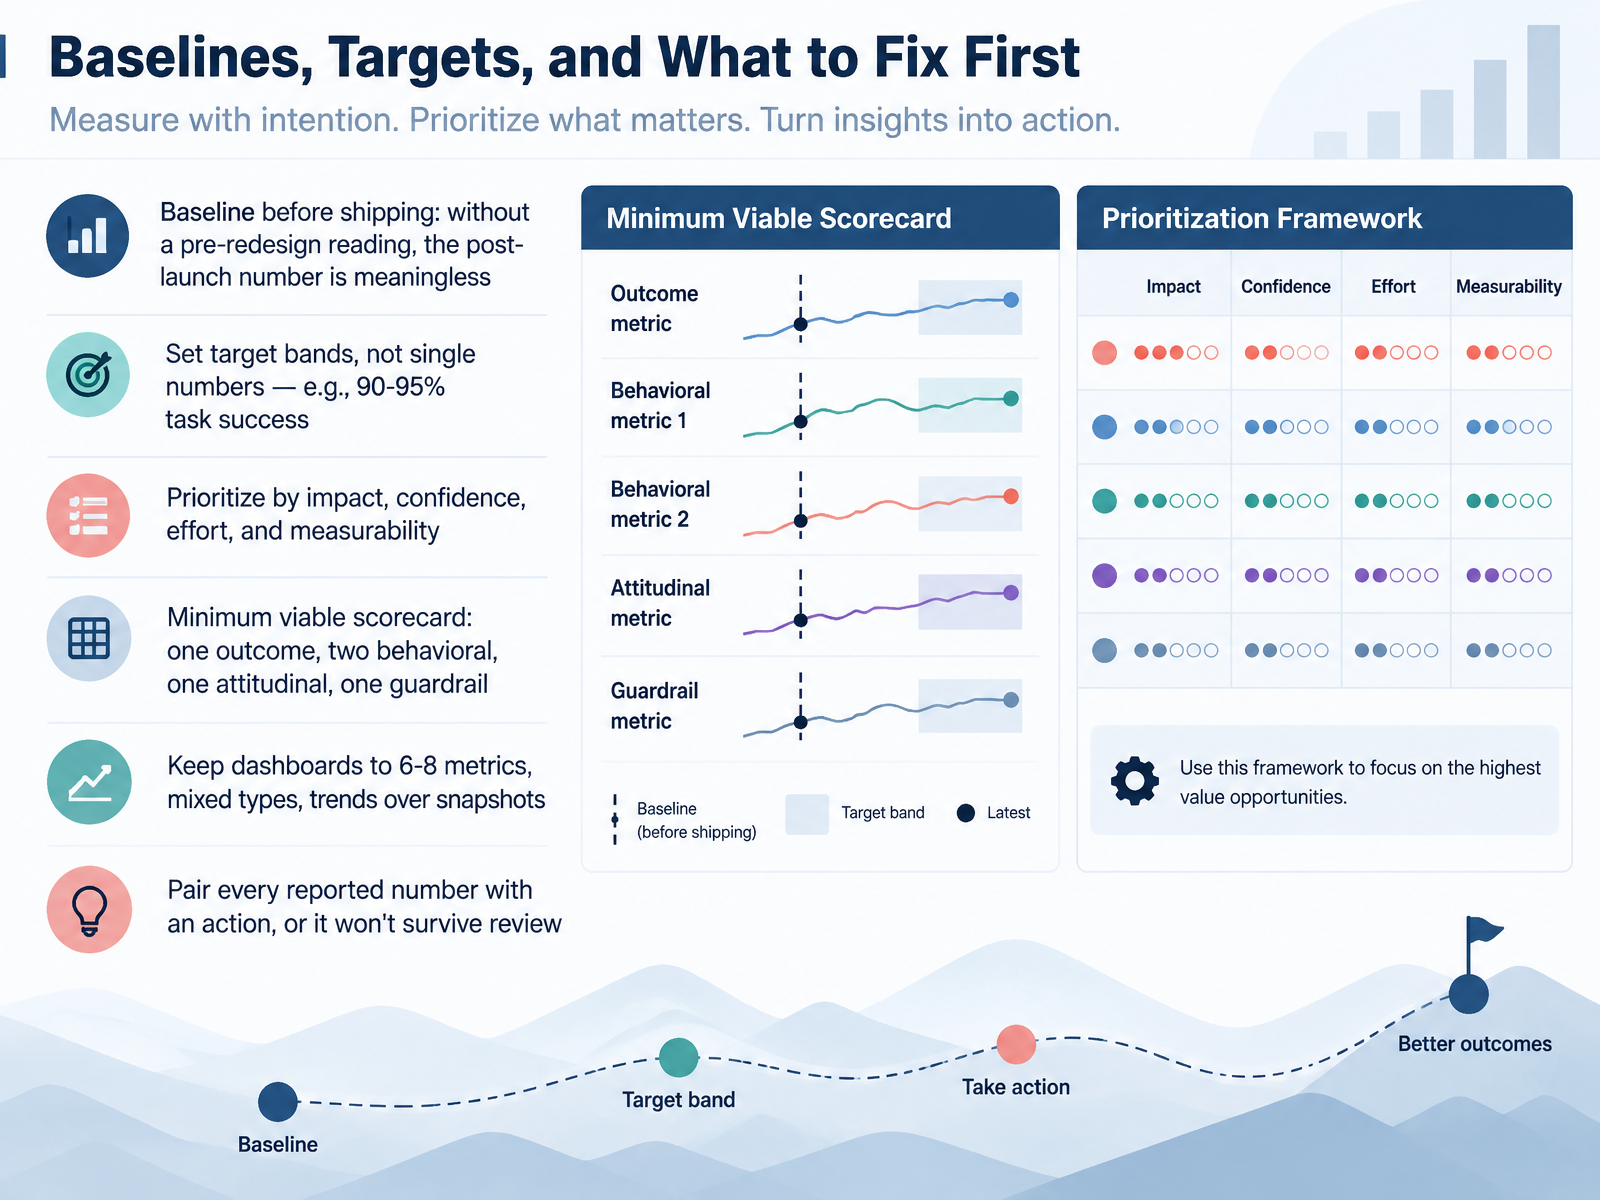 courseux.comvezert.comresources.rework.com+21 min
 - 08Study and Experiment Designs for Design ChangesLet's move from choosing metrics to choosing a study design. Pre and post, A minus B, and holdout designs each answer different questions, so match the design to the decision. If you cannot randomise, use difference in differences or interrupted time series instead. Before launch, lock one hypothesis, one primary metric, and a short list of guardrails. Your randomisation unit must match your analysis unit, and always run a sample ratio mismatch check. One practical rule: do not A minus B test rare events, obvious bug fixes, or brand trust. Rare events never reach sample size. Bug fixes just ship. Brand trust plays out over months, not two weeks. So pick the design that fits the question, then commit to the plan. Next, we will look at sample size, power, and practical significance.
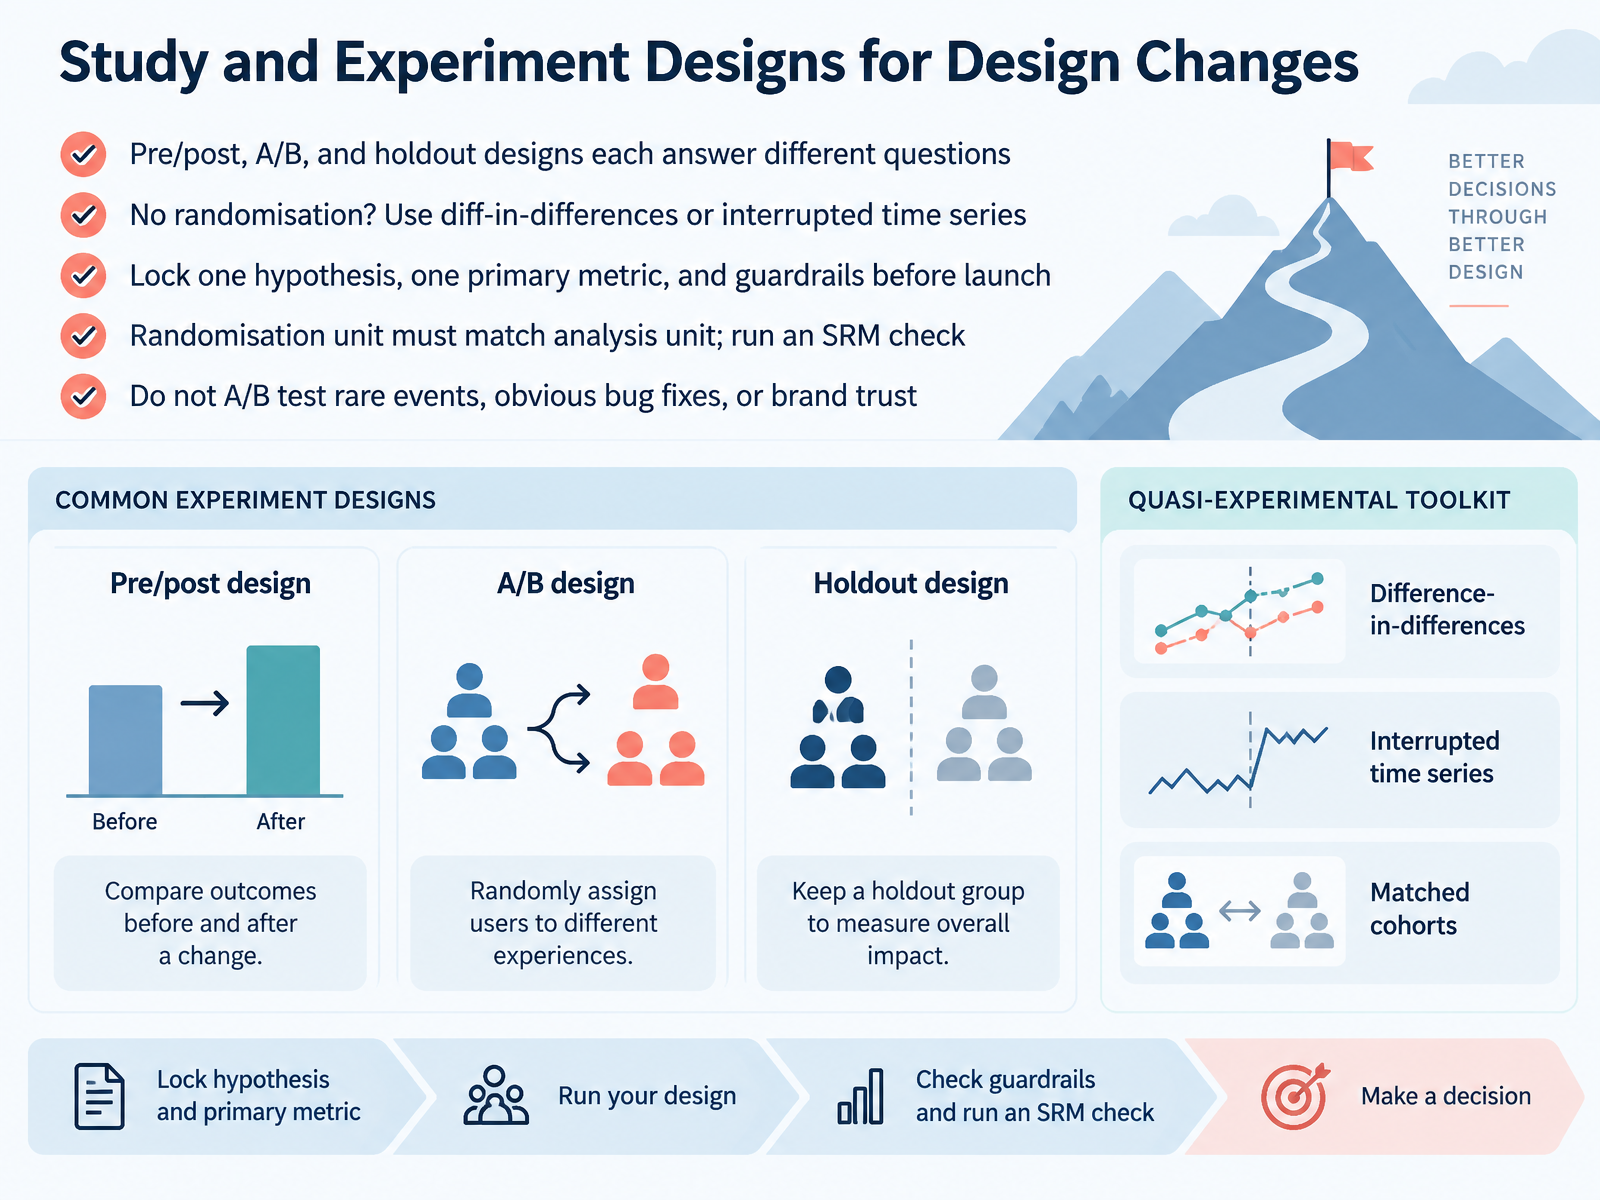 redclawey.com1 min
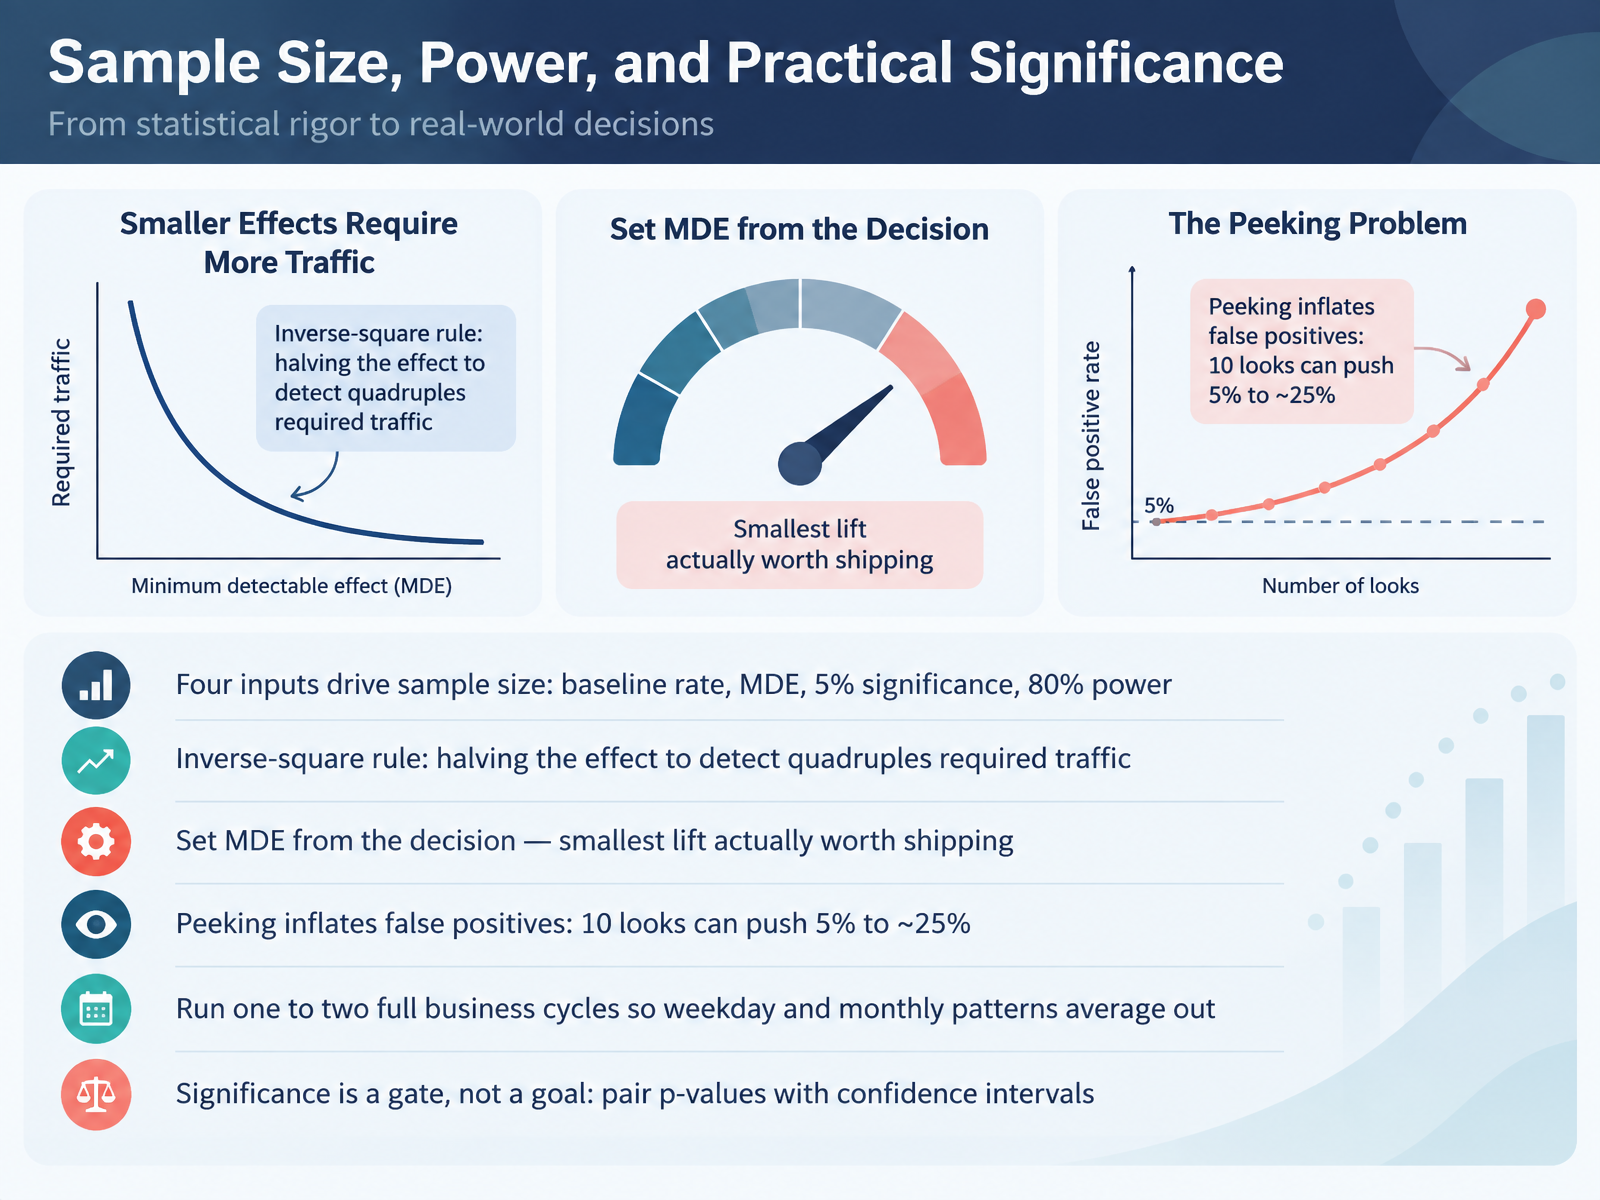
 - 09Sample Size, Power, and Practical SignificanceLet's talk about sizing an experiment properly. Four inputs drive your sample size: the baseline rate, the minimum detectable effect, five percent significance, and eighty percent power. Power is just the chance of detecting a real effect when one exists. The minimum detectable effect, or MDE, is the smallest lift you actually want to catch. Here's the key intuition: sample size scales with the inverse square of the effect. Halve the effect you want to detect, and you roughly quadruple the traffic you need. That's why you should set the MDE from the decision itself, the smallest lift genuinely worth shipping. Tiny effects demand enormous samples. And do not peek. Checking results repeatedly and stopping when they look significant inflates false positives. Ten looks can push a five percent error rate up to roughly twenty five percent. So commit to the sample before you launch. Also, run one to two full business cycles, so weekday and monthly patterns average out. Finally, remember that significance is a gate, not a goal. Pair your p-value with a confidence interval to see the effect size and its uncertainty. That leads us into analyzing and interpreting results.
 redclawey.com2 min
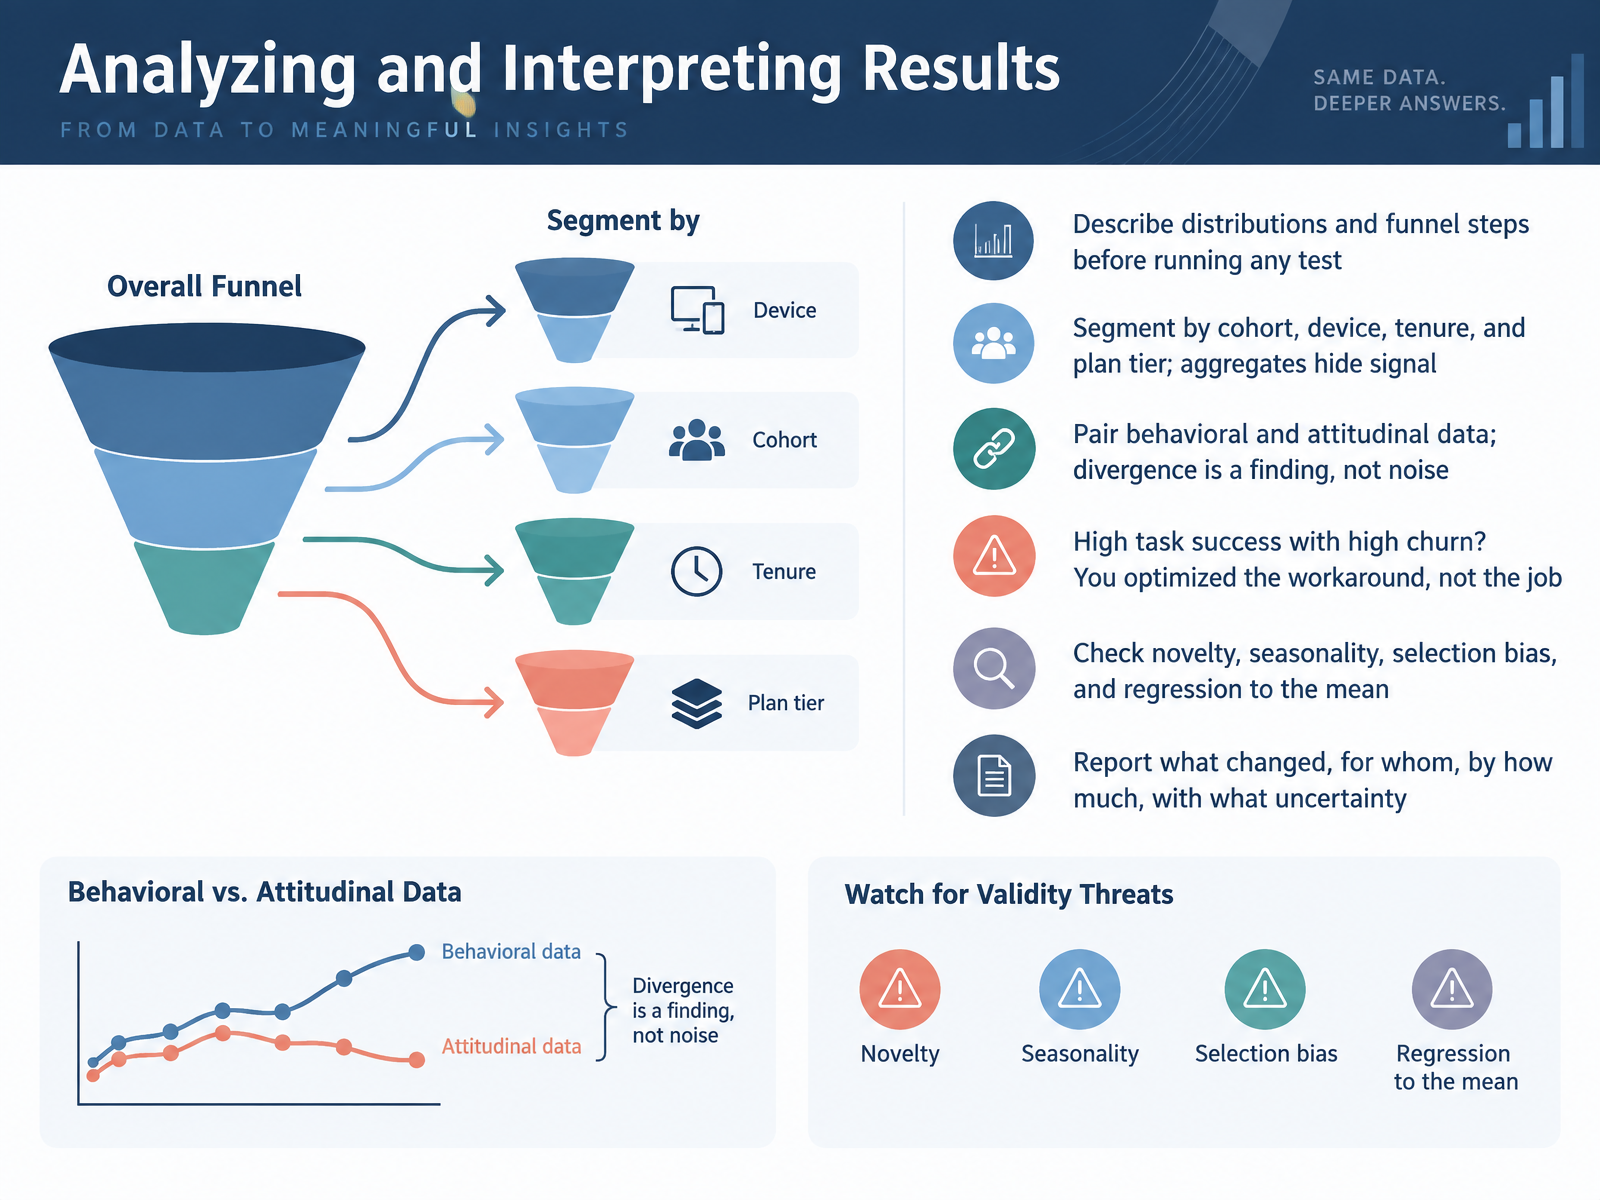
 - 10Analyzing and Interpreting ResultsNow let's analyze and interpret results. Before you run any test, describe your distributions and funnel steps. Where do users actually drop off? Then segment by cohort, device, tenure, and plan tier, because aggregates hide signal. A blended average can look fine while one cohort is failing. Pair behavioral and attitudinal data. If task success is high but satisfaction is low, that divergence is a finding, not noise. Here's a pattern worth knowing: high task success with high churn means you optimized the workaround, not the job. Users finished the flow you measured, but it wasn't the outcome they wanted. Before you claim an effect, check novelty, seasonality, selection bias, and regression to the mean. Finally, report what changed, for whom, by how much, and with what uncertainty. So the takeaway is simple: segment, pair, and qualify before you conclude. Next, we'll look at communicating outcomes to stakeholders.
 courseux.comvezert.comresources.rework.com+21 min
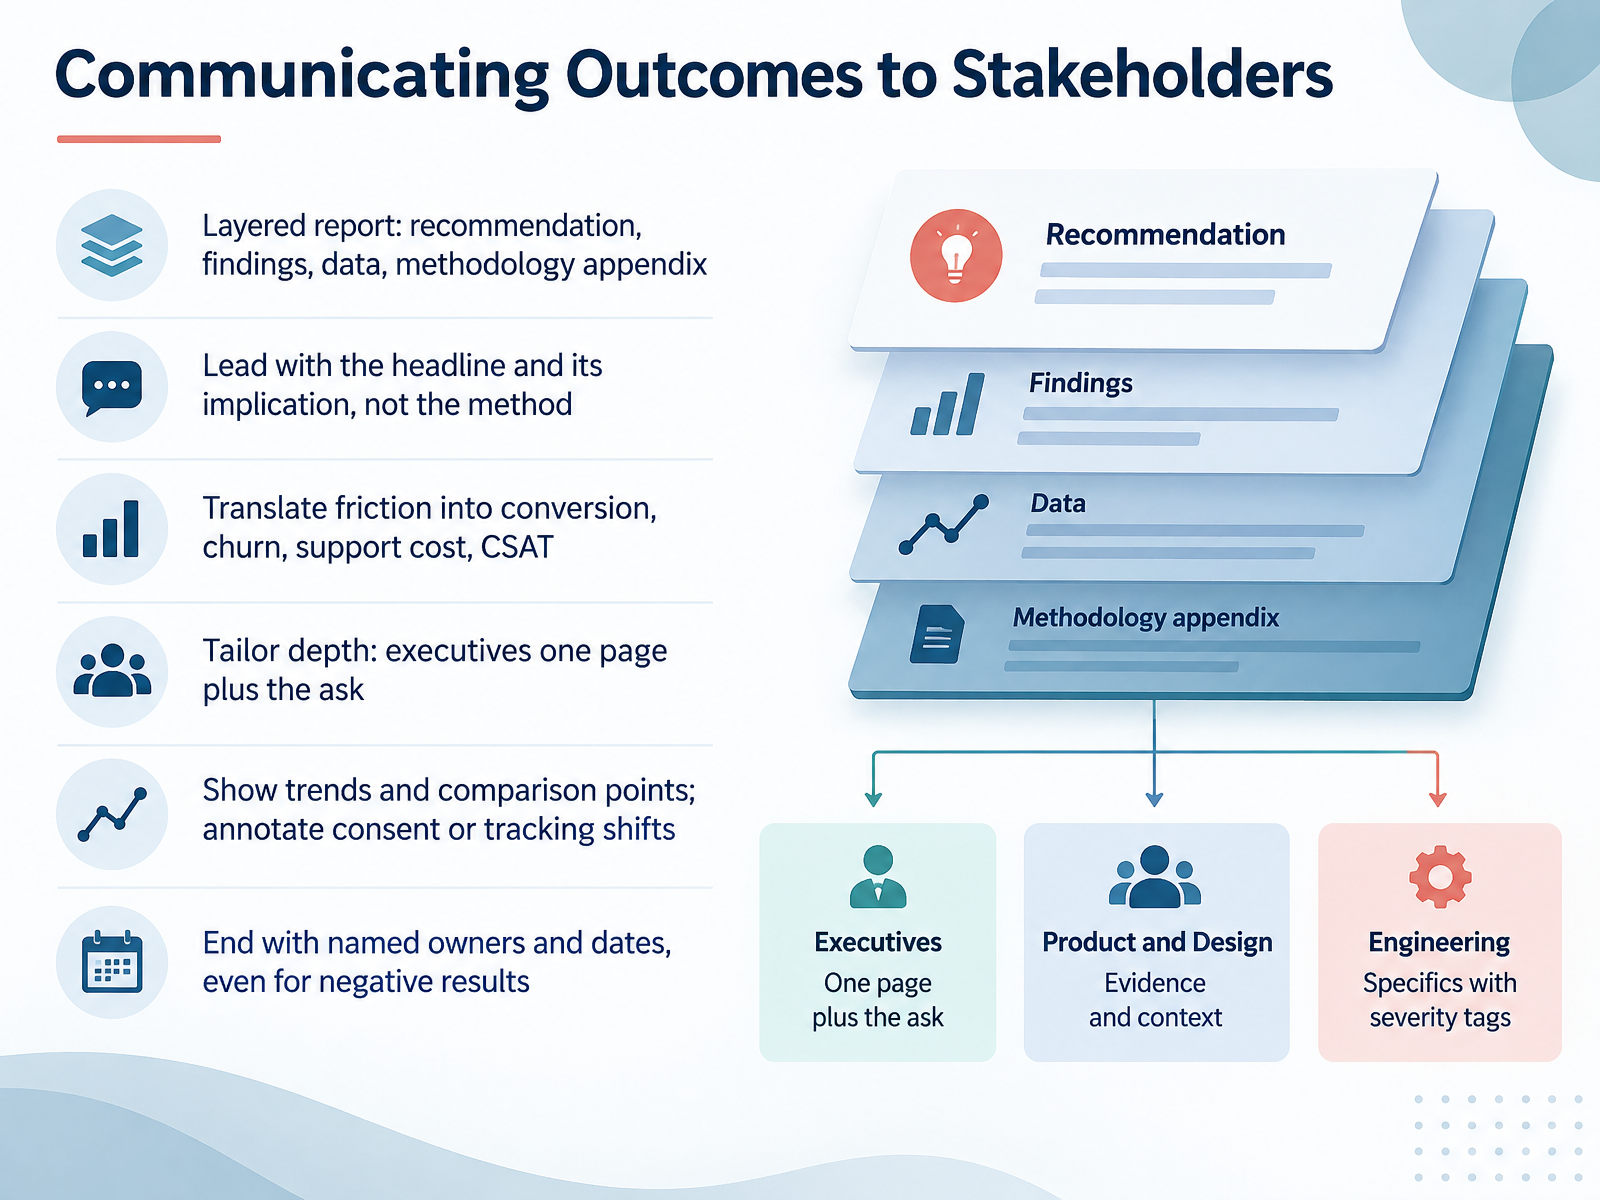
 - 11Communicating Outcomes to StakeholdersNow let's talk about how to communicate what you measured. The goal here is a layered report. Start with the recommendation, then the findings, then the data, and keep methodology in an appendix. Lead with the headline and its implication, not the method. Stakeholders want to know what changed and what it means. Then translate friction into business terms. A confusing checkout is not just a usability issue, it is lost conversion, higher churn, more support cost, and lower customer satisfaction. Tailor the depth. For executives, give them one page plus the ask. Show trends and comparison points, and annotate any shifts in consent or tracking so nobody misreads the data. Finally, always end with named owners and dates, even for negative results. A clear owner turns a finding into a decision, and a negative result with a plan is still progress. That keeps our work accountable and trusted. Next, we will look at common pitfalls and ethical considerations.
 1 min
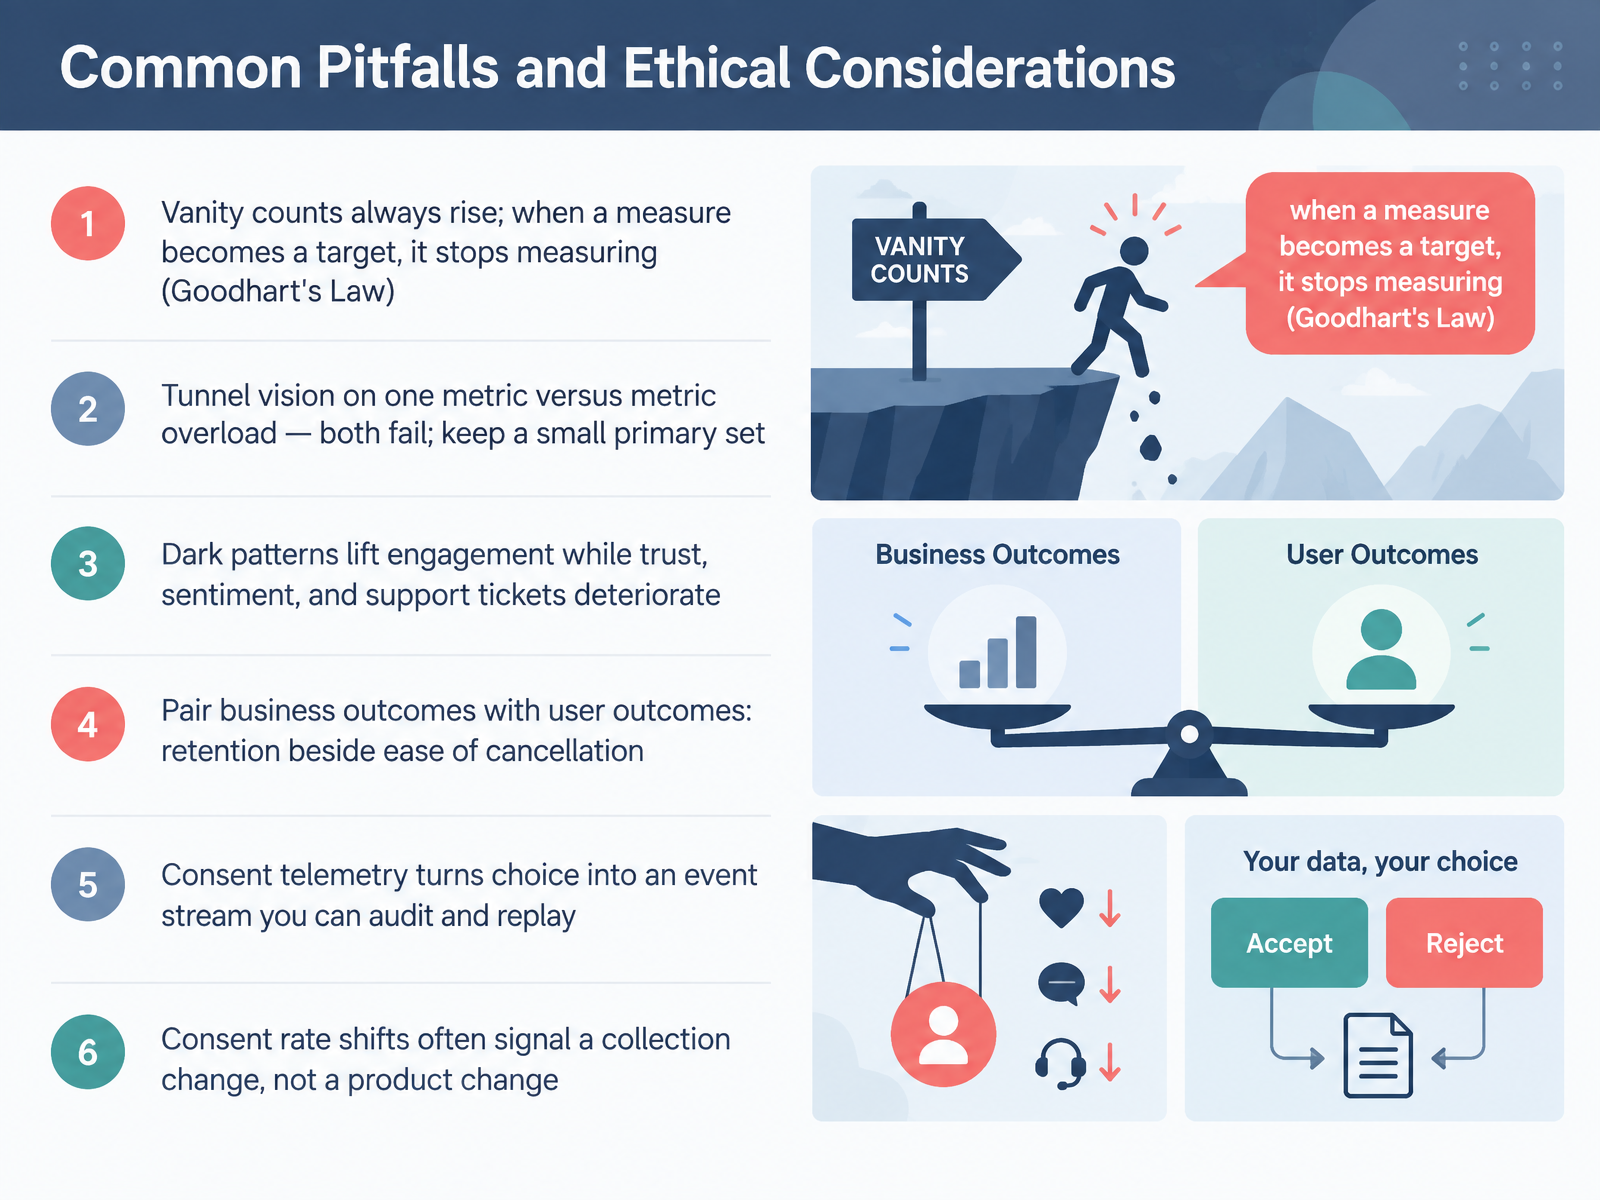
1 min - 12Common Pitfalls and Ethical ConsiderationsLet's talk about the pitfalls that quietly break UX measurement, and the ethics that keep it honest. First, vanity counts always rise. Impressions, sessions, sign-ups. But when a measure becomes a target, it stops measuring. That's Goodhart's Law. So be careful what you put on a scorecard.
Second, tunnel vision on one metric fails, and metric overload fails too. Keep a small primary set. Two or three measures you protect, with guardrails around them.
Third, dark patterns lift engagement while trust, sentiment, and support tickets deteriorate. Those costs are real, and they show up later.
So pair business outcomes with user outcomes. Retention next to ease of cancellation. Revenue next to reported confusion.
Finally, consent telemetry treats choice as an event stream you can audit and replay. One caution: a consent rate shift often signals a collection change, not a product change. Check your tagging before you celebrate.
Next, we'll look at Operationalizing Outcome Measurement.
 2 min
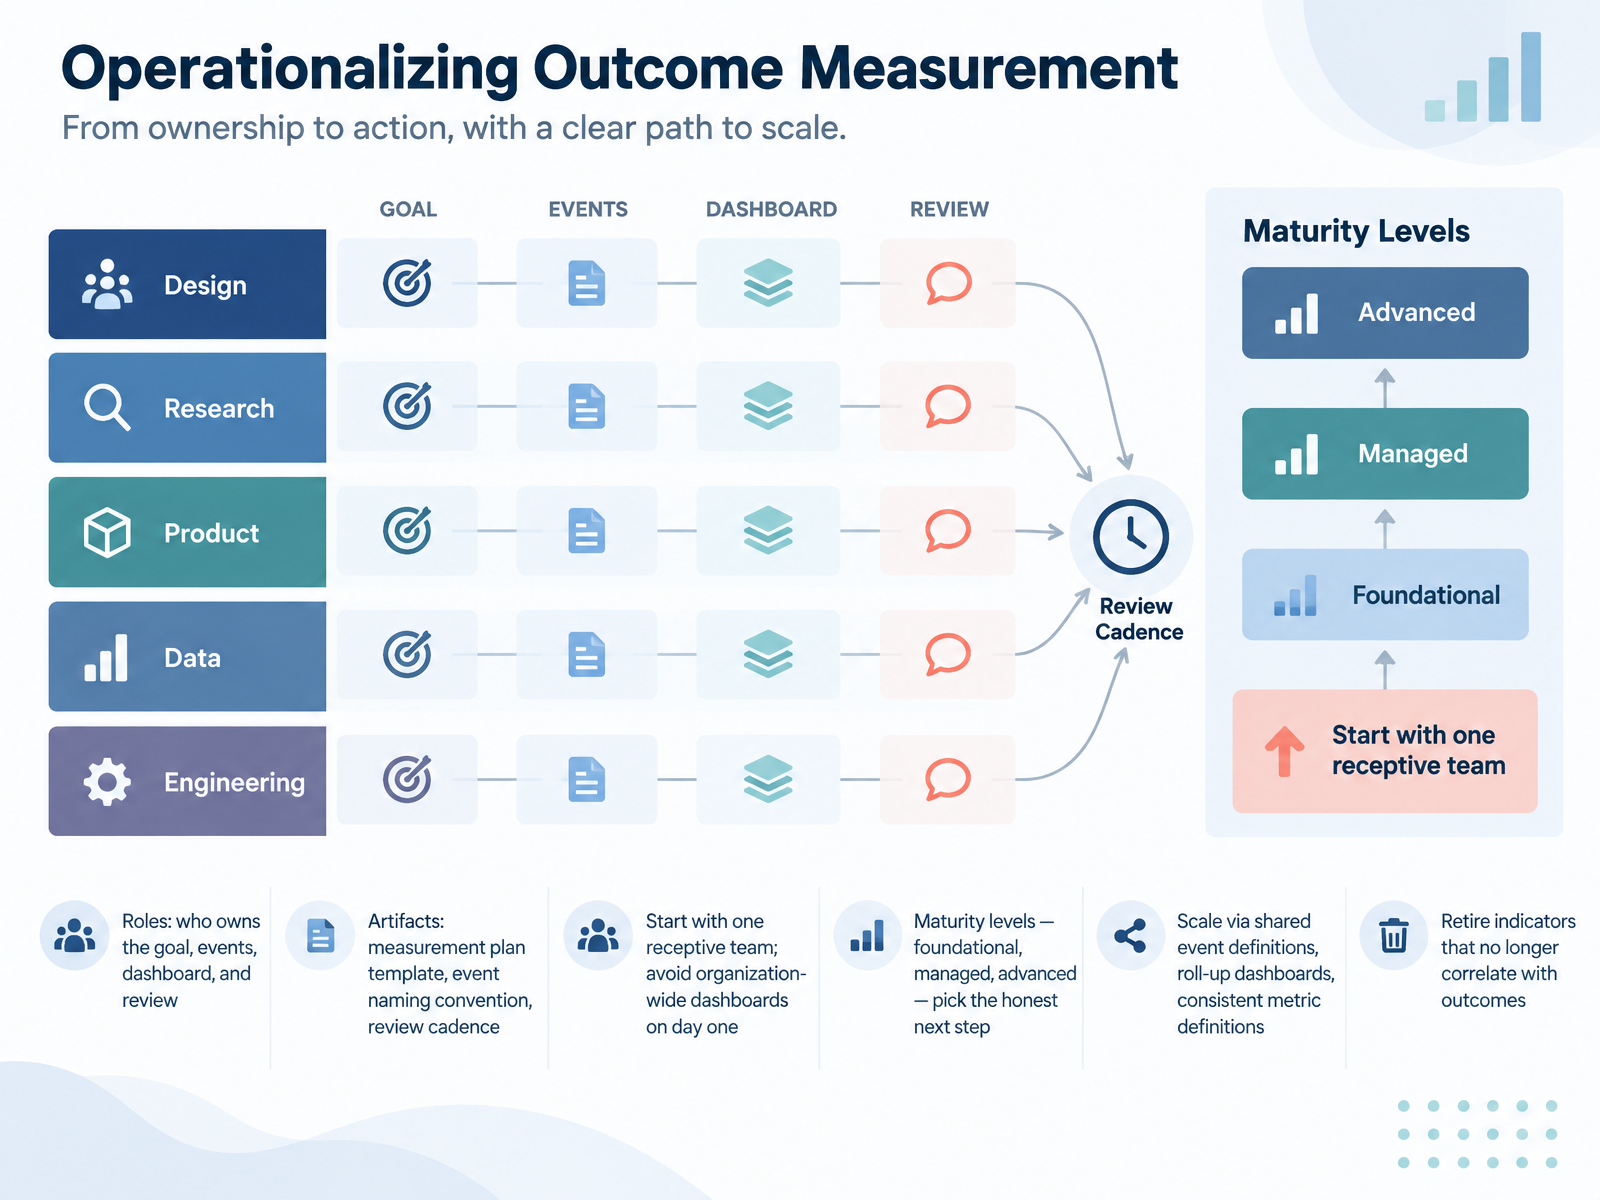
2 min - 13Operationalizing Outcome MeasurementNow let's talk about making measurement stick. This is where operationalizing outcome measurement comes in. Start with roles. Someone owns the goal, someone owns the events, someone owns the dashboard, and someone owns the review. Name those people or the plan stalls. Next, agree on artifacts. A measurement plan template, an event naming convention, and a review cadence. That is it. The playbook can stay lightweight. Here is the practical move. Start with one receptive team. Avoid organization-wide dashboards on day one. That is how measurement programs fail. Instead, pick the honest next step. Foundational, managed, or advanced. Then scale through shared event definitions, roll-up dashboards, and consistent metric definitions. Finally, retire indicators that no longer correlate with outcomes. Metrics should earn their place. If they stop predicting anything useful, stop tracking them. Let's put this into practice with a workshop on designing a measurement plan.
 1 min
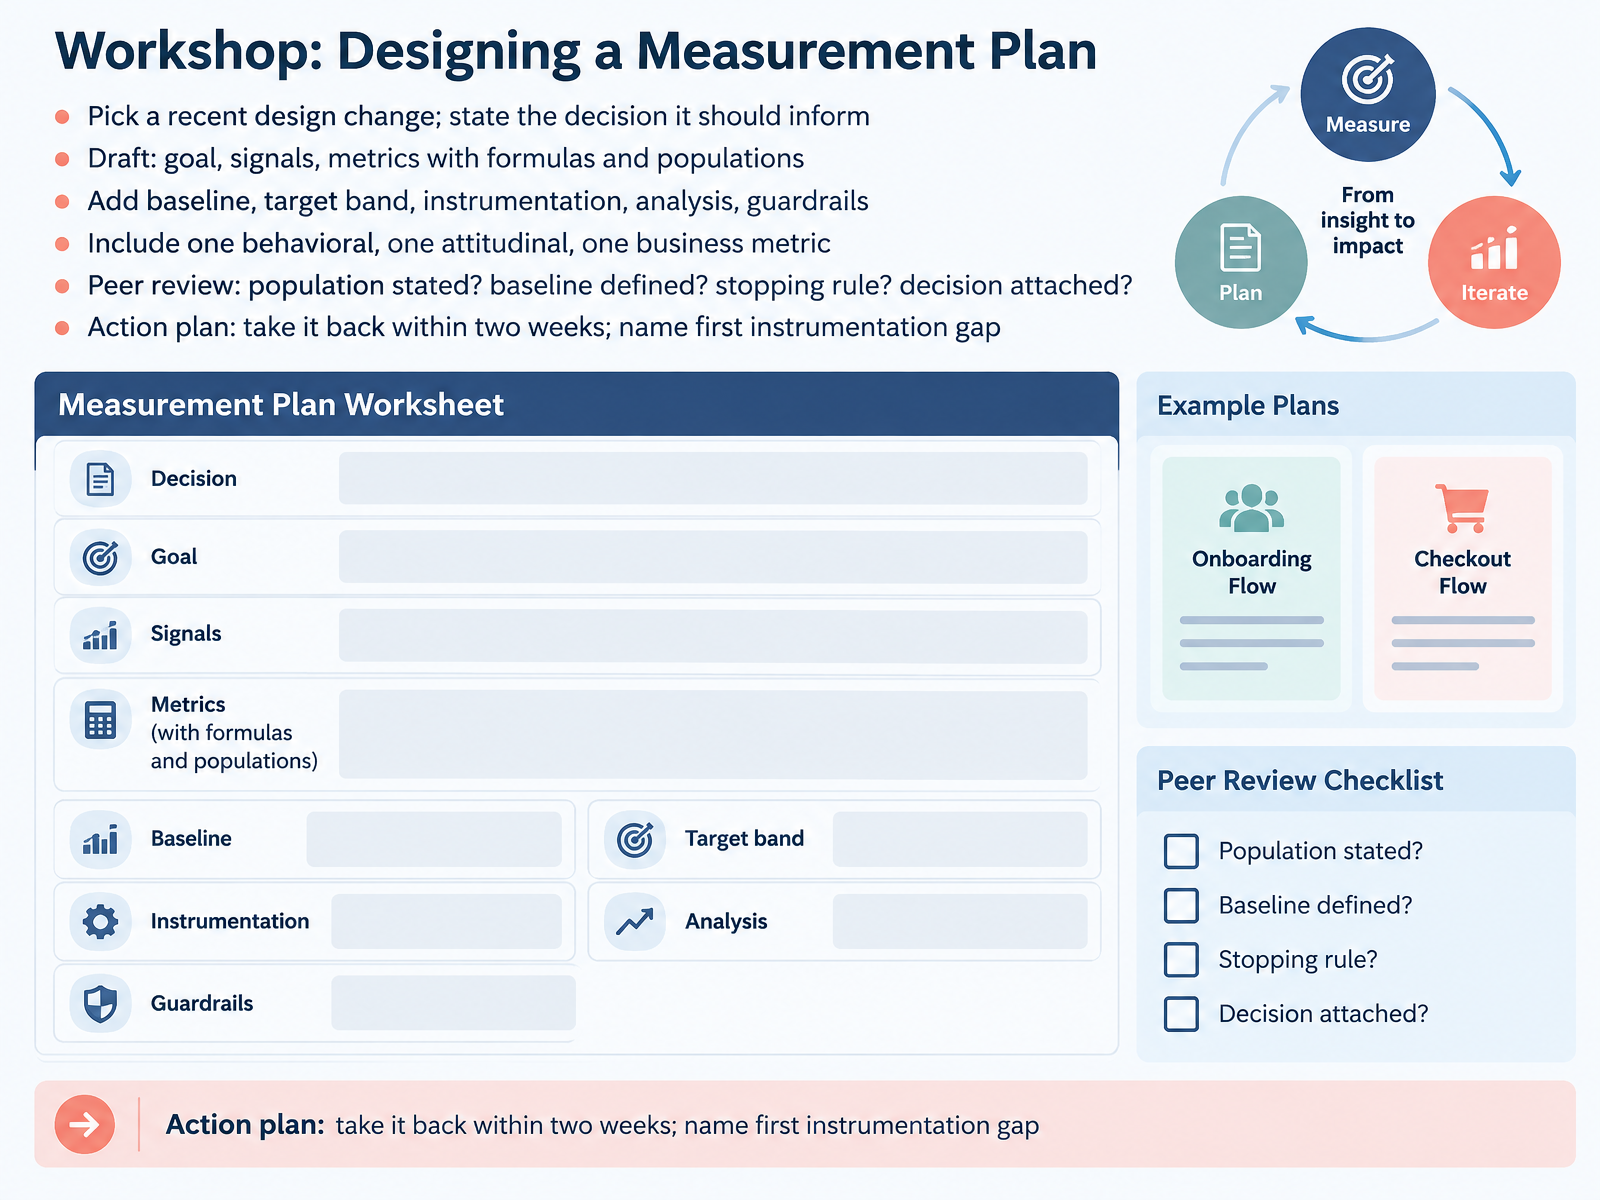
1 min - 14Workshop: Designing a Measurement PlanLet's close by putting all of this into practice. Choose a recent design change, and state the decision it should inform. That's your anchor. Then draft the goal, your signals, and your metrics, written as formulas with clearly stated populations. Add the baseline, a target band, the instrumentation, your analysis plan, and guardrails. Include one behavioral metric, one attitudinal metric, and one business metric, so behavior, sentiment, and outcomes all show up. Now peer review against four blunt questions. Is the population stated? Is the baseline defined? Is there a stopping rule? Is a decision attached? If any answer is no, your plan isn't finished yet. Finally, make an action plan. Take it back to your team within two weeks, and name the first instrumentation gap you need to close. That gap is usually where real measurement begins. Thank you for working through this with me. You now have a practical method, so pick one flow, write the plan, and start measuring. You've got this.
 library.gv.comdl.acm.orgkerryrodden.com+22 min
Take the deck with you
Download this course as a file — free, no sign-up needed.
- PDF handoutEvery slide page, ready to print or share.15 pages · 3.2 MBDownload
- Narrated PowerPointThe deck that presents itself — every slide carries the digital human's narration video.15 pages · 13.5 MBDownload
- PowerPoint slidesThe full deck as a .pptx — open it in PowerPoint, Keynote, or Google Slides.15 pages · 3.1 MBDownload
Free to use in your own training — please keep the PersonWise credit page at the end.
Have your own deck? Turn it into a course
Sources consulted
Web sources consulted while building this course.
- How to choose the right UX metrics for your product — library.gv.com
- Measuring the user experience on a large scale: user-centered metrics for web applications — dl.acm.org
- Kerry Rodden: The HEART framework for UX metrics — kerryrodden.com
- How to make HEART metrics work in practice — quantuxblog.com
- The HEART Framework: How to Measure UX With Data You Already Have (2026) — kompassify.com
- https://www.koji.so/docs/heart-framework-ux-metrics — koji.so
- skills/measure/SKILL.md — github.com
- How to get started with UX Metrics — centigrade.de
- How to Build a UX Metrics Framework: 2026 ROI Roadmap — parallelhq.com
- UX Metrics: SUS, NPS & HEART Guide | CorsoUX | CorsoUX — courseux.com
- UX Metrics: HEART, SUS & 12 Practical KPIs | Vezert — vezert.com
- "UX Metrics: Usability, Task Success, Time-to-Completion, NPS" — resources.rework.com
- 9 UX Metrics: How to Measure What Actually Matters — uxpilot.ai
- 10 Key UX KPIs in SaaS to Keep an Eye on in the Agentic Era — userpilot.com
- Measurement Blueprint 2026: JSON Schema & Data Contract — datascale.de
- Privacy Measurement Plan: What It Is, Key Features, Benefits, Use Cases, and How It Fits in Privacy & Consent – Wizbrand — wizbrand.com
- Operational Playbook for Measuring Consent Impact — cookie.solutions
- What is consented experience data and how teams should use it in 2026 — contentsquare.com
- Privacy-First Analytics for Hosted Apps — solitary.cloud
- A/B Testing Design Methods 2026: The Complete Guide to Statistical Experimentation — redclawey.com