Data Science Fundamentals and Applications
Begin
14 pages · ~28 min
Data Science Fundamentals and Applications
This course introduces data science concepts, its purpose, and real-world examples to help beginners understand how data drives decision-making.
What you’ll learn
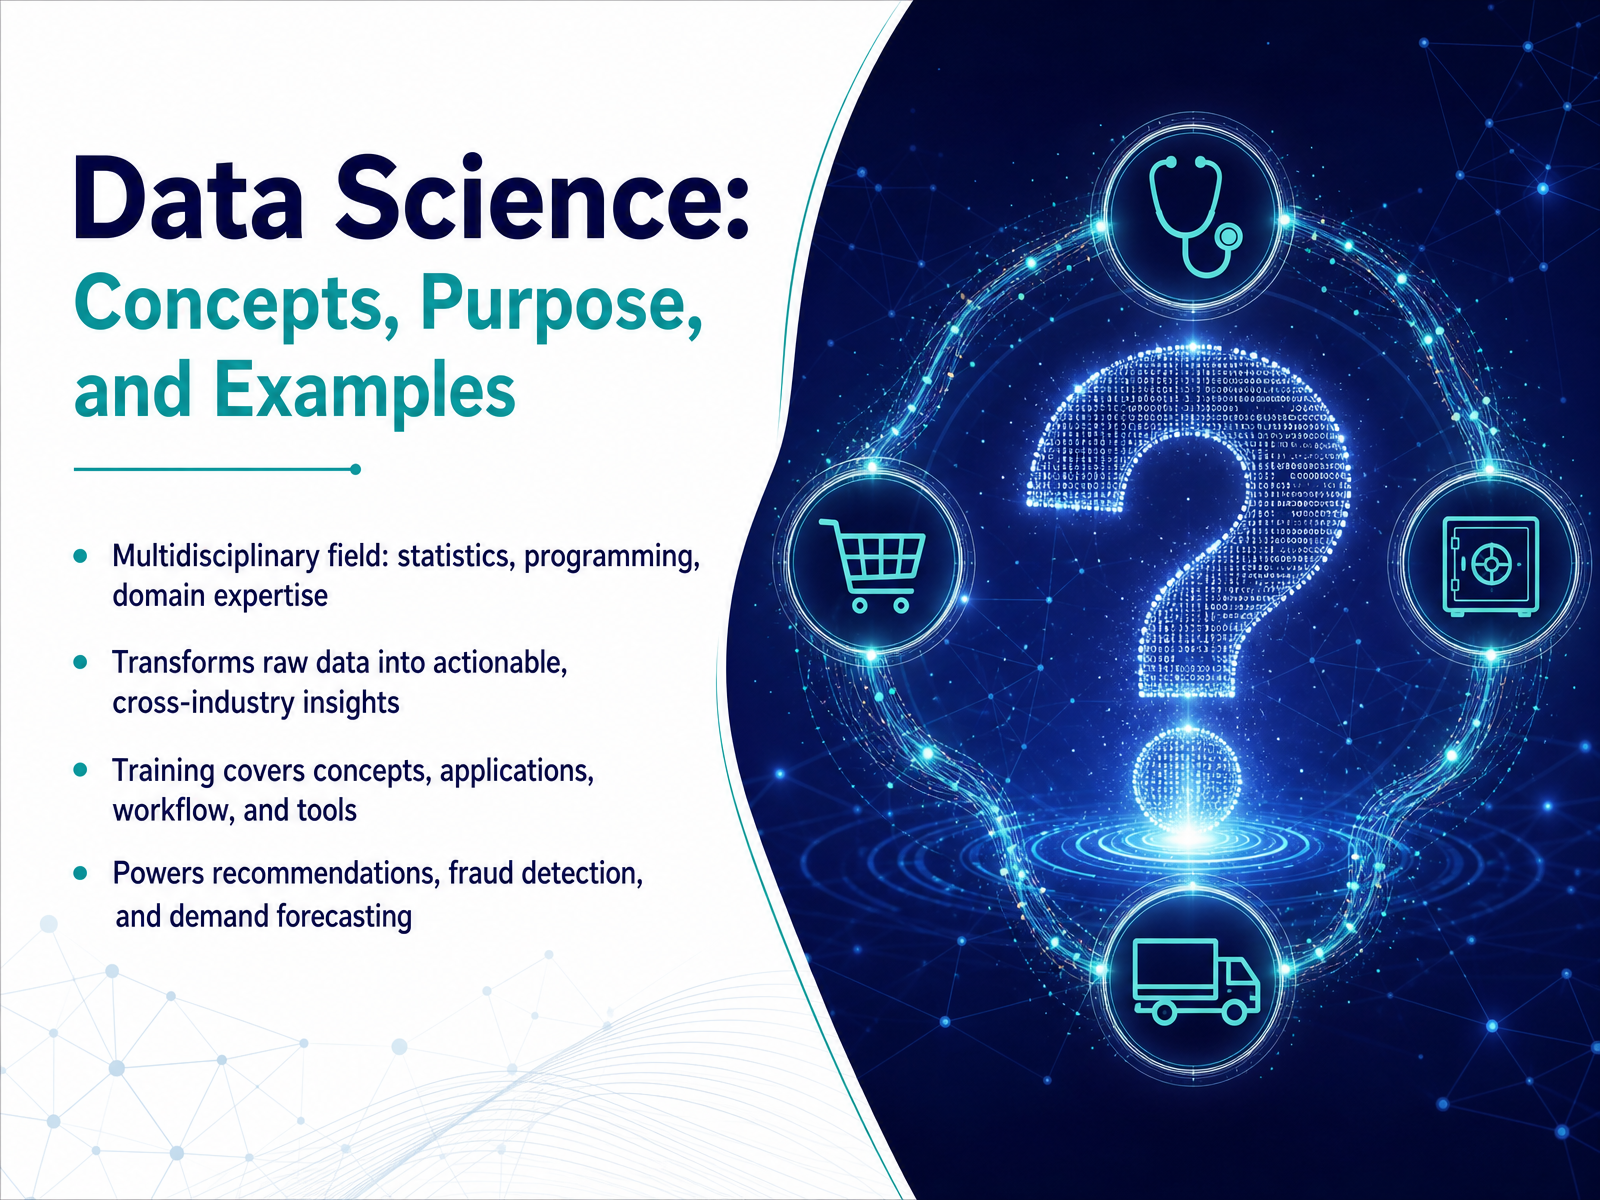
- 01Data Science: Concepts, Purpose, and ExamplesWelcome. I'm glad you're here. If you've ever wondered how streaming services seem to know exactly what you want to watch next, or how your bank spots a suspicious transaction before you do, you're in the right place. That's data science in action. This course is called Data Science: Concepts, Purpose, and Examples. And our goal is simple. We're going to demystify what data science actually is. Think of it as a team sport. It blends statistics, programming, and real-world business or academic know-how. Its whole purpose is to take messy, raw data and turn it into clear insights you can actually use. Across this training, we'll walk through the core concepts, see how it's applied in the real world, explore the typical workflow, and touch on the key tools. We'll look at how it powers the recommendation engines that suggest your next purchase, catches fraud in milliseconds, and helps retailers forecast demand so the shelves are stocked just right. There's no need to be a programmer or a statistician. If you're curious and ready to connect the dots, you'll walk away with a clear, practical understanding. Next, we'll build that foundation by answering the question: What is Data Science?2 min
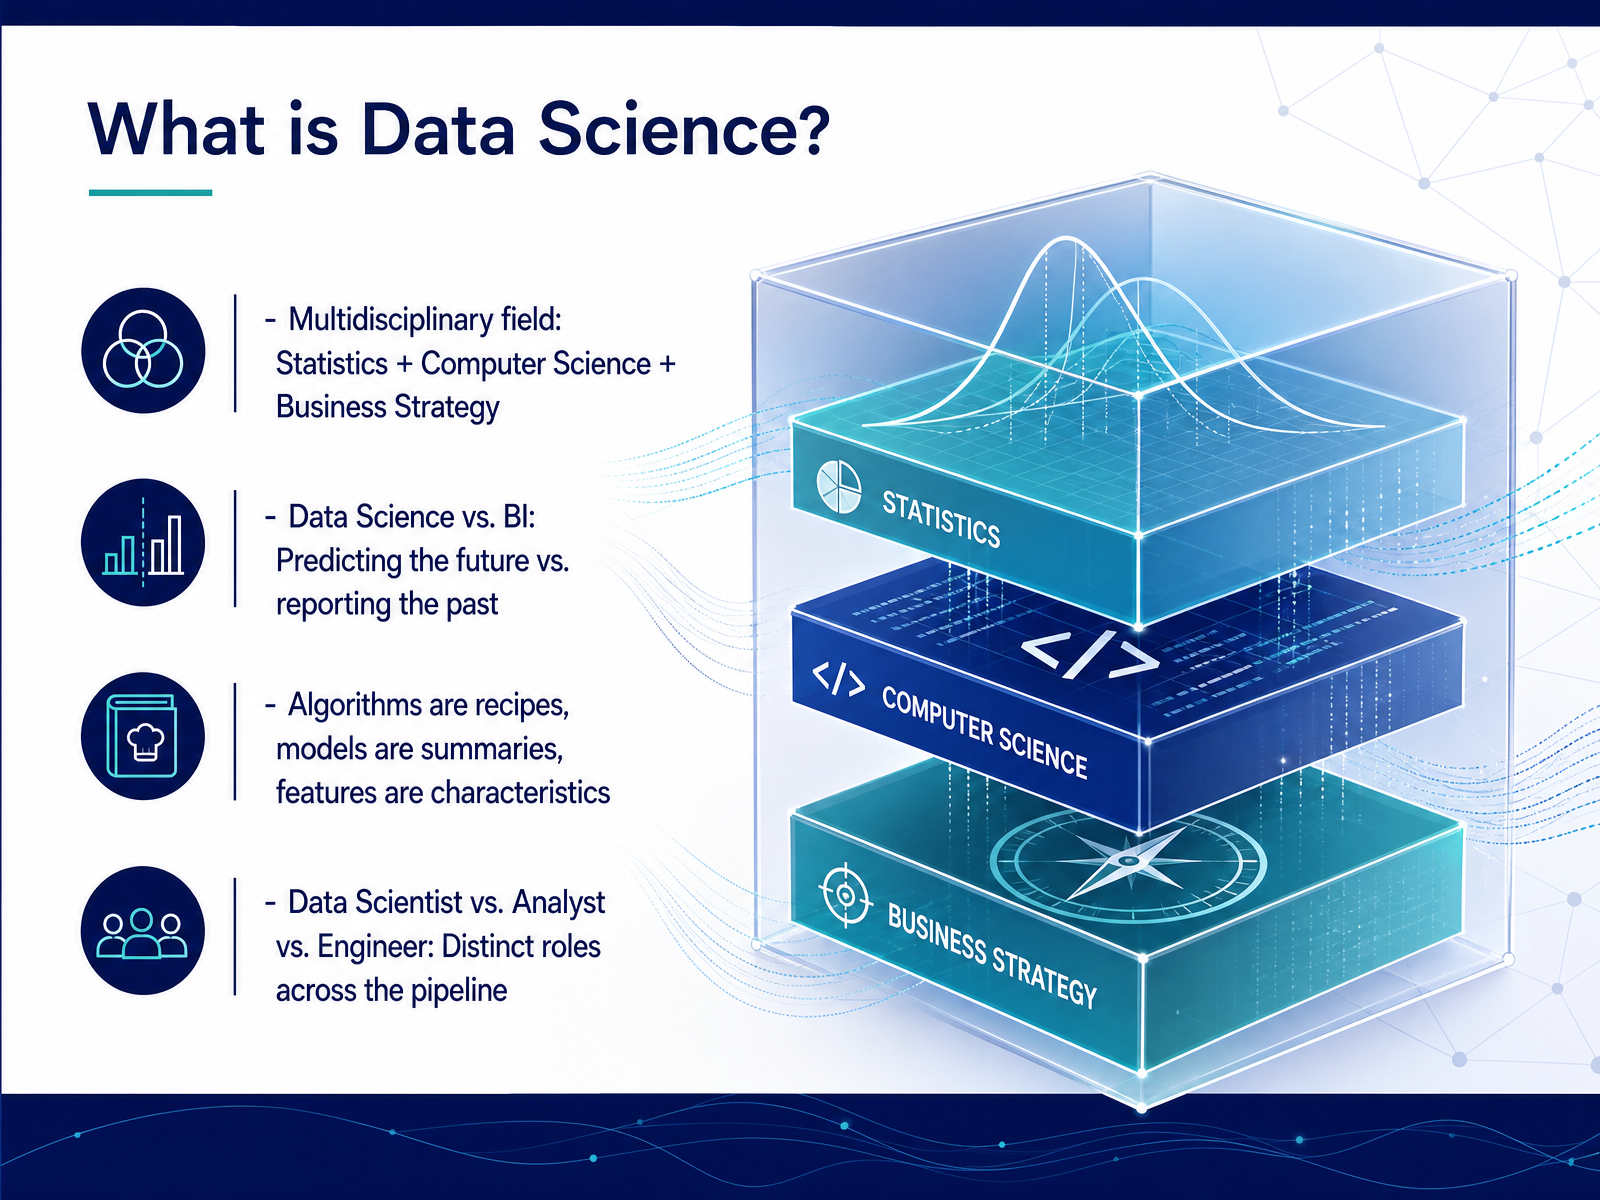
- 02What is Data Science?Alright, let's build a clear picture of what data science actually is. You'll often hear it described as a blend of three core areas: statistics, computer science, and business strategy. Think of it this way. Statistics provides the rigorous mathematical foundation, computer science gives us the power to process massive amounts of information, and business strategy ensures we're asking the right questions that lead to valuable actions. Now, a common point of confusion is the difference between data science and traditional business intelligence, or BI. The simplest way to separate them is this: BI creates reports on what happened in the past, like last quarter's sales figures. Data science takes that past data and builds models to predict what will happen next. It's the difference between looking in the rearview mirror and using a GPS to forecast the road ahead. We also need to clarify some everyday terms. You can think of an algorithm as a cooking recipe, a step-by-step procedure. The model is the final summary created once that recipe has been run on your data, and features are simply the individual ingredients or characteristics we choose to focus on, like a customer's age or purchase history. Finally, these stages are handled by different people. A data engineer builds and maintains the sturdy pipelines that collect and store the data. A data analyst explores that data to find trends and create those reports. The data scientist then designs the experiments and builds the predictive models that drive future strategy. Let's connect these dots by exploring why this capability matters so urgently right now.
 2 min
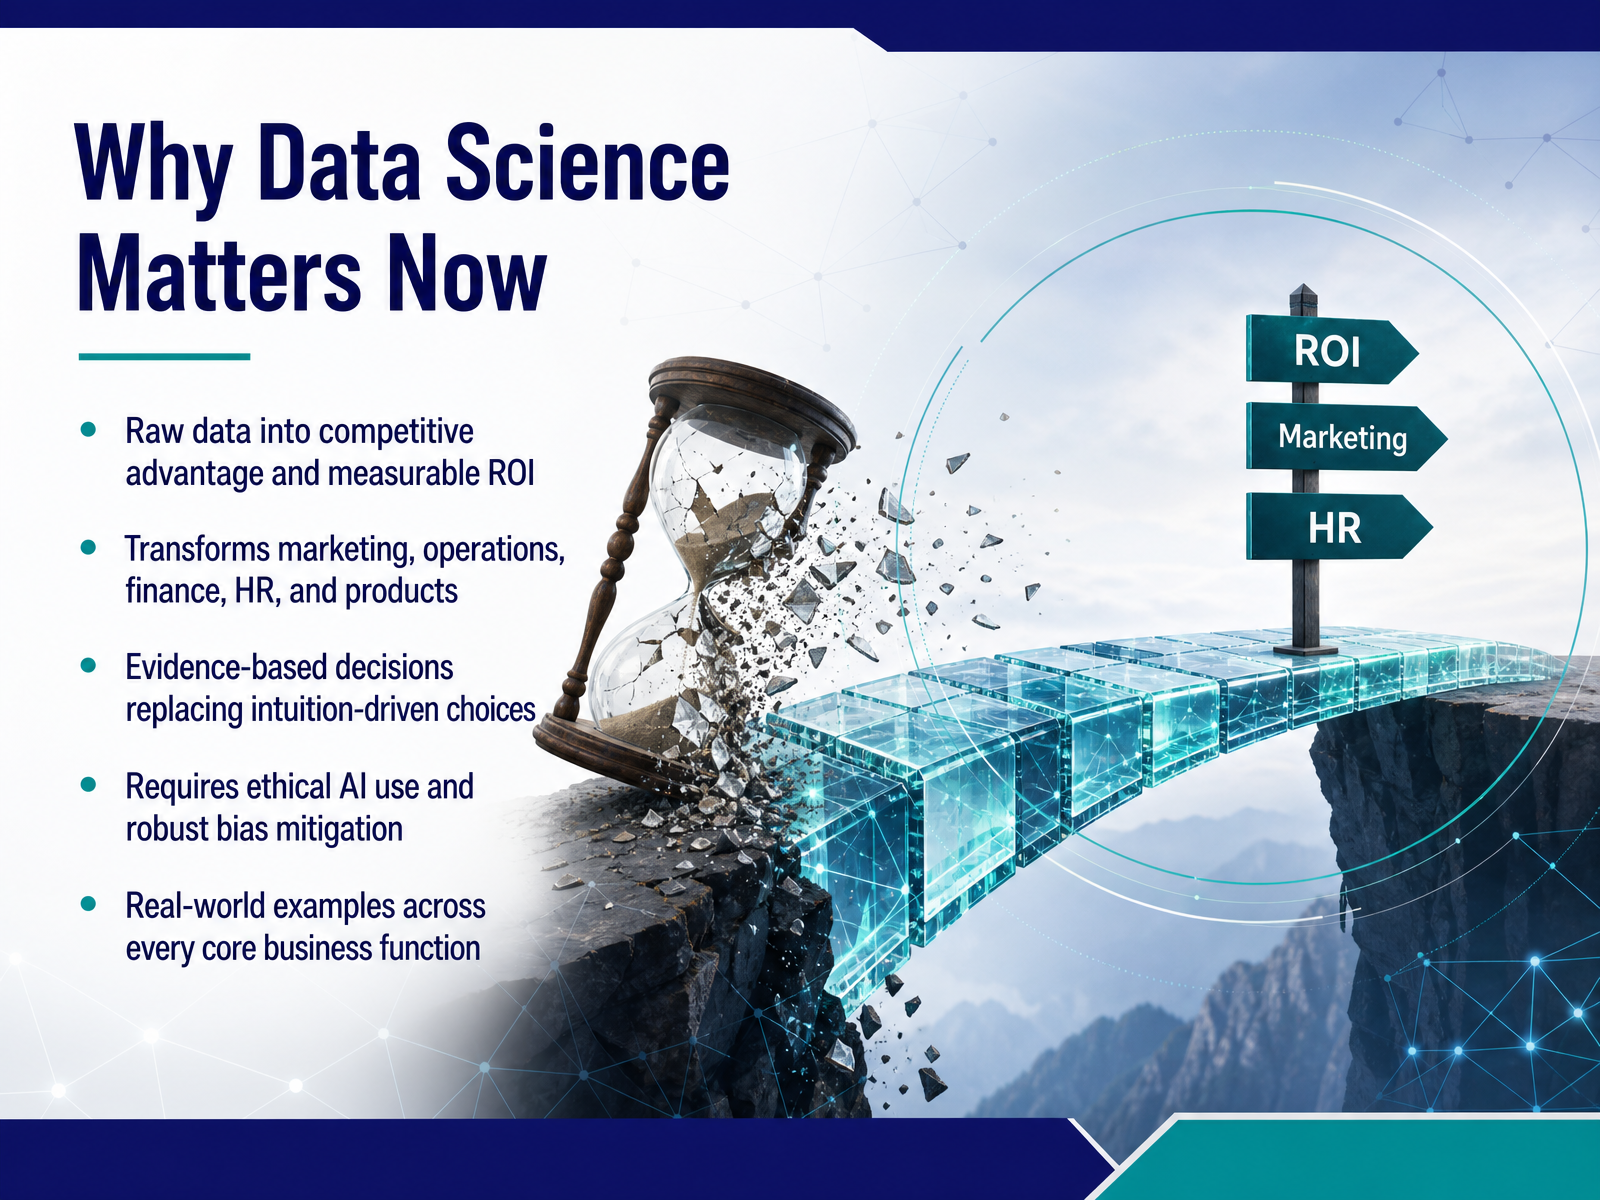
2 min - 03Why Data Science Matters NowNow, you might be wondering, why has data science become such a priority right now. The short answer is that it turns raw, often messy data into a real competitive advantage and measurable ROI. Imagine making every major decision based on clear evidence rather than just gut feel. That shift is transforming every core business function. Marketing teams predict who will respond to a campaign before spending a dollar. Operations managers forecast inventory needs to avoid costly stockouts. And HR leaders can identify what truly drives employee retention instead of guessing. Of course, this power comes with a critical responsibility. You have to use AI ethically and build in strong bias mitigation from the start. A hiring algorithm trained on historical data, for example, could simply automate past biases if you're not careful. The goal is to strengthen our judgment with data, not replace it blindly. Let's make this concrete by looking at real-world examples in healthcare and retail.
 2 min
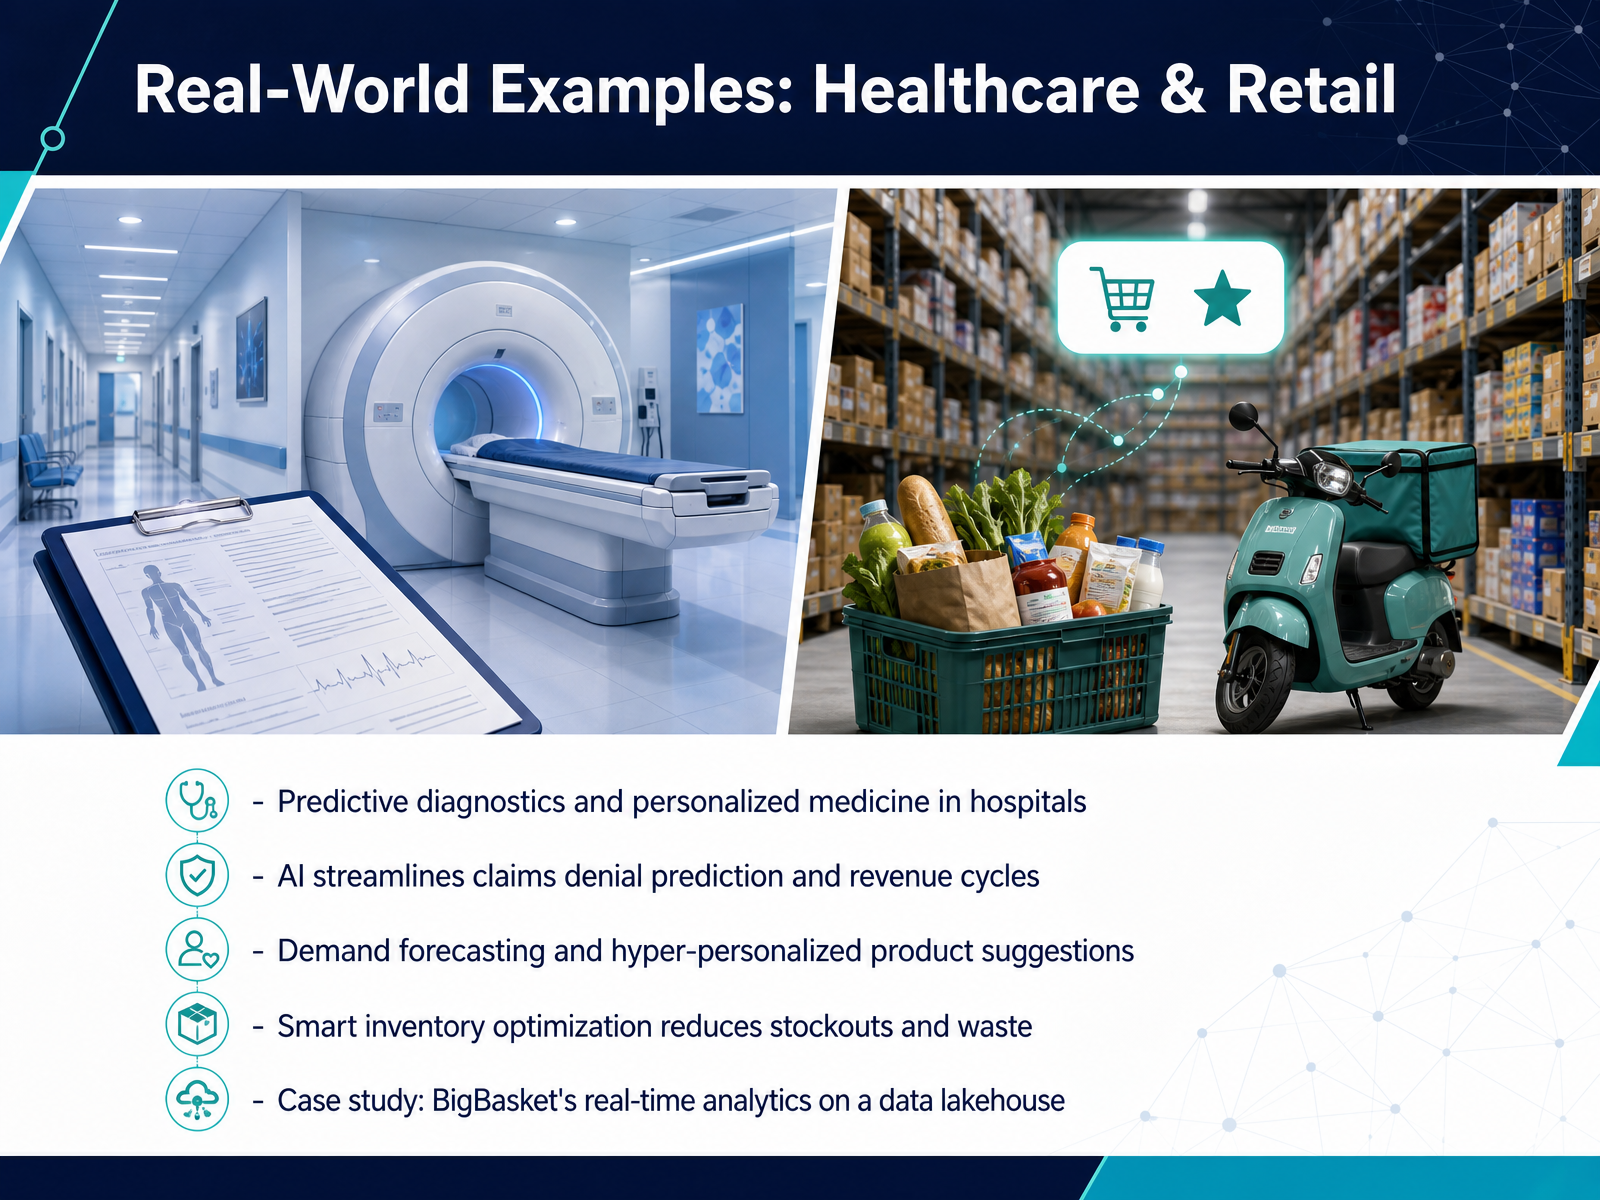
2 min - 04Real-World Examples: Healthcare & RetailLet’s zoom into two industries where these concepts come to life: healthcare and retail. You’ve probably experienced both, which makes them perfect for seeing data science in action. Imagine a hospital using predictive diagnostics. Instead of waiting for symptoms to worsen, algorithms analyze patient history and scans to catch diseases early or even suggest a personalized treatment plan. It’s not about replacing doctors but giving them a powerful second opinion. Behind the scenes, insurance claims and billing are being transformed too. A medical claim isn’t just about a payment; it’s a decision point. Data science models now predict which claims might be denied, helping hospitals fix issues before submission and keep their revenue cycles healthy. Now, think about your last online shopping trip. When a retailer forecasts demand accurately, it means the product you want is actually in stock. This smart inventory optimization uses patterns in your behavior and external factors like weather to dramatically cut waste and costly stockouts. Those hyper-personalized recommendations you see aren’t random. They use what’s called collaborative filtering. If two customers have similar buying patterns, the system suggests items one bought to the other. To make this concrete, look at India’s BigBasket. They combined their real-time inventory and customer data on a modern data lakehouse. This lets their team ask fresh business questions and update recommendations in minutes, not days. Next, let’s shift gears to finance and logistics, where extremely fast decisions make all the difference.
 2 min
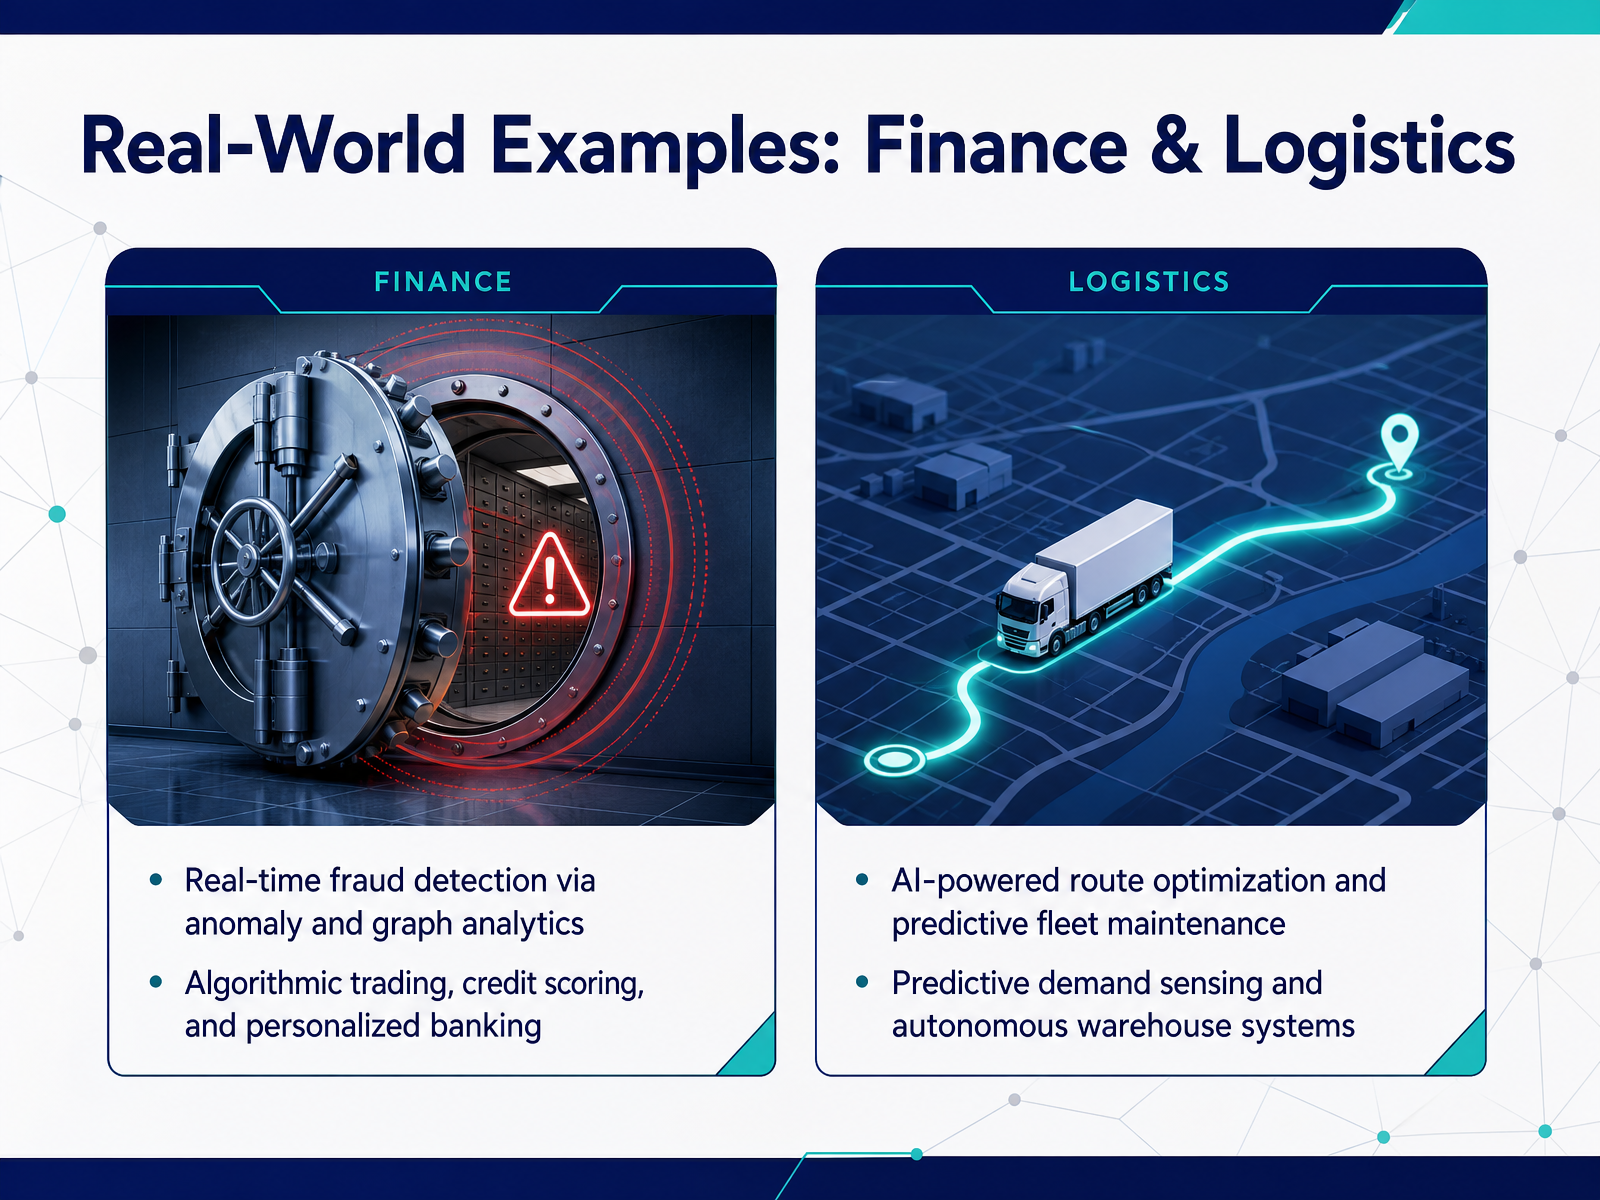
2 min - 05Real-World Examples: Finance & LogisticsNow let's move into the real world and see how these concepts power two industries you interact with every day: finance and logistics. Think about the last time you got a fraud alert from your bank. That's data science in action, using anomaly detection to instantly flag a transaction that doesn't fit your normal pattern. It analyzes the location, the amount, and even your spending habits to protect your money in real time. The same core logic drives algorithmic trading that reacts to markets faster than any human could, and credit scoring models that look far beyond just a simple credit score to personalize loan offers just for you. Switching gears to logistics, imagine a delivery truck that can predict it needs a new brake pad before it fails on the highway. That's predictive maintenance, blending sensor data with analytics to stop a breakdown before it happens. It's the same principle behind AI-powered route optimization that reroutes drivers around a traffic jam they haven't even reached yet, and demand sensing that positions inventory in a warehouse based on what it predicts you'll order tomorrow. These aren't futuristic concepts; they are the algorithms quietly orchestrating the movement of money and goods all around us. Next, we'll pull back the curtain and step through the actual data science workflow, from a raw business question to a clear, actionable answer.
 2 min
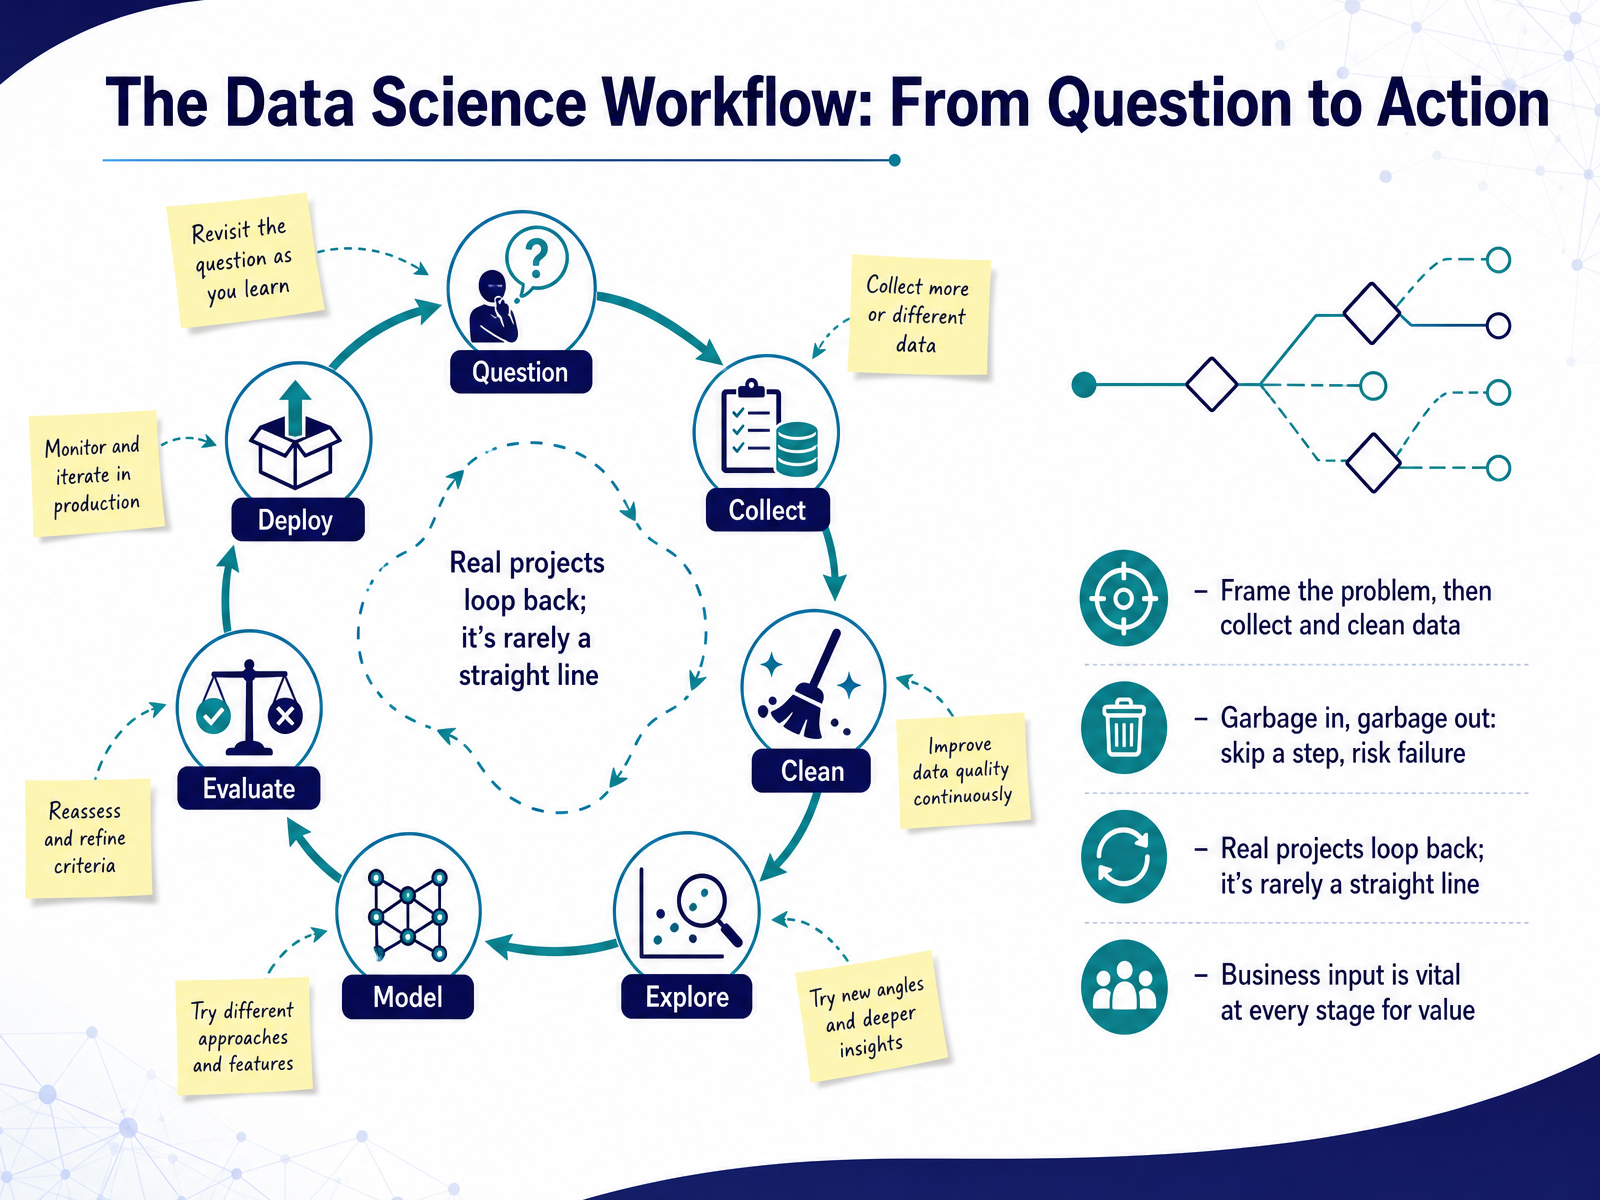
2 min - 06The Data Science Workflow: From Question to ActionNow, how do we actually do data science? It follows a workflow—a series of steps that move us from a messy business question to a concrete action. Think of it like a cooking recipe. First, you frame the problem. What are we really trying to solve? Then, you collect the ingredients—your data—and clean it. This cleaning step is critical. You might have missing values or duplicate entries, and if you skip this, you risk the 'garbage in, garbage out' problem, where bad data leads to bad decisions. Now, here is a key insight. The diagram of this workflow often looks like a neat, straight line, but in reality, it rarely is. You'll build a model, find a new question, and loop right back to collect more data. It's an iterative process. And at every single stage, from defining the problem to taking action, your business input is vital. Your domain knowledge ensures the project delivers actual value, not just interesting numbers. Up next, we'll explore the raw material of this entire process. Let's demystify data itself—its quality, types, and how we govern it.
 2 min
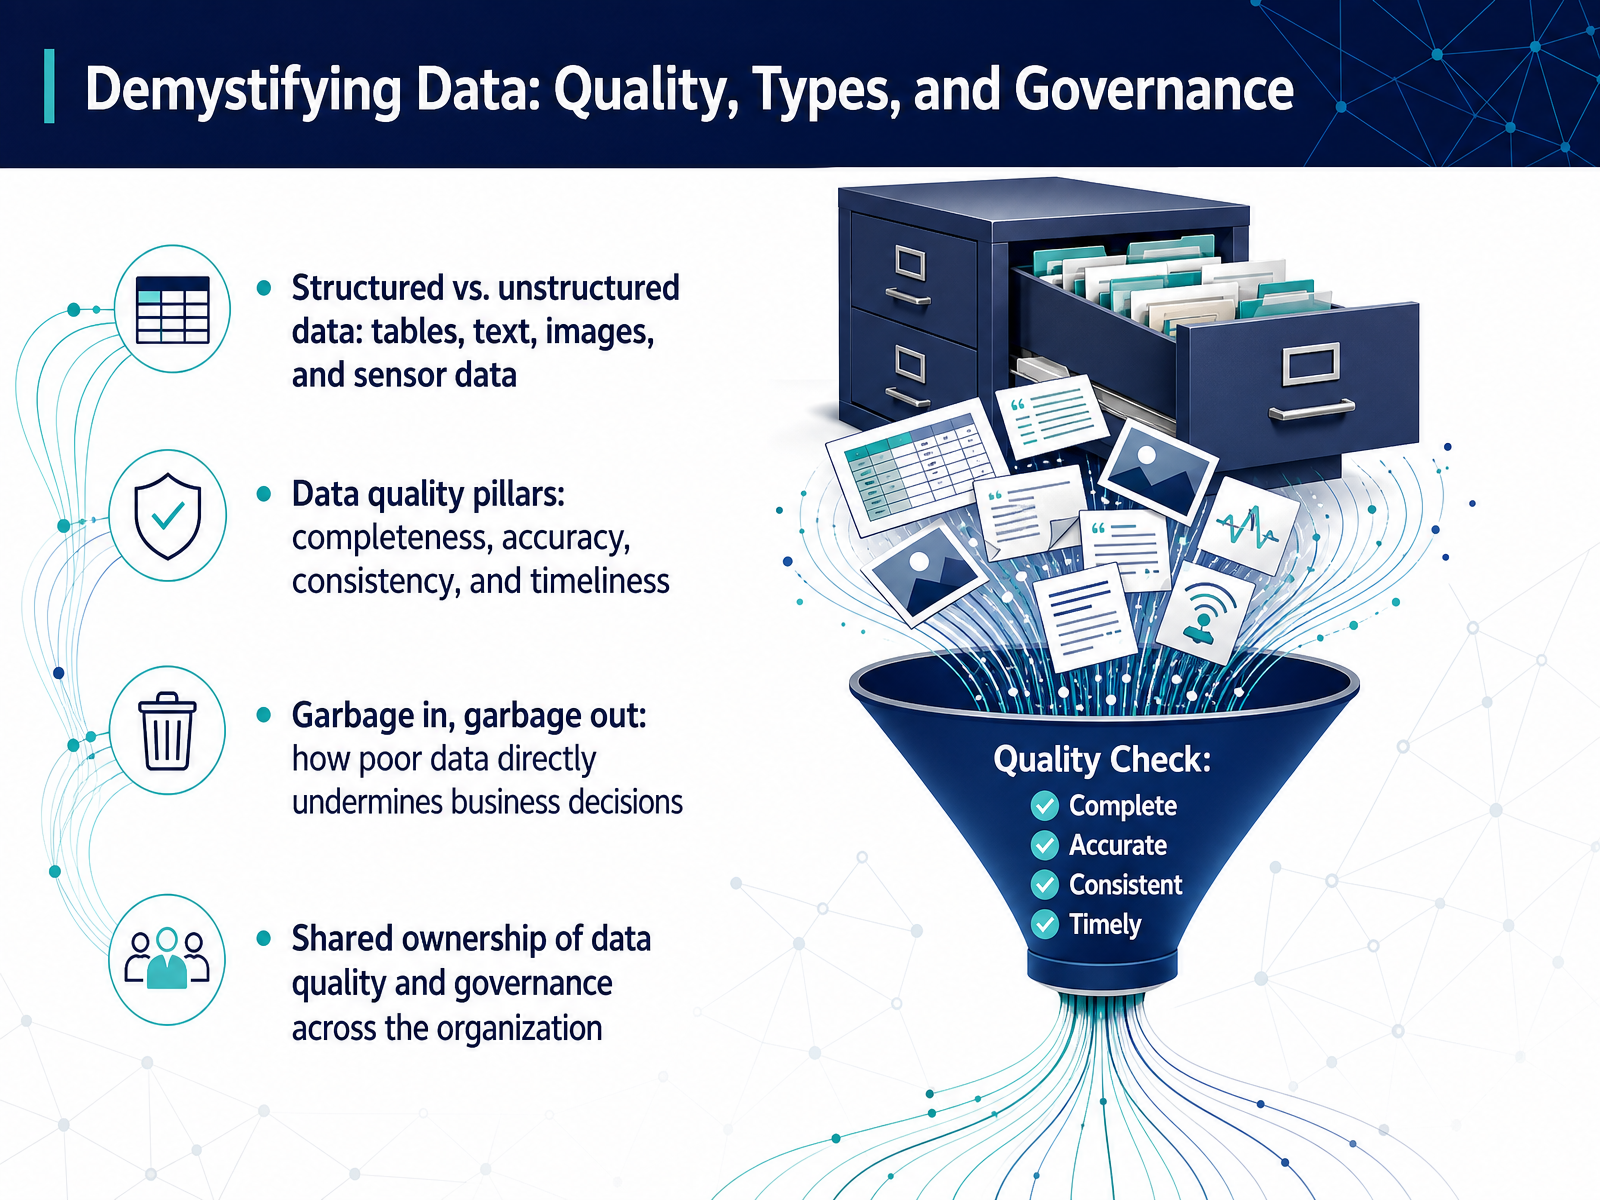
2 min - 07Demystifying Data: Quality, Types, and GovernanceNow let's demystify the data itself. Imagine your business as a kitchen. You can have the best chef in the world, but if the fridge is stocked with spoiled ingredients, the meal won’t just be bad; it could be harmful. That’s the first thing to understand about data quality. We call it 'garbage in, garbage out.' Flawed data directly leads to flawed business decisions, sometimes costing millions. So what does good data look like? We look for four key pillars: completeness, meaning no missing values; accuracy, meaning it reflects the real world; consistency, so 'New York' isn't spelled three different ways across your systems; and timeliness, ensuring you’re not making today’s decisions on last year’s report. Now, where does this data live? It’s not all in neat spreadsheets. You have structured data, like rows and columns in a table. But most of the world’s data is unstructured, like customer emails, social media images, or sensor readings from a factory floor. Because data is so varied and touches every department, its quality can’t just be an I.T. problem. It’s a shared responsibility. When you enter a sales record or a support agent logs a ticket, you’re not just filling out a form; you’re a data steward, actively shaping the foundation for every future forecast. Next, we’ll start turning this trusted data into real predictions by exploring common techniques, including supervised and unsupervised learning.
 2 min
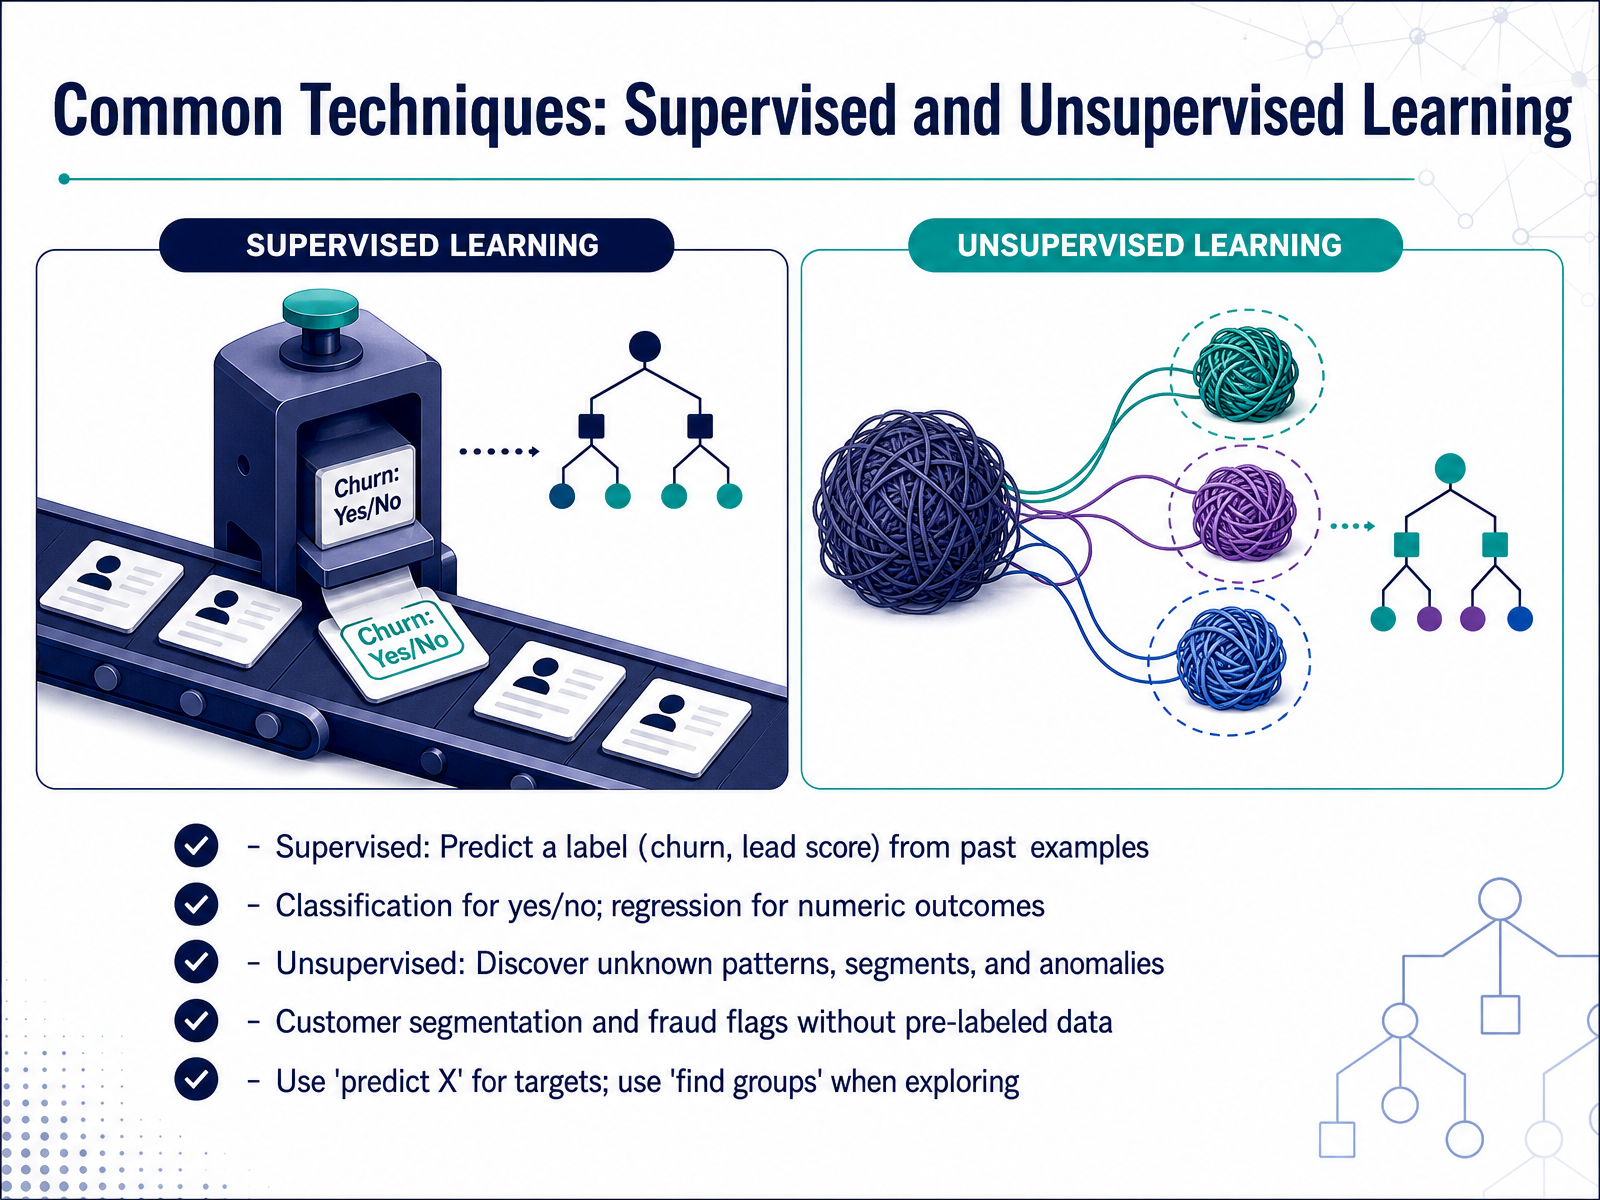
2 min - 08Common Techniques: Supervised and Unsupervised LearningSo far, the most common techniques fall into two big buckets: supervised and unsupervised learning. Think of supervised learning like studying with a set of flashcards that already have the answers on the back. You feed the model past examples where you know the outcome, like whether a past customer churned or what a lead’s conversion score was, and it learns to predict the label for new, unseen cases. If you need a simple yes or no answer, that is classification. If you want a continuous number, like a sales forecast, that is regression. Unsupervised learning, on the other hand, is like exploring a new city without a map. You do not have pre-labeled data or a target to predict. Instead, the algorithm looks for natural groupings, hidden segments, or strange anomalies on its own. A classic example is clustering your customers into distinct buying personas you never knew existed, or flagging a transaction that just looks too weird to be real. The key mindset is simple. If you have a specific target in mind, ask the machine to predict X using supervised learning. But if you are just curious to explore and find patterns, ask it to find groups using unsupervised learning. Next, we will look at a couple of powerful advanced areas: reinforcement learning, natural language processing, and the generative AI wave.
 2 min
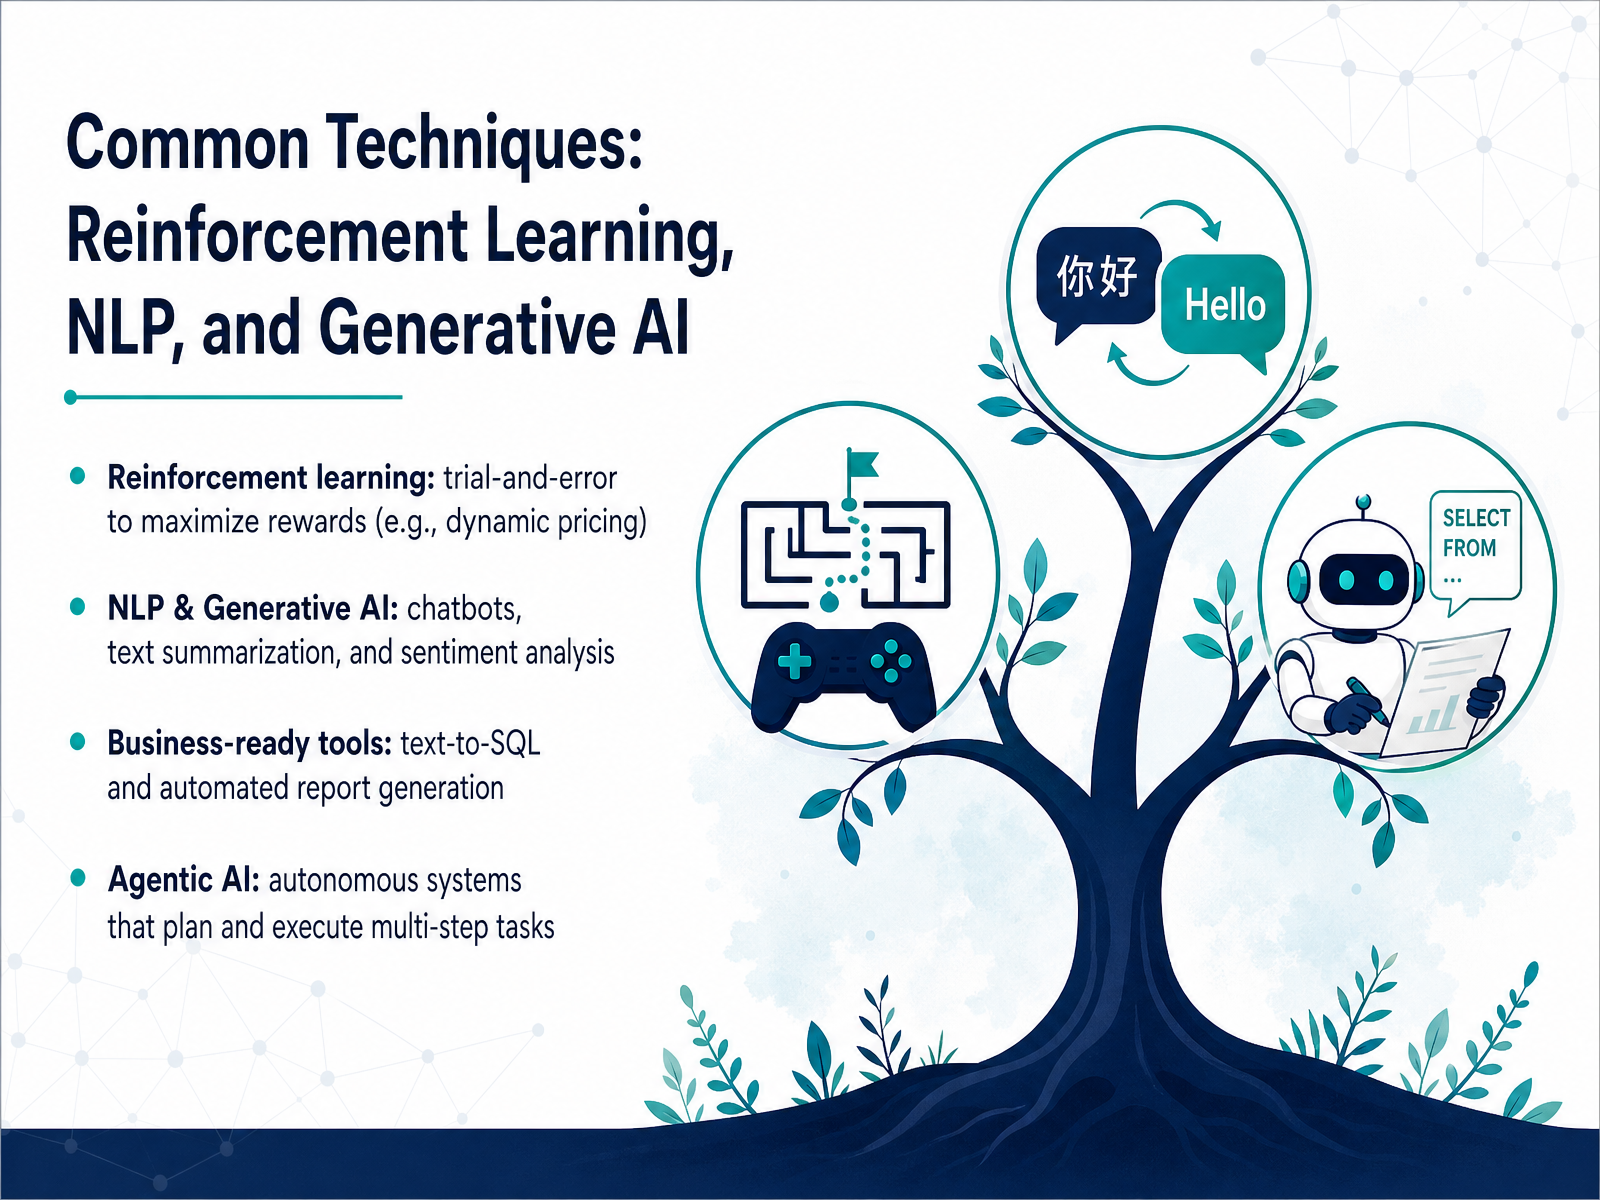
2 min - 09Common Techniques: Reinforcement Learning, NLP, and Generative AINow let's connect the dots between three techniques that power most of the AI you interact with daily. Reinforcement learning is like training a new sales rep--you let them experiment, and when they make a great call, you reward that behavior. In AI terms, an algorithm tries millions of pricing moves in a simulated market to learn the strategy that maximizes profit--this is how dynamic pricing engines work. NLP, or natural language processing, and generative AI are the communicators. They enable chatbots that feel conversational, tools that summarize your long email threads into a paragraph, and sentiment analysis that scans customer reviews to instantly separate frustration from praise. On the business-ready side, text-to-SQL lets you ask a plain-English question like 'show me last quarter's best sellers' and the system writes the database query for you, while automated report generation turns raw numbers into a narrated summary your team can act on. We're also seeing agentic AI emerge--these are systems that don't just answer a question, they plan and execute multi-step tasks, like reviewing an application, checking a policy, and drafting a follow-up all on their own. Next, let's see these techniques in action with real-world use cases in retail pricing and insurance fraud detection.
 2 min
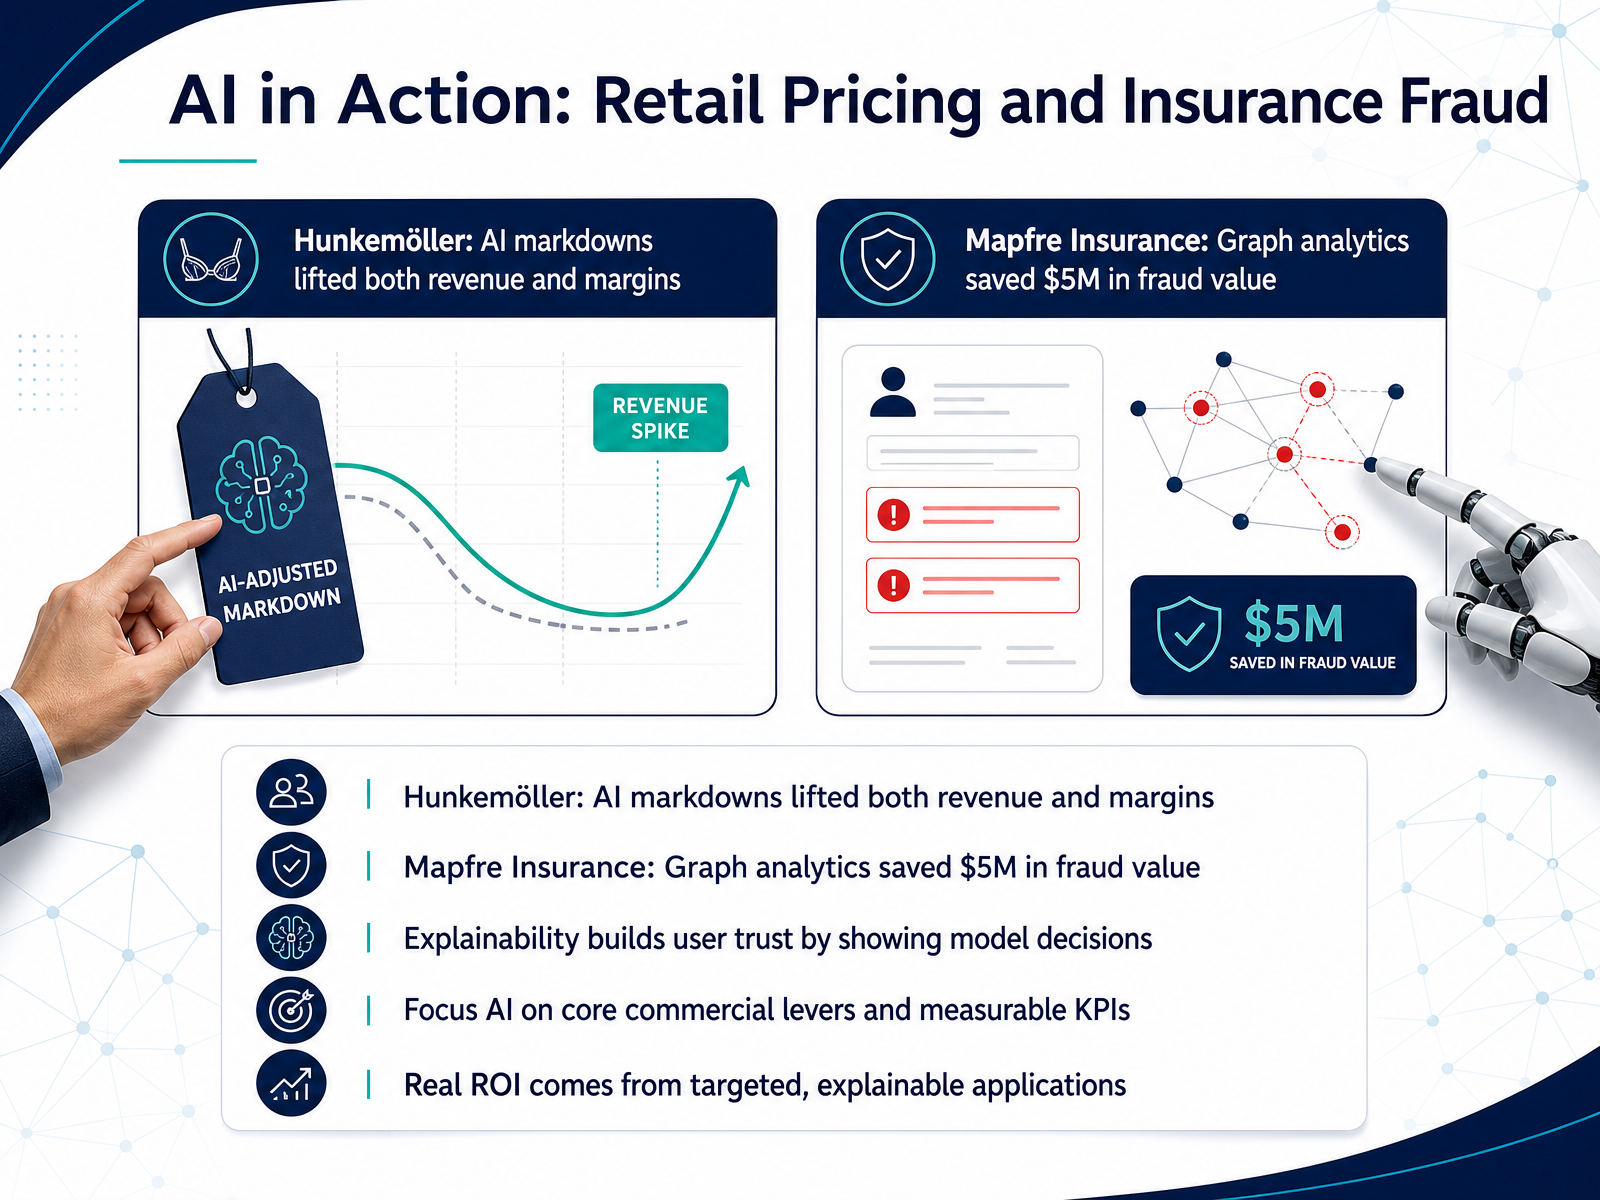
2 min - 10AI in Action: Retail Pricing and Insurance FraudNow let’s turn those concepts into real results. Take Hunkemöller, a lingerie retailer. They used AI to decide when and how much to mark down products, and it lifted both their revenue and their profit margins at the same time. That’s the kind of double win most pricing teams only dream of. In a completely different industry, Mapfre Insurance applied graph analytics to spot hidden fraud rings, and they saved five million dollars in fraud value. Two very different use cases, but one common thread: both focused AI on a clear commercial lever with a measurable KPI. And just as importantly, both built explainability into their models. When store managers see why a markdown is recommended, or investigators see the link between suspicious claims, they trust the system enough to act on it. Real return on investment doesn’t come from a black box, it comes from targeted, explainable applications that people actually use. Next, let’s pull this together and talk about building a data-driven culture.
 2 min
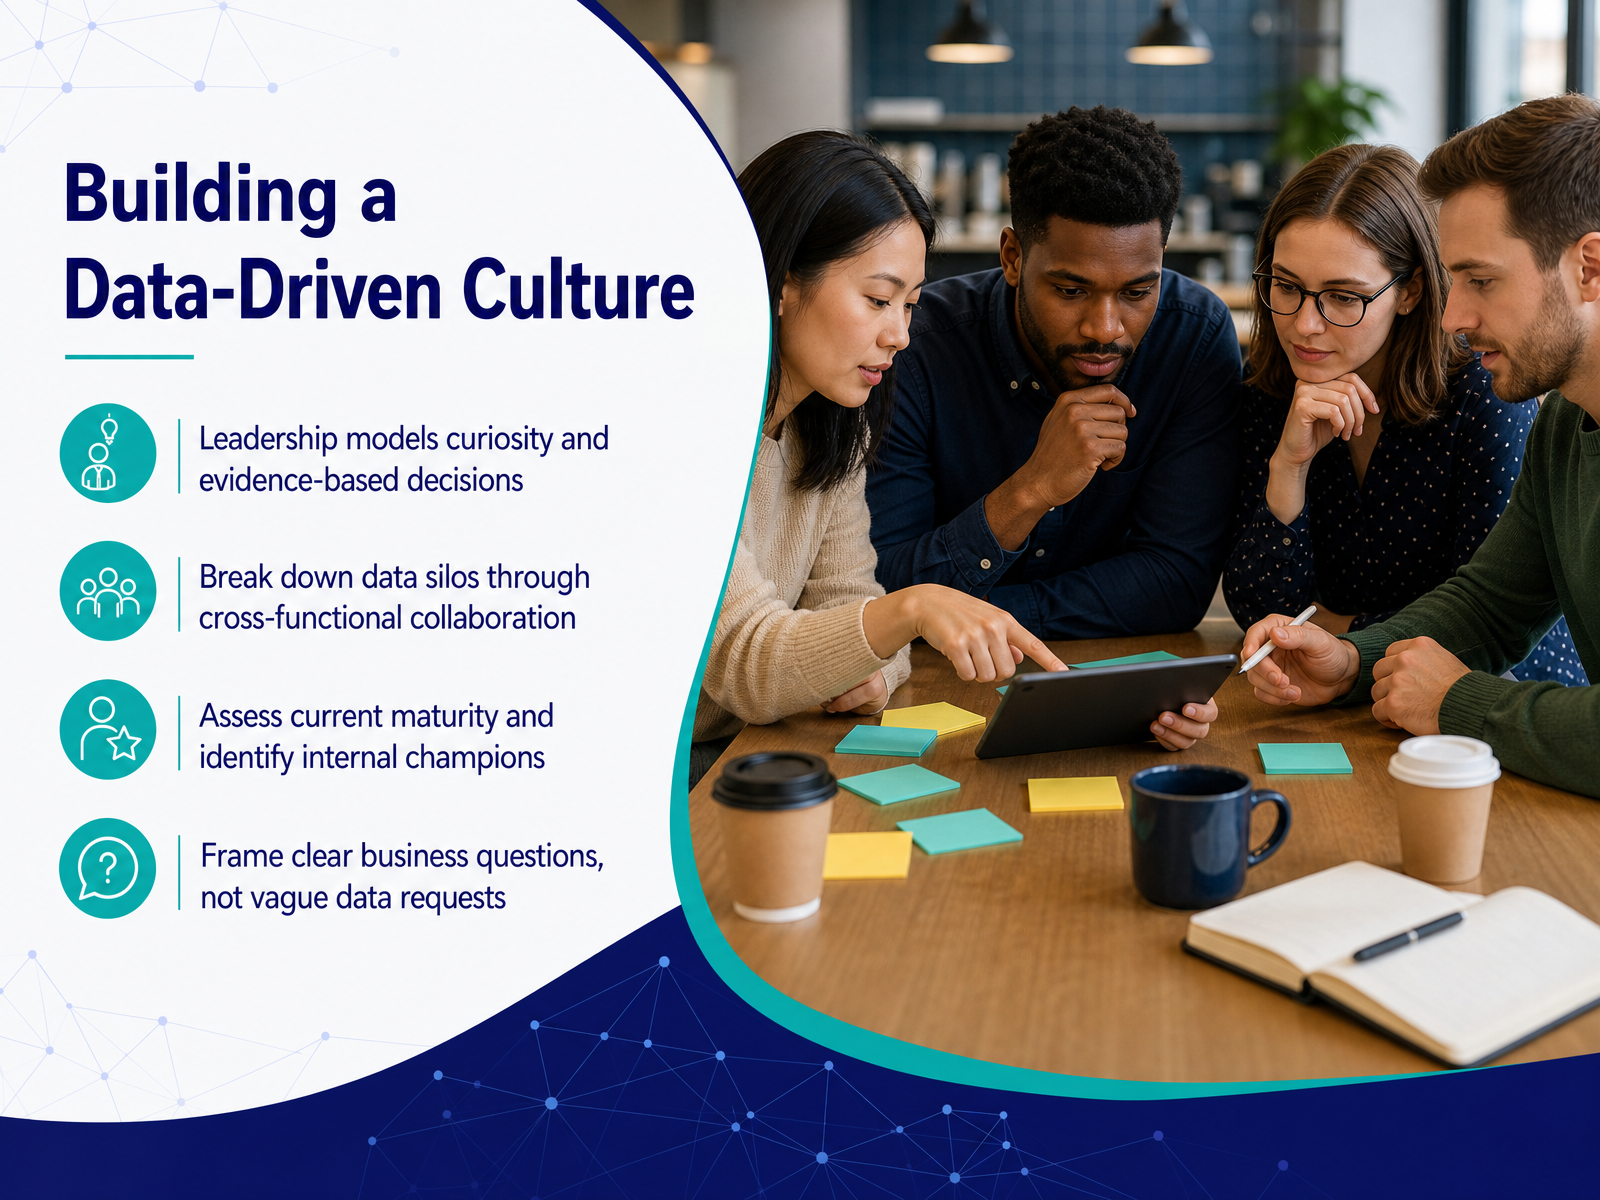
2 min - 11Building a Data-Driven CultureNow, let's talk about what it really takes to build a data-driven culture inside an organization. It starts at the top. Leaders need to model curiosity visibly, asking out loud, 'What does the data say?' and making decisions based on evidence, not just gut feel. Next, we have to break down data silos. Think of your company like a city; if the fire department and the police department don't share information, the whole city is less safe. Encourage cross-functional teams to collaborate openly with shared data. You'll also want to assess where you are right now on your data maturity, and find your internal champions—those enthusiastic people in every department who already love showing insights with a spreadsheet. They become your ambassadors. Most importantly, always frame your work around clear business questions. Instead of a vague request like 'Get me all the sales data,' ask something specific like, 'Which customer segment had the highest churn last quarter, after that price change?' That clarity turns data into a tool, not a chore. Next, we'll get practical and look at getting started with the actual tools, focusing on no-code and low-code options that are perfect for beginners.
 2 min
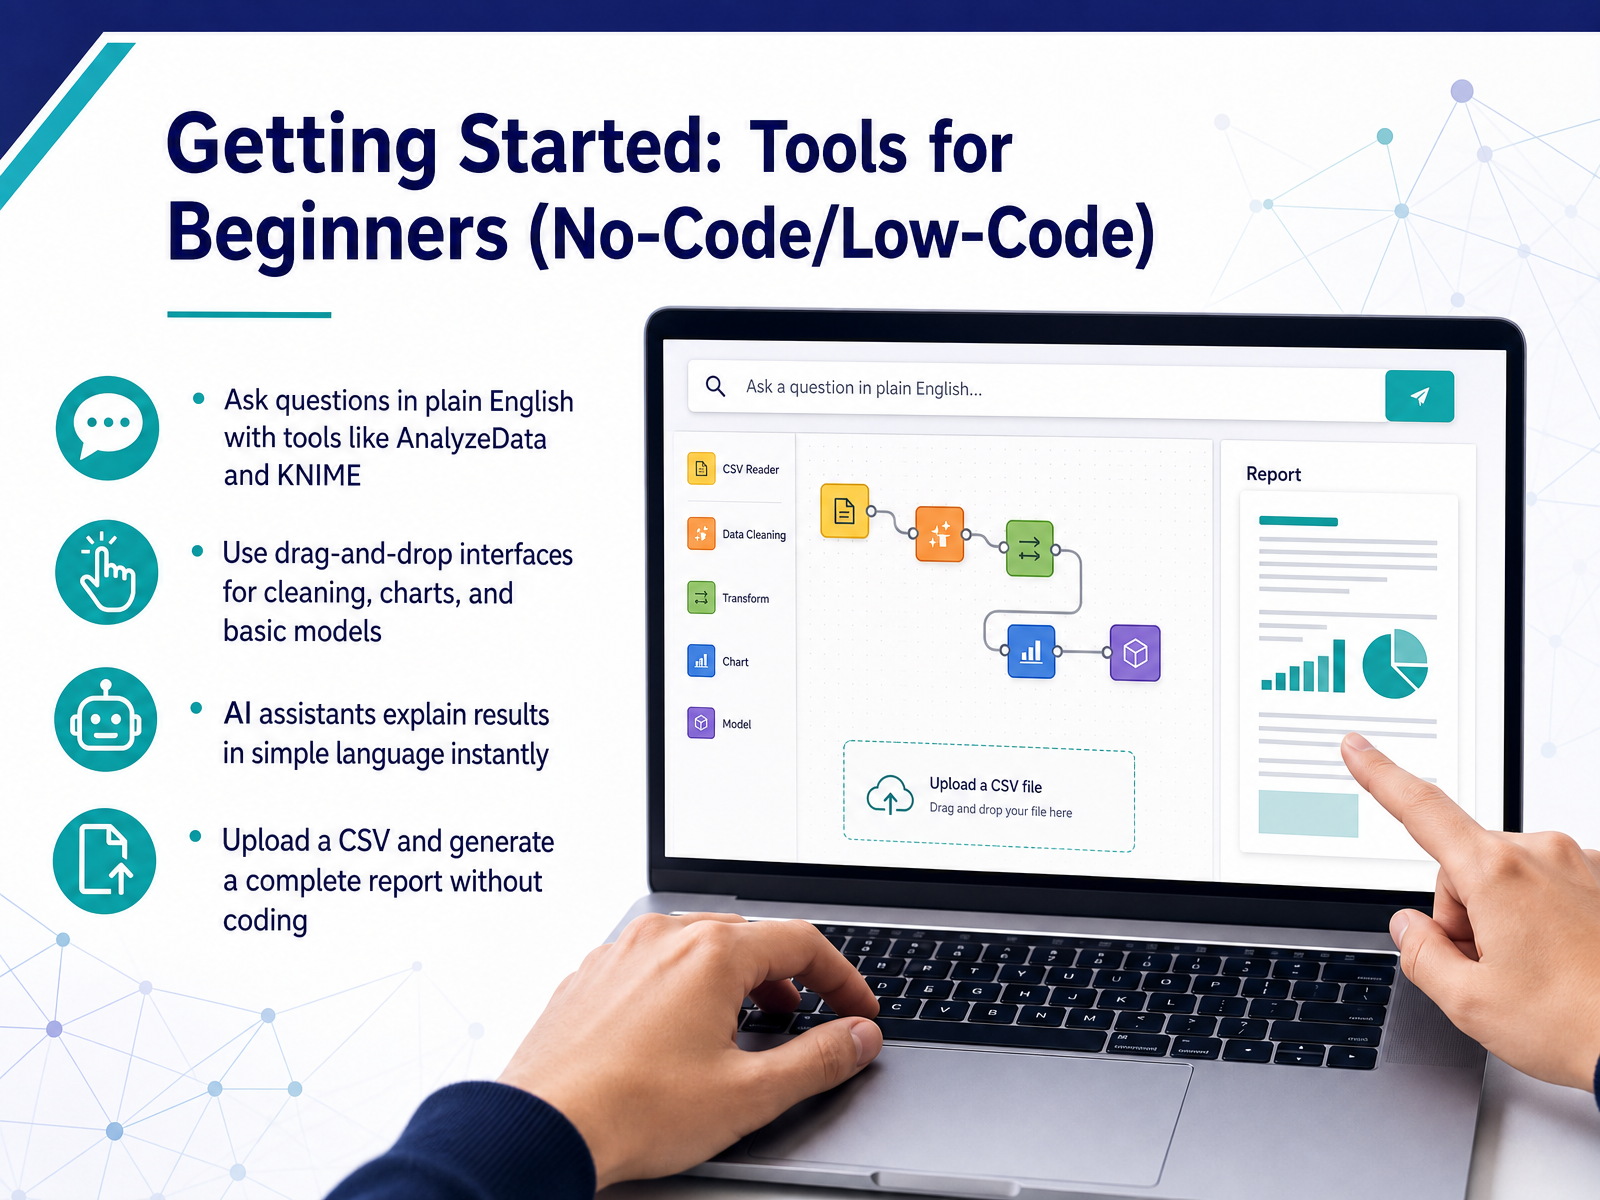
2 min - 12Getting Started: Tools for Beginners (No-Code/Low-Code)Now, let's talk about the tools that make all of this accessible, even if you've never written a line of code. You might be thinking, 'This sounds powerful, but I'm not a programmer.' And that's exactly the point. These tools are designed for you. Imagine sitting down with your data and simply asking a question in plain English, like 'Which product category had the highest returns last month?' Tools like AnalyzeData and KNIME let you do just that. They use a visual, drag-and-drop interface. You literally pull in a step to clean your data, connect it to a step that builds a chart, and then to a step that runs a basic predictive model. It feels less like coding and more like building a flowchart on a whiteboard. And the best part? When you get a result, a built-in AI assistant doesn't show you a wall of numbers. It explains the finding to you in simple, natural language instantly. You can upload a raw spreadsheet, a CSV file, and these tools can generate a complete, polished report for you, turning weeks of manual work into minutes. Next, let's move from the tools themselves to the practical skills and resources you'll need to start your first small success.
 1 min
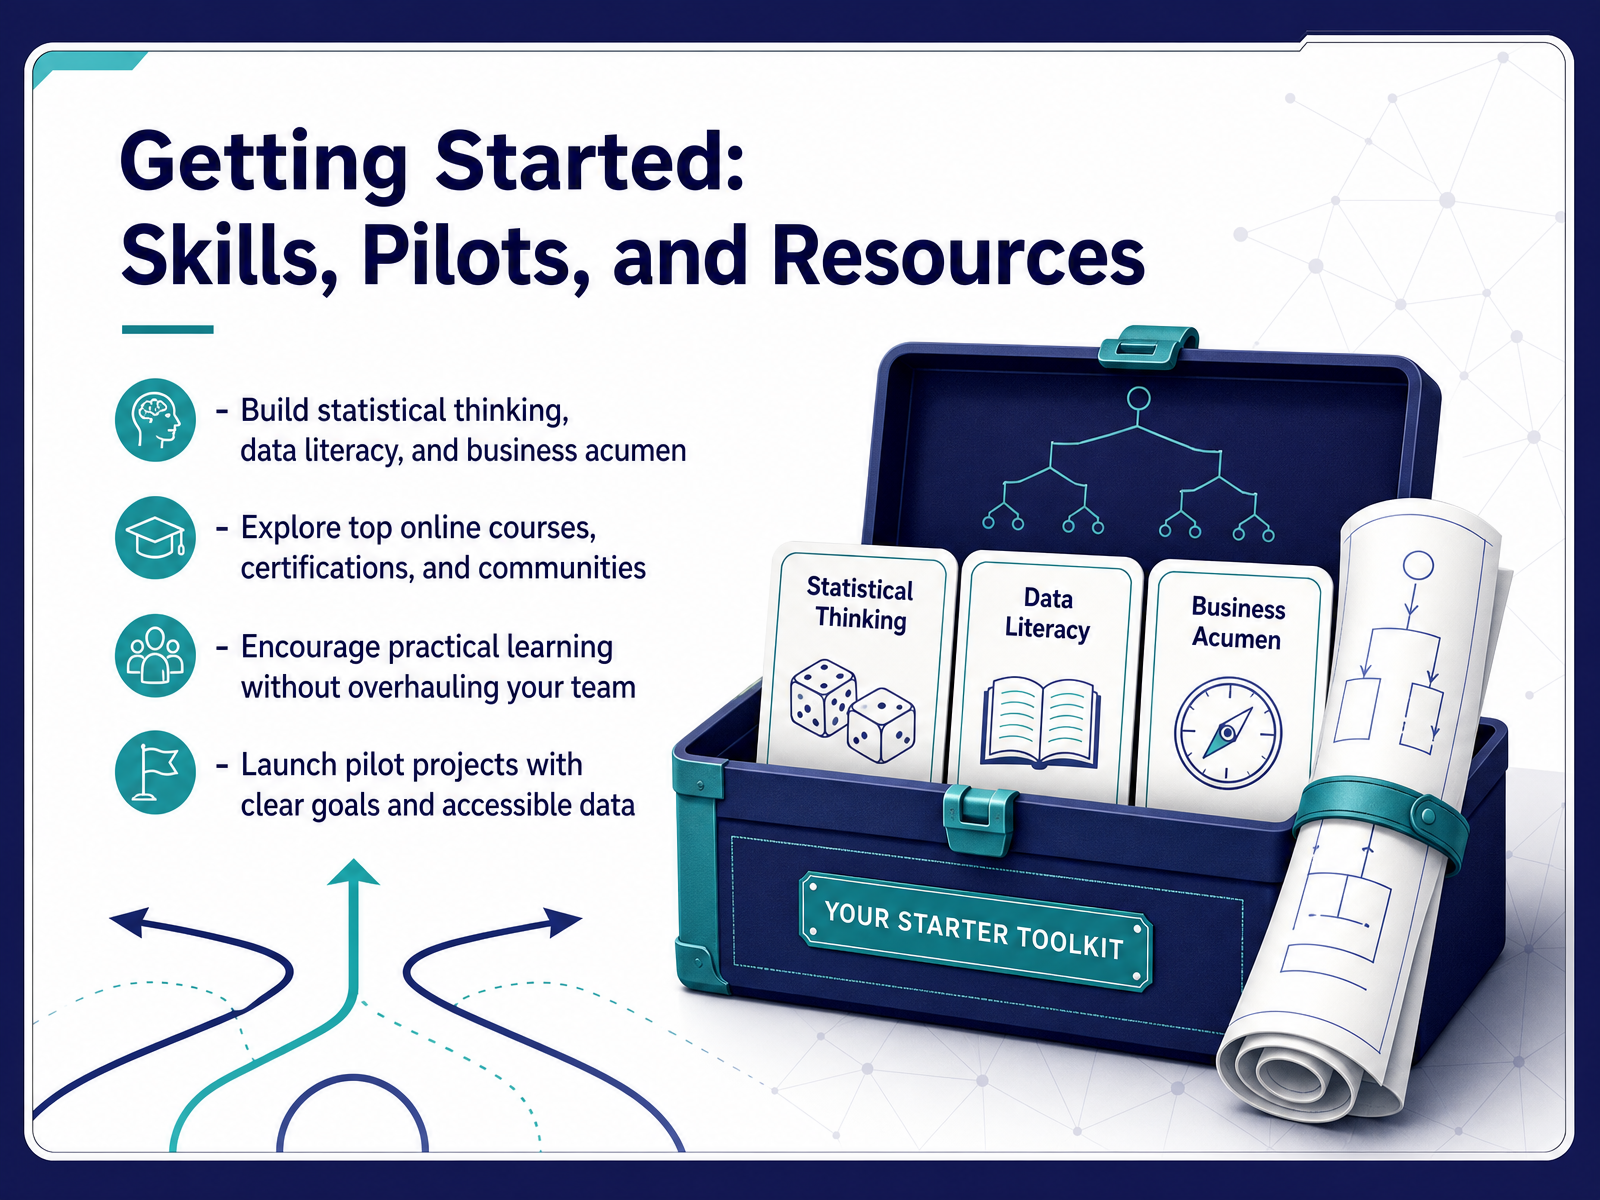
1 min - 13Getting Started: Skills, Pilots, and ResourcesSo, how do you actually begin your data science journey without feeling overwhelmed? The key is to build three foundational muscles at once. First, sharpen your statistical thinking so you can question averages and spot trends. Second, boost your data literacy—that simply means getting comfortable talking about data sources and what they really measure. And third, connect it all back to business acumen, always asking, ‘What decision will this improve?’ You don’t need to become a coder overnight. Explore one of the many excellent online courses and communities, and pick up skills in digestible pieces. The most effective step is to launch a small pilot project right now. Choose a narrow, real business question, find a clean dataset you already have access to, and set one clear, measurable goal. This proves value far faster than a massive team overhaul ever could.
 2 min
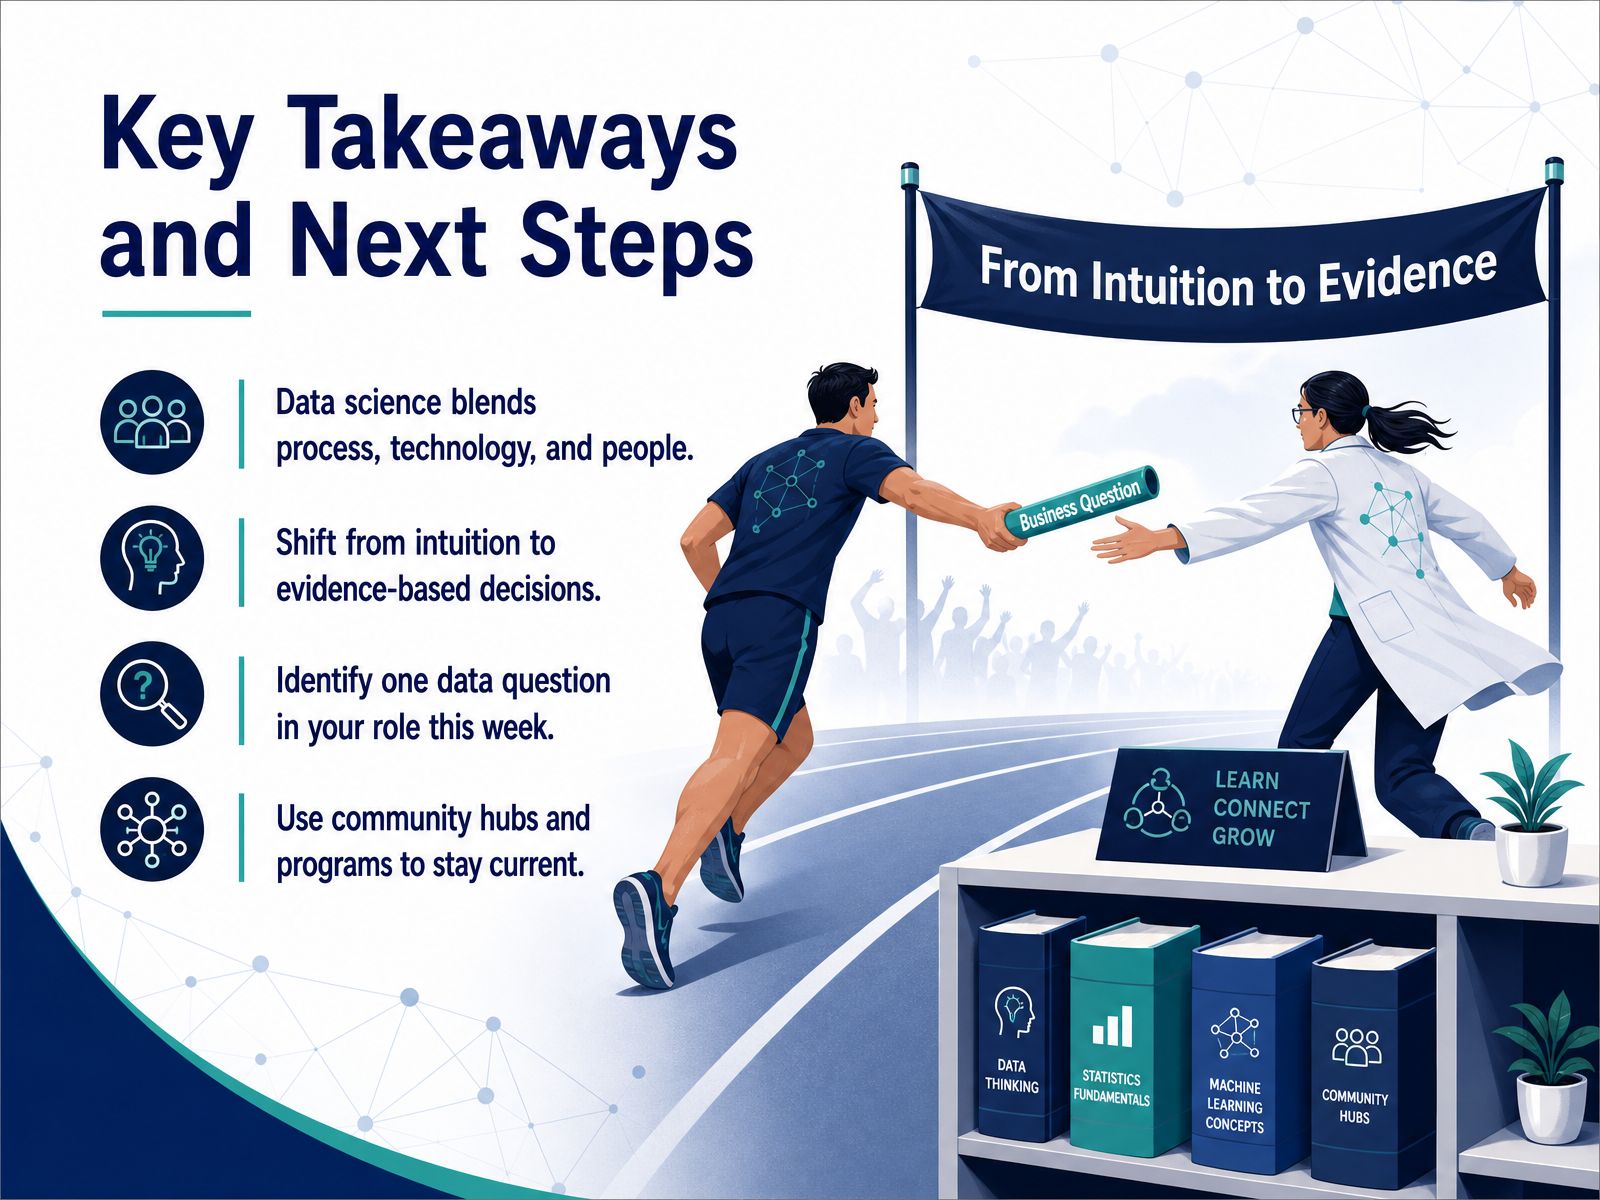
2 min - 14Key Takeaways and Next StepsLet's bring this together. Data science isn't some distant, complex machine. It's really a blend of process, technology, and people working to answer questions. At its heart, it's a shift from relying on gut feelings alone to making evidence-based decisions. And this isn't just a theory. I want you to take one small, practical step this week. Look at your daily work and identify just one question you could start exploring with data. Maybe it's why a report takes so long, or what your customers click on most. Just one question. To keep this momentum, remember you're not alone. Tap into community hubs, forums, or internal programs to stay current and learn from others. Thank you for joining me on this quick tour of data science. Your journey really starts now, with that one question. Go find it.
 1 min
1 min
Take the deck with you
Download this course as a file — free, no sign-up needed.
- PDF handoutEvery slide page, ready to print or share.15 pages · 4.1 MBDownload
- Narrated PowerPointThe deck that presents itself — every slide carries the digital human's narration video.15 pages · 15.6 MBDownload
- PowerPoint slidesThe full deck as a .pptx — open it in PowerPoint, Keynote, or Google Slides.15 pages · 4.0 MBDownload
Free to use in your own training — please keep the PersonWise credit page at the end.
Have your own deck? Turn it into a course