Begin
14 pages · ~28 min
Customer Education Quality Evaluation
This training teaches customer education professionals how to assess and improve the quality of their education programs, ensuring learners receive effective, high-impact content.
A digital instructor presents all 14 pages. Hold “Ask” at any point and ask out loud — the answer comes from this course. No sign-up needed.
What you’ll learn
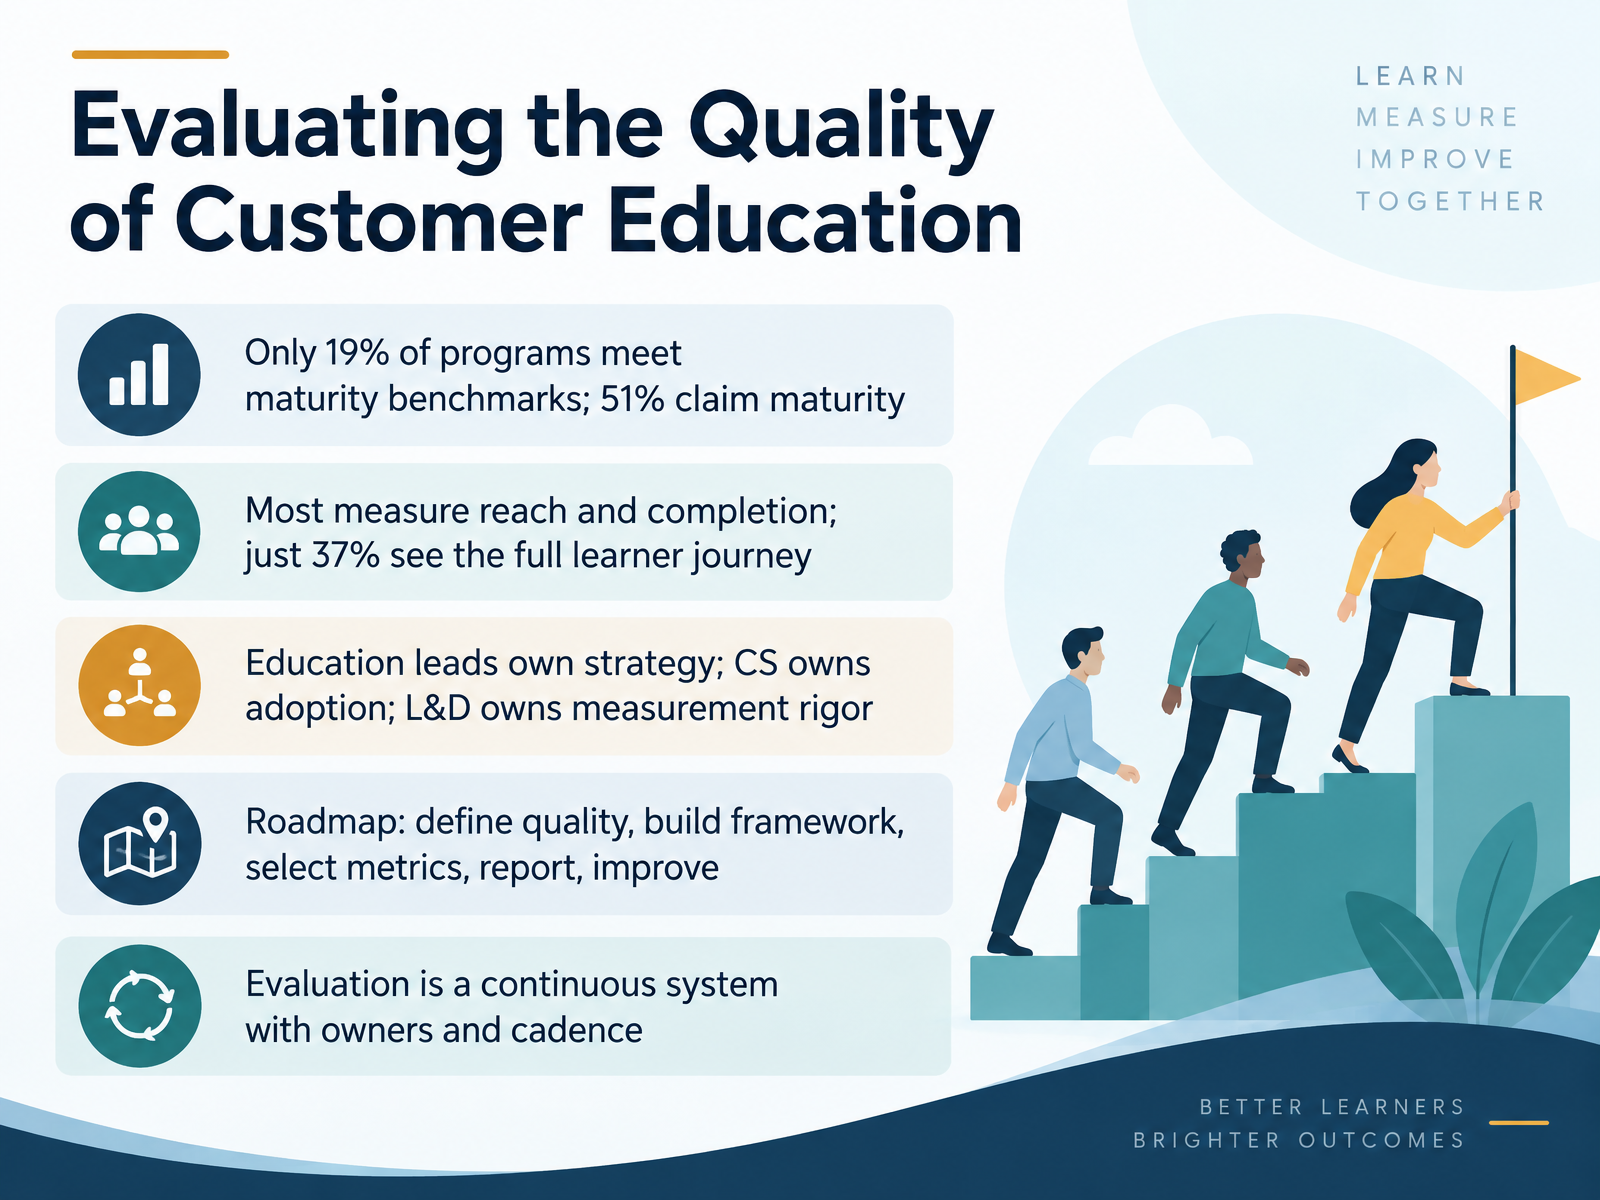
- 01Evaluating the Quality of Customer EducationWelcome. This course is about evaluating the quality of customer education. You lead strategy, adoption, or measurement, and our goal is to turn quality into a decision you can defend. First, the benchmark. Fifty one percent of programs call themselves mature. Only nineteen percent meet the maturity criteria. Treat that gap as a measurement problem, not a messaging one. Second, most teams track reach and completion. Just thirty seven percent see the full learner journey, including drop off and time spent. Completion shows participation, not capability. Third, ownership is shared. Education leads own strategy, customer success owns adoption, and learning and development owns measurement rigor. Name those owners or reporting stalls. The roadmap runs five steps: define quality, build the framework, select metrics, report, and improve. Treat evaluation as a continuous system with owners and a cadence. The practical takeaway is this. Agree on your criteria before you defend your results. Next, we look at why measurement is the bottleneck. The 2026 Context: Why Measurement Is the Bottleneck.absorbai.comeverestgrp.comaction.deloitte.com+22 min
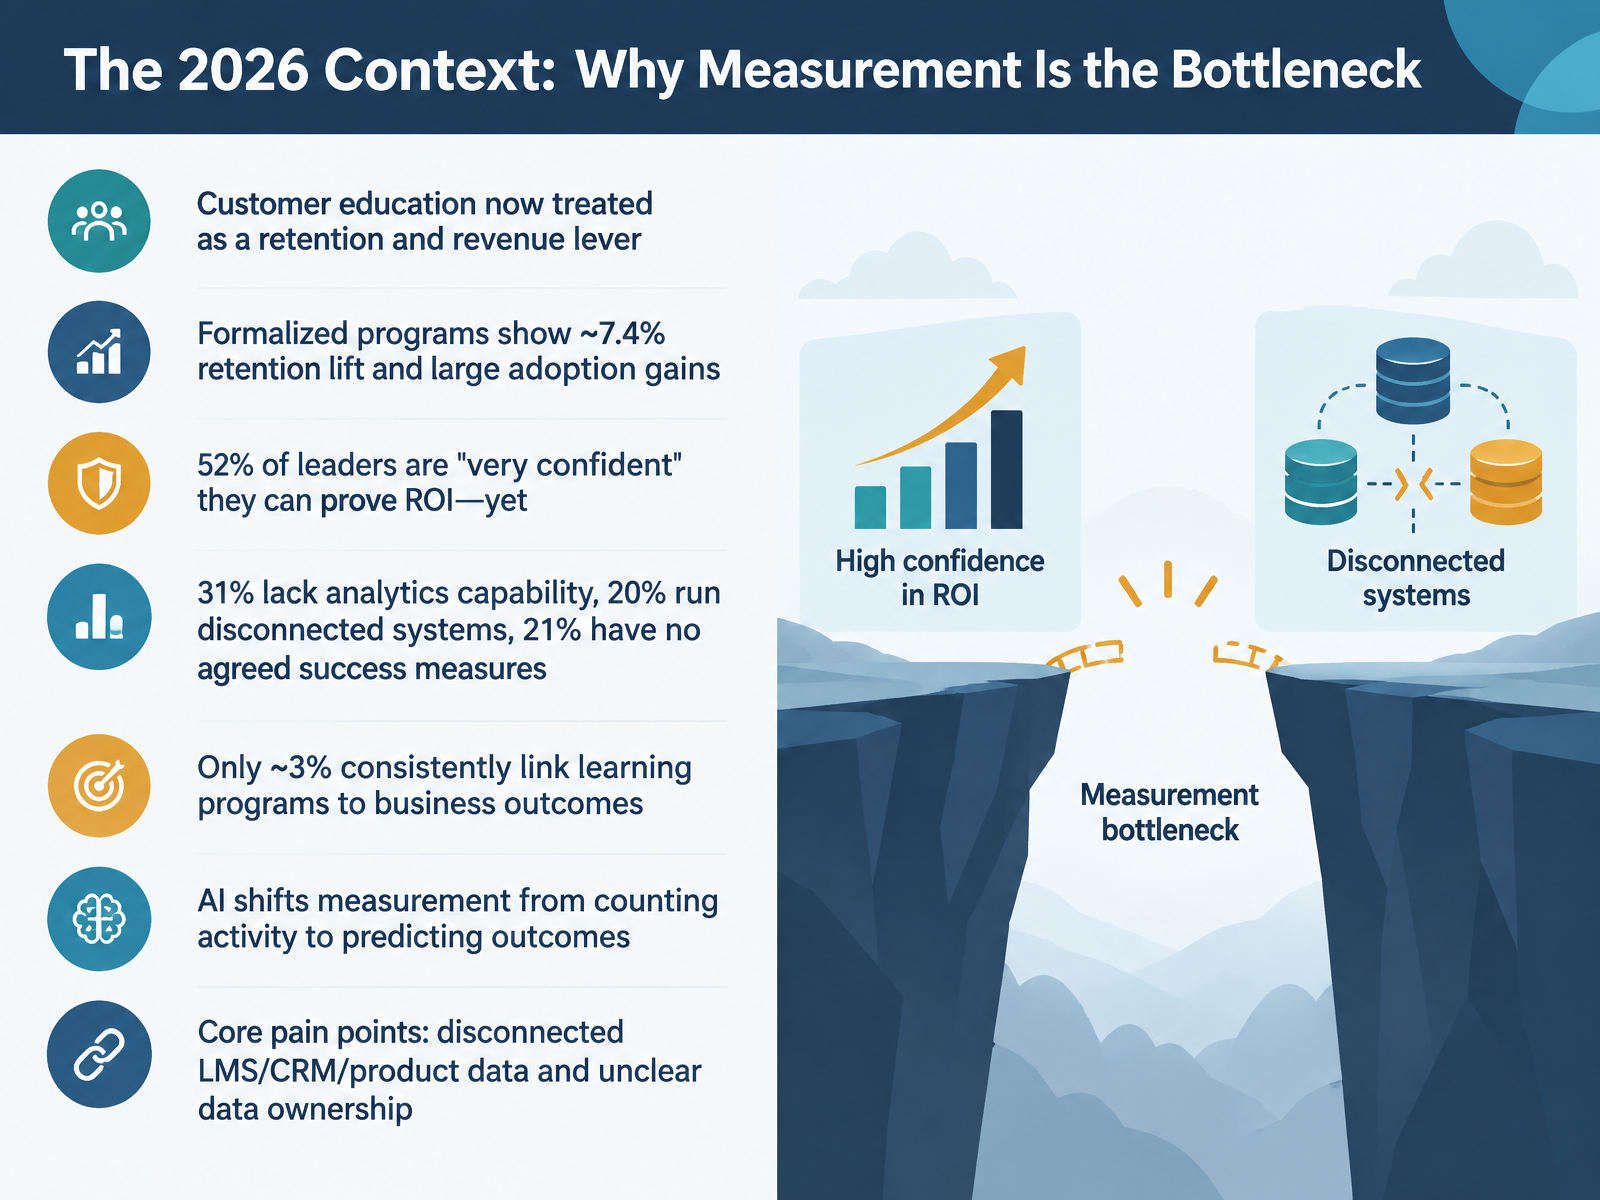
- 02The 2026 Context: Why Measurement Is the BottleneckLet's look at why measurement, not content, is now the bottleneck. First, customer education is treated as a retention and revenue lever. Formalized programs show roughly a seven point four percent retention lift and large adoption gains. Second, confidence outruns capability. Fifty-two percent of leaders are very confident they can prove return on investment. Yet thirty-one percent lack analytics capability, twenty percent run disconnected systems, and twenty-one percent have no agreed success measures. Third, the connection to outcomes is rare. Only about three percent consistently link learning programs to business outcomes. In contrast, AI is shifting measurement from counting activity to predicting outcomes. The practical takeaway for you: data integration and clear data ownership decide whether you can prioritize programs, revise content, and report to stakeholders. Next, we define quality: output quality versus outcome quality.
 absorbai.comeverestgrp.comaction.deloitte.com+22 min
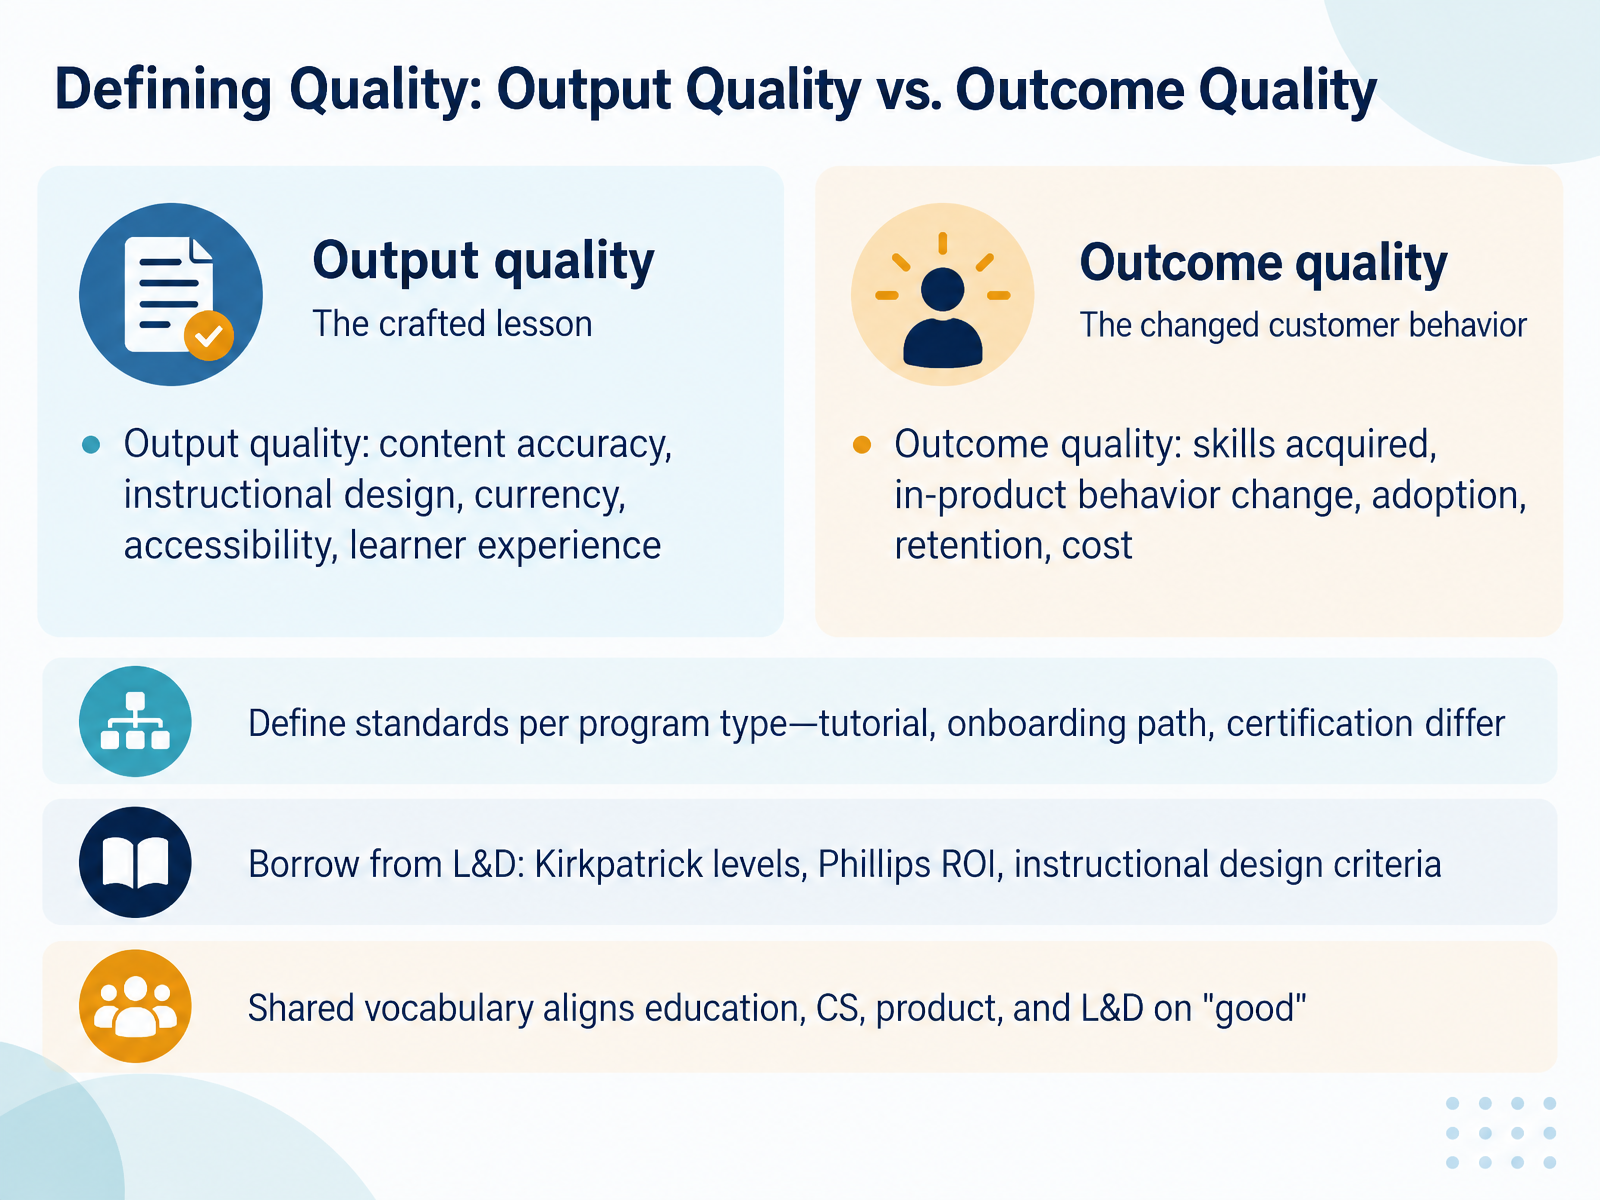
- 03Defining Quality: Output Quality vs. Outcome QualityLet's turn to how we define quality. There are two distinct kinds of quality, and you need both. First, output quality covers the content itself: accuracy, instructional design, currency, accessibility, and learner experience. A rubric can score these directly. In contrast, outcome quality is what happens after learning: skills acquired, in-product behavior change, adoption, retention, and cost. Completion alone tells you little; track the pattern from completion to adoption. Set standards per program type. A tutorial, an onboarding path, and a certification carry different bars, so one checklist will not fit all. Borrow proven L&D tools: the Kirkpatrick levels, the Phillips return-on-investment model, and instructional design criteria. These give you a shared vocabulary, so education, customer success, product, and L&D agree on what good means. That agreement guides program prioritization, content revision, and stakeholder reporting. Next, we apply Kirkpatrick to external customer learners.
 trainingindustry.comassets.hse.iegostudion.com+22 min
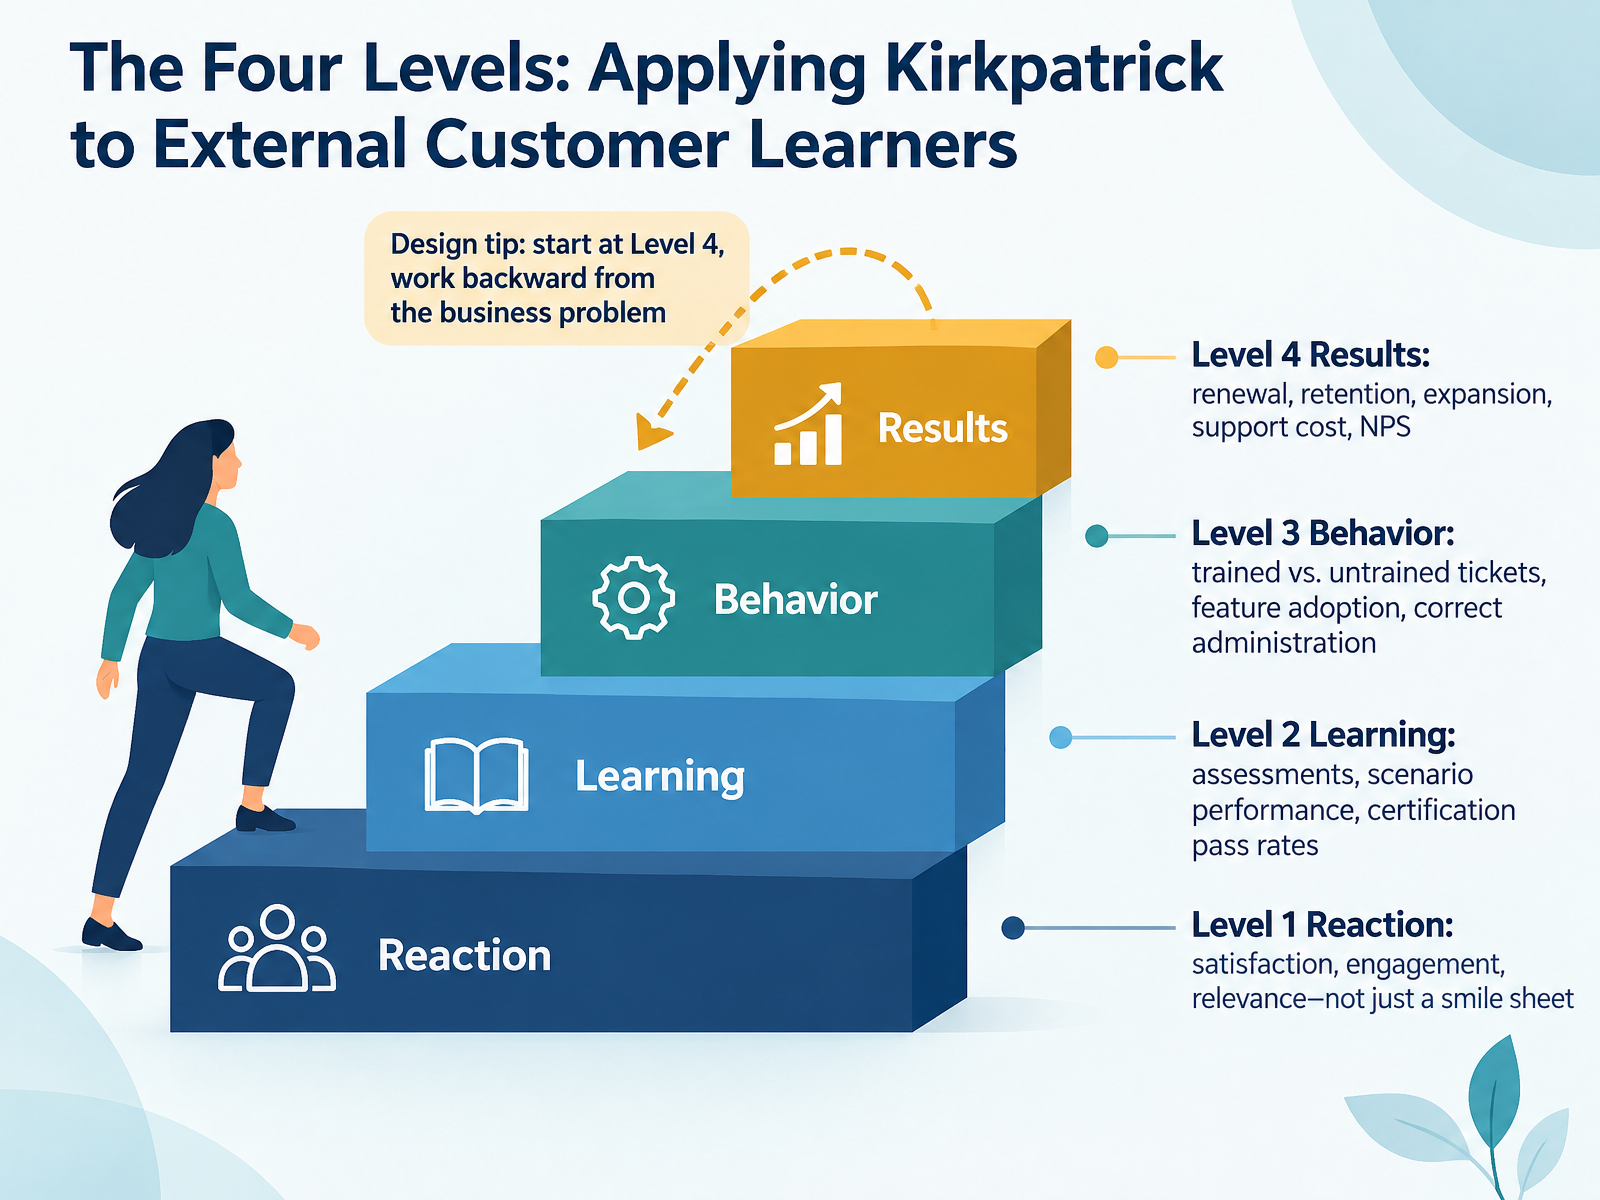
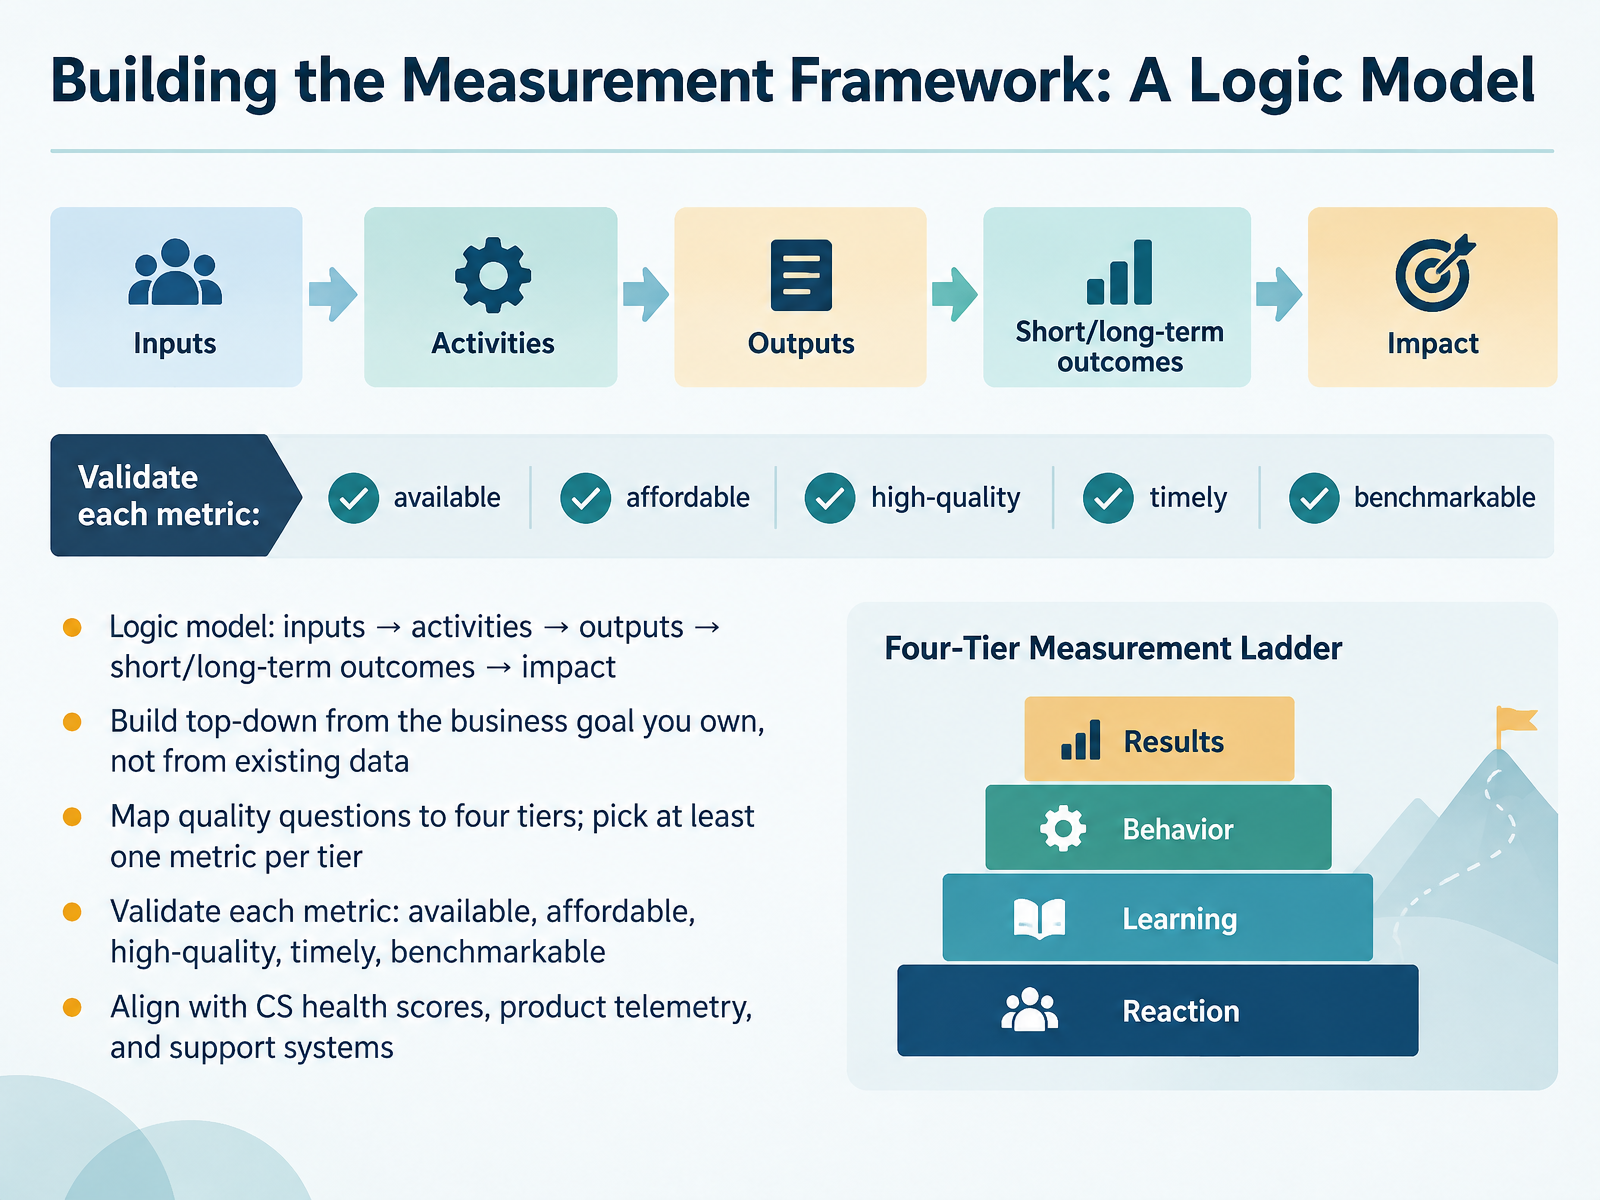
- 04The Four Levels: Applying Kirkpatrick to External Customer LearnersNow let's walk through the four levels of the Kirkpatrick model, applied to external customer learners. First, Level 1 is reaction. You measure satisfaction, engagement, and relevance, not just a smile sheet. The practical use is content revision. Next, Level 2 is learning. Use assessments, scenario performance, and certification pass rates. This tells you whether customers actually gained the skill. Then, Level 3 is behavior. Compare trained versus untrained customers on support tickets, feature adoption, and correct administration. This supports prioritization and stakeholder reporting. Level 4 is results, covering renewal, retention, expansion, support cost, and Net Promoter Score, or N P S. The design tip is to start at Level 4 and work backward from the business problem. That keeps every level tied to a decision. Next, we'll look at common failure modes in quality evaluation.
 trainingindustry.comassets.hse.iegostudion.com+22 min
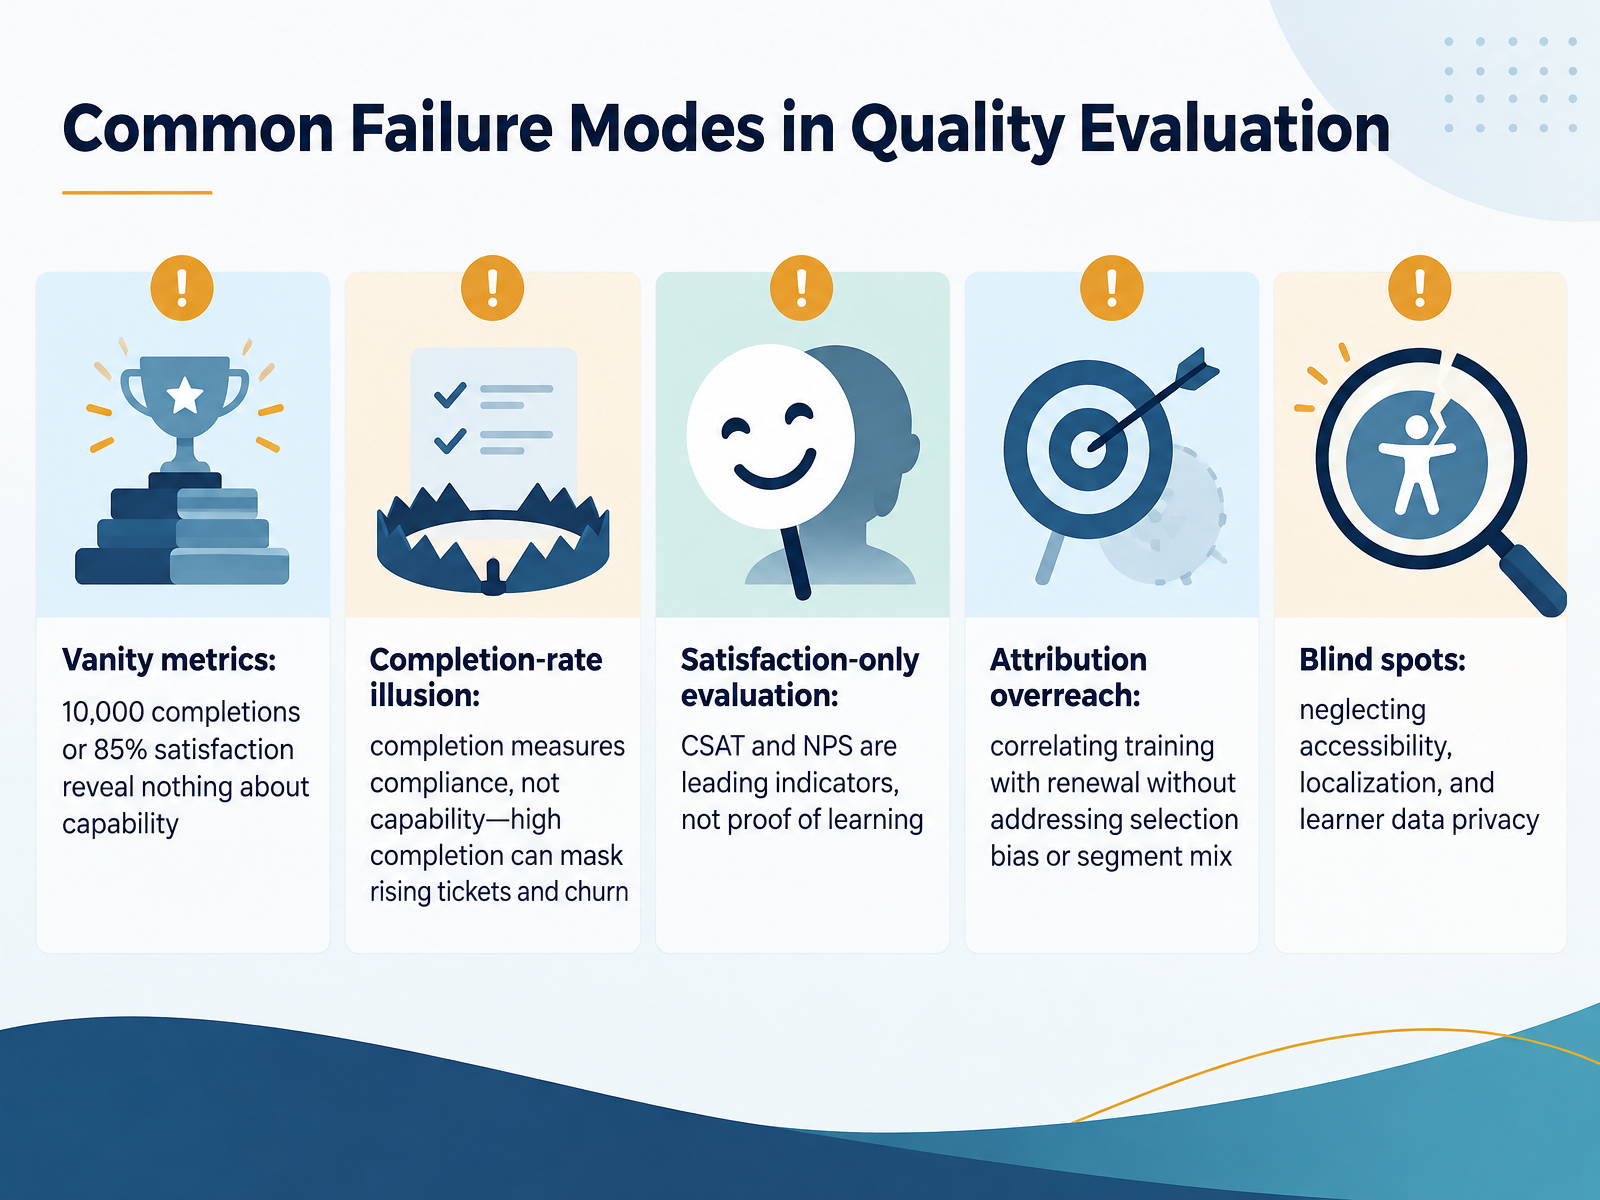
- 05Common Failure Modes in Quality EvaluationNow let's look at the failure modes that quietly weaken quality evaluation. First, vanity metrics. Ten thousand completions or an eighty five percent satisfaction score tells you activity happened. It does not tell you capability improved. Second, the completion-rate illusion. Completion measures compliance, not capability. High completion can sit alongside rising tickets and churn, so check adoption before you report success. Third, satisfaction-only evaluation. CSAT and NPS, customer satisfaction and net promoter scores, are leading indicators. They are not proof of learning, so pair them with knowledge checks and behavior data. Fourth, attribution overreach. Correlating training with renewal without addressing selection bias or segment mix overstates your impact, so compare trained and untrained groups. Finally, blind spots. Accessibility, localization, and learner data privacy shape who can learn and what you may report. Audit all three before scaling. Building the Measurement Framework: A Logic Model.
 trainingindustry.comassets.hse.iegostudion.com+21 min
- 06Building the Measurement Framework: A Logic ModelNext, let's build the measurement framework itself, using a logic model. In simple terms, a logic model links inputs to activities, activities to outputs, outputs to short-term and long-term outcomes, and outcomes to impact. Build it top-down from the business goal you own, not upward from the data you already have. That order protects the framework from drifting toward what is easy to count. Then map your quality questions to four tiers, and choose at least one metric per tier. Validate every metric against five checks: available, affordable, high-quality, timely, and benchmarkable. If a metric fails one of those, replace it before it reaches a stakeholder report. The practical takeaway is to align the model with customer success health scores, product telemetry, and support systems, so your numbers speak the same language as the rest of the business. Next, we will look at core metrics by tier: learning, behavior, and business.
 echtus.comassets.noviams.comthoughtindustries.com+22 min
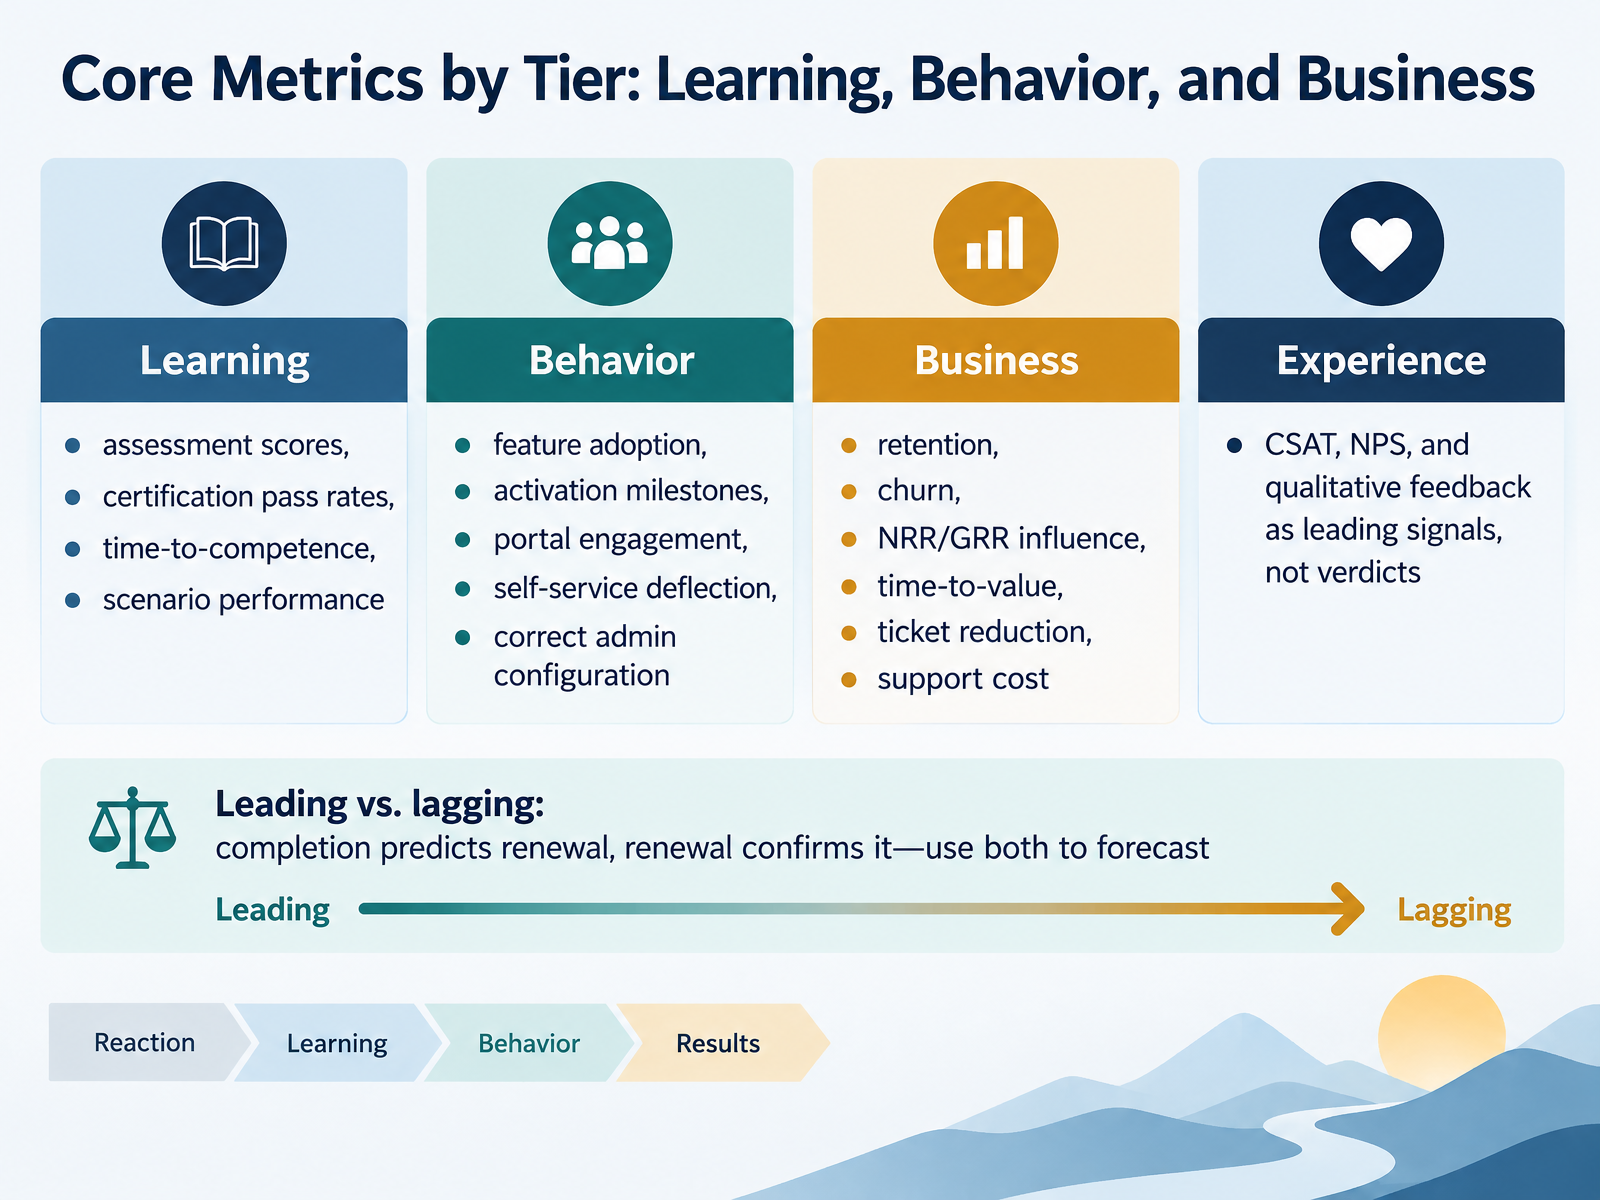
- 07Core Metrics by Tier: Learning, Behavior, and BusinessNow let's look at core metrics by tier. First, learning metrics. Assessment scores, certification pass rates, time-to-competence, and scenario performance tell you whether customers actually understood the content. A high scenario score is stronger evidence than a completion click. Second, behavior metrics. Feature adoption, activation milestones, portal engagement, self-service deflection, and correct admin configuration show whether learning changed what customers do in the product. Third, business metrics: retention, churn, NRR and GRR influence, time-to-value, ticket reduction, and support cost. These are the numbers your executives already track. Use cohort comparisons, trained versus untrained, so you can report the gap honestly. Fourth, experience metrics. CSAT, NPS, and qualitative feedback are leading signals, not verdicts. Treat them as early warnings that prompt a content review. Finally, separate leading from lagging indicators. Completion predicts renewal. Renewal confirms it. Use both to forecast. Next, we turn to method choice: diagnose, prove, or improve.
 thinkific.comcheck-n-click.comintellum.com+22 min
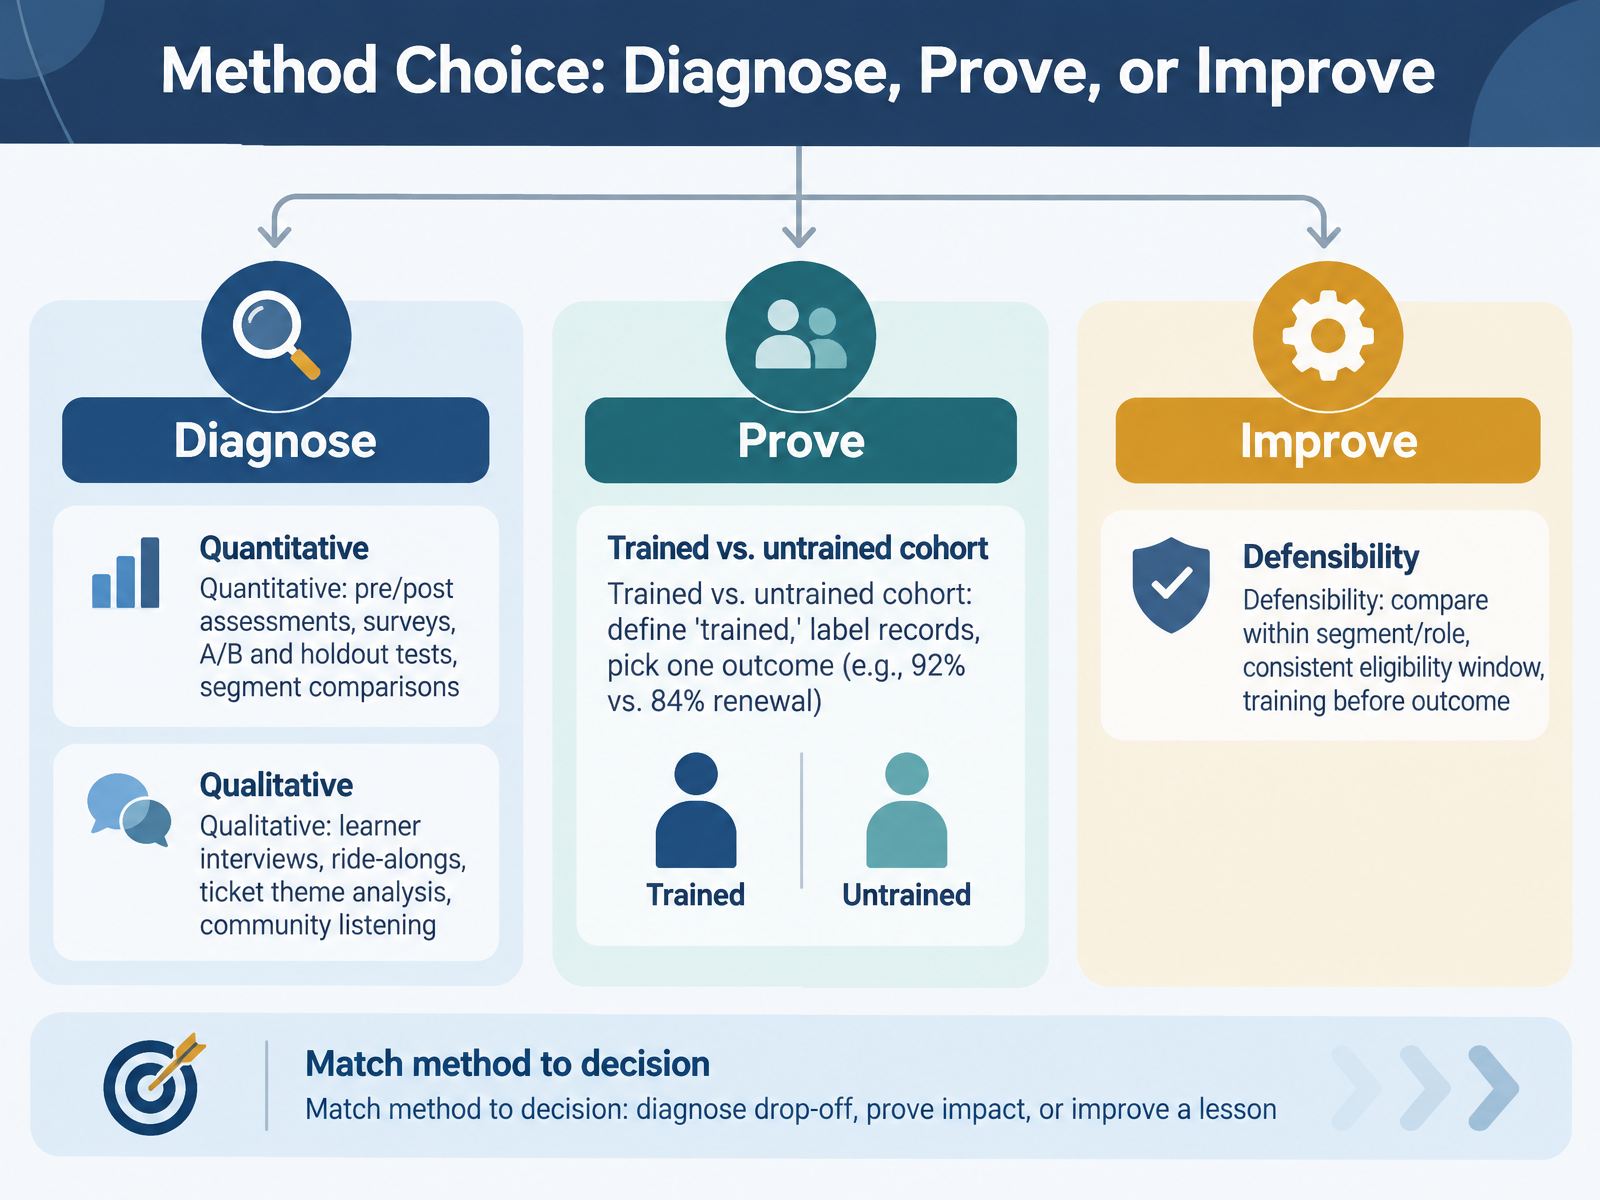
- 08Method Choice: Diagnose, Prove, or ImproveNext, let's talk about choosing your method. The first question is not which data is available. It's which decision you are supporting. A quantitative approach uses pre and post assessments, surveys, A B tests, holdout tests, and segment comparisons. Use it to diagnose drop-off or to prove impact. A qualitative approach uses learner interviews, ride-alongs, ticket theme analysis, and community listening. Use it to improve a specific lesson. When you need to prove impact, compare a trained and an untrained cohort. That requires three inputs. First, define what trained means, for example completed onboarding training. Second, label each record as trained or untrained. Third, pick one outcome, such as renewal, where trained accounts renew at ninety-two percent versus eighty-four percent for untrained accounts. The practical takeaway is to make results defensible. Compare within the same segment or role, use a consistent eligibility window, and confirm training happened before the outcome. Then match the method to the decision in front of you. Next, we'll look at designing assessments and certification that verify capability.
 intellum.comassets.noviams.comechtus.com+22 min
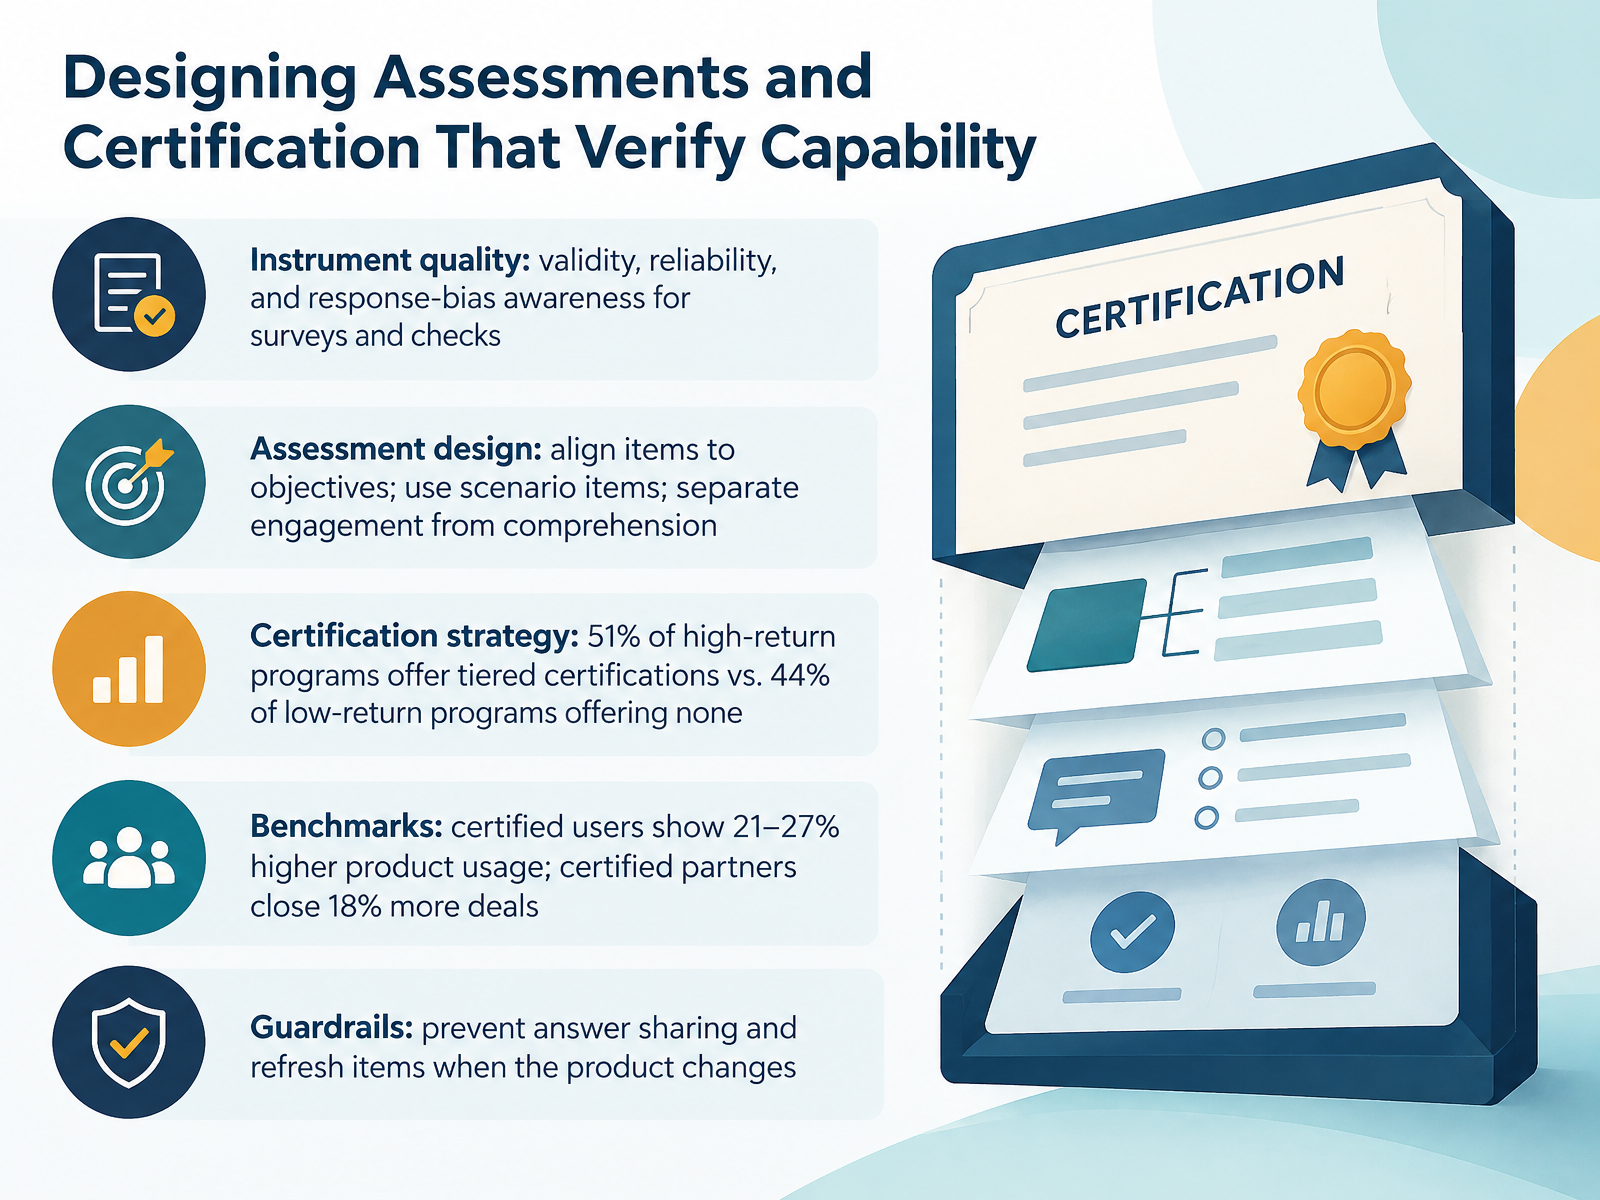
- 09Designing Assessments and Certification That Verify CapabilityNow let's look at assessments and certification that actually verify capability. Start with instrument quality. A survey or check is only useful if it is valid, reliable, and aware of response bias. Next, align every assessment item to a stated objective. Prefer scenario items over recall questions, and keep engagement separate from comprehension. A completion click tells you someone showed up. A passed scenario tells you they can perform. On certification strategy, the pattern is clear. Fifty-one percent of high-return programs offer tiered certifications. Forty-four percent of low-return programs offer none. The benchmarks support that link. Certified users show twenty-one to twenty-seven percent higher product usage, and certified partners close eighteen percent more deals. Finally, add guardrails. Prevent answer sharing and refresh items whenever the product changes. The practical takeaway: treat assessments as evidence you can defend in reporting and prioritization decisions. From Data to Decisions: Dashboards and Reporting.
 thinkific.comcheck-n-click.comintellum.com+22 min
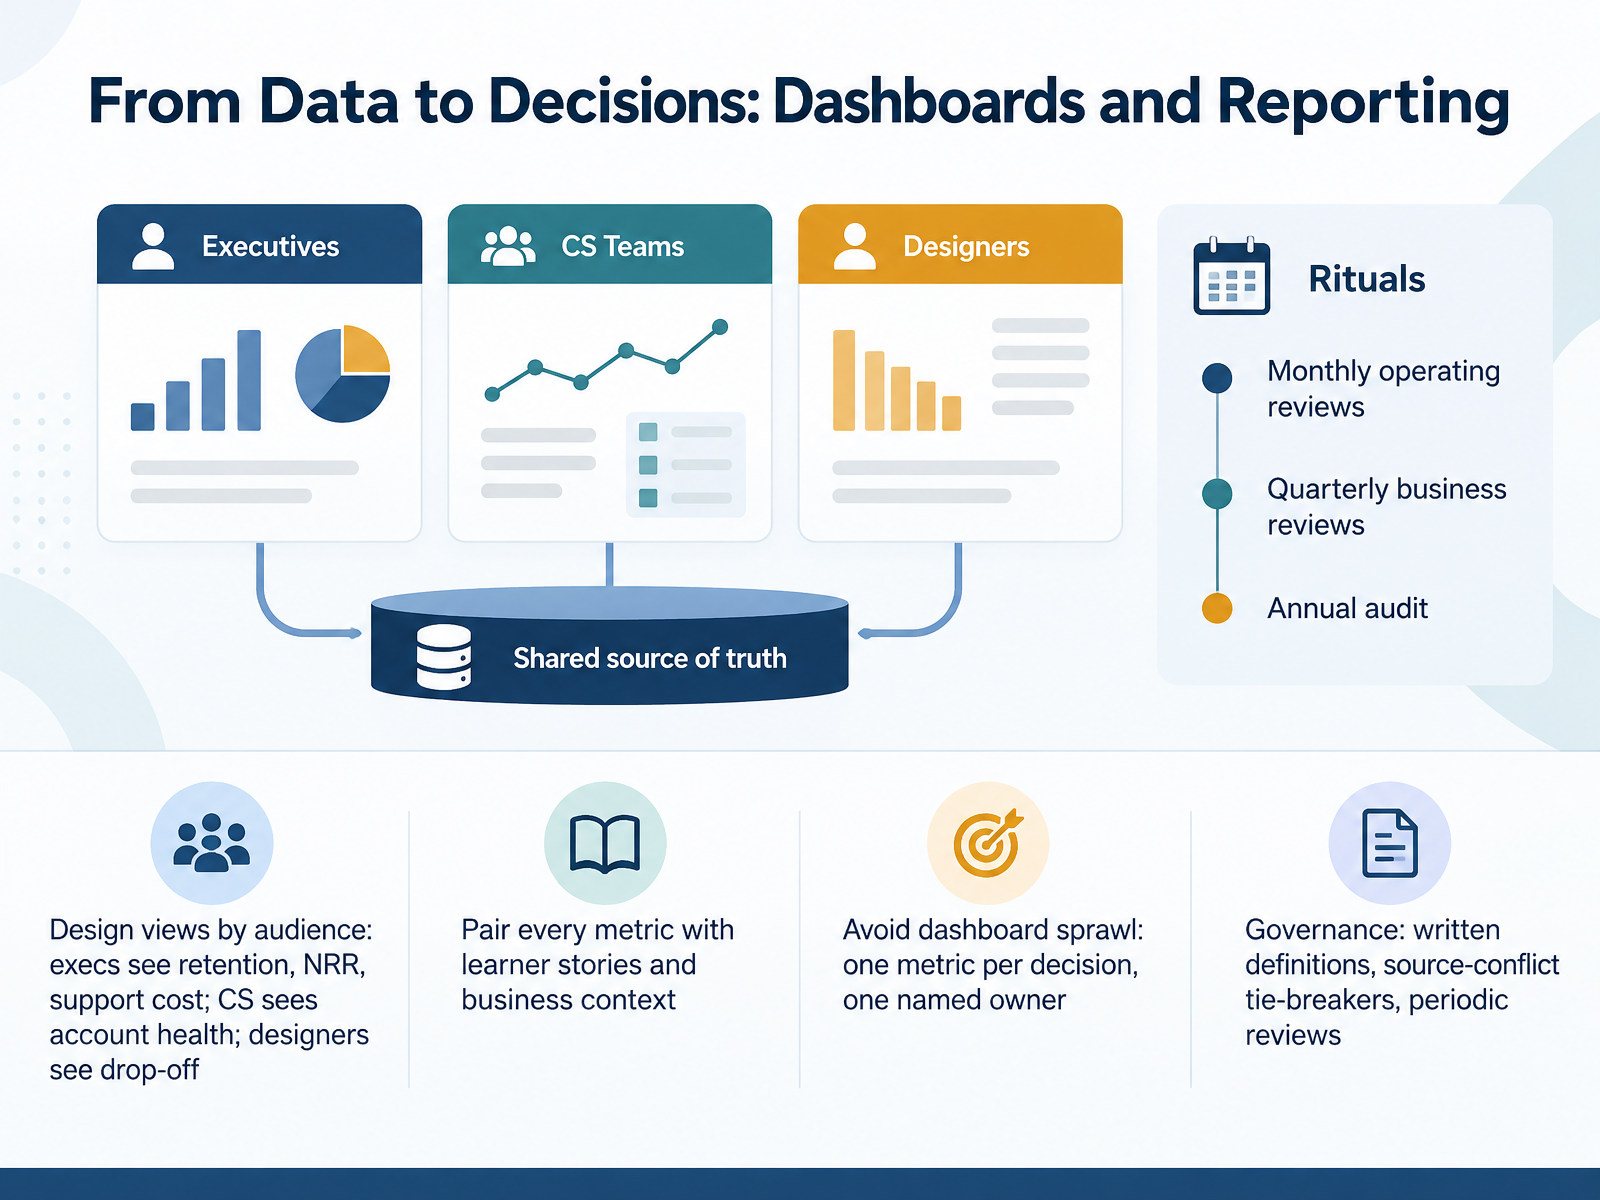
- 10From Data to Decisions: Dashboards and ReportingNow let's turn data into decisions. First, design dashboard views by audience. Executives see retention, net revenue retention, and support cost. Customer Success sees account health. Designers see drop off by content. One shared dashboard for everyone serves no one. Second, pair every metric with learner stories and business context. A number without a story invites doubt. Third, set rituals. Monthly operating reviews for tactics. Quarterly business reviews with stakeholders. An annual audit of the whole measurement system. Fourth, avoid dashboard sprawl. Each metric should map to one decision and one named owner. The practical takeaway is governance. Write down definitions. Name a tie breaker for source conflicts. Review definitions on a cadence. Next, we look at case examples that turn these findings into program changes.
 echtus.comassets.noviams.comthoughtindustries.com+21 min
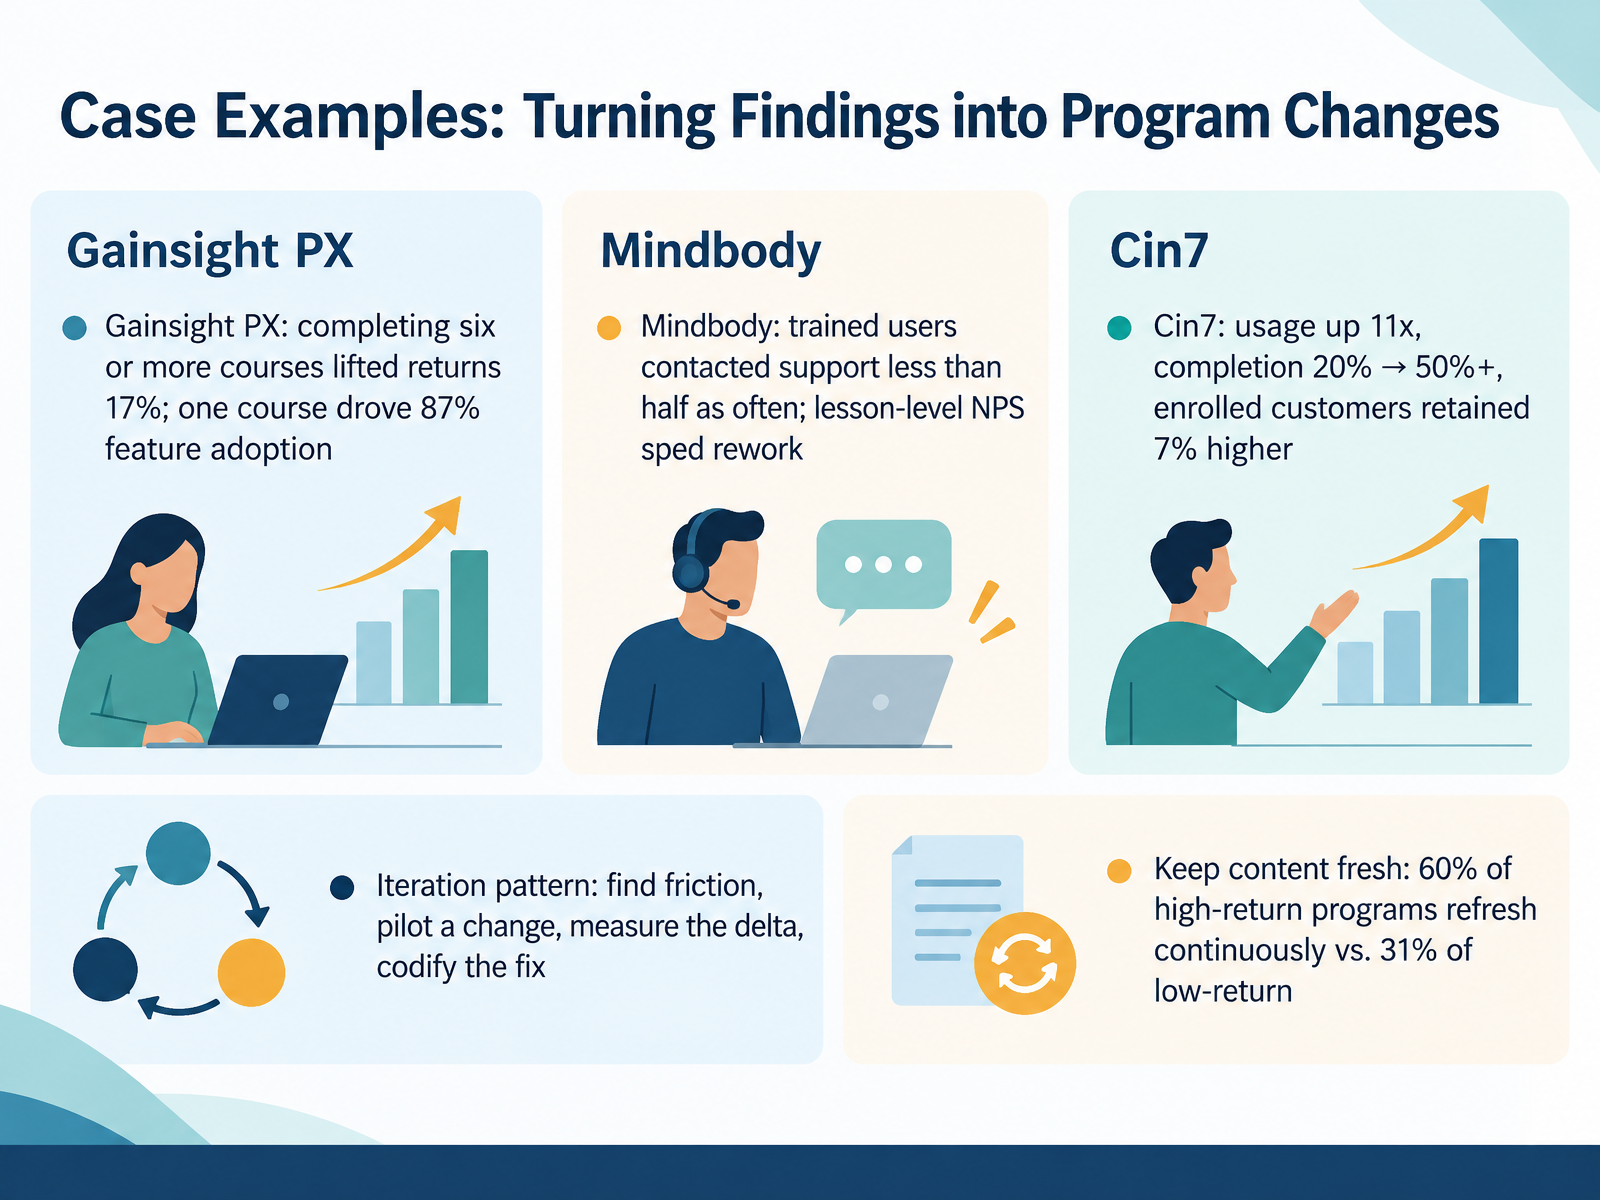
- 11Case Examples: Turning Findings into Program ChangesNow let's look at how findings become program changes. At Gainsight PX, customers who completed six or more courses returned to the product 17% more often, and one Timeline course drove 87% feature adoption. At Mindbody, trained users contacted support less than half as often, and lesson-level NPS showed exactly which lessons to rework. At Cin7, usage rose 11 times, completion went from 20% to over 50%, and enrolled customers retained 7% higher. The pattern is consistent: find friction, pilot a change, measure the delta, then codify the fix. And keep content fresh. 60% of high-return programs refresh continuously, versus 31% of low-return programs. Next, closing the loop with continuous improvement practices.
 thinkific.comcheck-n-click.comintellum.com+22 min
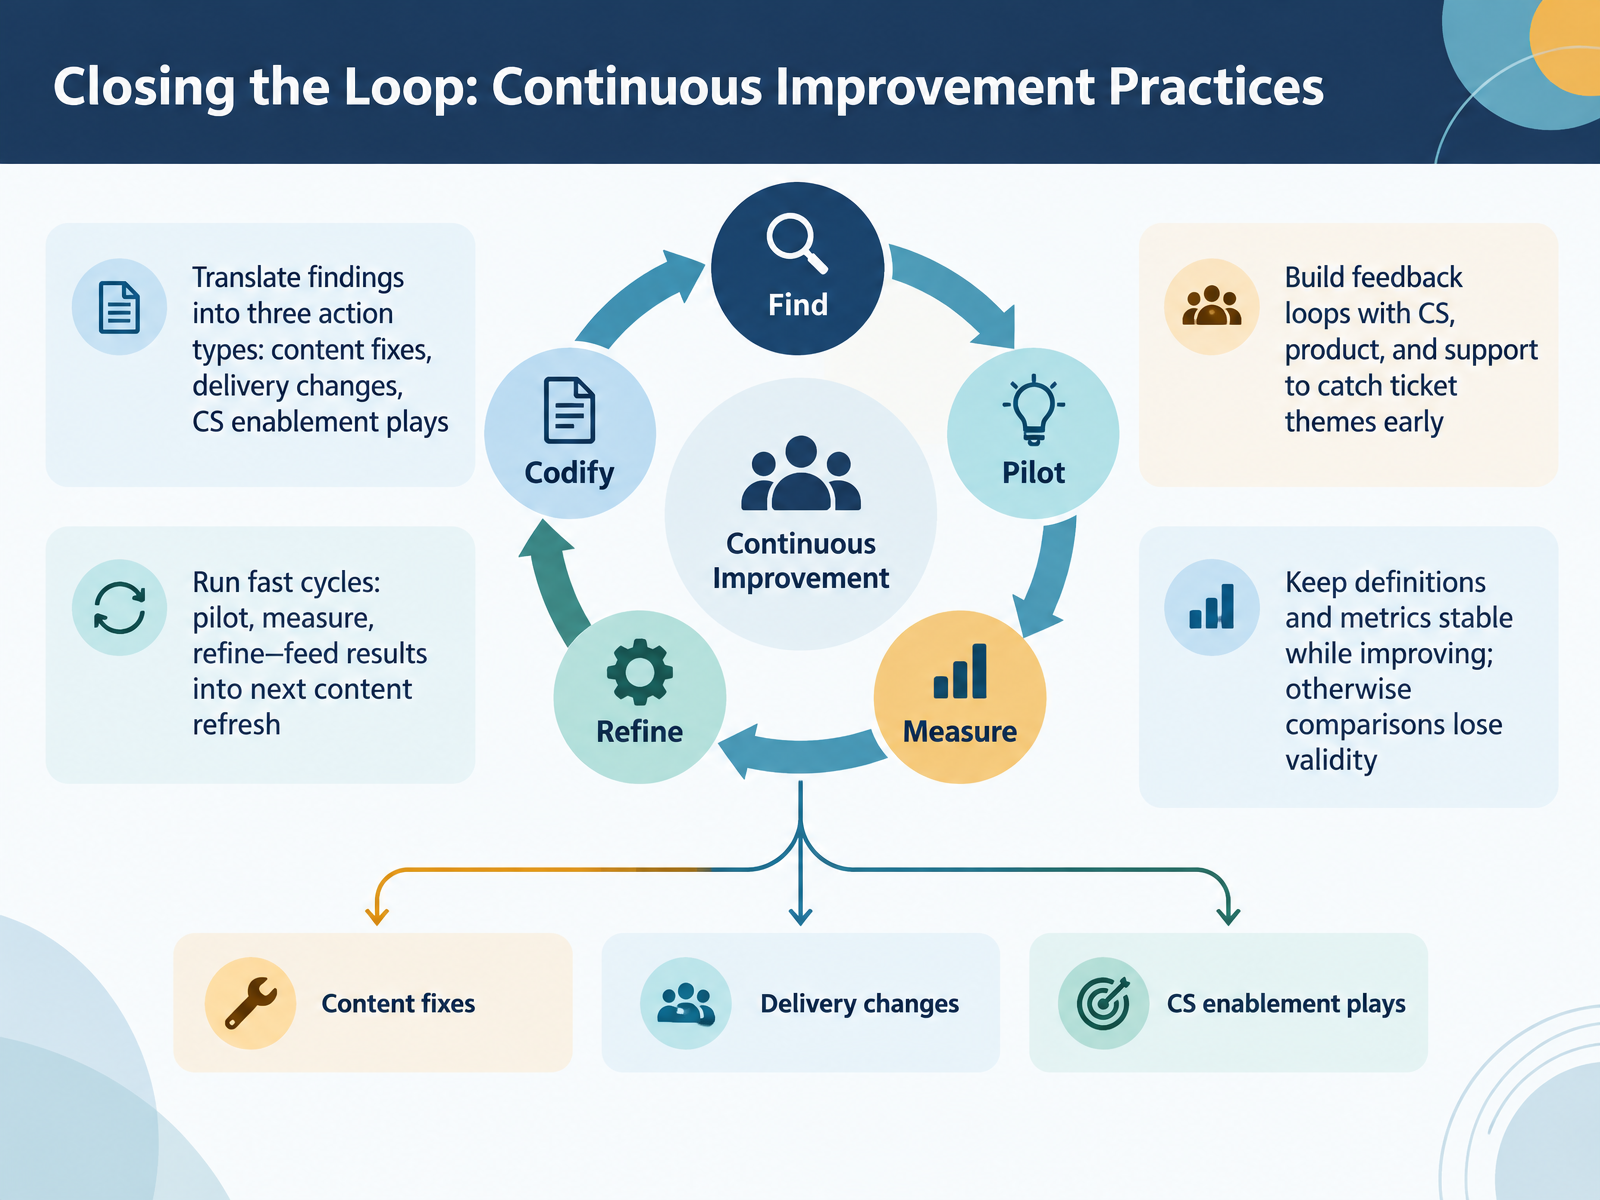
- 12Closing the Loop: Continuous Improvement PracticesLet's turn findings into action. Treat every insight as one of three action types: a content fix, a delivery change, or a CS enablement play. This classification keeps your backlog honest when you prioritize.
Next, run fast cycles. Pilot, measure, refine, and feed results into the next content refresh. Short cycles keep small errors from becoming expensive rewrites.
Then, build feedback loops with CS, product, and support. Ticket themes surface early, before they become widespread confusion.
The practical takeaway: assign a content owner separately from the course builder. That separation was the widest gap between high-return and low-return programs.
One caution. Keep definitions and metrics stable while you improve. If completion means one thing this quarter and another next quarter, your comparisons lose validity. So lock the definition, name an owner, and report it the same way each time.
Now let's look at quality risks: attribution, accessibility, and data privacy.
 check-n-click.comechtus.comassets.noviams.com+21 min
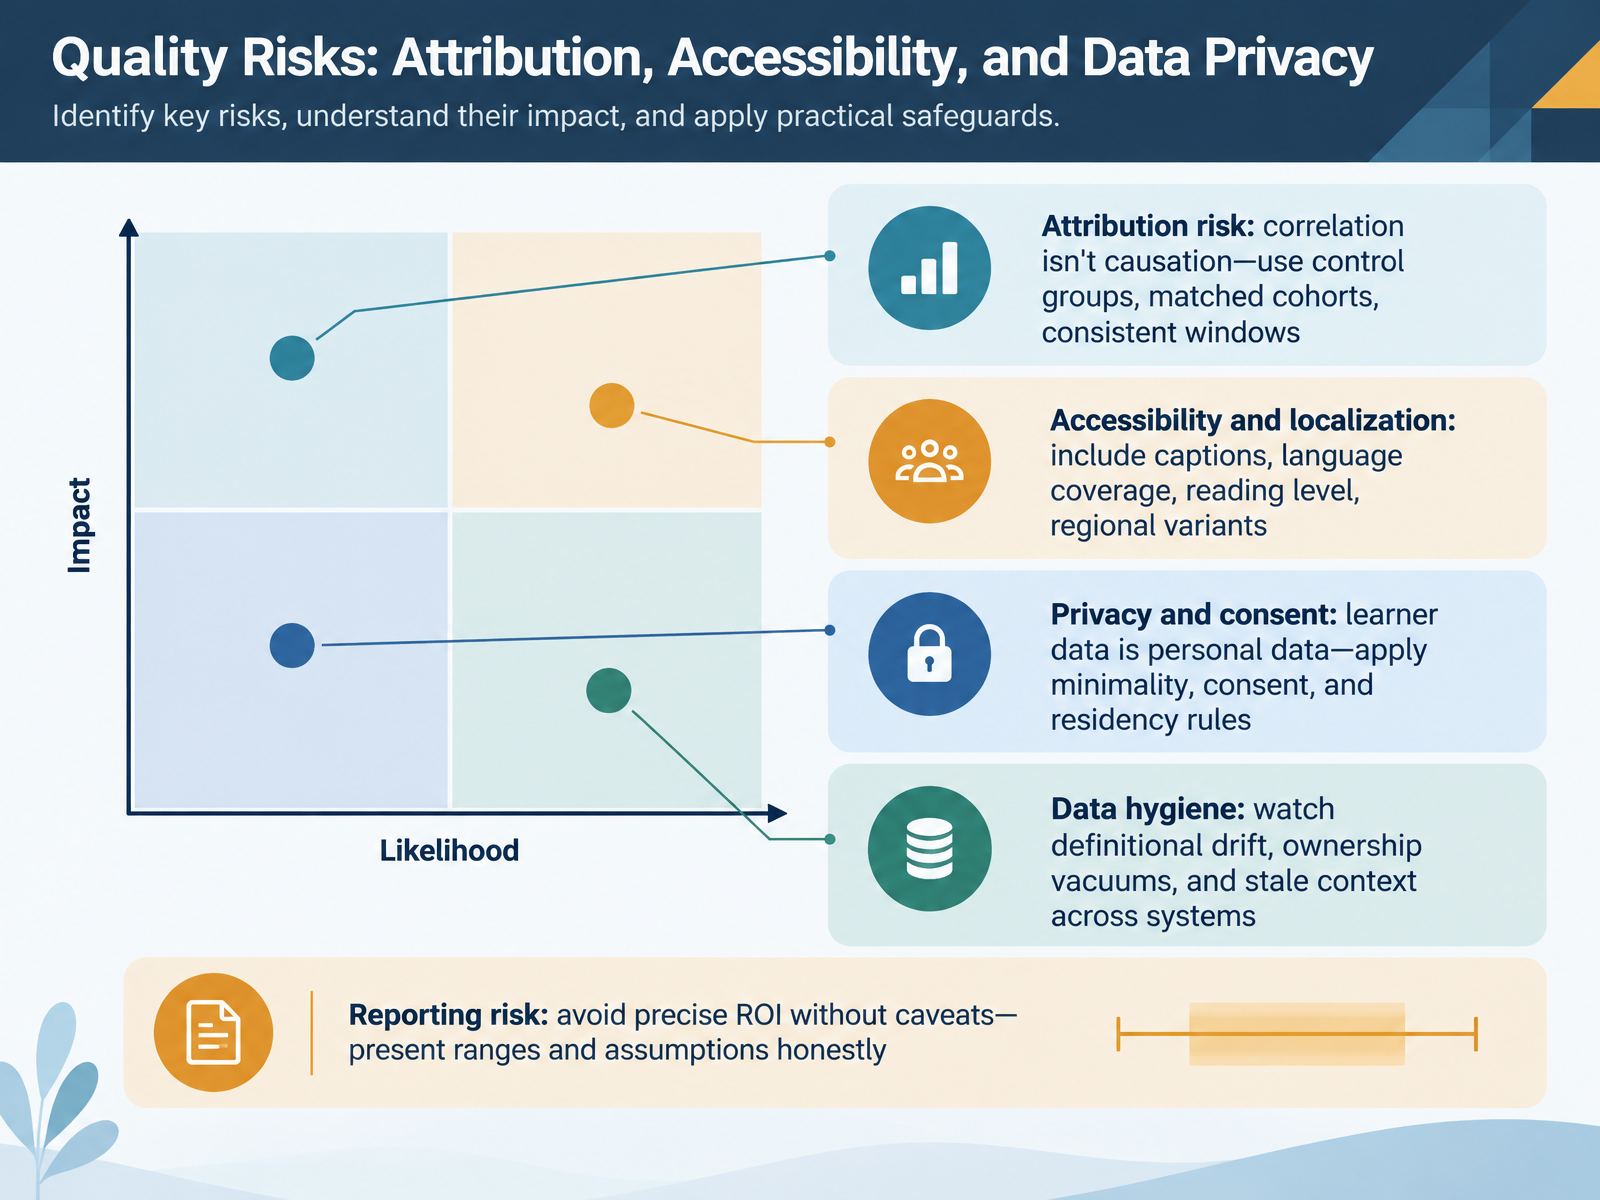
- 13Quality Risks: Attribution, Accessibility, and Data PrivacyLet's turn to quality risks in evaluation, because weak evidence can lead your decisions astray. First, attribution risk. Correlation is not causation. A trained cohort that renews at a higher rate may simply contain larger accounts. Use control groups, matched cohorts, and consistent measurement windows so comparisons are defensible. Second, accessibility and localization. Check captions, language coverage, reading level, and regional variants. If those gaps sit in a course you prioritize, fix them before scaling it. Third, privacy and consent. Learner data is personal data, so apply minimality, capture consent, and respect residency rules. Fourth, data hygiene. Watch for definitional drift, ownership vacuums, and stale context across systems. Name one owner per metric and one source of truth. Finally, reporting risk. Avoid precise return on investment claims without caveats. Present ranges and state your assumptions honestly, so stakeholders can trust the numbers they use. Next, we move to your 90-Day Action Plan and Next Steps.
 check-n-click.comintellum.comassets.noviams.com+12 min
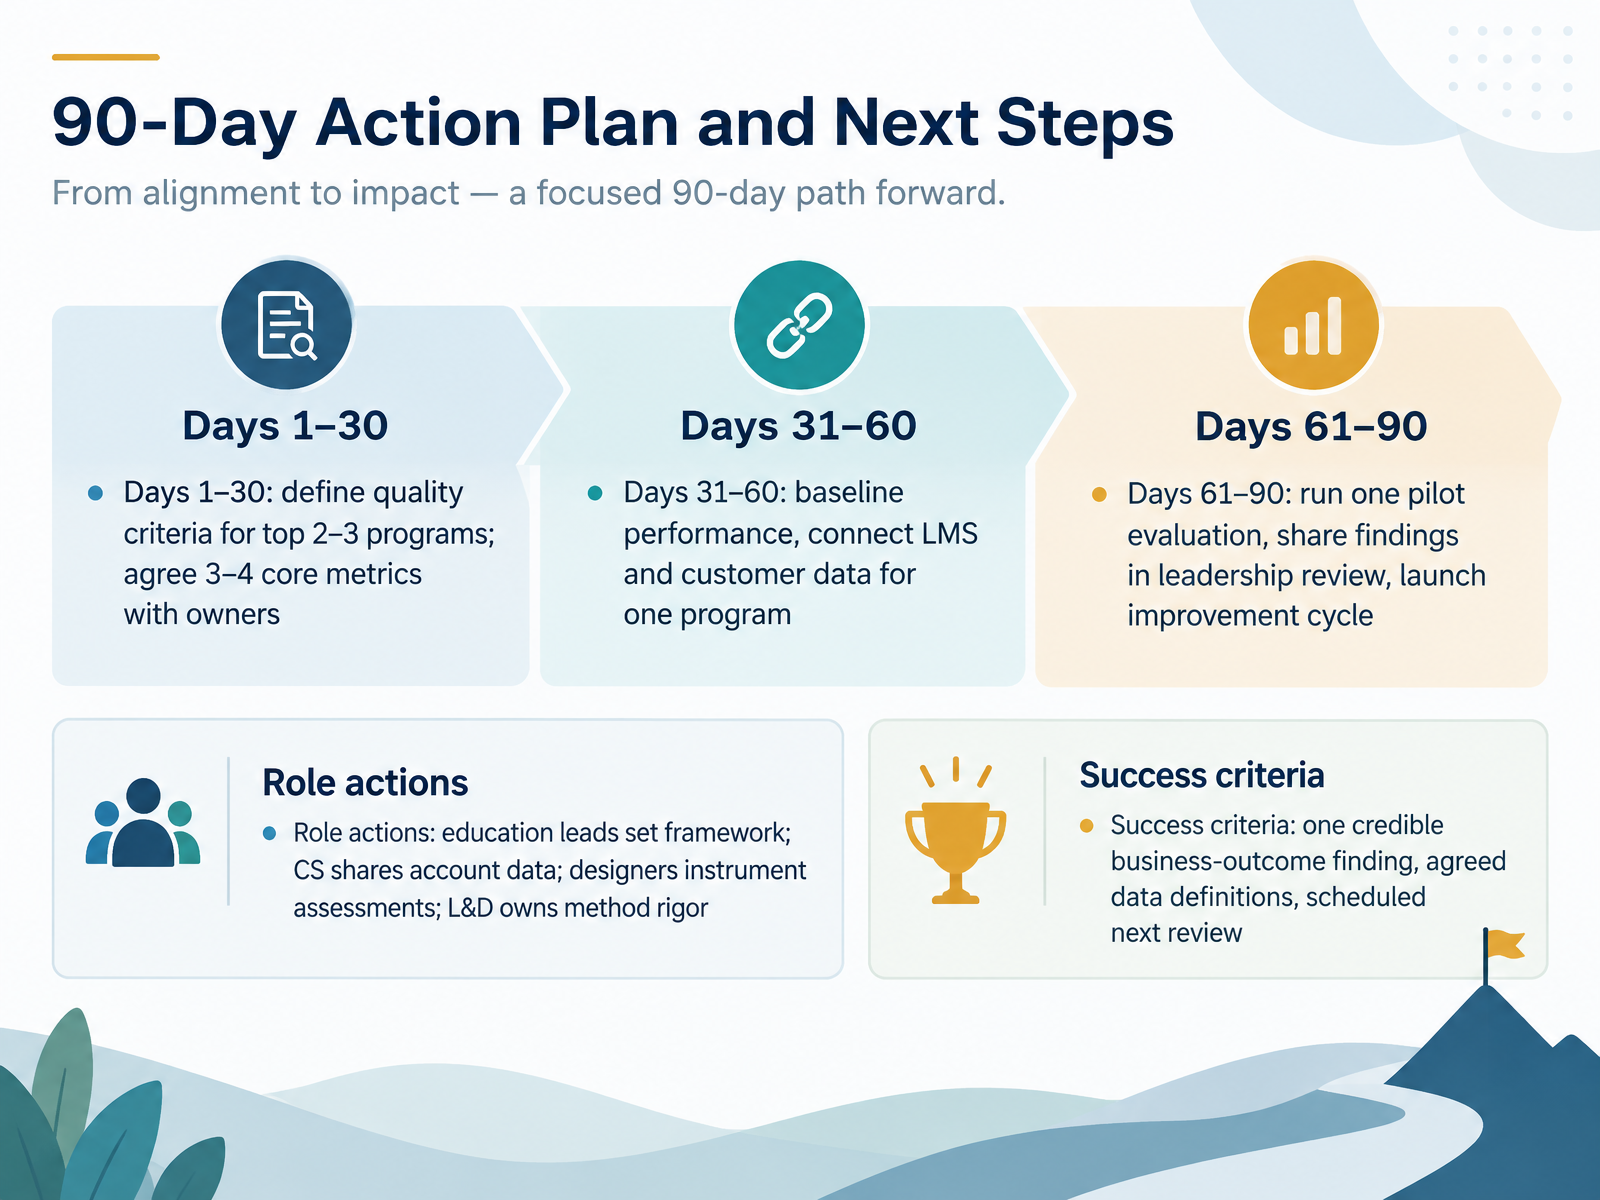
- 1490-Day Action Plan and Next StepsLet's close with a practical ninety-day plan you can act on. In days one through thirty, define quality criteria for your top two or three programs. Agree on three or four core metrics, each with a named owner. In days thirty-one through sixty, baseline current performance and connect learning management system data to customer data for one program. This is the step that turns completion into evidence. In days sixty-one through ninety, run one pilot evaluation, share findings in a leadership review, and launch the improvement cycle. Role actions are clear. Education leads set the framework. Customer success shares account data. Designers instrument assessments. L and D owns method rigor. Success criteria are modest and credible. One business-outcome finding, agreed data definitions, and a scheduled next review. Thank you for your attention, and good luck with your first evaluation cycle.
 absorbai.comeverestgrp.comaction.deloitte.com+22 min
Take the deck with you
Download this course as a file — free, no sign-up needed.
- PDF handoutEvery slide page, ready to print or share.15 pages · 3.1 MBDownload
- Narrated PowerPointThe deck that presents itself — every slide carries the digital human's narration video.15 pages · 14.0 MBDownload
- PowerPoint slidesThe full deck as a .pptx — open it in PowerPoint, Keynote, or Google Slides.15 pages · 3.0 MBDownload
Free to use in your own training — please keep the PersonWise credit page at the end.
Have your own deck? Turn it into a course
Sources consulted
Web sources consulted while building this course.
- The state of customer education in 2026 | Absorb LMS Software — absorbai.com
- Customer Education Maturity Assessment (CEMA) - Everest Group Research Portal — everestgrp.com
- The future of customer and partner education — action.deloitte.com
- What is customer education maturity in the age of AI? — business.adobe.com
- Customer Education — cedma-europe.org
- Measuring Training Outcomes in Customer Education — trainingindustry.com
- Evaluation of Education and Learning Programmes Guide 2023 — assets.hse.ie
- Studion | Proving Business Impact for Customer Education, Partner Enablement, and Channel Sales Training — gostudion.com
- Kirkpatrick’s levels and education ‘evidence’ — doi.org
- Evaluation of education | Educational quality & management | Learning & Teaching Portal — utwente.nl
- How to Measure the Impact of Your Customer Education Program: Metrics and Strategy — Echtus — echtus.com
- CEdMA empowerED25 | Kevin Dunn Presentation — assets.noviams.com
- Customer Success & Customer Education: Two Paths to the Same Goal - Thought Industries — thoughtindustries.com
- From Core Metrics to Impact Metrics_empowerED25_Tom Studdert — assets.noviams.com
- Customer Education Metrics to Measure — intellum.com
- From Learning To Revenue — thinkific.com
- Customer Education Metrics Guide: Proving ROI (2026) - Check N Click Learning and Technologies Pvt. Ltd. — check-n-click.com
- Drive Business Success Through Customer Education — thoughtleadership.forrester.com
- Customer education KPIs: The metrics that actually predict retention | Absorb LMS Software — absorbai.com
- How to Prove Education’s Impact with Cohort Analysis — intellum.com