Begin
14 pages · ~28 min
Calculating Email Marketing Conversion Rate
Learn a practical workflow for calculating email marketing conversion rates. Ideal for marketers and analysts seeking to measure campaign performance accurately.
A digital instructor presents all 14 pages. Hold “Ask” at any point and ask out loud — the answer comes from this course. No sign-up needed.
What you’ll learn
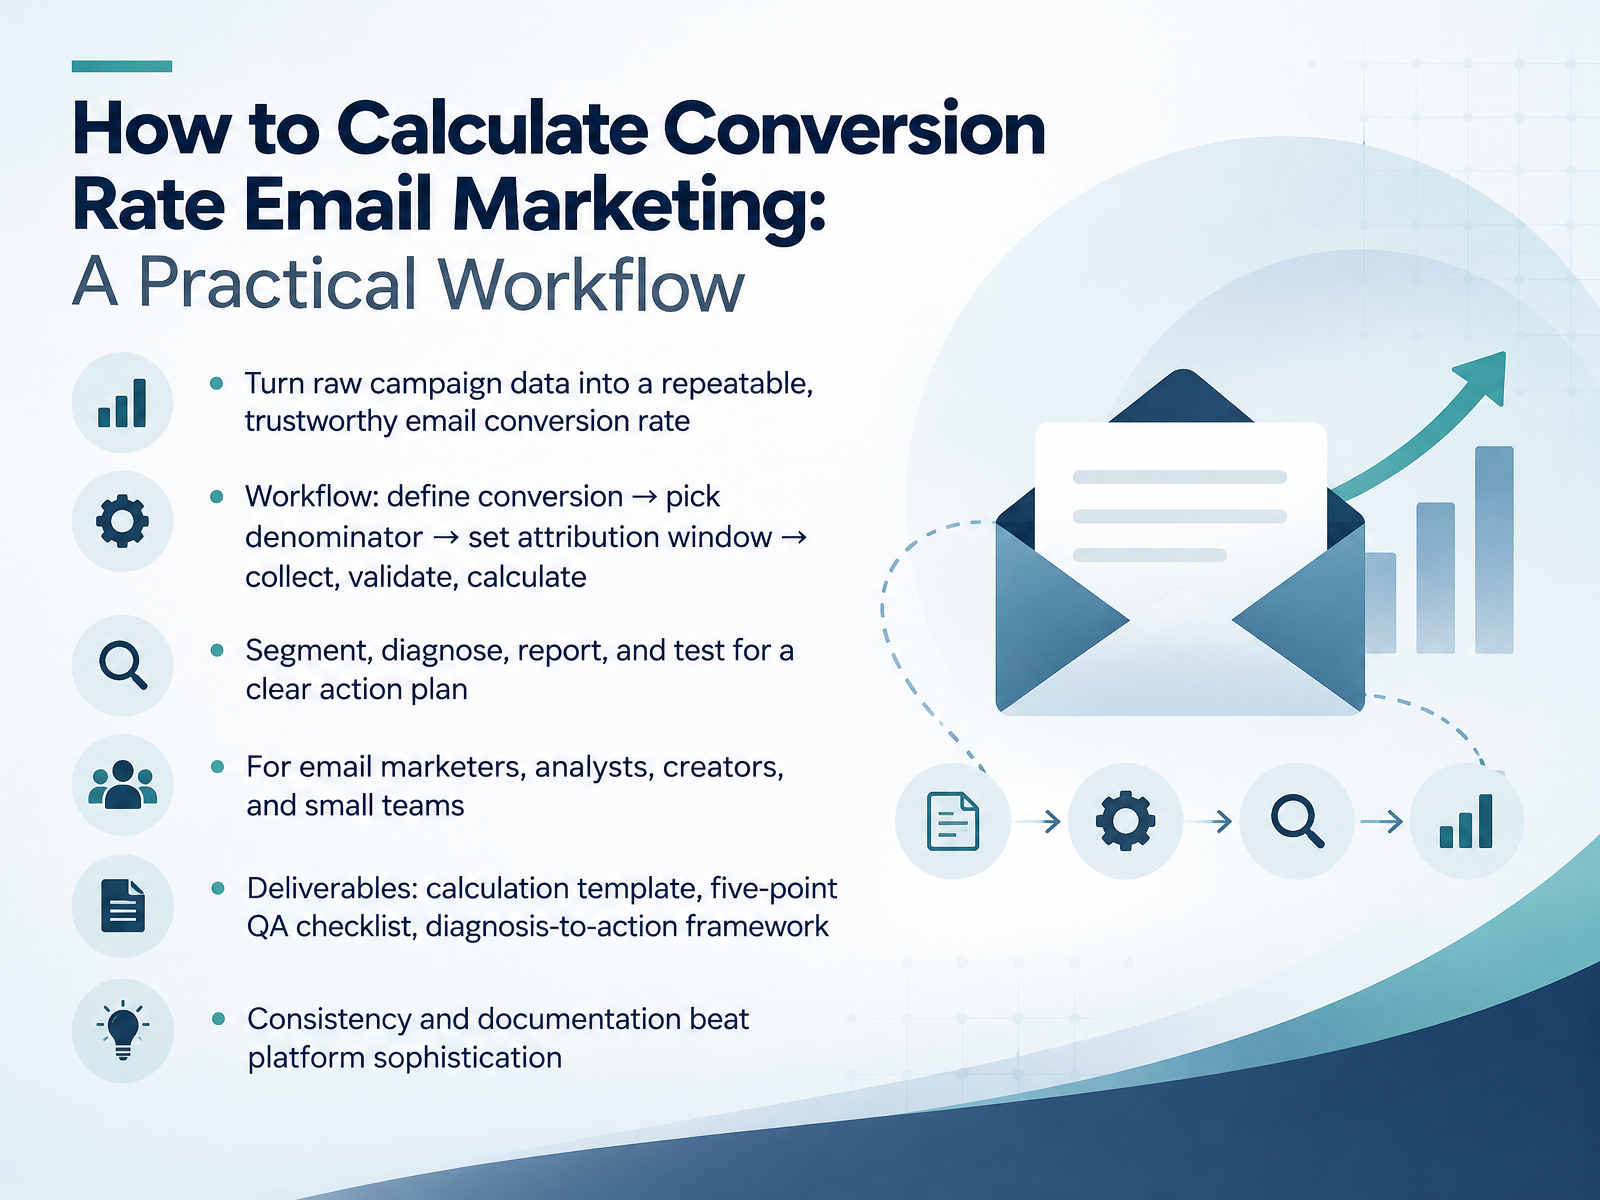
- 01How to Calculate Conversion Rate Email Marketing: A Practical WorkflowWelcome. If you have ever stared at two reports and gotten two different conversion rates, you are in the right place. In this course, we will turn raw campaign data into one repeatable, trustworthy email conversion rate. Think of it as a workflow. First, define your conversion. Then pick your denominator. Then set an attribution window. Then collect, validate, and calculate. From there, we segment, diagnose, report, and test, so each number points to a clear action. This is built for email marketers, analysts, creators, and small teams working with limited time and small lists. You will leave with a calculation template, a five point Q A checklist, and a diagnosis to action framework. One core idea to remember. Consistency and documentation beat platform sophistication every time. Next, let us look at why standard email metrics mislead in 2026.blog.hubspot.comhelp.shopify.comemailcloud.com+21 min
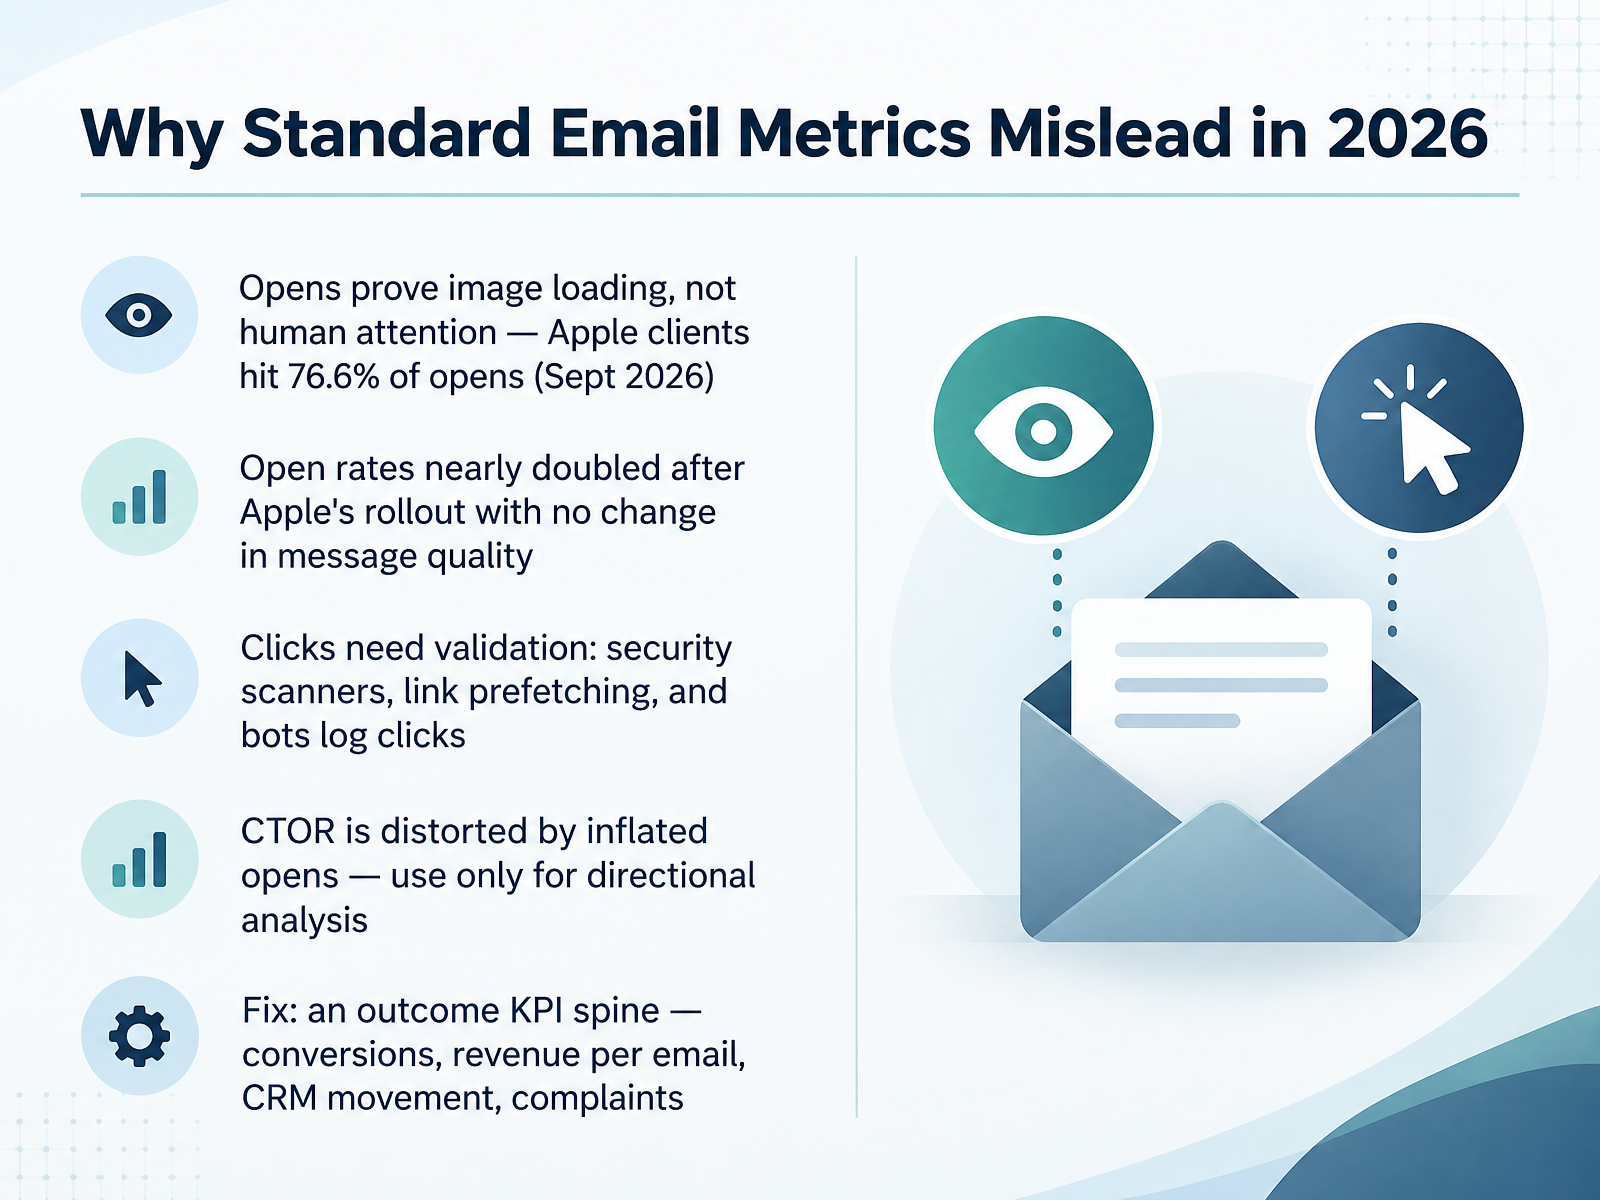
- 02Why Standard Email Metrics Mislead in 2026Let's talk about why the classic email metrics can mislead you in 2026. Start with opens. An open really proves an image loaded, not that a human paid attention. Apple clients accounted for about seventy-seven percent of opens in September 2026. After Apple's rollout, open rates nearly doubled, with no change in message quality. So opens are a weak signal. Clicks need validation too. Security scanners, link prefetching, and bots log clicks before a person ever sees the message. And click-to-open rate is distorted by inflated opens, so use it only for directional analysis. The fix is an outcome KPI spine. Track conversions, revenue per email, CRM movement, and complaints. Those measure what customers actually do. Next, we'll define the conversion event before you calculate.
 blog.hubspot.comhelp.shopify.comemailcloud.com+22 min
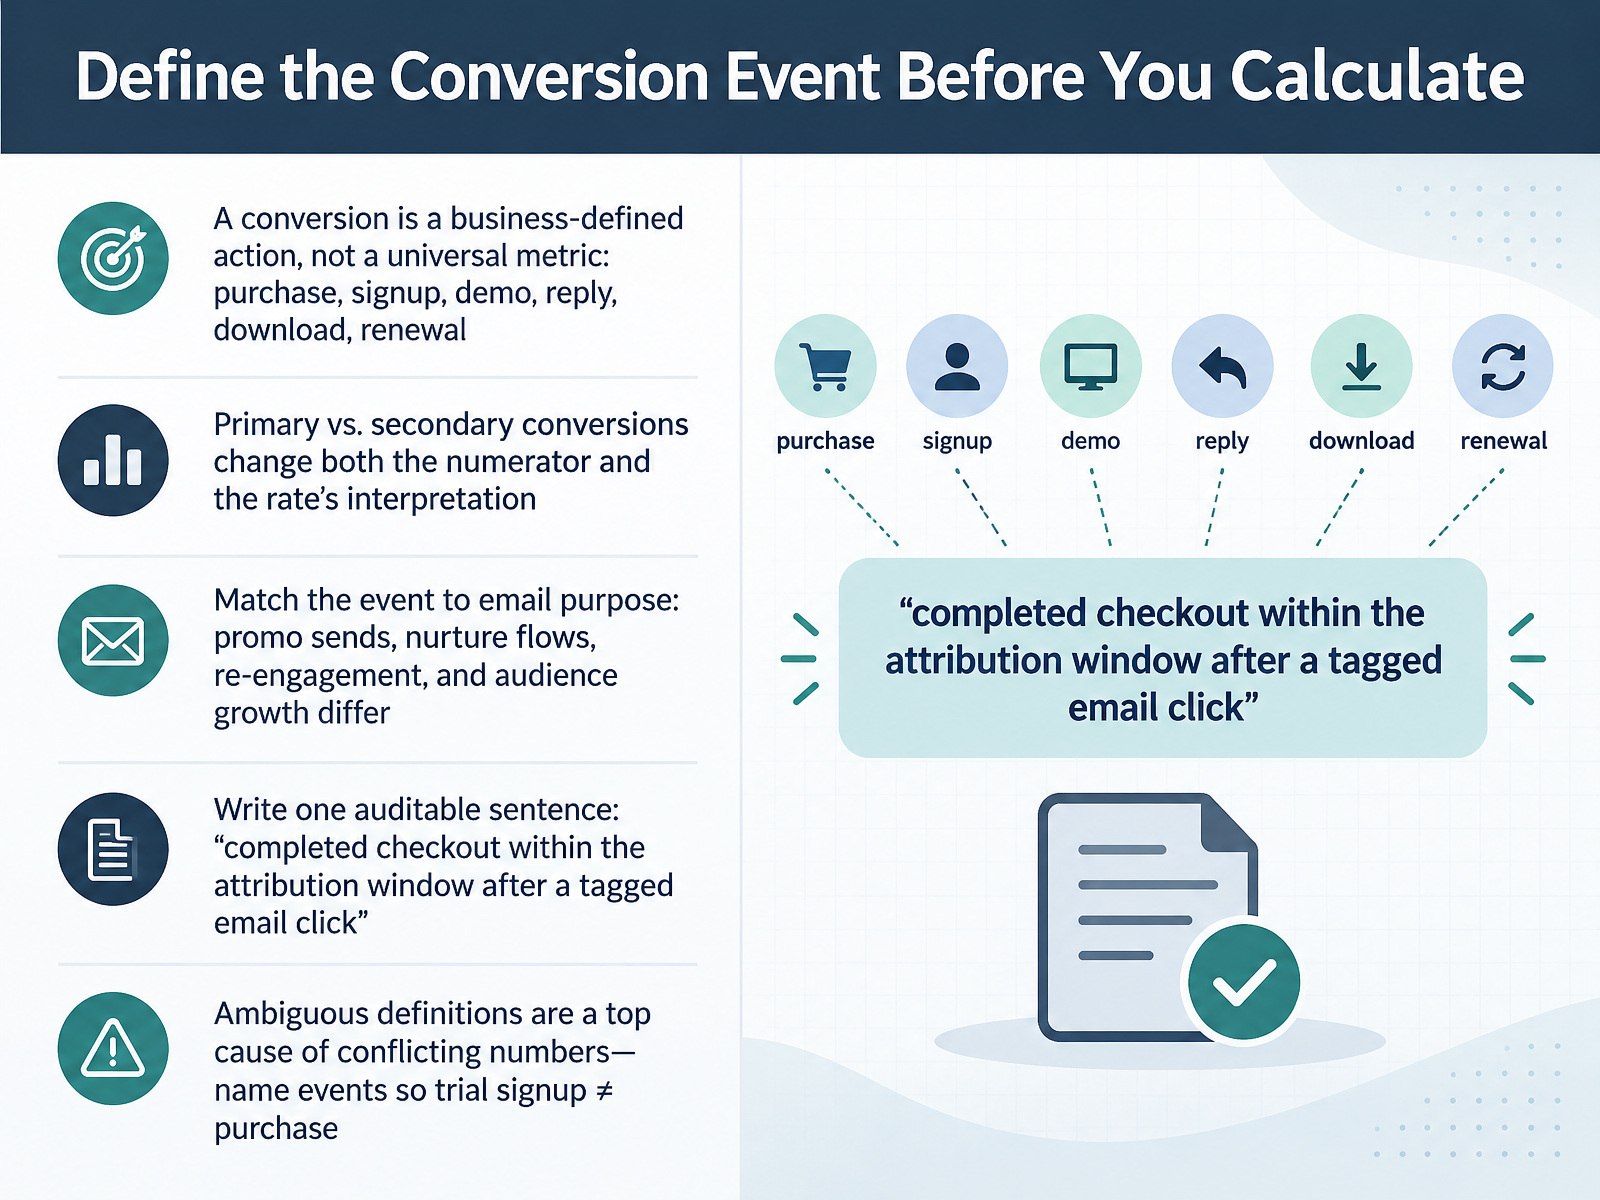
- 03Define the Conversion Event Before You CalculateLet's start with the step that comes before any math. Define the conversion event first. Here is the key idea. A conversion is a business-defined action, not a universal metric. It might be a purchase, a signup, a demo request, a reply, a download, or a renewal. Next, separate primary conversions from secondary ones. That choice changes both the numerator and how you read the final rate. Then match the event to the email's purpose. A promo send, a nurture flow, a re-engagement campaign, and a list growth push each aim at something different. Now write one auditable sentence. For example: completed checkout within the attribution window after a tagged email click. That sentence names the action, the window, and the trigger. Ambiguous definitions are a top cause of conflicting numbers. So name events clearly, and make sure a trial signup is never counted as a purchase. Take a moment to write your sentence down before you calculate anything. Next, we will choose the right denominator: delivered, clicked, sent, or opened.
 blog.hubspot.comhelp.shopify.comemailcloud.com+22 min
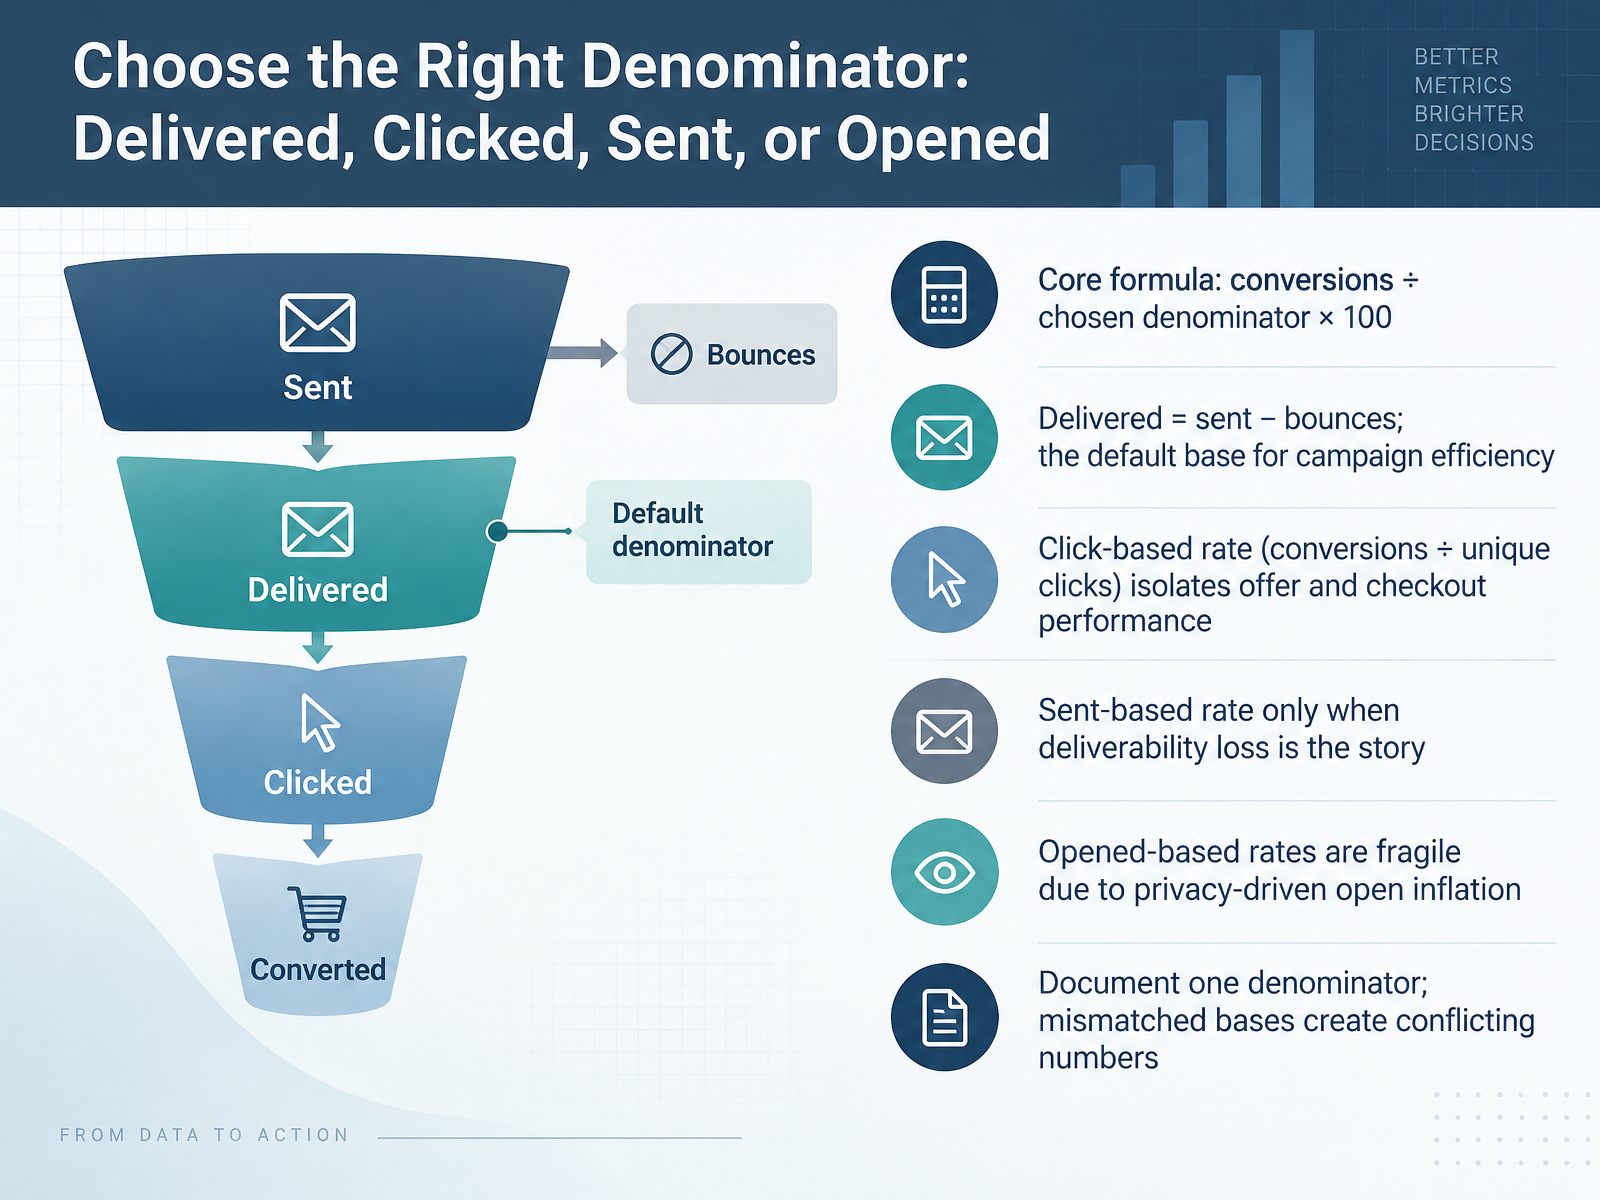
- 04Choose the Right Denominator: Delivered, Clicked, Sent, or OpenedNow let's settle the denominator, because that choice decides the number. The core formula is conversions divided by your chosen denominator, times one hundred. Delivered equals sent minus bounces, and it is your default base for campaign efficiency. Bounced emails never reached anyone, so including them understates your results. Click-based rate divides conversions by unique clicks. That isolates your offer and checkout performance. Use a sent-based rate only when deliverability loss is the story you are telling. Avoid opened-based rates, because privacy features inflate opens and make that base fragile. And here is the practical habit: document one denominator, and keep it consistent. Mismatched bases create conflicting numbers that derail team decisions. Next, we will set the measurement window and attribution rules.
 prospeo.ioclickminded.comattunemail.com+22 min
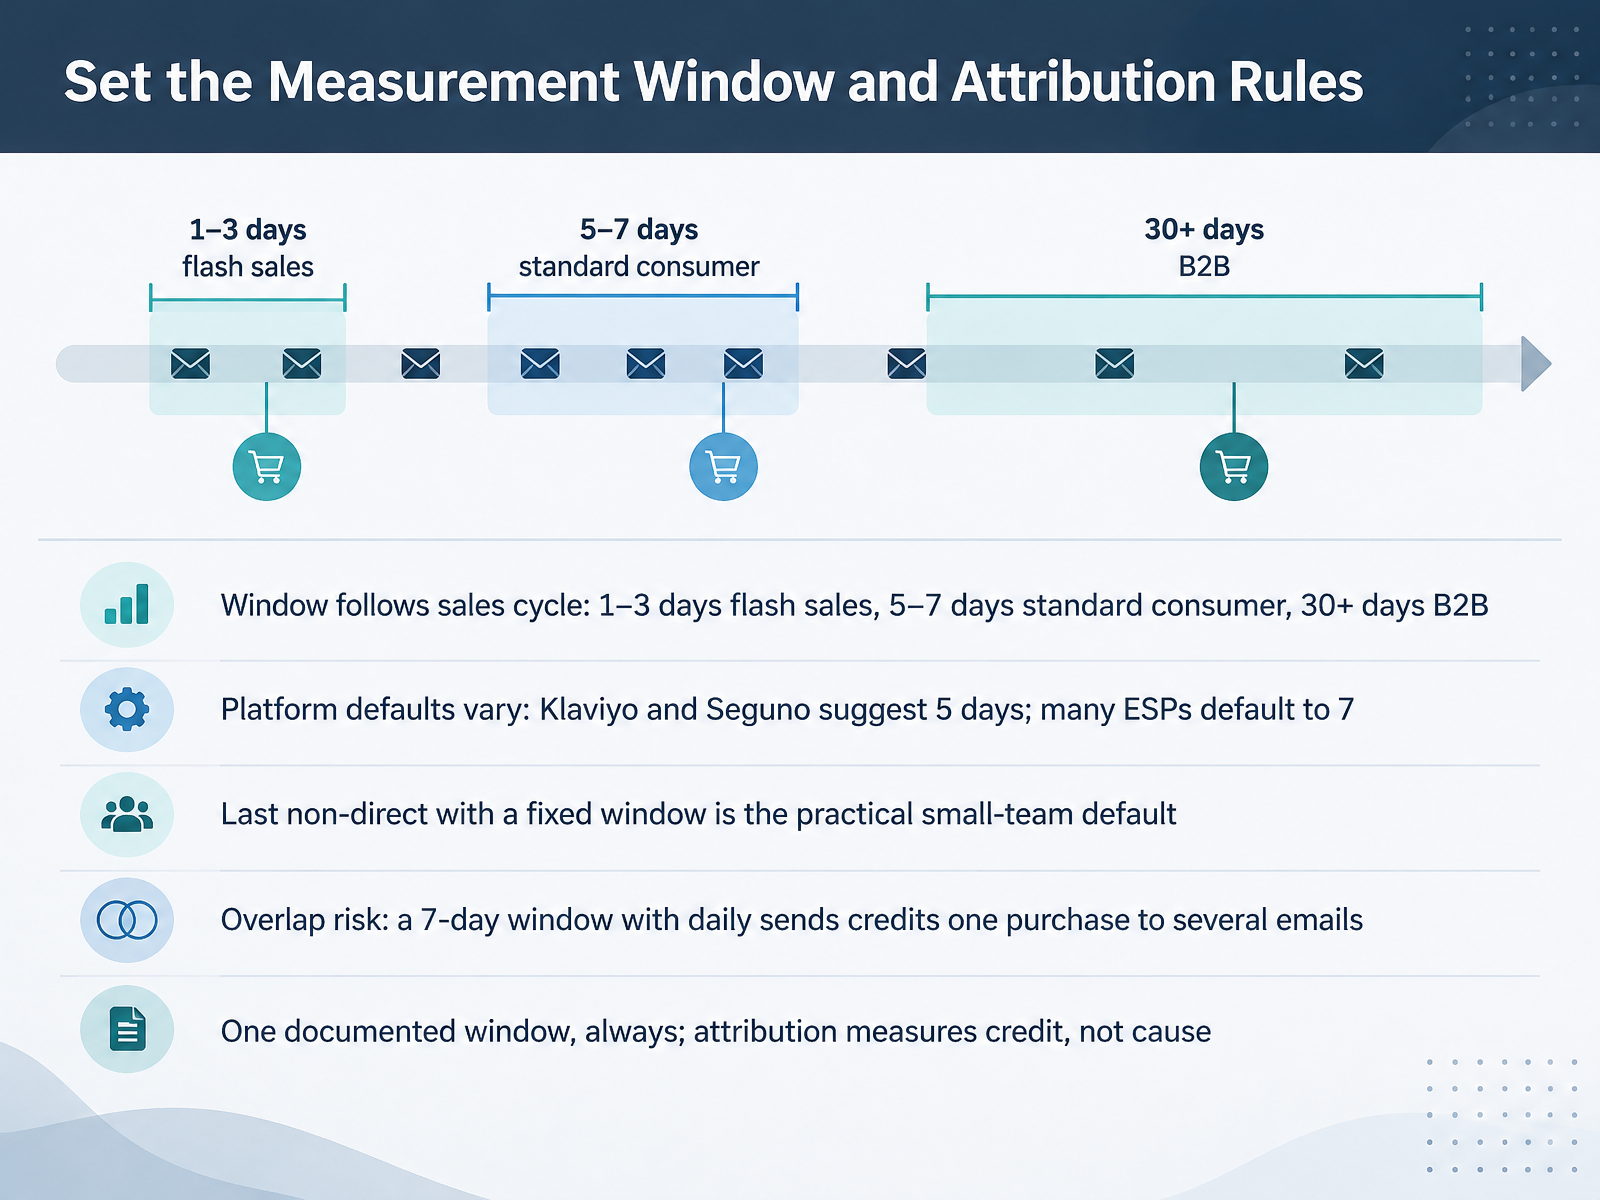
- 05Set the Measurement Window and Attribution RulesNext, let's set the measurement window and your attribution rules. The window should follow your sales cycle. Use one to three days for flash sales, five to seven days for standard consumer purchases, and thirty days or more for B2B. Platform defaults vary, so check yours. Klaviyo and Seguno suggest five days, and many email service providers default to seven. For most small teams, last non-direct attribution with a fixed window is the practical default. Watch the overlap risk. A seven-day window with daily sends can credit one purchase to several emails. Choose one documented window and always apply it. Attribution measures credit, not cause. Coming up next, Collect and Validate the Data.
 help.klaviyo.comklaviyo.comhelp.attentive.com+21 min
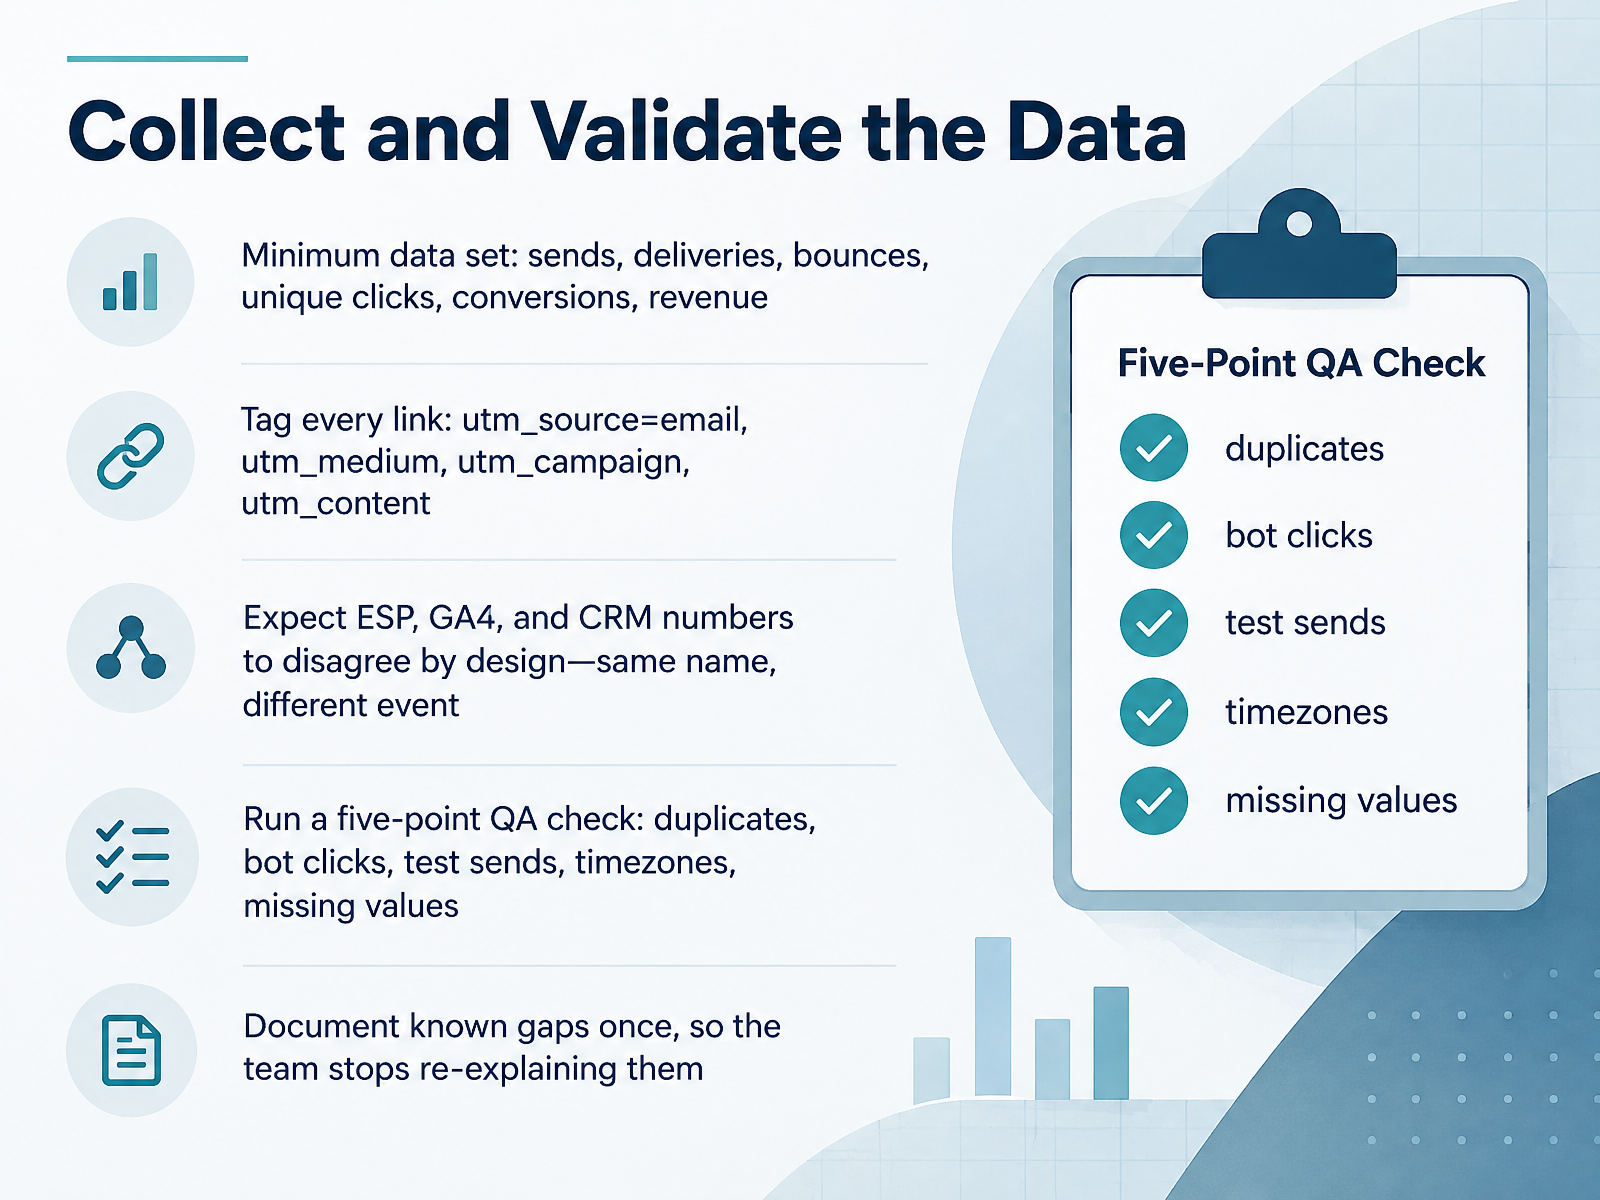
- 06Collect and Validate the DataNow let us collect and validate the data. Start with a minimum data set: sends, deliveries, bounces, unique clicks, conversions, and revenue. Unique clicks count people, not repeat taps, so they stay closer to your site analytics.
Next, tag every link. Use U T M source equals email, plus medium, campaign, and content. Without tags, clicks land as direct traffic and your email credit disappears.
Expect the E S P, G A four, and your C R M to disagree by design. They share metric names but count different events. An E S P counts a click the moment the redirect fires. G A four records a session only after the page loads and its script runs. Neither is wrong.
Then run a five point quality check: duplicates, bot clicks, test sends, timezones, and missing values. Write down known gaps once, so your team stops re-explaining them.
Next, we calculate the rate with a worked example.
 emailcalculator.comemailcalculator.comhelp.encharge.io+21 min
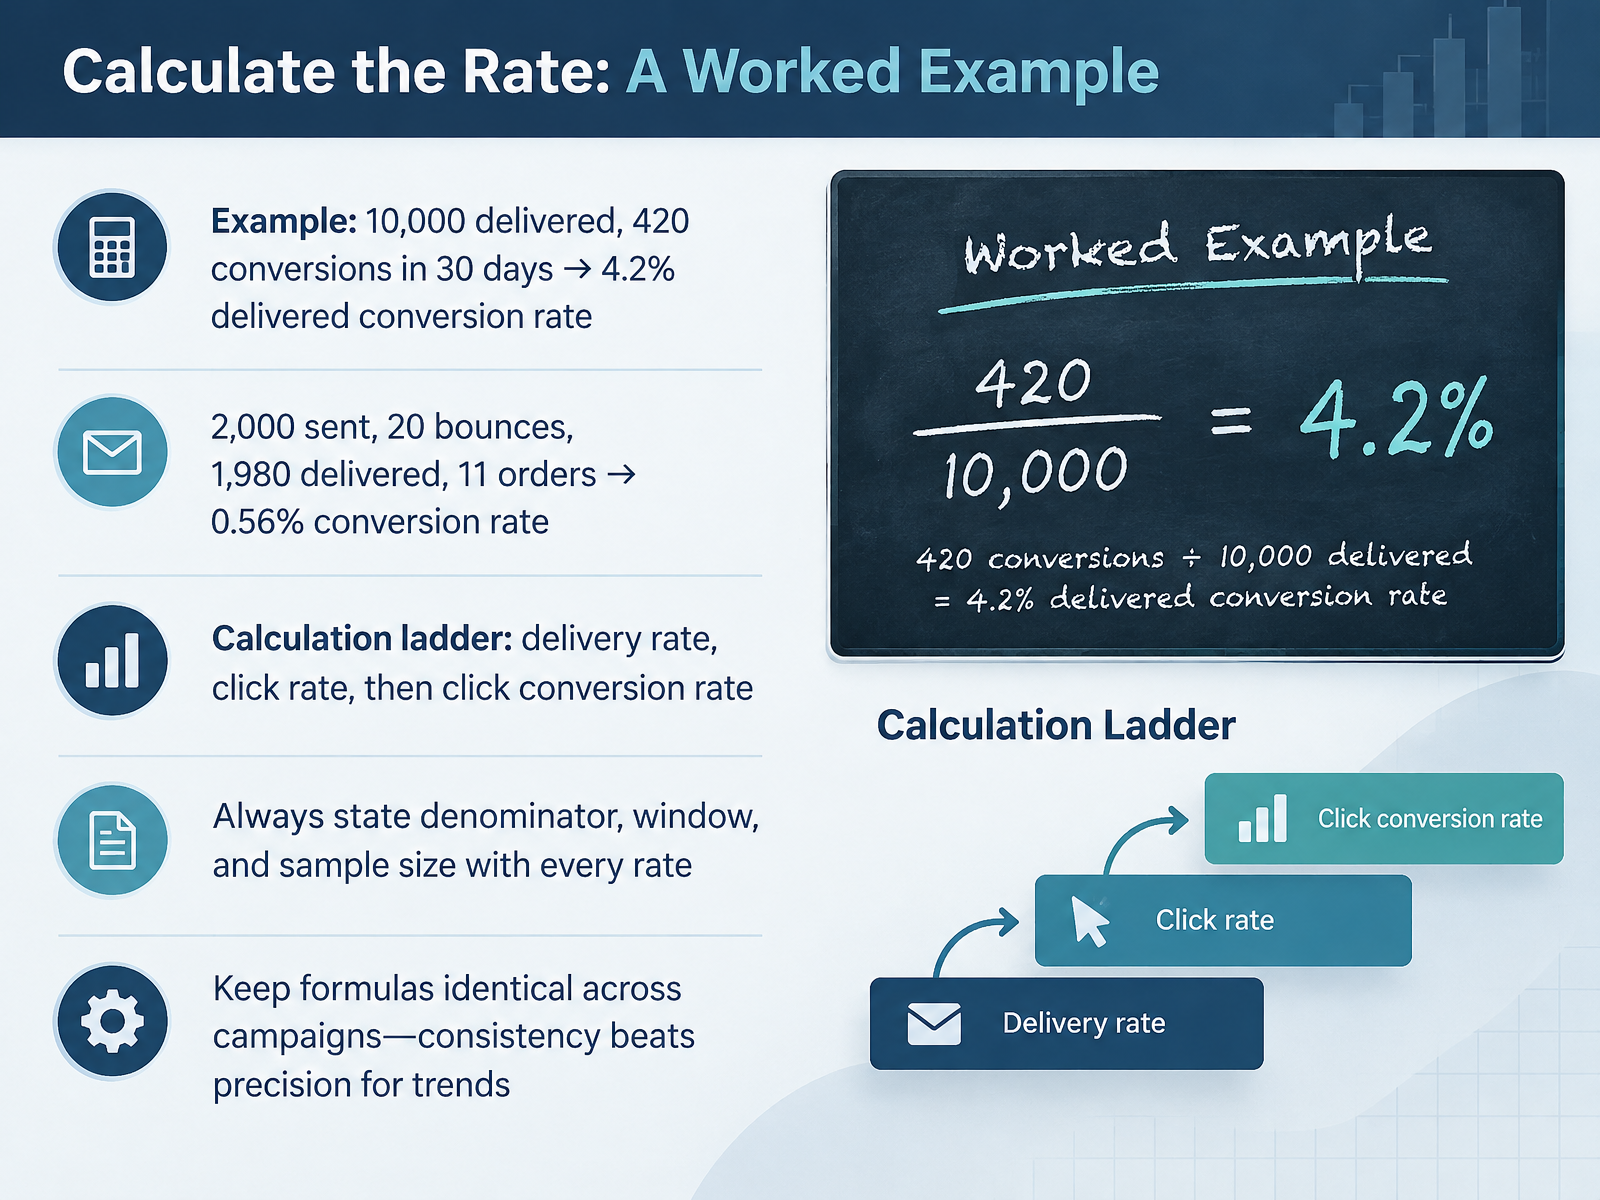
- 07Calculate the Rate: A Worked ExampleLet's put the formula to work with two quick examples. First, say ten thousand emails were delivered, and four hundred twenty conversions came in over thirty days. Four hundred twenty divided by ten thousand, times one hundred, gives four point two percent. That's your delivered conversion rate. Second, two thousand emails sent, twenty bounced, so one thousand nine hundred eighty delivered. Those produced eleven orders. Eleven divided by one thousand nine hundred eighty, times one hundred, is about zero point five six percent. Notice how different those two numbers are. Always walk the same ladder: delivery rate, then click rate, then click conversion rate. And with every rate, state three things: the denominator, the time window, and the sample size. Finally, keep your formulas identical across campaigns. For spotting trends, consistency matters more than decimal precision. Next, we segment the rate to find actionable differences.
 prospeo.ioclickminded.comattunemail.com+21 min
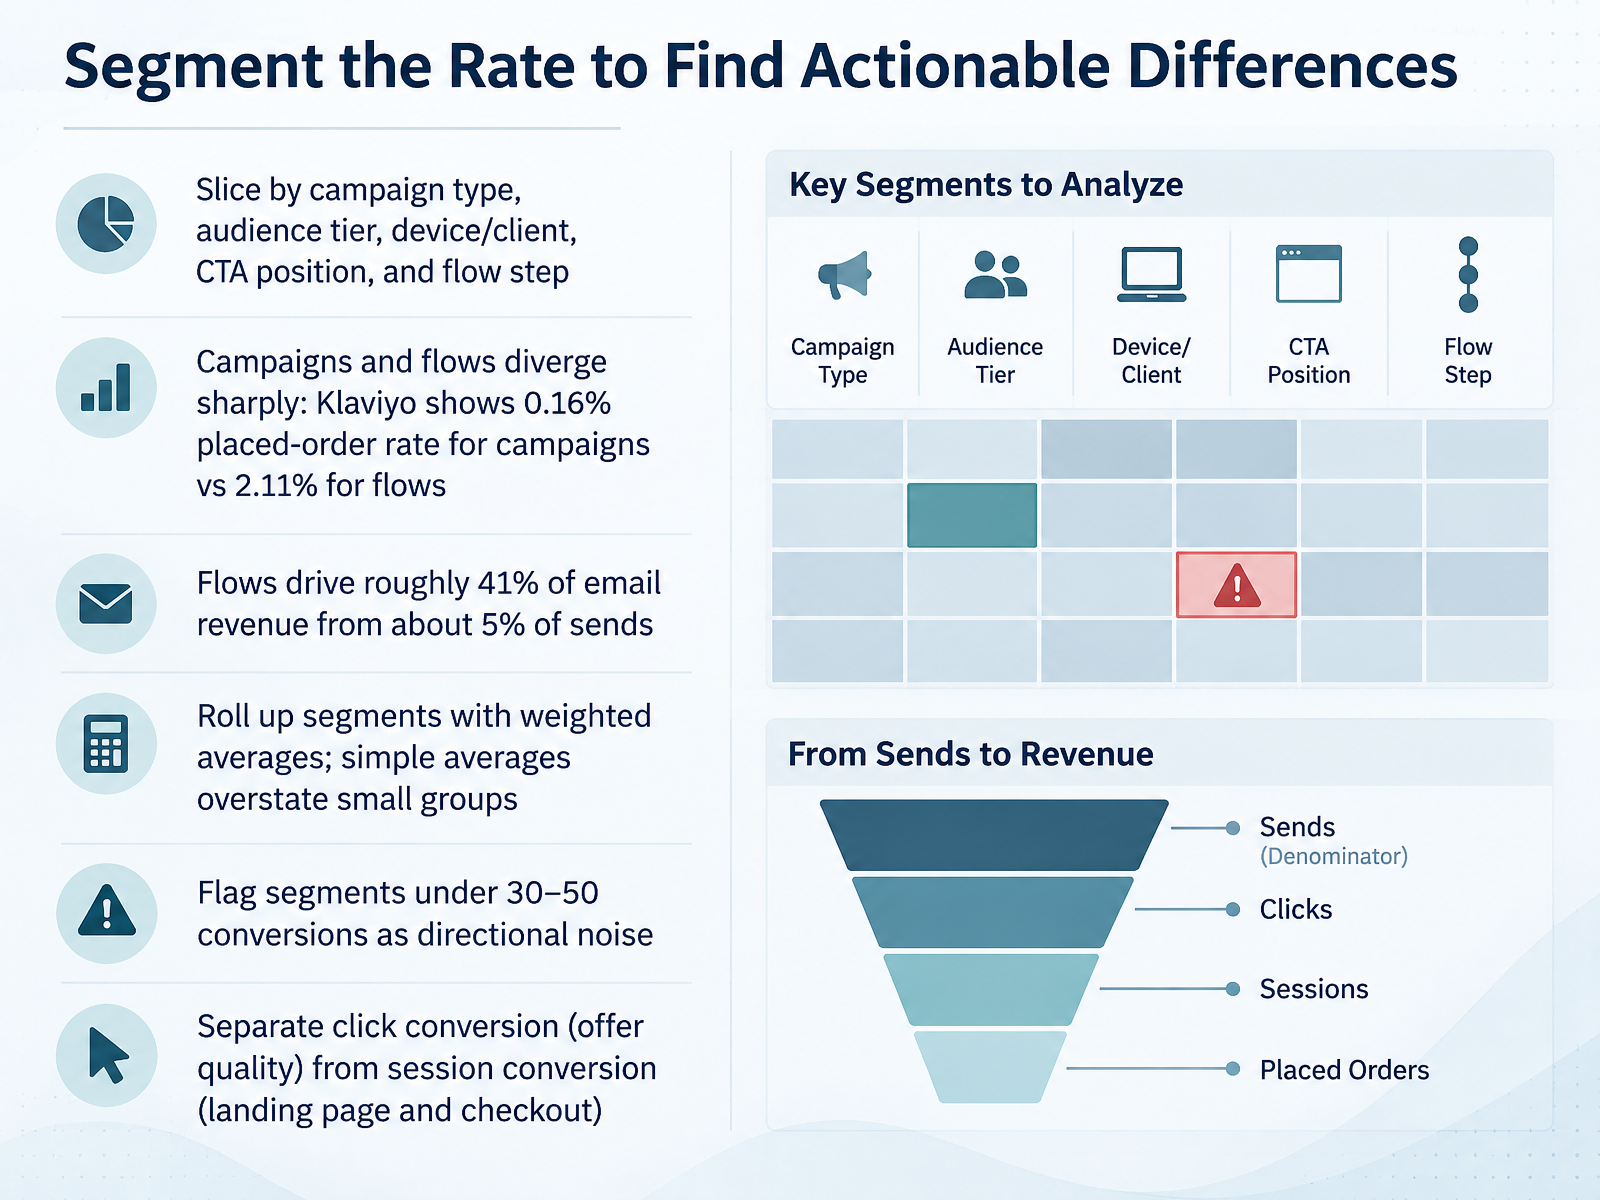
- 08Segment the Rate to Find Actionable DifferencesNow let's break that rate apart into segments. Slice your data by campaign type, audience tier, device or client, C T A position, and flow step. Segments matter because averages hide big differences. For example, Klaviyo shows a zero point one six percent placed-order rate for campaigns, versus two point one one percent for flows. Flows drive roughly forty-one percent of email revenue from about five percent of sends. So one blended number will mislead you. When you roll segments up, use weighted averages. Simple averages overstate small groups. And flag any segment under thirty to fifty conversions as directional noise, not a firm result. Finally, separate click conversion, which reflects offer quality, from session conversion, which reflects your landing page and checkout. The first tells you if the email persuaded; the second tells you if the site delivered. Next, Diagnose the Result: From Rate to Root Cause.
 klaviyo.com2 min
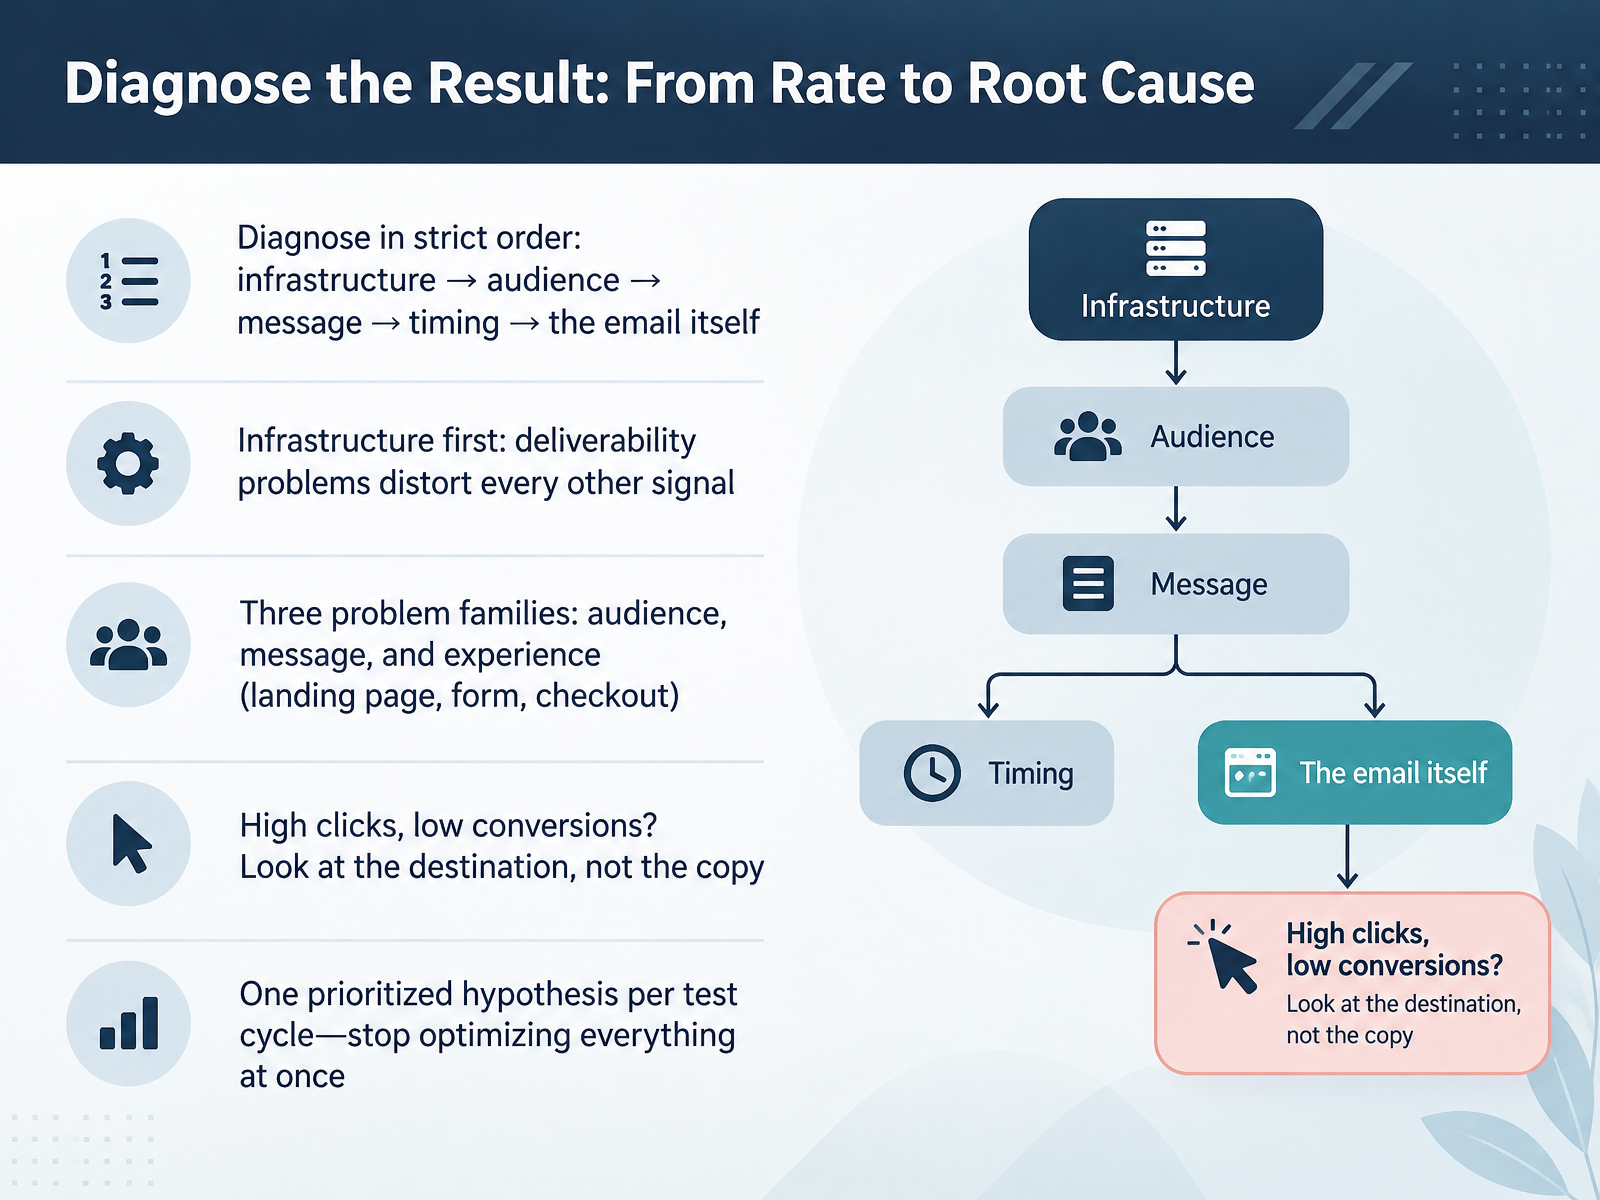
- 09Diagnose the Result: From Rate to Root CauseNow let's turn that rate into a root cause. Diagnose in a strict order: infrastructure, then audience, then message, then timing, then the email itself. Start with infrastructure, because a deliverability problem distorts every other signal. If mail is landing in spam, your open and click numbers are noise. Next, think in three problem families: audience, message, and experience, meaning the landing page, form, or checkout. A high click rate with low conversions usually points to the destination, not the copy. So check where people land before you rewrite anything. Finally, write one prioritized hypothesis per test cycle. Stop optimizing everything at once. That discipline is how small teams make real progress. Next, we'll look at how to benchmark responsibly and report results.
 blog.hubspot.comhelp.shopify.comemailcloud.com+22 min
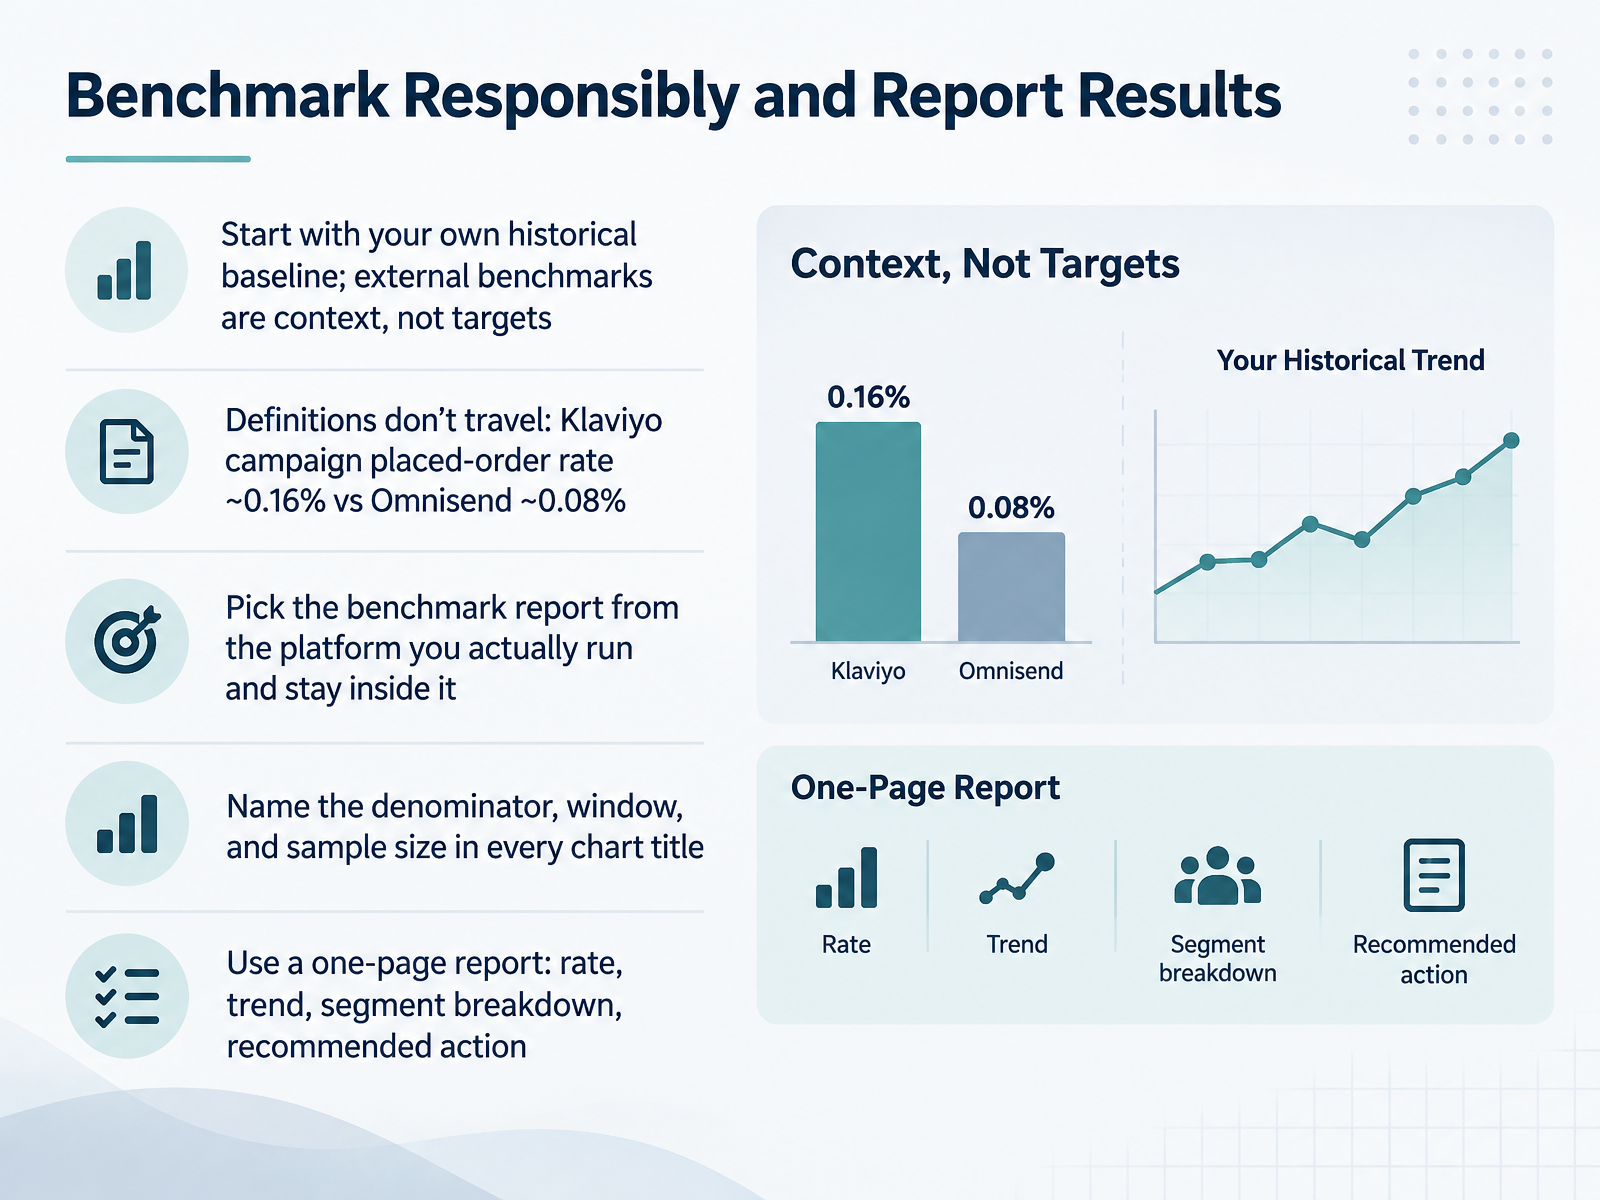
- 10Benchmark Responsibly and Report ResultsNow let's talk about benchmarking responsibly and reporting results. Start with your own historical baseline. External benchmarks are context, not targets. And remember, definitions don't travel between reports. Klaviyo's campaign placed-order rate is about zero point one six percent, while Omnisend reports about zero point zero eight percent. That gap is mostly definition, not performance. So pick the benchmark report from the platform you actually run, and stay inside it. Next, name the denominator, the window, and the sample size in every chart title. For example, write purchase rate from delivered emails, seven-day window, one thousand two hundred recipients. Then keep your report to one page: the rate, the trend, a segment breakdown, and one recommended action. That gives your team clarity in under a minute, even with a small list. Next, we'll build a repeatable reporting workflow and template.
 klaviyo.comprospeo.ioclickminded.com+22 min
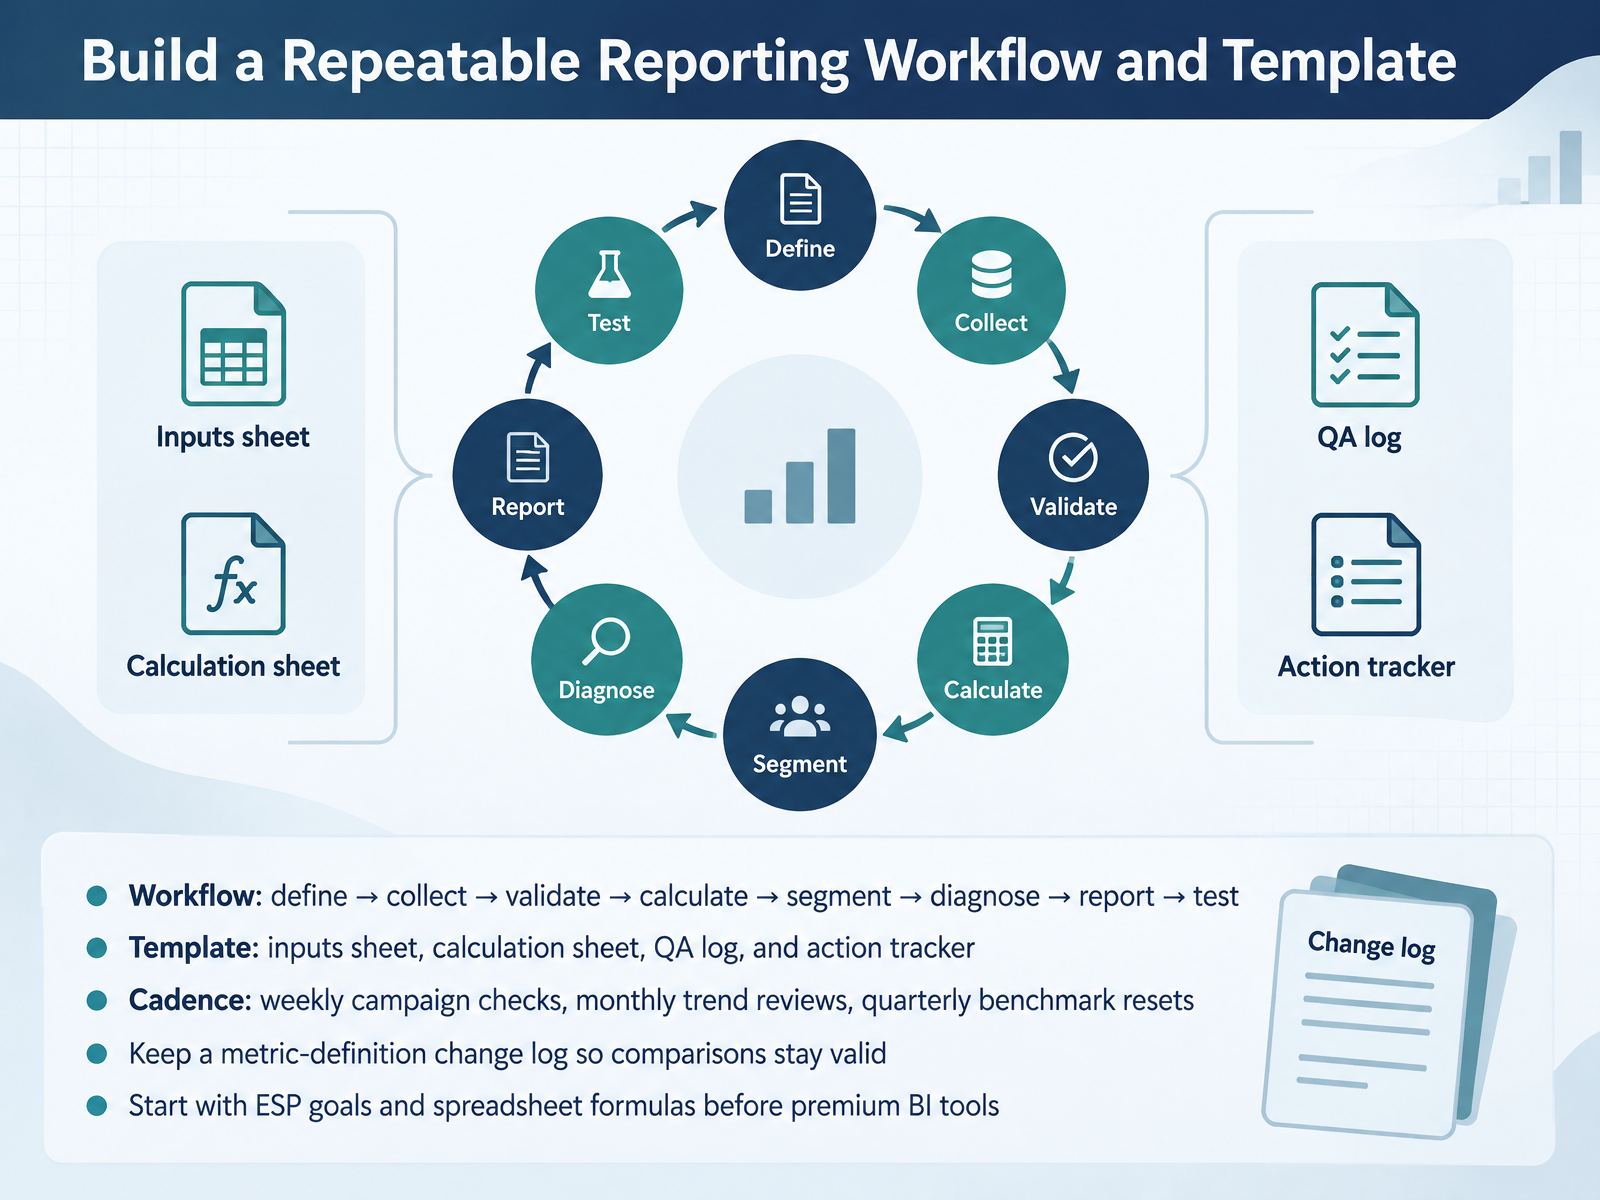
- 11Build a Repeatable Reporting Workflow and TemplateNext, let's turn all of this into a repeatable reporting workflow. The cycle runs in eight steps: define, collect, validate, calculate, segment, diagnose, report, and test. Each step has one job, so nothing gets skipped when time is tight. Build a simple template with four tabs: an inputs sheet, a calculation sheet, a QA log, and an action tracker. Then set a cadence. Weekly campaign checks, monthly trend reviews, and quarterly benchmark resets. Keep a change log for metric definitions, so comparisons stay valid when formulas change. And start with your email service provider's goals and spreadsheet formulas before buying premium business intelligence tools. Small lists can run this cycle in under an hour a week. Next, we'll look at common pitfalls and how to avoid them.
 blog.hubspot.comhelp.shopify.comemailcloud.com+21 min
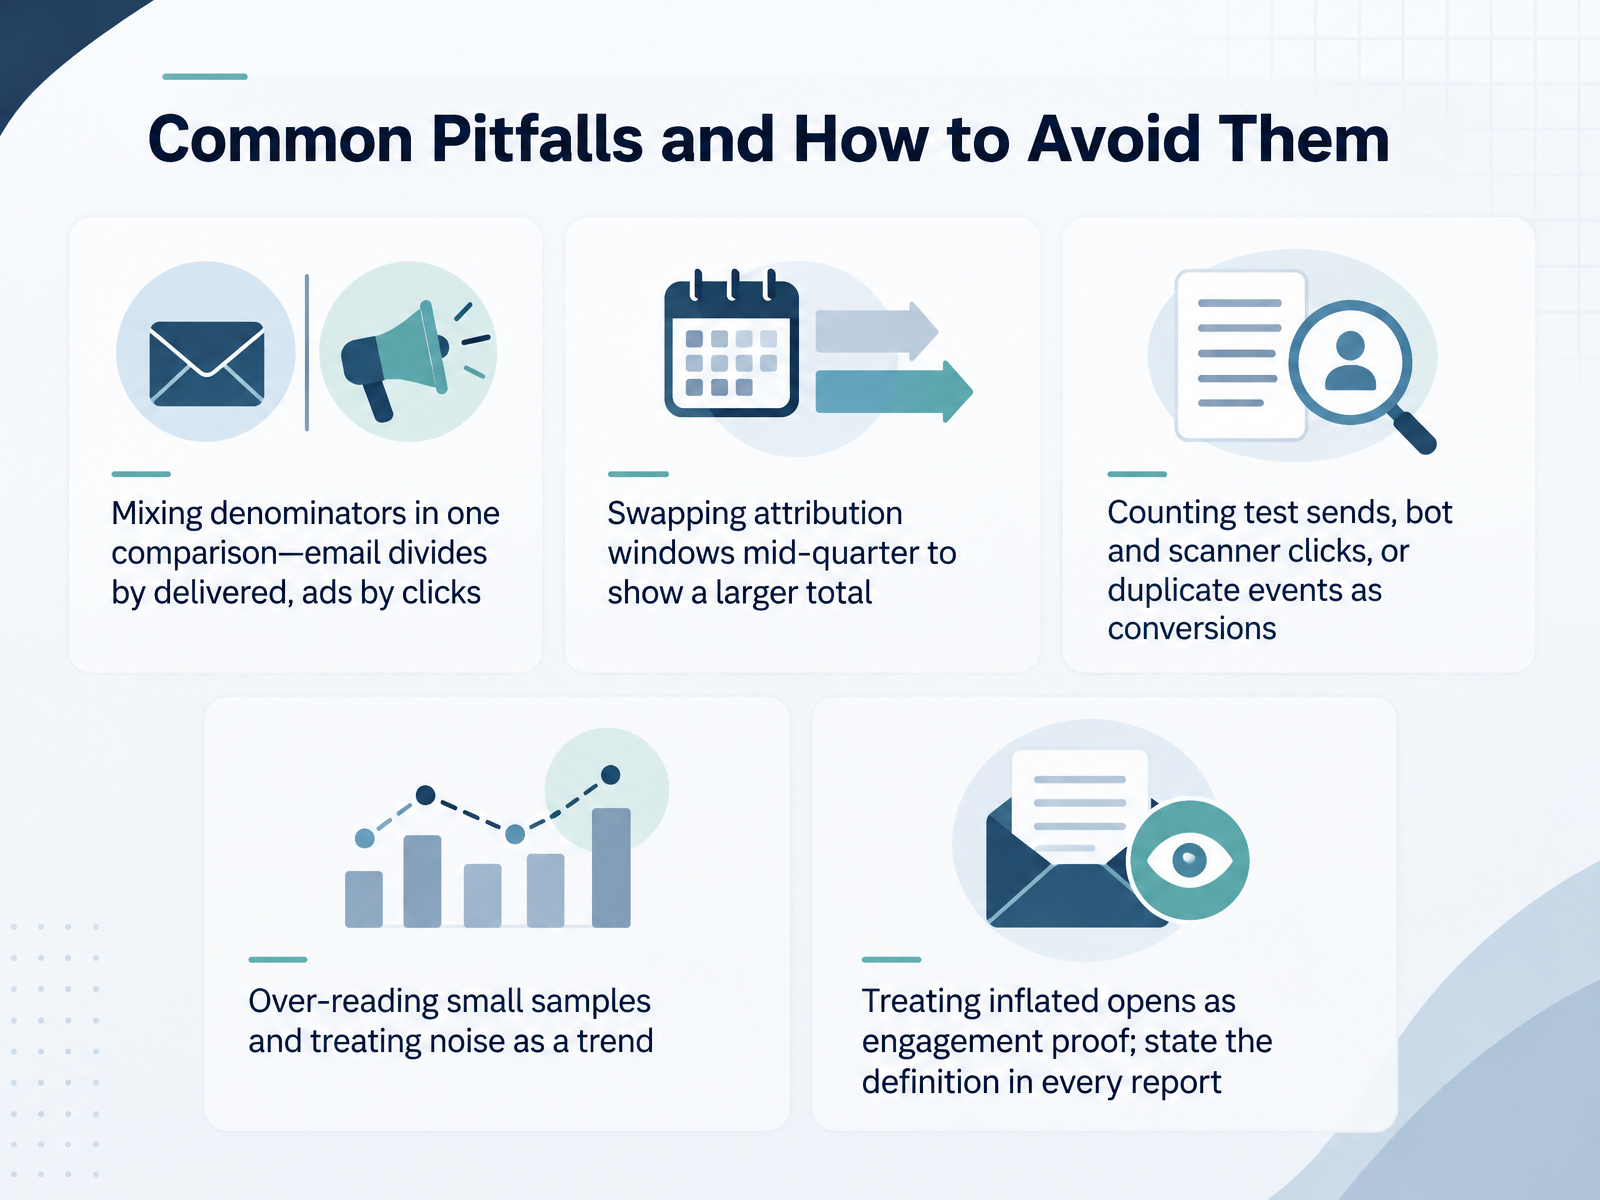
- 12Common Pitfalls and How to Avoid ThemNow let's look at the mistakes that quietly break conversion numbers. First, never mix denominators in one comparison. Email divides conversions by delivered emails. Ads divide by clicks. Without a normalized definition, those rates are not comparable. Second, don't swap attribution windows mid-quarter to show a larger total. Pick one window, document it, and keep it. Third, exclude test sends, bot and scanner clicks, and duplicate events. They are not conversions, and they inflate your results. Fourth, be careful with small samples. A few conversions on a small list is noise, not a trend. Report counts alongside percentages. And finally, don't treat inflated opens as engagement proof. State your definition in every report, for example, purchase conversion rate from delivered emails. Small teams have limited time, so keep your own definitions written down and repeatable. Next, we put this into practice with a hands-on exercise: calculate, diagnose, recommend.
 prospeo.ioclickminded.comattunemail.com+22 min
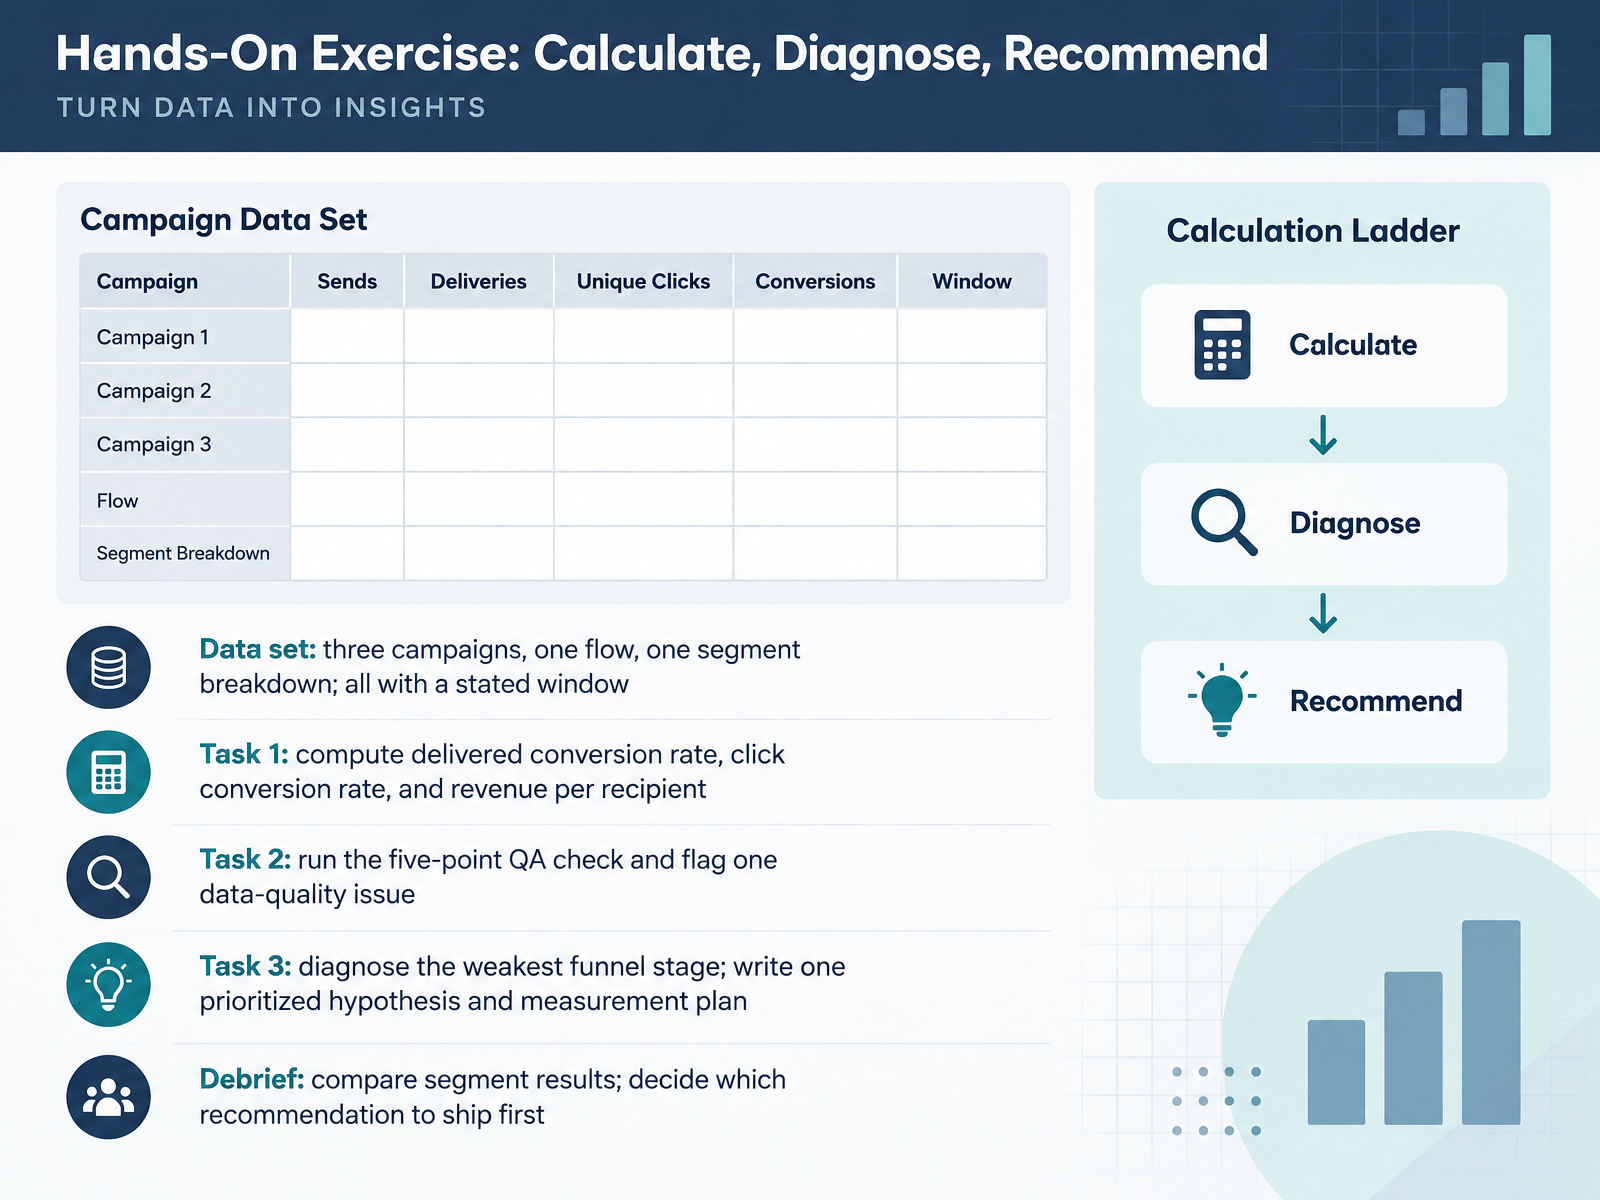
- 13Hands-On Exercise: Calculate, Diagnose, RecommendNow let's put the workflow into practice. Your data set has three campaigns, one flow, and one segment breakdown, and each one has a stated attribution window. For Task one, compute three numbers: delivered conversion rate, that's conversions divided by delivered; click conversion rate, conversions divided by unique clicks; and revenue per recipient, attributed revenue divided by delivered. Label each denominator in your notes. For Task two, run the five-point QA check and flag one data-quality issue, such as a mismatch between your email platform and your web analytics. For Task three, find the weakest funnel stage, then write one prioritized hypothesis with the metric you'll measure and the window you'll use. In the debrief, compare segment results, and decide which recommendation to ship first. Next, we'll close with Next Steps: Put the Workflow Into Practice.
 prospeo.ioclickminded.comattunemail.com+22 min
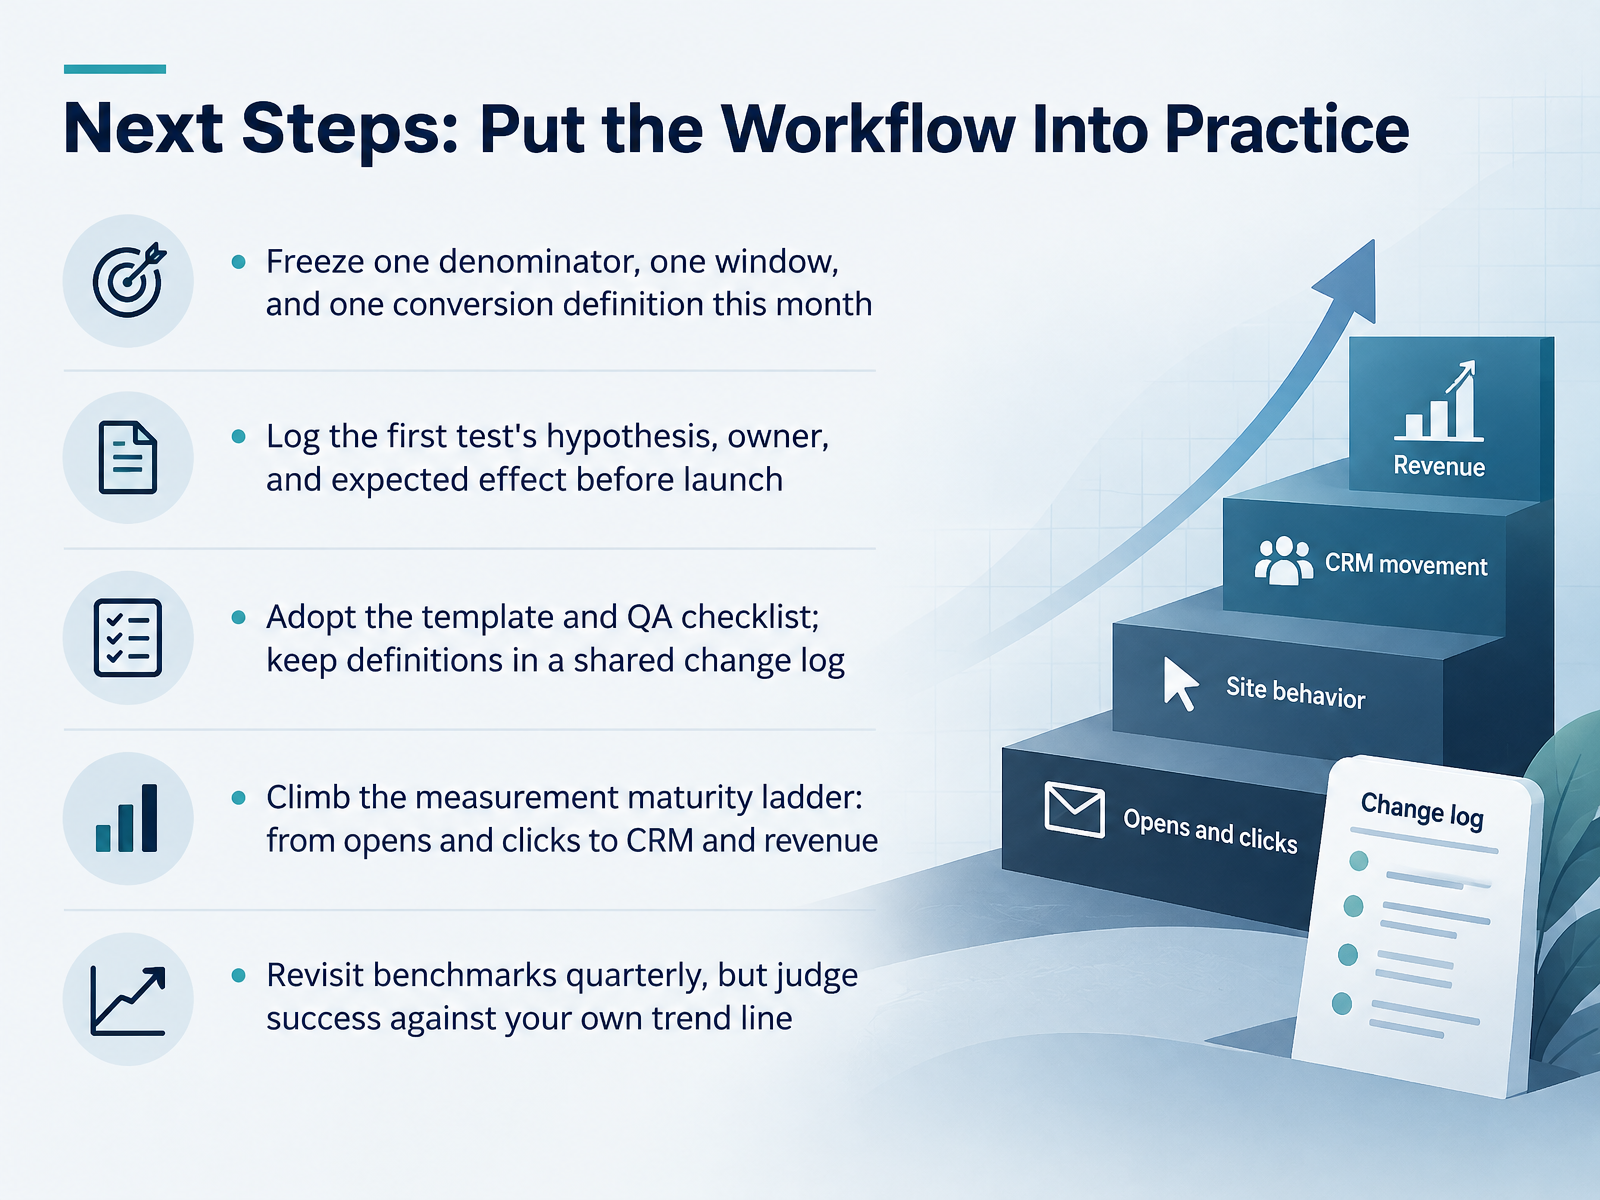
- 14Next Steps: Put the Workflow Into PracticeLet's close by turning the workflow into a habit you can actually keep. First, this month, freeze one denominator, one attribution window, and one conversion definition. That gives you a stable baseline. Second, before you launch your first test, log the hypothesis, the owner, and the expected effect. It keeps the test honest. Third, adopt the template and the quality checklist, and keep all definitions in a shared change log, so the whole team reads the same numbers. Fourth, climb the maturity ladder. Start with opens and clicks, then connect to site behavior, CRM, and revenue. Finally, revisit external benchmarks quarterly, but judge success against your own trend line. Your lists are small, your time is limited, and that is exactly why consistency beats complexity. Thank you for following along. Pick one definition to freeze this week, and let the numbers earn your trust. You've got this.
 blog.hubspot.comhelp.shopify.comemailcloud.com+22 min
Take the deck with you
Download this course as a file — free, no sign-up needed.
- PDF handoutEvery slide page, ready to print or share.15 pages · 3.2 MBDownload
- Narrated PowerPointThe deck that presents itself — every slide carries the digital human's narration video.15 pages · 12.7 MBDownload
- PowerPoint slidesThe full deck as a .pptx — open it in PowerPoint, Keynote, or Google Slides.15 pages · 3.1 MBDownload
Free to use in your own training — please keep the PersonWise credit page at the end.
Have your own deck? Turn it into a course
Sources consulted
Web sources consulted while building this course.
- Email marketing reporting: Our top best practices and tool recommendations for 2026 — blog.hubspot.com
- Shopify Help Center | Shopify Messaging email analytics — help.shopify.com
- Email Marketing Analytics Guide | EmailCloud | EmailCloud — emailcloud.com
- Track Conversions From Email To Purchase: Complete Guide — cometly.com
- Email Conversion Tracking: Methods and Tools | Mailflow Authority — mailflowauthority.com
- Email Conversion Rate Formula: How to Calculate in 2026 — prospeo.io
- Email Marketing Conversion Rate: Benchmarks and Formula — clickminded.com
- Email Campaign Outcome & ROI Calculator | Free Tool — attunemail.com
- Email Conversion Rates: Benchmarks and How to Improve Them — monday.com
- How To Improve Your Email Conversion Rate - Shopify — shopify.com
- Understanding Klaviyo message attribution | Klaviyo Help Center — help.klaviyo.com
- Attribution Best Practices: Measure Marketing Impact Accurately - Klaviyo — klaviyo.com
- Configure your attribution settings – Attentive — help.attentive.com
- Understanding email conversion tracking in Seguno Email Marketing | Seguno Email Marketing Support Center — support.seguno.com
- Email attribution windows: what your revenue report means | Sendvio — sendvio.com
- Why Your Email Metrics Don't Match Your ESP Dashboard (And How to Fix It) | Email Calculator Blog — emailcalculator.com
- Why Email Reports Never Match Google Analytics | Email Calculator Blog — emailcalculator.com
- Discrepancies between email clicks and data in Google Analytics | Encharge Help Center — help.encharge.io
- Email Revenue Attribution: Why Your ESP, GA4, and Attribution Tool Disagree | Bloomreach — bloomreach.com
- 2026 Email Marketing Benchmarks by Industry - Klaviyo — klaviyo.com