Begin
14 pages · ~28 min
Understanding Standard Deviation in Statistics
Learn what standard deviation measures, why it matters, and how to interpret it through clear examples. Ideal for students and professionals new to statistics.
A digital instructor presents all 14 pages. Hold “Ask” at any point and ask out loud — the answer comes from this course. No sign-up needed.
What you’ll learn
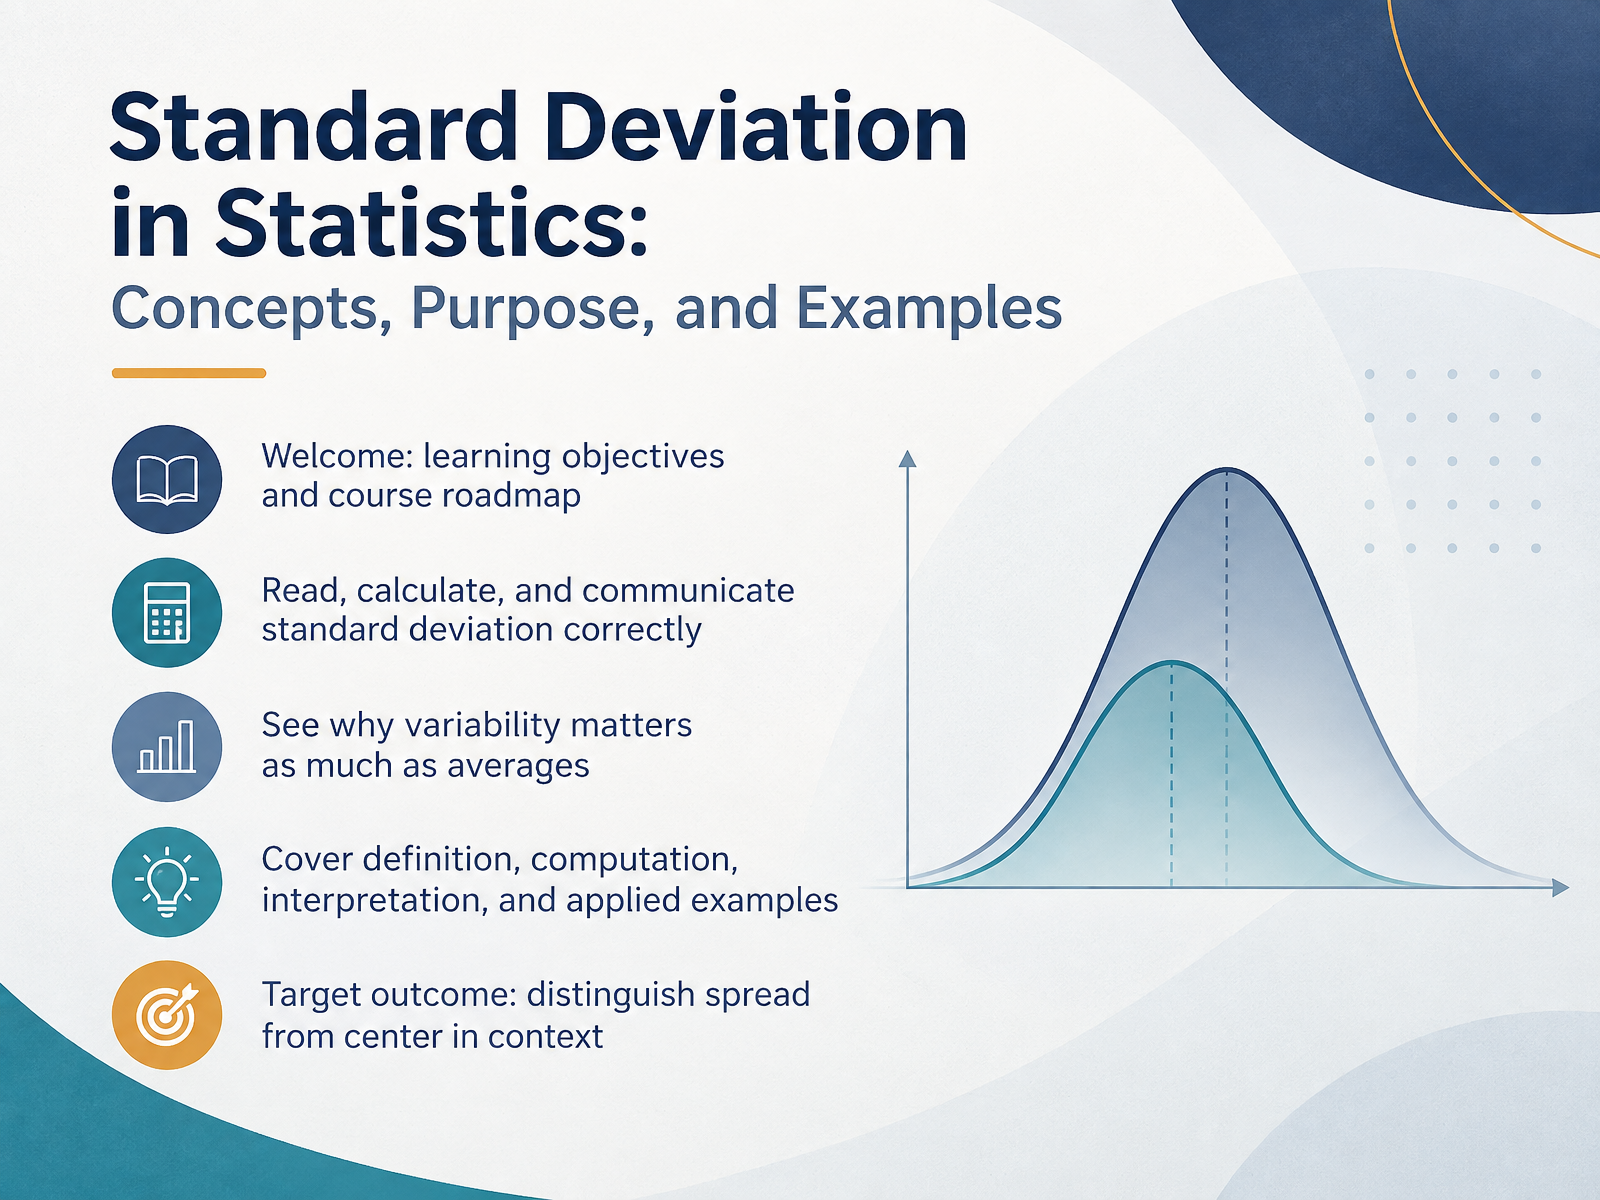
- 01Standard Deviation in Statistics: Concepts, Purpose, and ExamplesWelcome. I am glad you are here. In this course, we will examine standard deviation, one of the most useful ideas in statistics. Standard deviation is a number that describes how spread out a set of values is around its average. The goal is practical. By the end, you should be able to read standard deviation, calculate it correctly, and explain what it means in context. We will begin with the core definition. Then we will walk through the computation step by step, using one concrete example. From there, we will interpret results and look at applied cases in business, research, and education. One reminder as we start. The average tells you about the center of your data. The standard deviation tells you how much the data varies around that center. Two groups can share the same average and behave very differently. Our target outcome is simple. You will learn to distinguish spread from center, and to communicate both clearly. We will also note a common point of confusion. A larger standard deviation does not mean the data are wrong. It means the values are more dispersed. With that foundation, let us turn to why variability matters more than the average alone.2 min
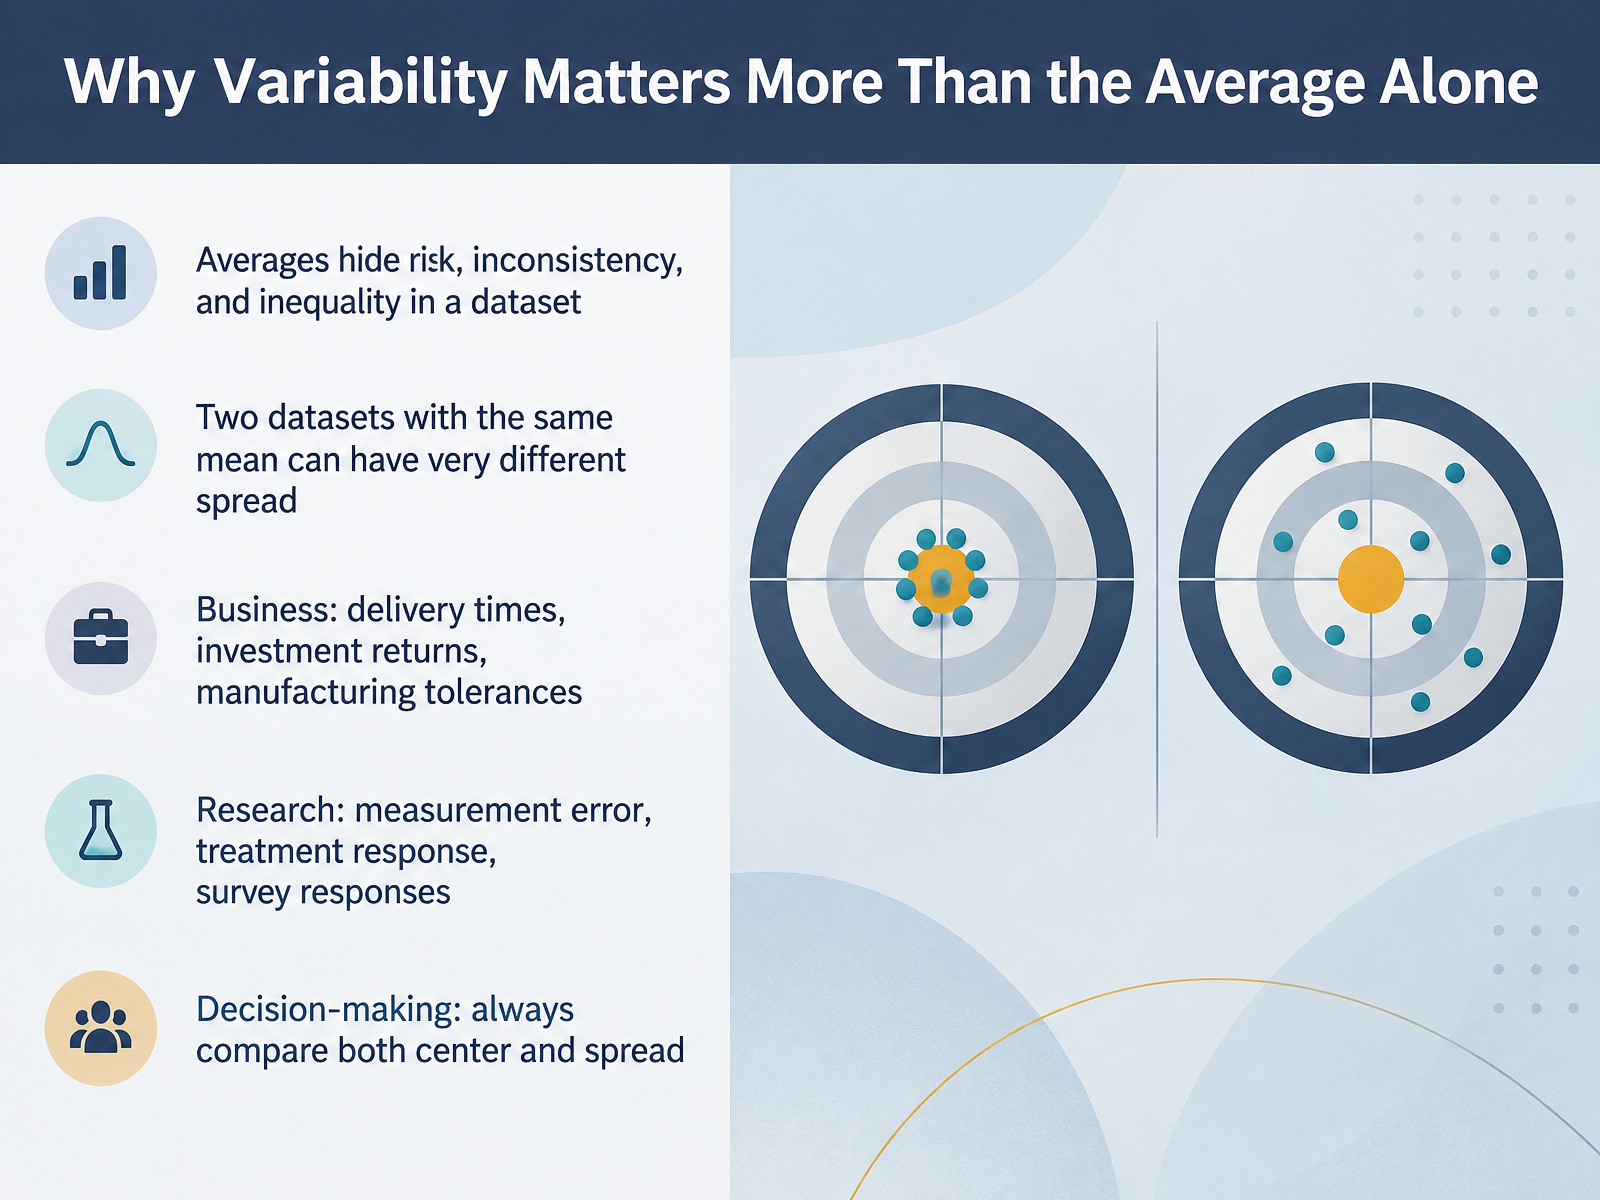
- 02Why Variability Matters More Than the Average AloneLet us turn to why variability matters more than the average alone. An average gives you one number, and that number can be useful, but it hides a great deal. It hides risk, inconsistency, and inequality within a dataset. Two datasets can share the exact same mean and still behave in completely different ways. One may be tightly clustered, while the other is spread widely. The mean alone cannot tell them apart.
Consider a simple business example. Two delivery services both average three days. In one, every package arrives in three days. In the other, some arrive in one day and others in a week. Same average, very different experience. This pattern appears across investment returns, manufacturing tolerances, measurement error, treatment response, and survey results.
So when you make decisions, compare both center and spread. The average tells you where the middle sits. The spread tells you how much you can rely on it. That is why standard deviation matters, and that leads us to the core concepts of center, spread, and deviation.
 2 min
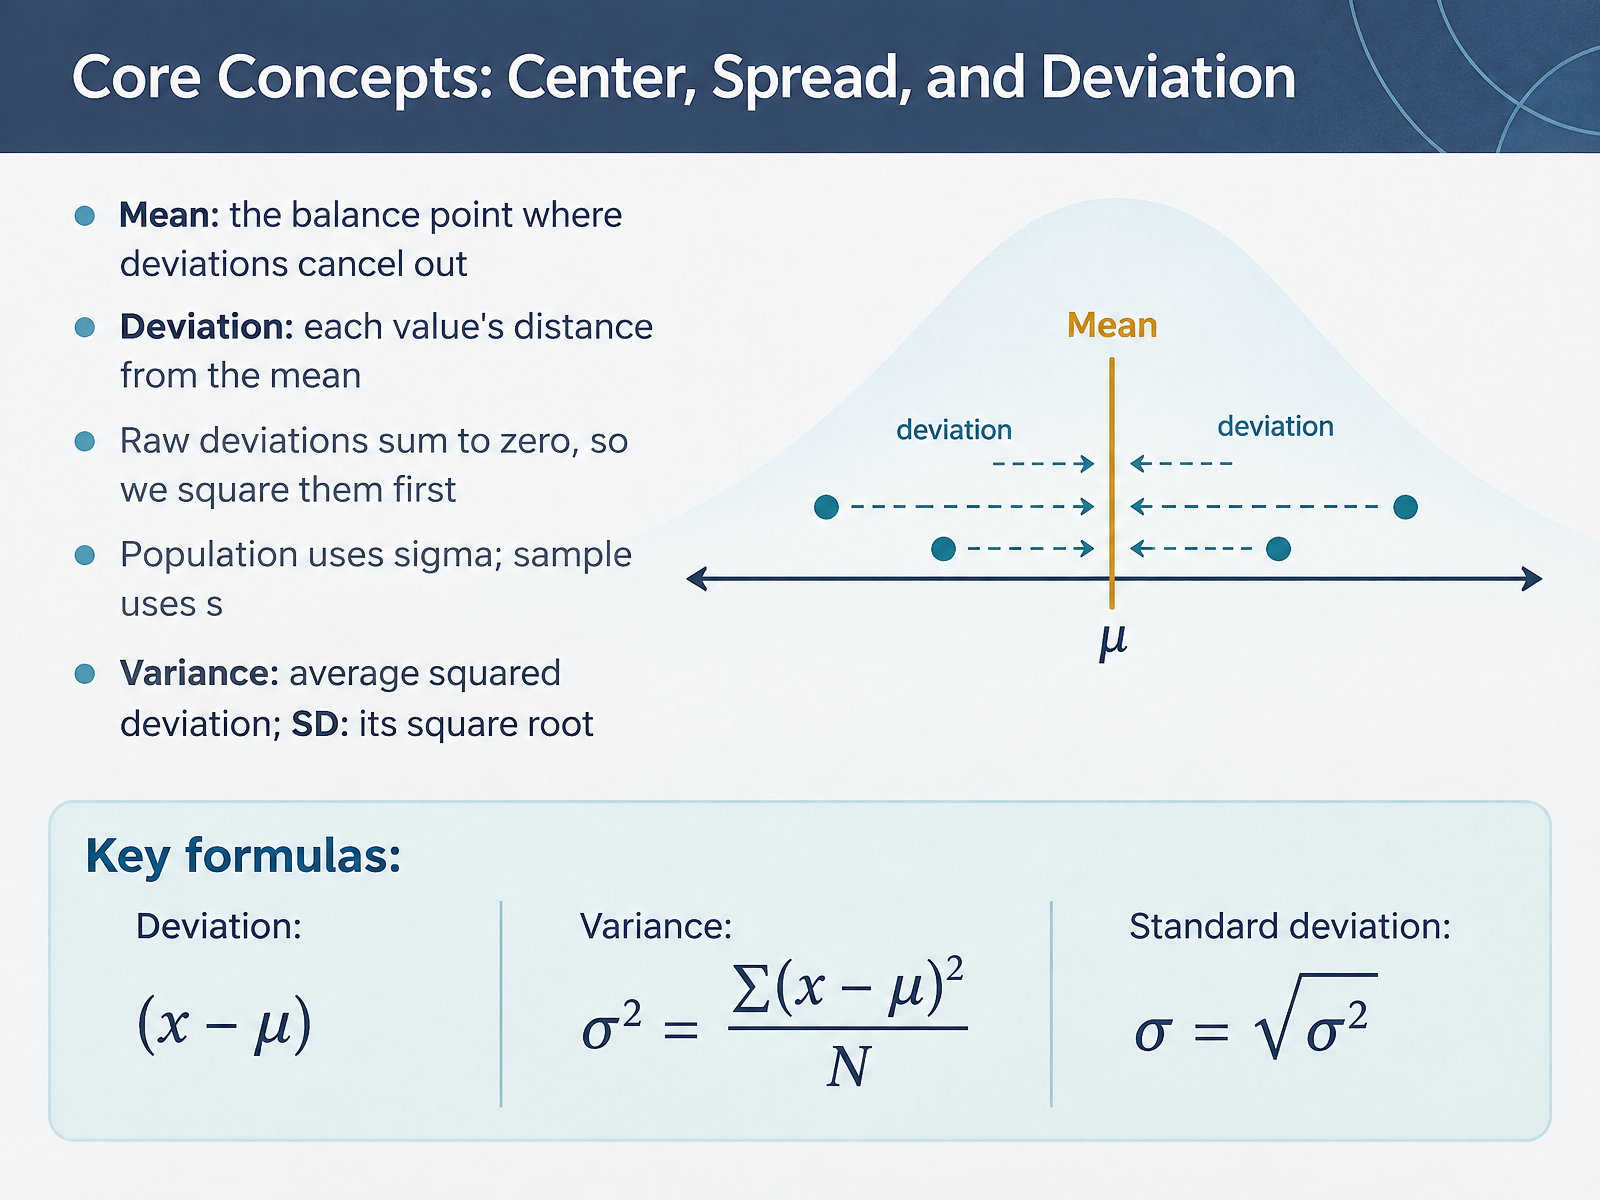
2 min - 03Core Concepts: Center, Spread, and DeviationLet's break down the core concepts. Start with the mean. The mean is the balance point of a dataset, the single value where the deviations cancel out. A deviation is simply each value's distance from the mean, written as x minus mu for a population. Here is a common point of confusion. If you add up all the raw deviations, the positives and negatives cancel, and the sum is always zero. That tells you nothing about spread. So we square each deviation first, which removes the signs, and then we average those squared values. That average is the variance. The standard deviation is the square root of the variance, which returns the measure to the original units. One note on notation. A population uses sigma, while a sample uses s. So the population standard deviation is sigma, and sigma squared is the variance. In short, the mean marks the center, and the standard deviation describes the typical distance from it. Next, we will walk through calculating standard deviation step by step.
 2 min
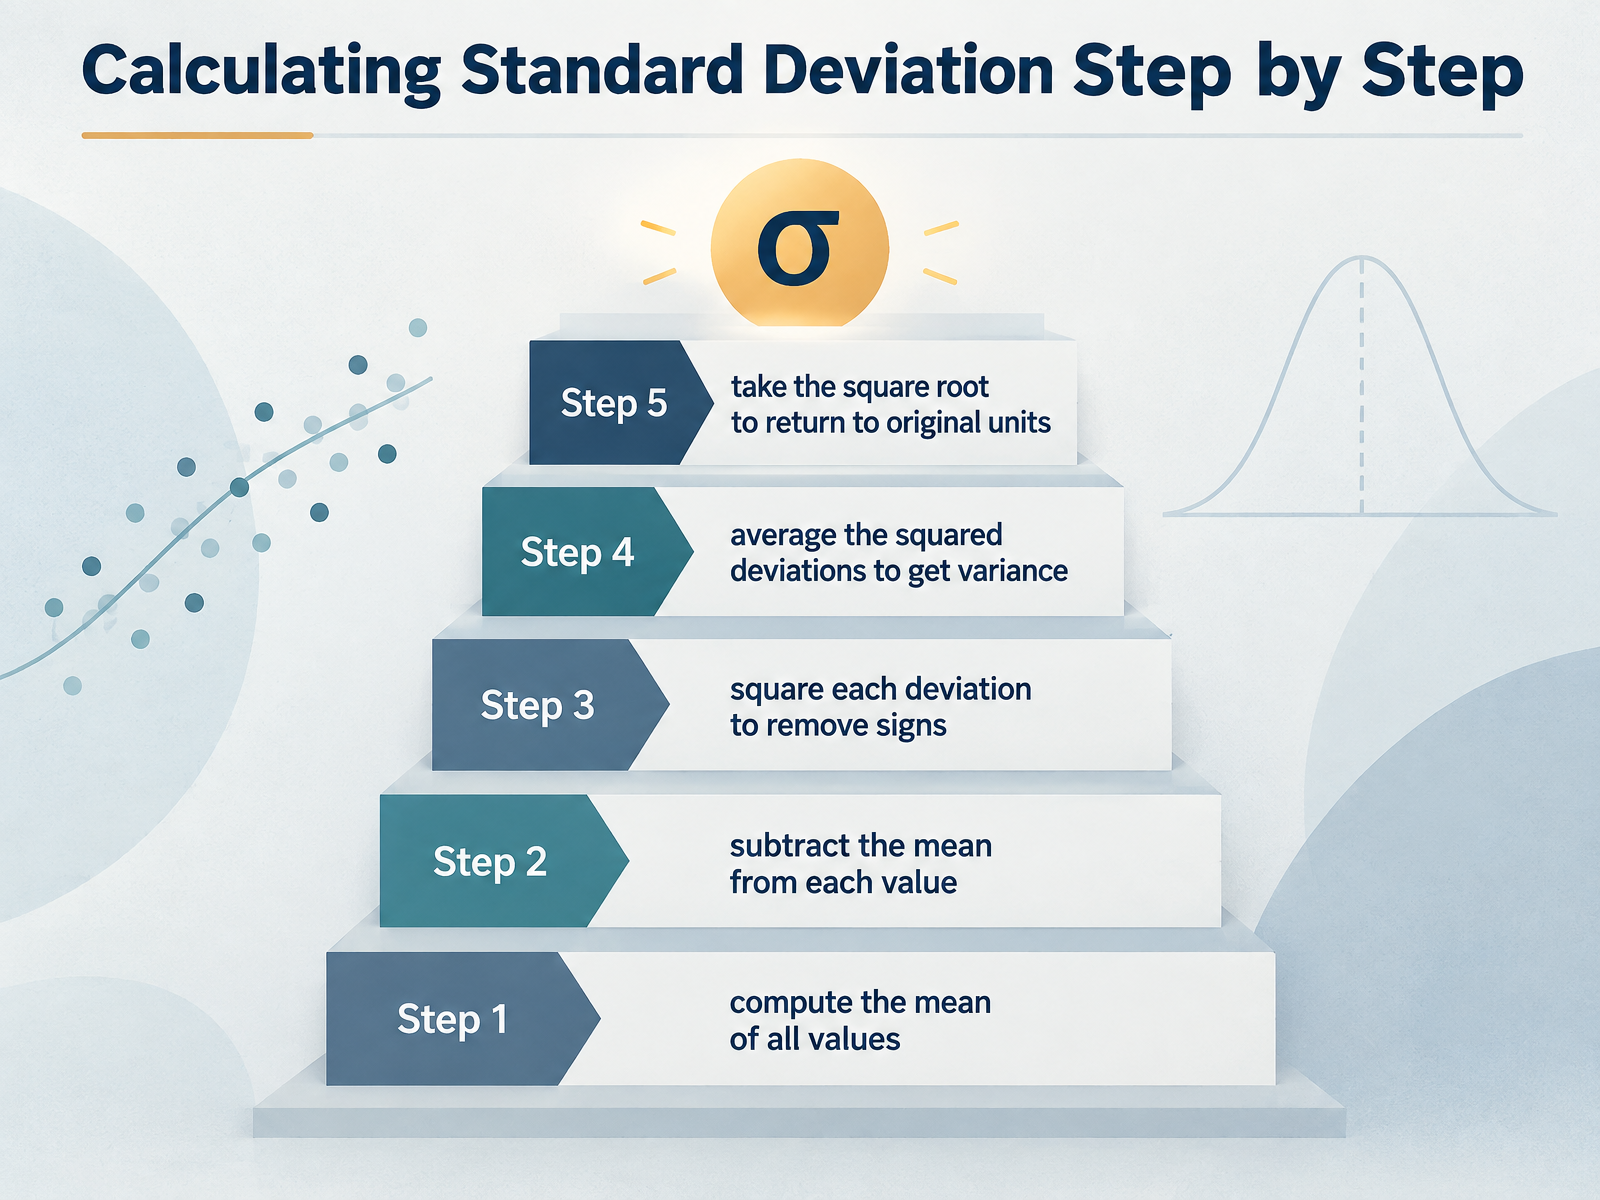
2 min - 04Calculating Standard Deviation Step by StepLet us walk through the calculation itself, step by step. It is more approachable than it first appears. Step one. Compute the mean. Add all your values together, then divide by how many values you have. Step two. Subtract that mean from each value. This tells you how far each individual value sits from the center. Some results will be negative, and that is expected. Step three. Square each of those deviations. Squaring removes the signs and keeps positive and negative distances from canceling each other out. Step four. Average the squared deviations. This result is called the variance, the average squared distance from the mean. Step five. Take the square root of the variance. This returns the measure to the original units, and that final number is the standard deviation. Here is a quick example. Suppose your values are two, four, four, four, five, five, seven, and nine. The mean is five. Each squared deviation averages to four, so the variance is four, and the standard deviation is the square root of four, which equals two. Notice how one number, two, now expresses the typical spread. Next, let us look at the difference between population and sample standard deviation.
 2 min
2 min - 05Population vs. Sample Standard DeviationLet's turn to a distinction that affects every calculation you will make. Population versus sample standard deviation.
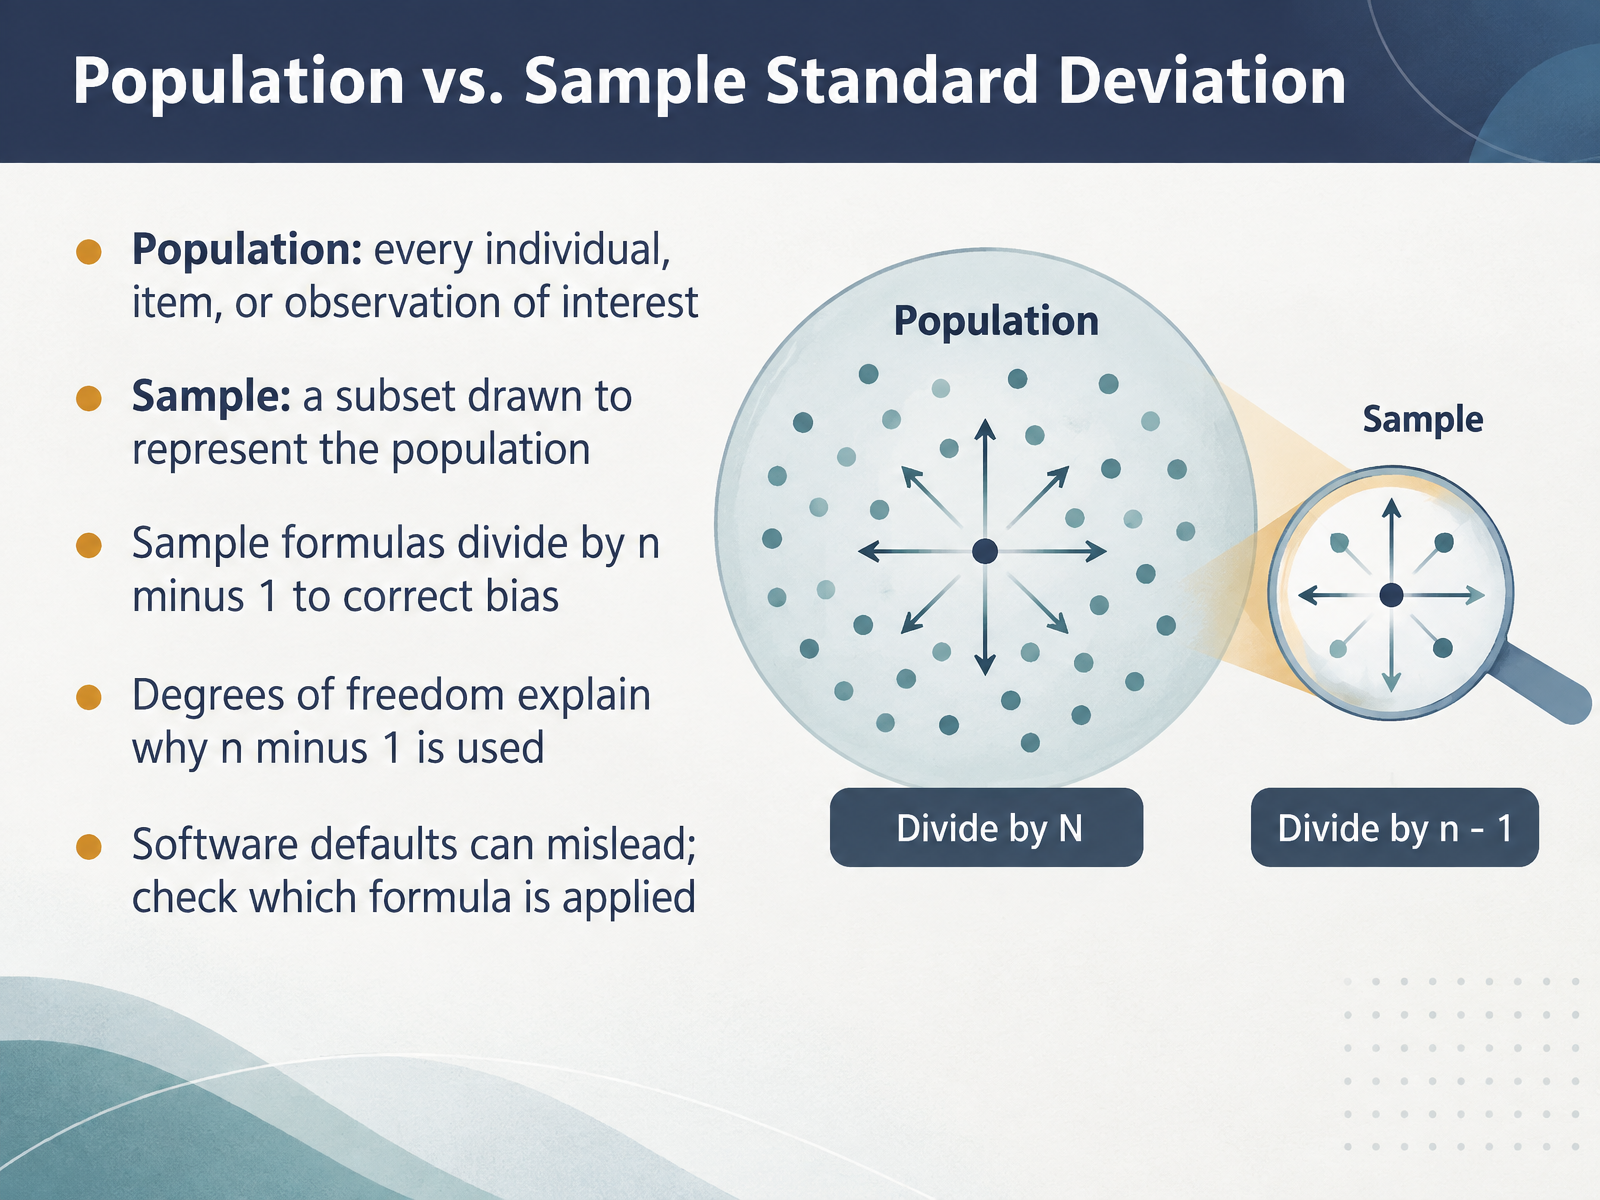
A population is every individual, item, or observation of interest. If you measure the height of every student in a school, that is a population. A sample is a subset drawn to represent that population. When measuring everyone is impractical, we study a sample and use it to estimate the larger picture.
Here is the key difference. Sample formulas divide by n minus one, not by n. Dividing by n minus one corrects a bias. Samples tend to be less spread out than the full population, and n minus one compensates for that tendency.
The reason is degrees of freedom. Once you know the sample mean, only n minus one values remain free to vary. That lost degree of freedom is why we divide by n minus one.
One caution. Software defaults can mislead you. Some tools assume a sample, others a population. Always check which formula is applied before you report a result.
Next, we will look at interpreting standard deviation in context.
 2 min
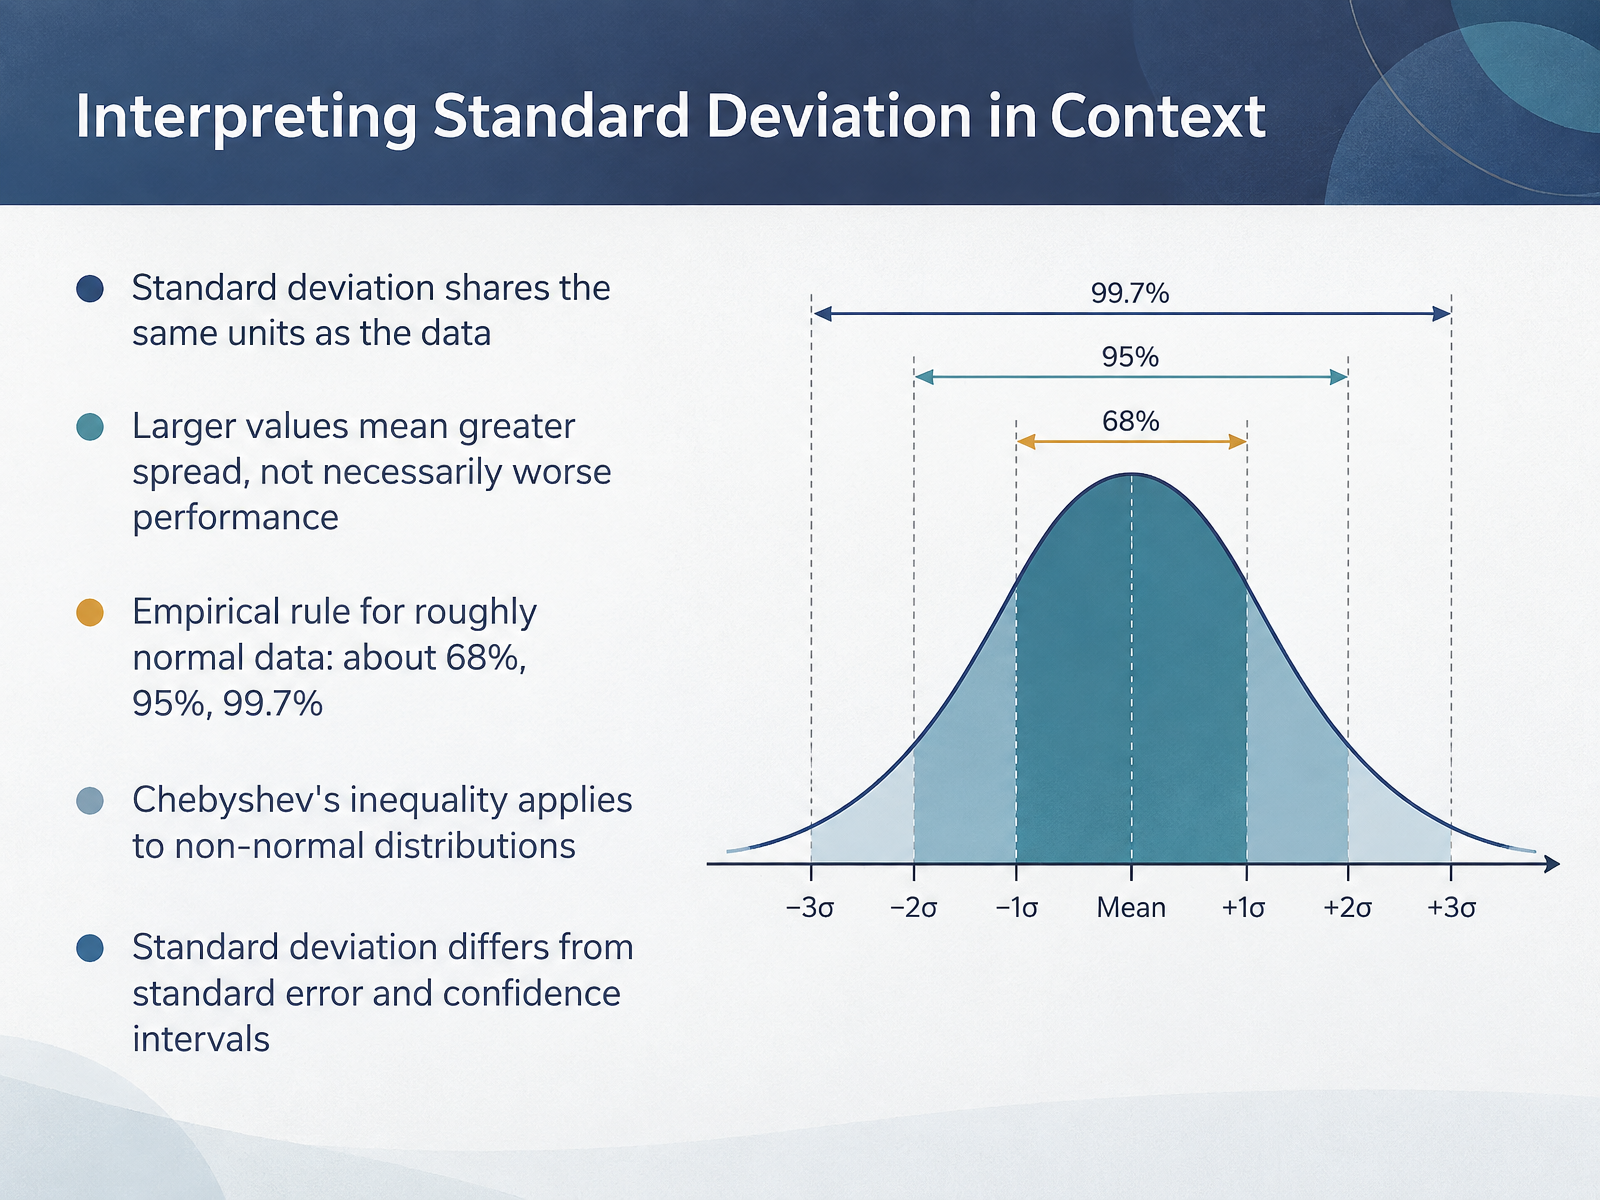
2 min - 06Interpreting Standard Deviation in ContextLet us now talk about interpreting standard deviation in context. First, standard deviation is expressed in the same units as your data. If you measure delivery times in minutes, the standard deviation is also in minutes. That makes it directly comparable to the values you are studying. Second, a larger standard deviation means greater spread. It does not automatically mean worse performance. In quality control, for example, a small standard deviation signals consistency, which is often desirable. Third, for data that is roughly normal, the empirical rule is useful. About sixty-eight percent of values fall within one standard deviation of the mean, about ninety-five percent within two, and about ninety-nine point seven percent within three. When the distribution is not normal, Chebyshev's inequality still gives a conservative bound. Finally, keep standard deviation distinct from standard error and confidence intervals. Standard deviation describes variability in the data itself. Standard error describes the precision of an estimate, and a confidence interval gives a range of plausible values for a population parameter. The key takeaway is this. Always interpret standard deviation in the context of the units, the shape of the distribution, and the question you are trying to answer. Next, we will look at how standard deviation is applied across different domains.
 2 min
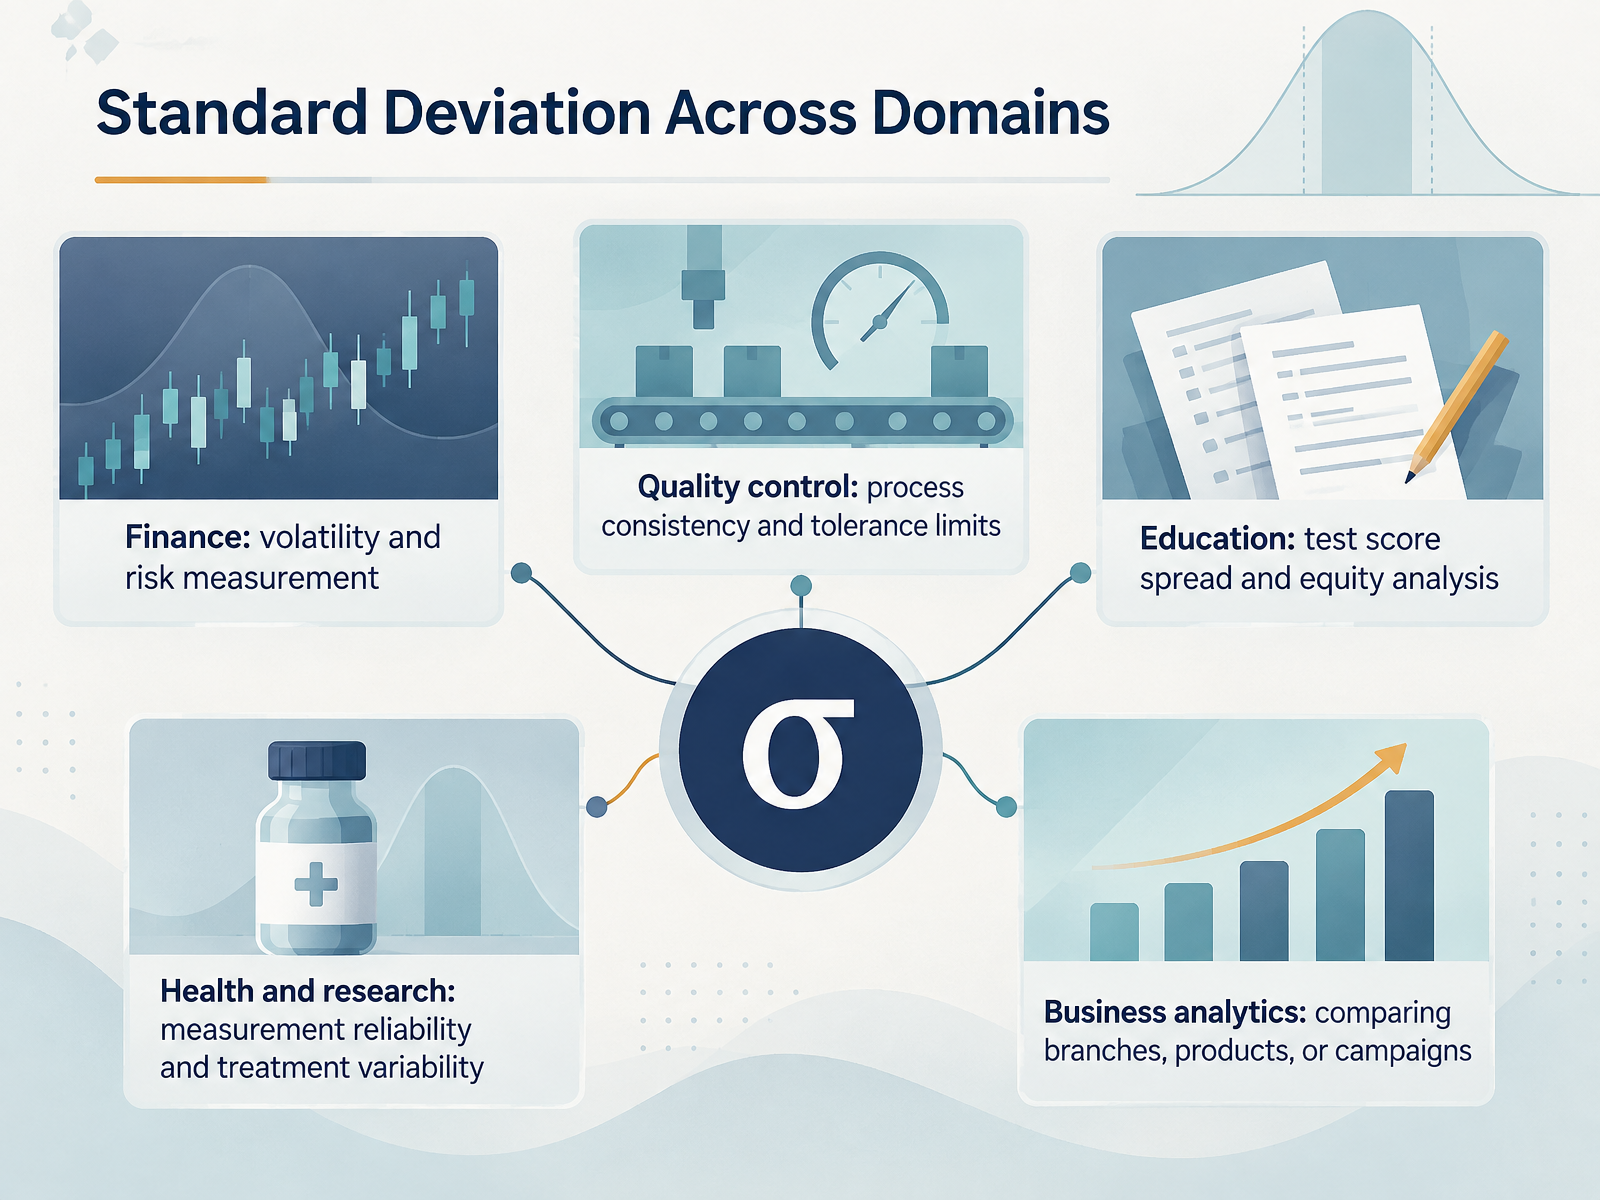
2 min - 07Standard Deviation Across DomainsNow let us see how standard deviation works across different domains. In finance, it is the standard way to measure volatility. A stock with a higher standard deviation is seen as riskier, because its returns move more widely around the average. In quality control, standard deviation measures process consistency. If a machine fills bottles with a small standard deviation, most bottles land close to the target volume, so fewer fall outside tolerance limits. In education, standard deviation describes test score spread. A wide spread may signal unequal access or uneven instruction, making it useful for equity analysis. In health and research, standard deviation tells us about measurement reliability. A small deviation across repeated measurements suggests a dependable instrument, while large variability in treatment outcomes may point to real differences between patients. In business analytics, standard deviation helps compare branches, products, or campaigns. Two stores may have the same average sales, but the one with lower variability is more predictable to manage. The core takeaway is this. The same idea, how far values typically sit from the mean, becomes practical insight in every field. Next, let us look at common mistakes and misconceptions.
 2 min
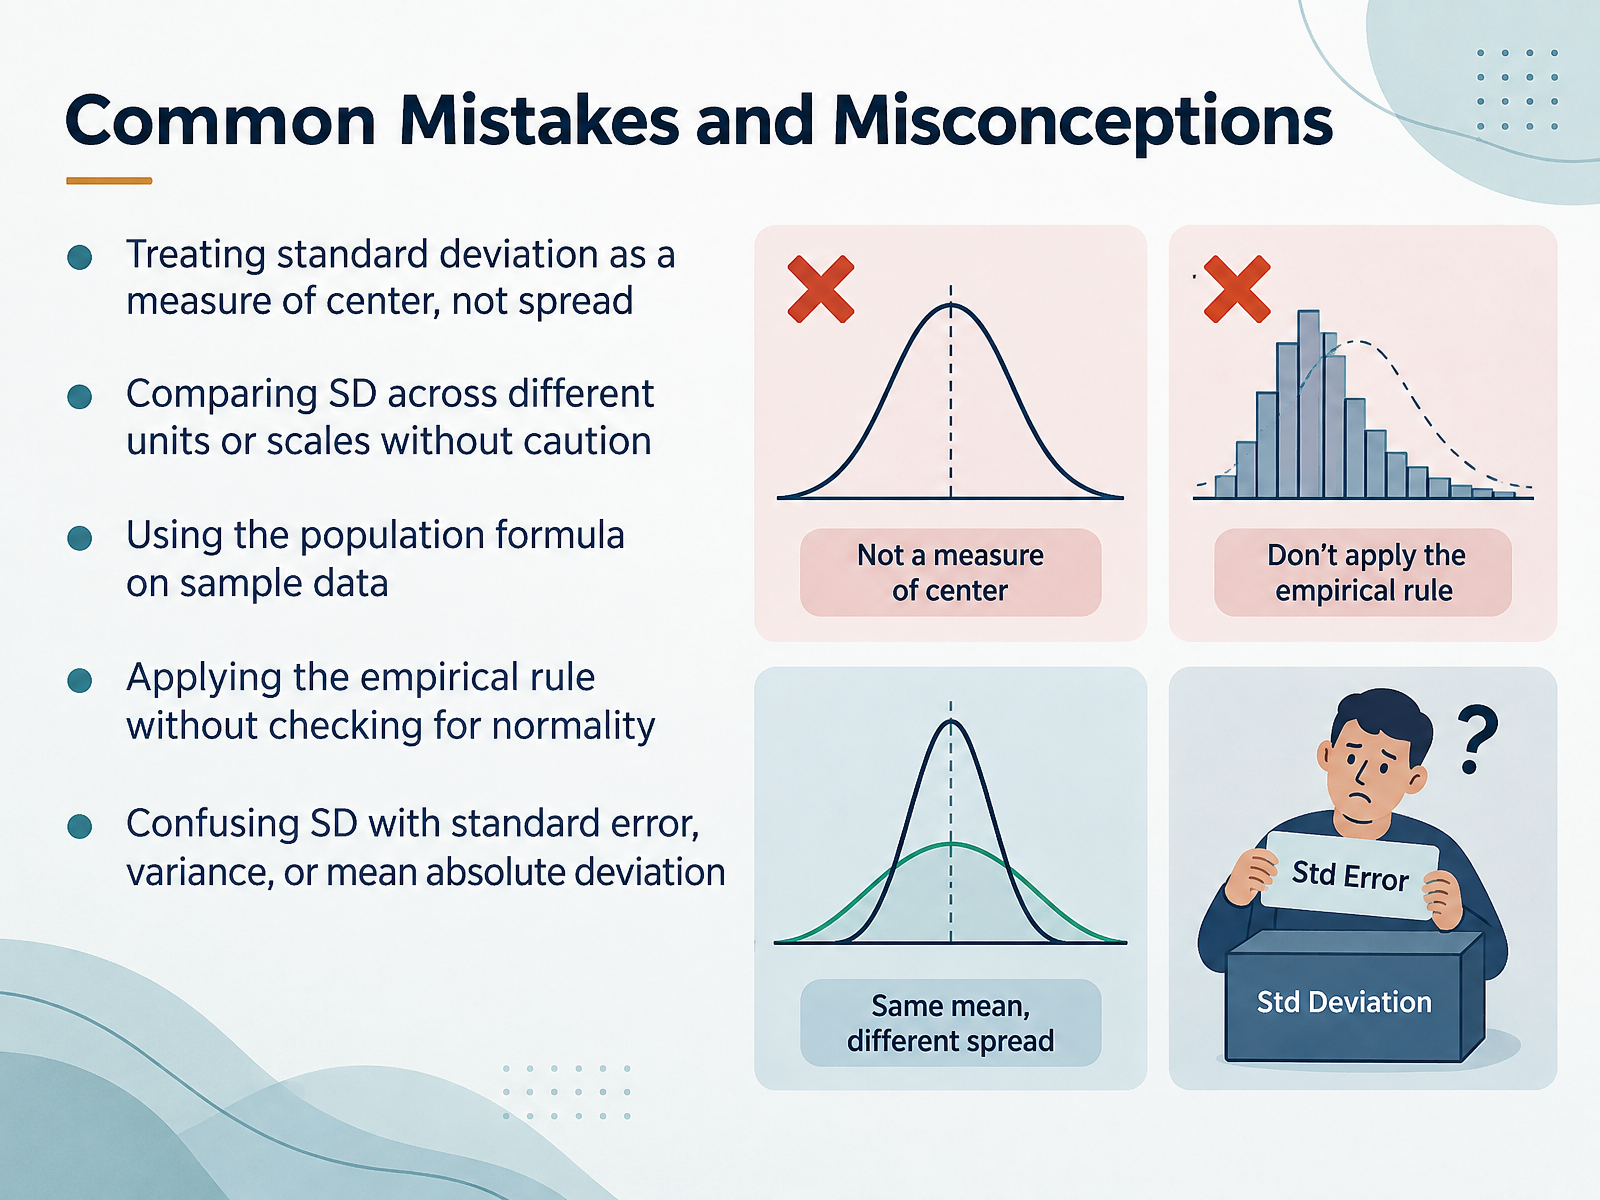
2 min - 08Common Mistakes and MisconceptionsLet us turn to some common mistakes, because knowing what to avoid is equally important. First, standard deviation measures spread, not center. It tells you how far values typically sit from the mean, so it never replaces the mean as a summary of location. Second, comparing standard deviations across different units or scales requires caution. A standard deviation of five dollars is not comparable to five days without context or a common scale. Third, the population formula applies when you have data for every member of the group. When you work with a sample, use the sample formula, which divides by n minus one. Fourth, the empirical rule depends on roughly normal data. Before quoting the sixty-eight, ninety-five, ninety-nine point seven pattern, check the shape of the distribution. Finally, do not confuse standard deviation with standard error, variance, or mean absolute deviation. They answer different questions. Standard error describes the variability of a sample estimate, variance is the squared spread, and mean absolute deviation uses absolute distances. Keeping these distinctions clear will keep your interpretations accurate. Let us now apply these ideas in a practical setting.
 2 min
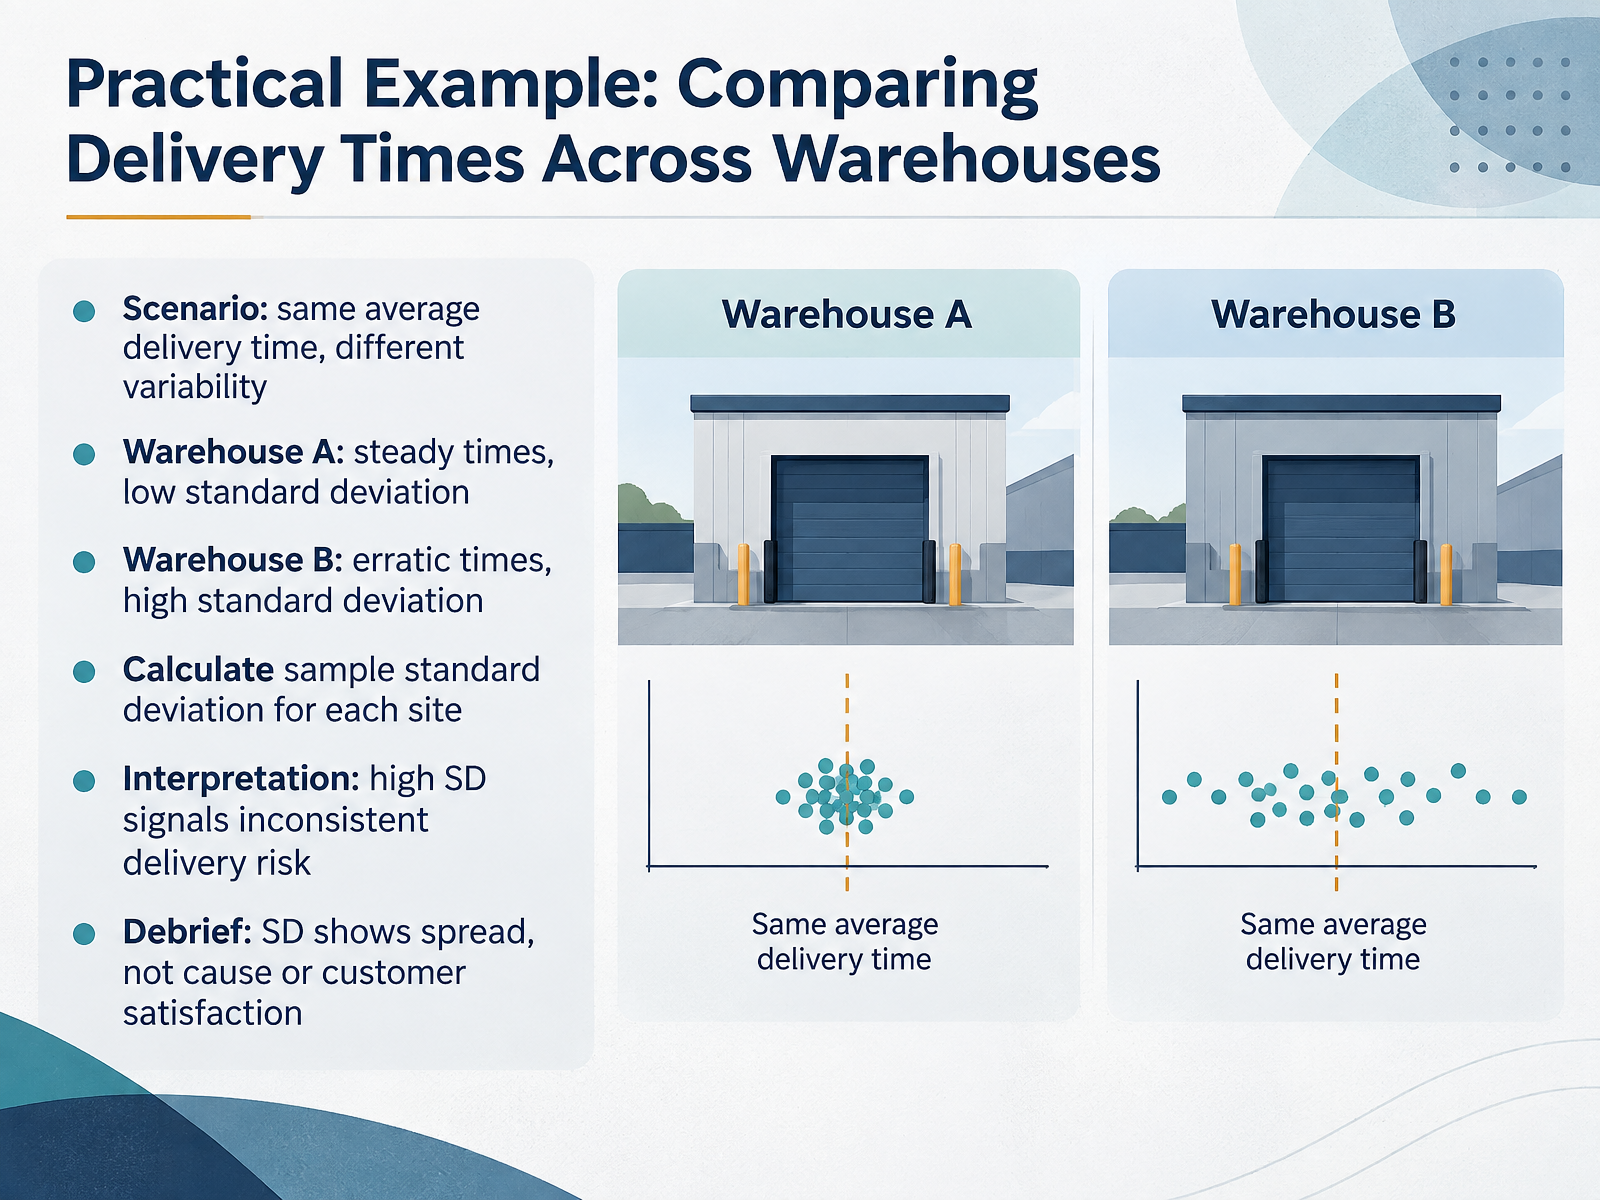
2 min - 09Practical Example: Comparing Delivery Times Across WarehousesLet us put standard deviation to work with a practical example. Imagine two warehouses with the same average delivery time, say three days. Warehouse A is steady, with most deliveries close to three days. Warehouse B is erratic, some arriving in one day, others taking six. To compare them, we calculate the sample standard deviation for each site. The formula sums the squared differences from the mean, divides by n minus one, and takes the square root. Warehouse A will produce a low standard deviation, meaning its delivery times cluster tightly around the average. Warehouse B will produce a high standard deviation, meaning its times are widely spread. So even with equal averages, high standard deviation signals inconsistent delivery risk. Remember, standard deviation shows spread, not cause or customer satisfaction. Next, we will look at a practical example involving investment return volatility.
 1 min
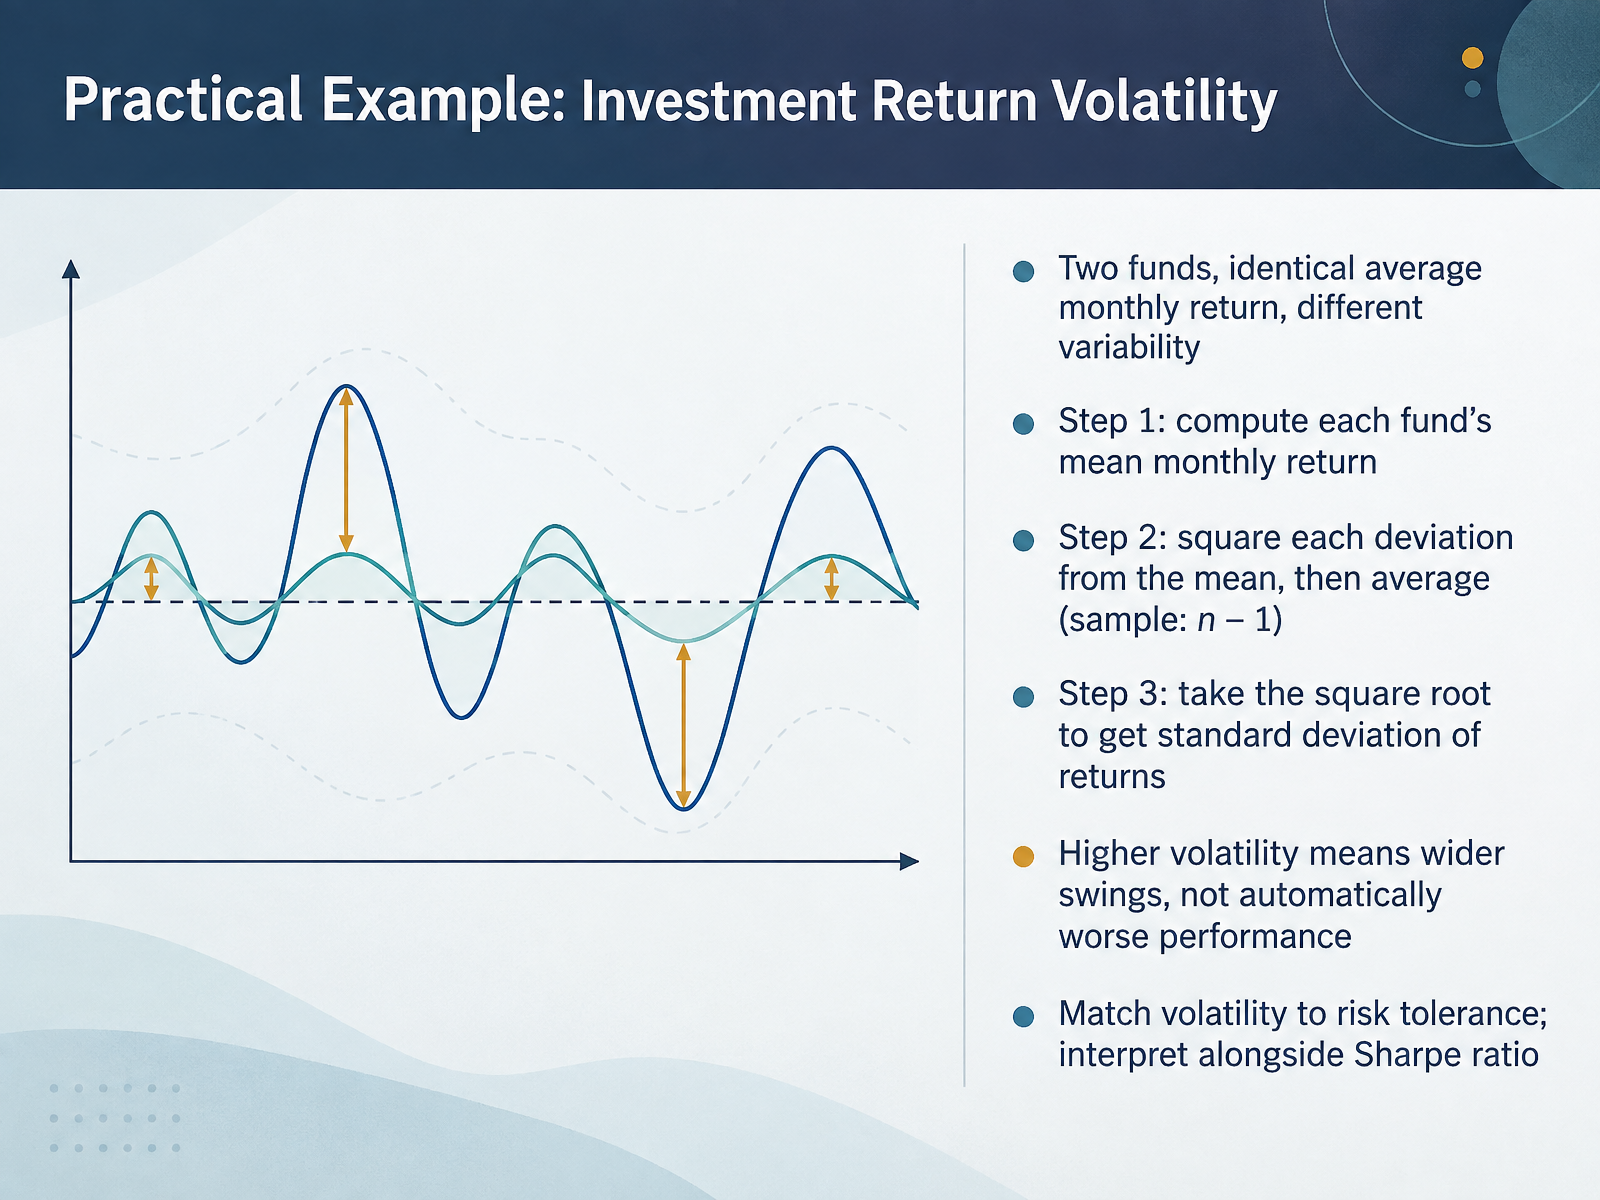
1 min - 10Practical Example: Investment Return VolatilityLet's make standard deviation concrete with an investment example. Suppose two funds have the same average monthly return, say one percent. Their averages match, but their monthly results may not. One fund might move quietly between zero point eight and one point two percent, while the other swings from negative two to positive four percent. The standard deviation of returns captures that difference in variability. To compute it, first find each fund's mean monthly return. Next, subtract that mean from each monthly return, square each deviation, and average those squares. With sample data, divide by n minus one. Finally, take the square root. That gives the standard deviation of returns, expressed in the same units as the returns themselves. A higher figure means wider swings. It does not automatically mean worse performance. What matters is whether the volatility fits the investor's risk tolerance. So interpret it alongside other measures, such as the Sharpe ratio. Next, we will apply this same logic to a different setting: analyzing exam score consistency.
 2 min
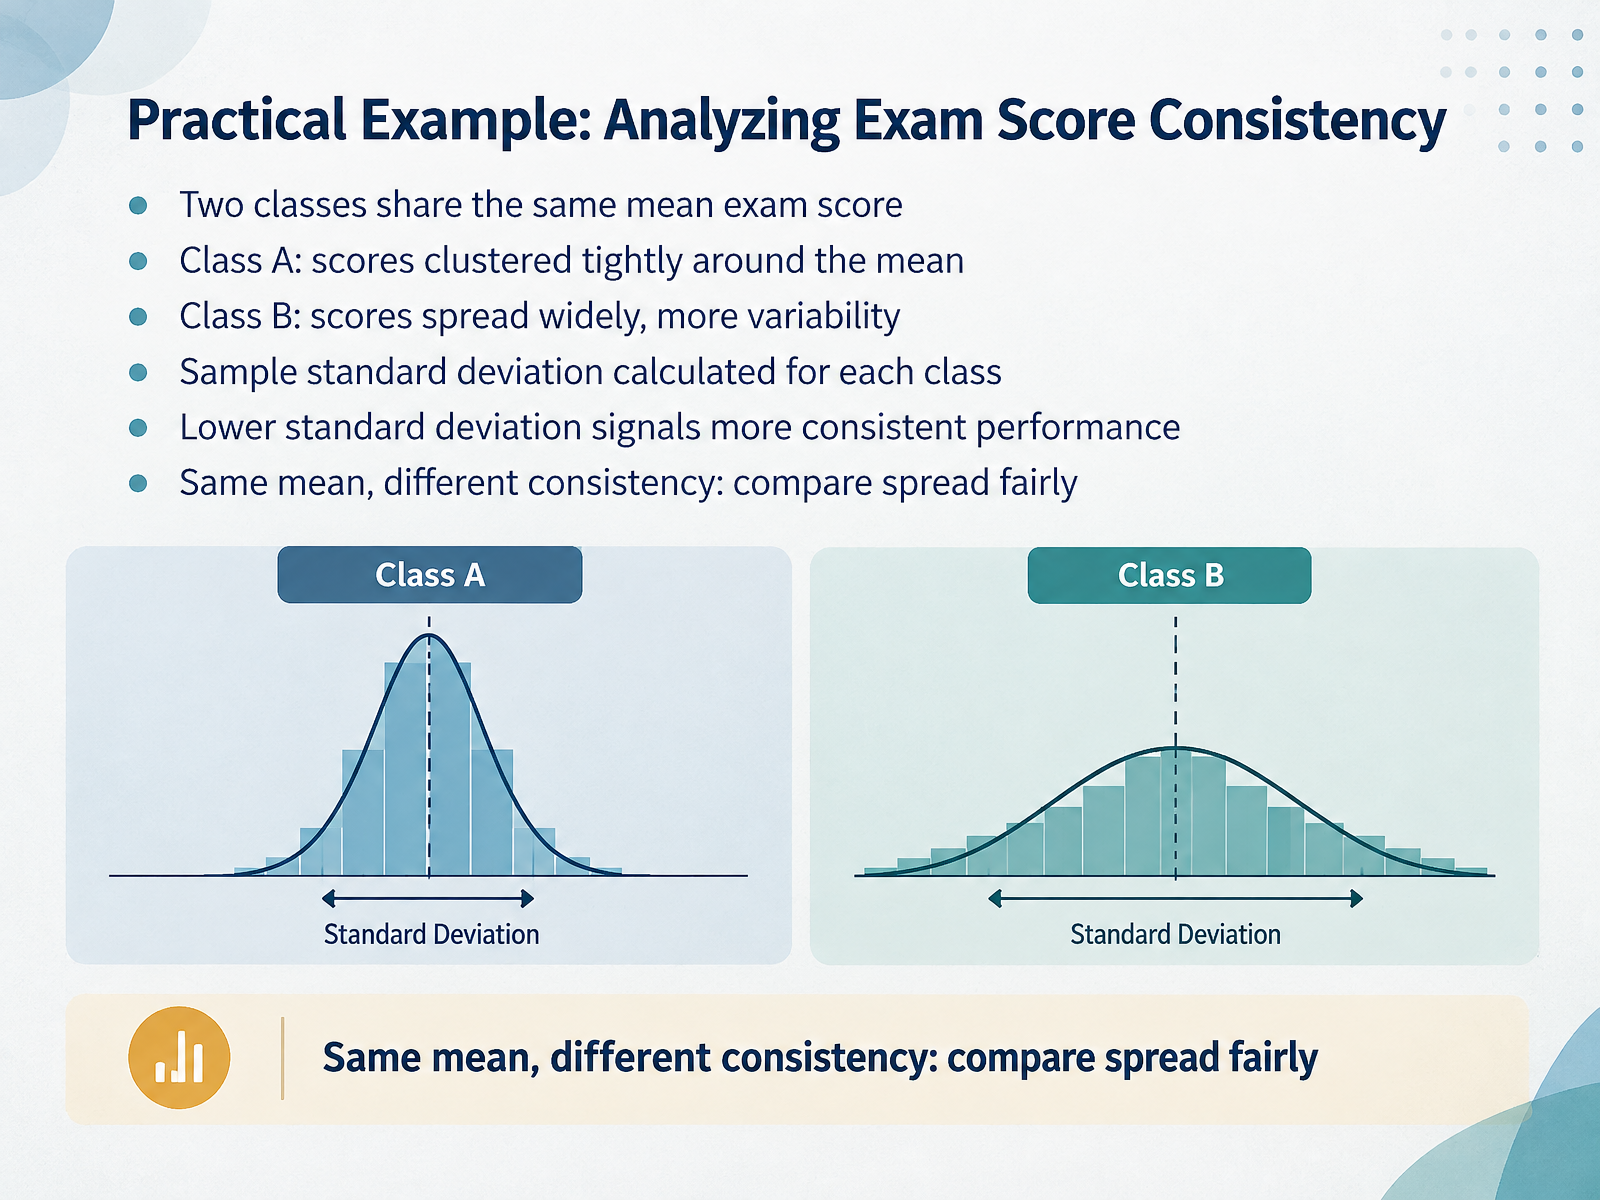
2 min - 11Practical Example: Analyzing Exam Score ConsistencyNow let us make this concrete with an example about exam scores. Imagine two classes. Both have the same mean exam score, so on average, they performed equally well. But their results look very different. In Class A, scores cluster tightly around the mean. Most students earned a similar result. In Class B, scores spread widely, with some high scores and some low scores, so there is more variability. To describe this difference, we calculate the sample standard deviation for each class. The sample standard deviation measures how far scores typically fall from the mean. A lower standard deviation signals more consistent performance, while a higher one signals greater spread. So even when the mean is the same, the standard deviation helps you compare consistency fairly. The key takeaway is this. The mean gives you the center. The standard deviation tells you how tightly the data gathers around it. Next, we look at the coefficient of variation and scale free comparison.
 1 min
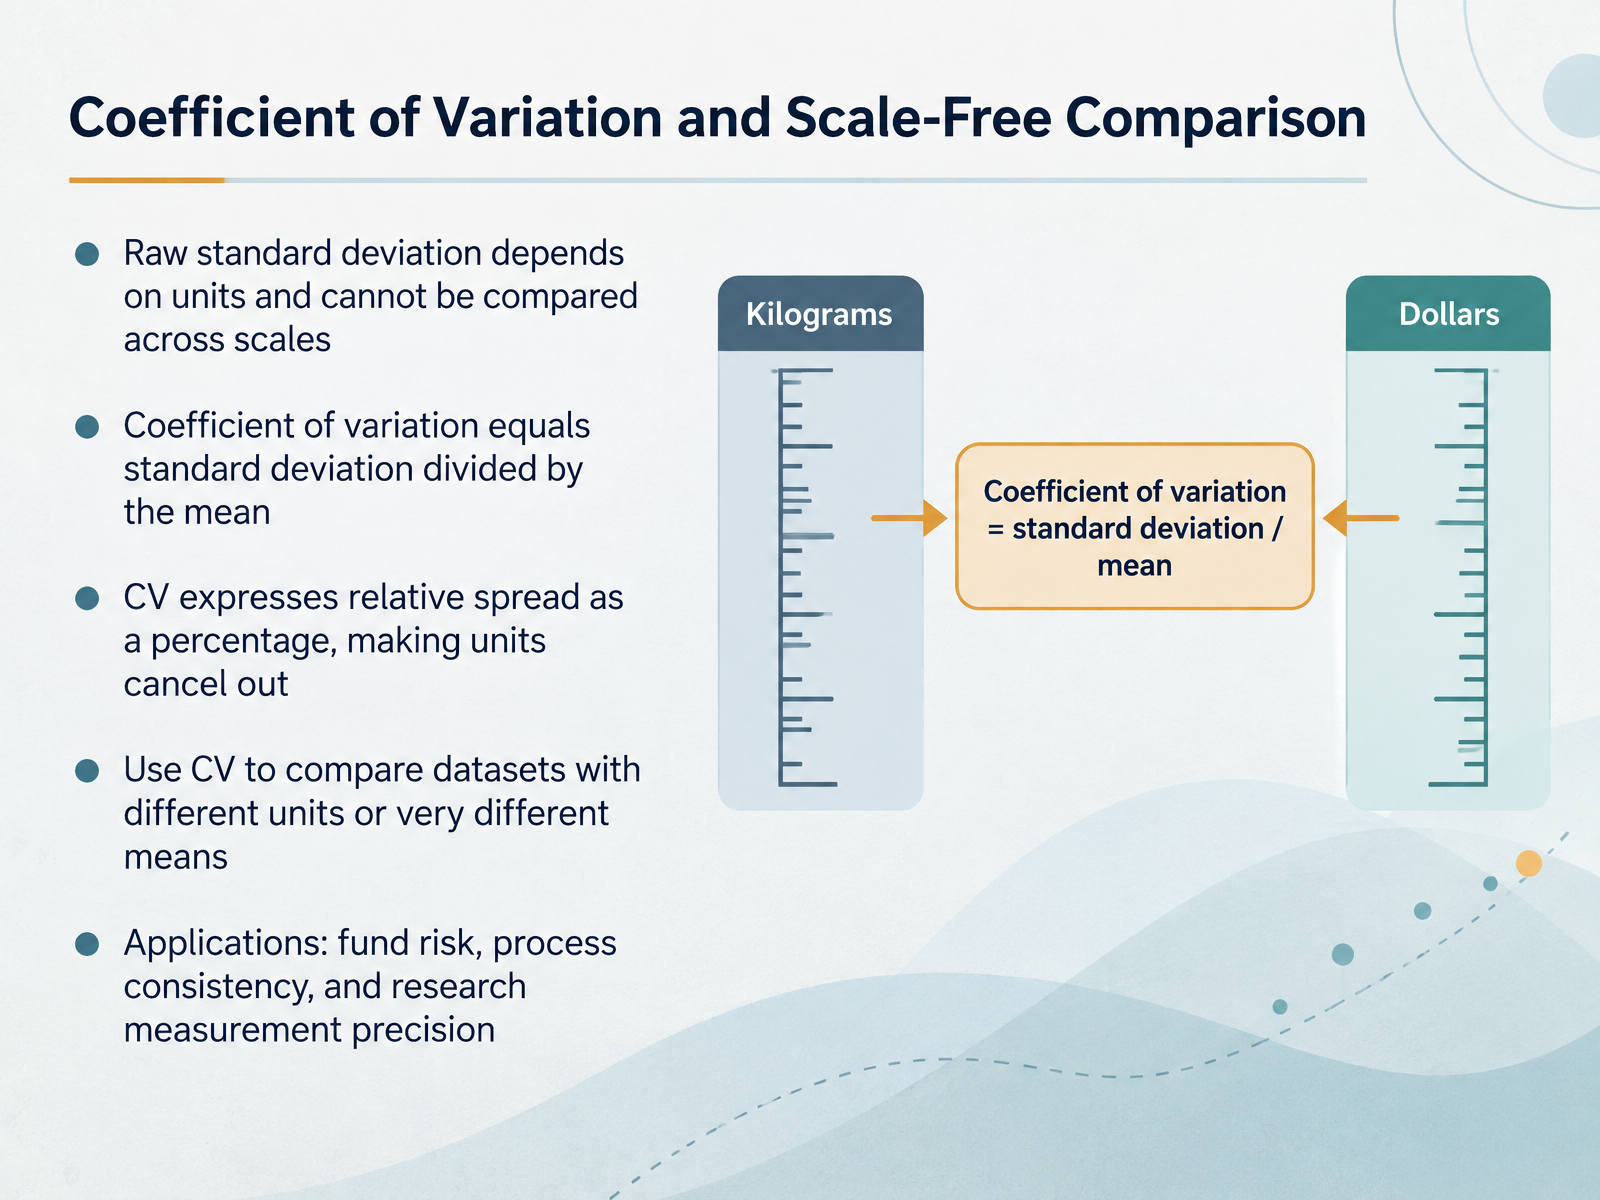
1 min - 12Coefficient of Variation and Scale-Free ComparisonLet us now consider a problem that appears whenever you compare variability across groups. Raw standard deviation depends on the units and scale of your data. So you cannot directly compare the standard deviation of heights in centimeters with the standard deviation of incomes in dollars. The fix is a simple ratio called the coefficient of variation. The coefficient of variation equals the standard deviation divided by the mean. Because both parts carry the same units, those units cancel out. The result is usually expressed as a percentage, giving you a scale free measure of relative spread. This lets you compare datasets with different units or very different means. For example, a fund with a standard deviation of two and a mean return of ten has a coefficient of variation of twenty percent, and you can compare that directly with a fund measured on a different scale. In practice, the coefficient of variation is used to compare fund risk, process consistency, and measurement precision in research. As you evaluate variability, remember that sometimes relative spread tells the clearer story. Next, we will look at reporting standard deviation transparently.
 1 min
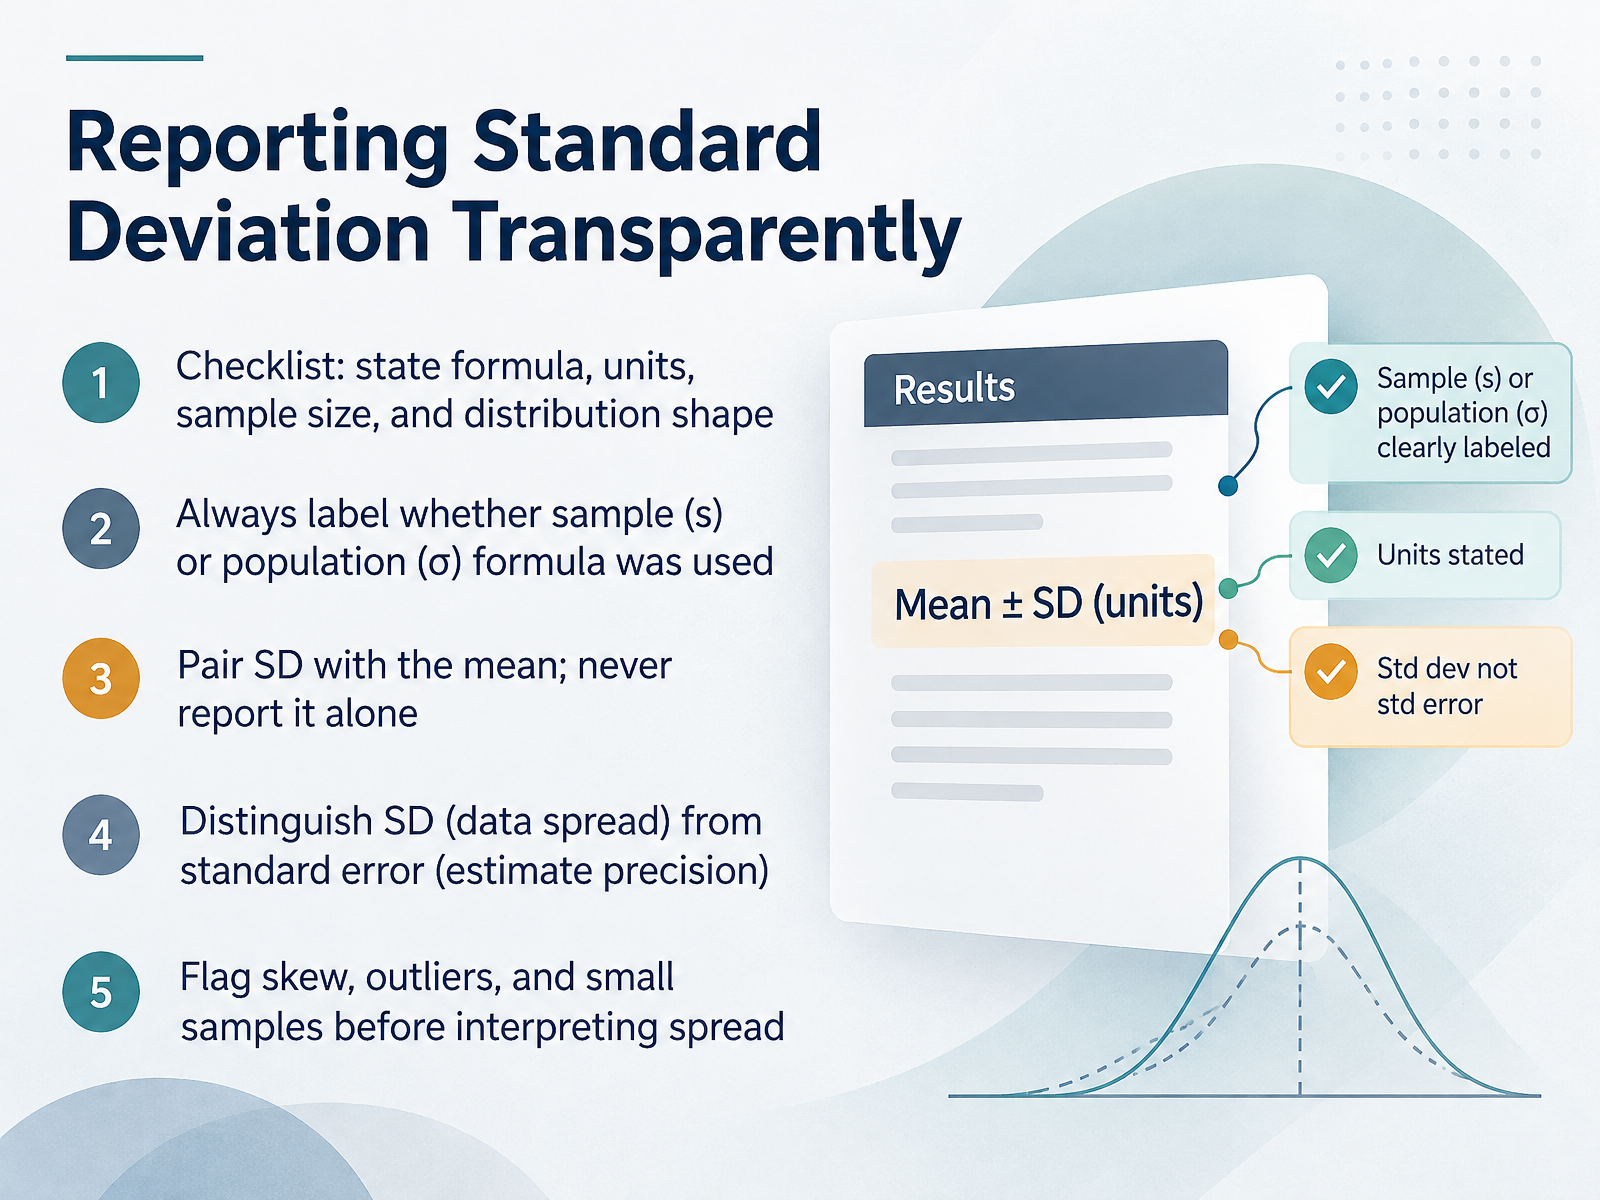
1 min - 13Reporting Standard Deviation TransparentlyLet's talk about reporting standard deviation transparently. Computing it is only half the job. If readers cannot see how you got the number, they cannot judge it. So use a short checklist. State the formula, the units, the sample size, and the shape of the distribution. Then always label whether you used the sample formula, written as s, or the population formula, written as sigma. This matters, because the two differ slightly, and readers deserve to know which one produced your result. Next, pair standard deviation with the mean. The mean tells you the center. The standard deviation tells you the spread around it. Reported alone, either one can mislead. Also, distinguish standard deviation from standard error. Standard deviation describes how spread out the data are. Standard error describes how precise an estimate is. For example, a mean of fifty with a standard deviation of ten describes the data. A standard error of two describes the uncertainty in that mean. Finally, flag skew, outliers, and small samples before you interpret spread. A single extreme value can inflate standard deviation, and in a small sample, that effect is even stronger. So report clearly, label honestly, and interpret with care. Let's bring these ideas together in Key Takeaways and Next Steps.
 2 min
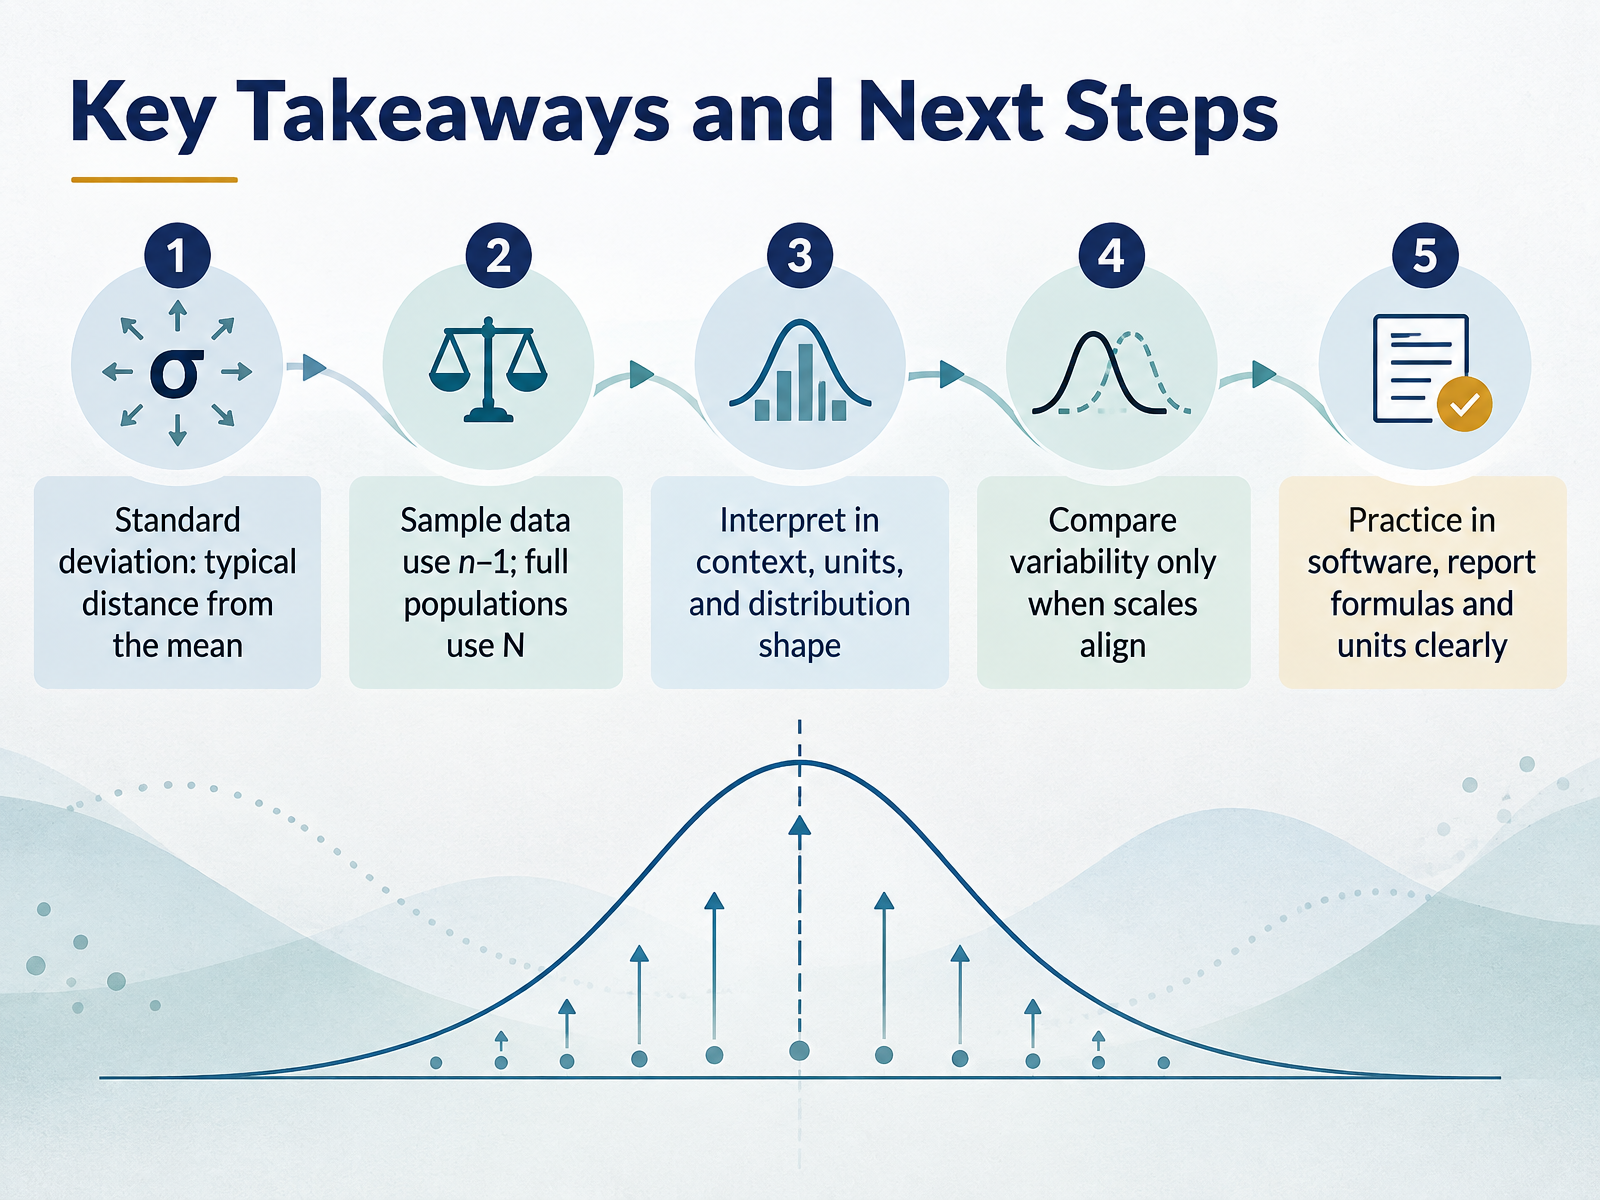
2 min - 14Key Takeaways and Next StepsLet us close by bringing the key ideas together. First, standard deviation describes the typical distance from the mean. If the mean is one hundred and a value sits near one hundred and ten, the standard deviation tells you how far such values usually drift. Second, when you work with sample data, use n minus one in the denominator. When you have the full population, use N. Third, always interpret variability in context, with the original units and the shape of the distribution in mind. A standard deviation of five means one thing for exam scores and another for monthly revenue. Fourth, compare variability only when scales align. Comparing dollars with percentages rarely gives a fair picture. Finally, practice in software, and report your formulas and units clearly so others can follow your reasoning. As you move forward, ask three questions of any variability result. What does it measure? What units apply? And does the comparison make sense? Keep those questions close, and your analysis will stay clear, honest, and useful. Thank you for working through this topic with me. You now have a reliable way to describe how data spreads, so apply it thoughtfully in your next dataset.
 2 min
2 min
Take the deck with you
Download this course as a file — free, no sign-up needed.
- PDF handoutEvery slide page, ready to print or share.15 pages · 3.2 MBDownload
- Narrated PowerPointThe deck that presents itself — every slide carries the digital human's narration video.15 pages · 14.2 MBDownload
- PowerPoint slidesThe full deck as a .pptx — open it in PowerPoint, Keynote, or Google Slides.15 pages · 3.2 MBDownload
Free to use in your own training — please keep the PersonWise credit page at the end.
Have your own deck? Turn it into a course