Email Marketing Metrics: Measurement & Interpretation
Begin
14 pages · ~28 min
Email Marketing Metrics: Measurement & Interpretation
Learn to measure and interpret key email marketing metrics, including open rates, click-through rates, and conversions, to optimize campaign performance for marketers and analysts.
What you’ll learn
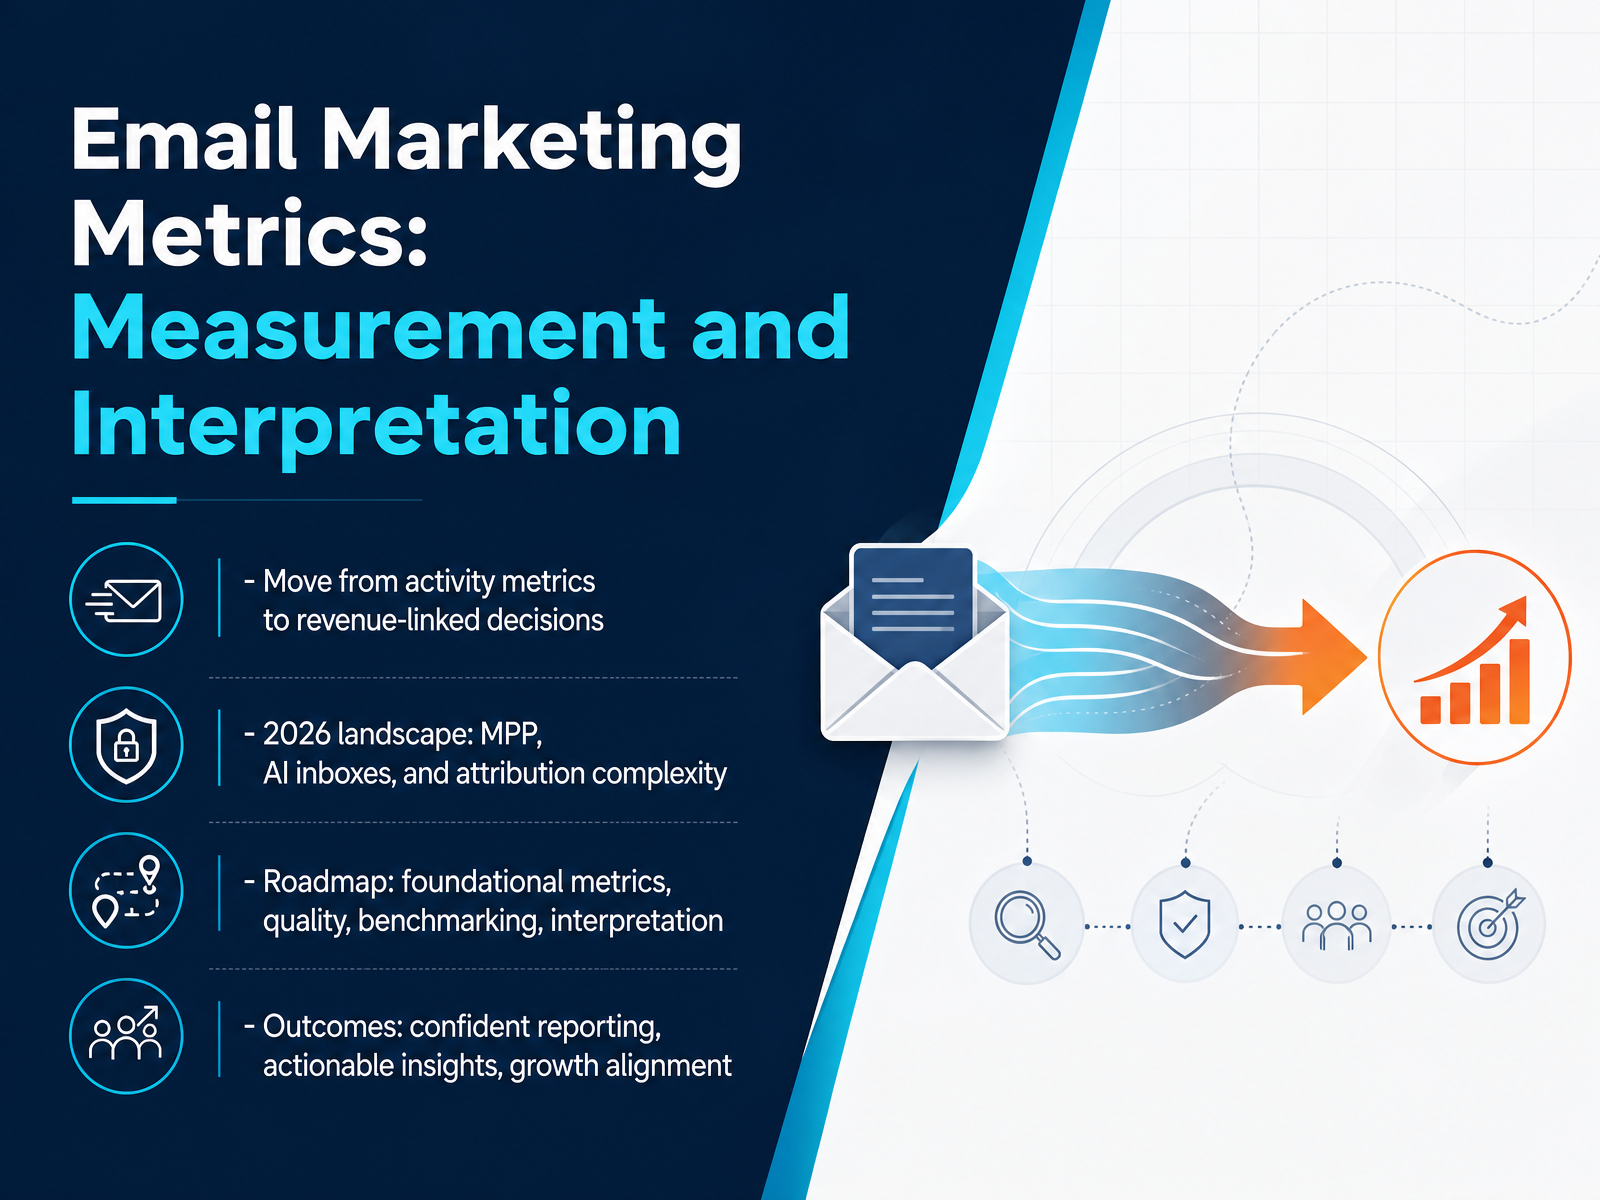
- 01Email Marketing Metrics: Measurement and InterpretationWelcome. If you're leading marketing or growth, you already know email isn't about sends and opens anymore. It's about revenue, retention, and measurable business impact. This session gives you a practical framework for 2026 — a landscape shaped by Mail Privacy Protection, AI-powered inboxes, and complex attribution. We'll move beyond activity metrics and build a system that links every campaign to business outcomes. You'll learn which foundational metrics matter, how to separate signal from noise, and how to benchmark performance against your own historical data. The goal is straightforward: report with confidence, generate actionable insights, and align every email decision with growth. We'll start by examining why traditional reporting fails in this new environment.litmus.comblog.hubspot.compushwoosh.com+22 min
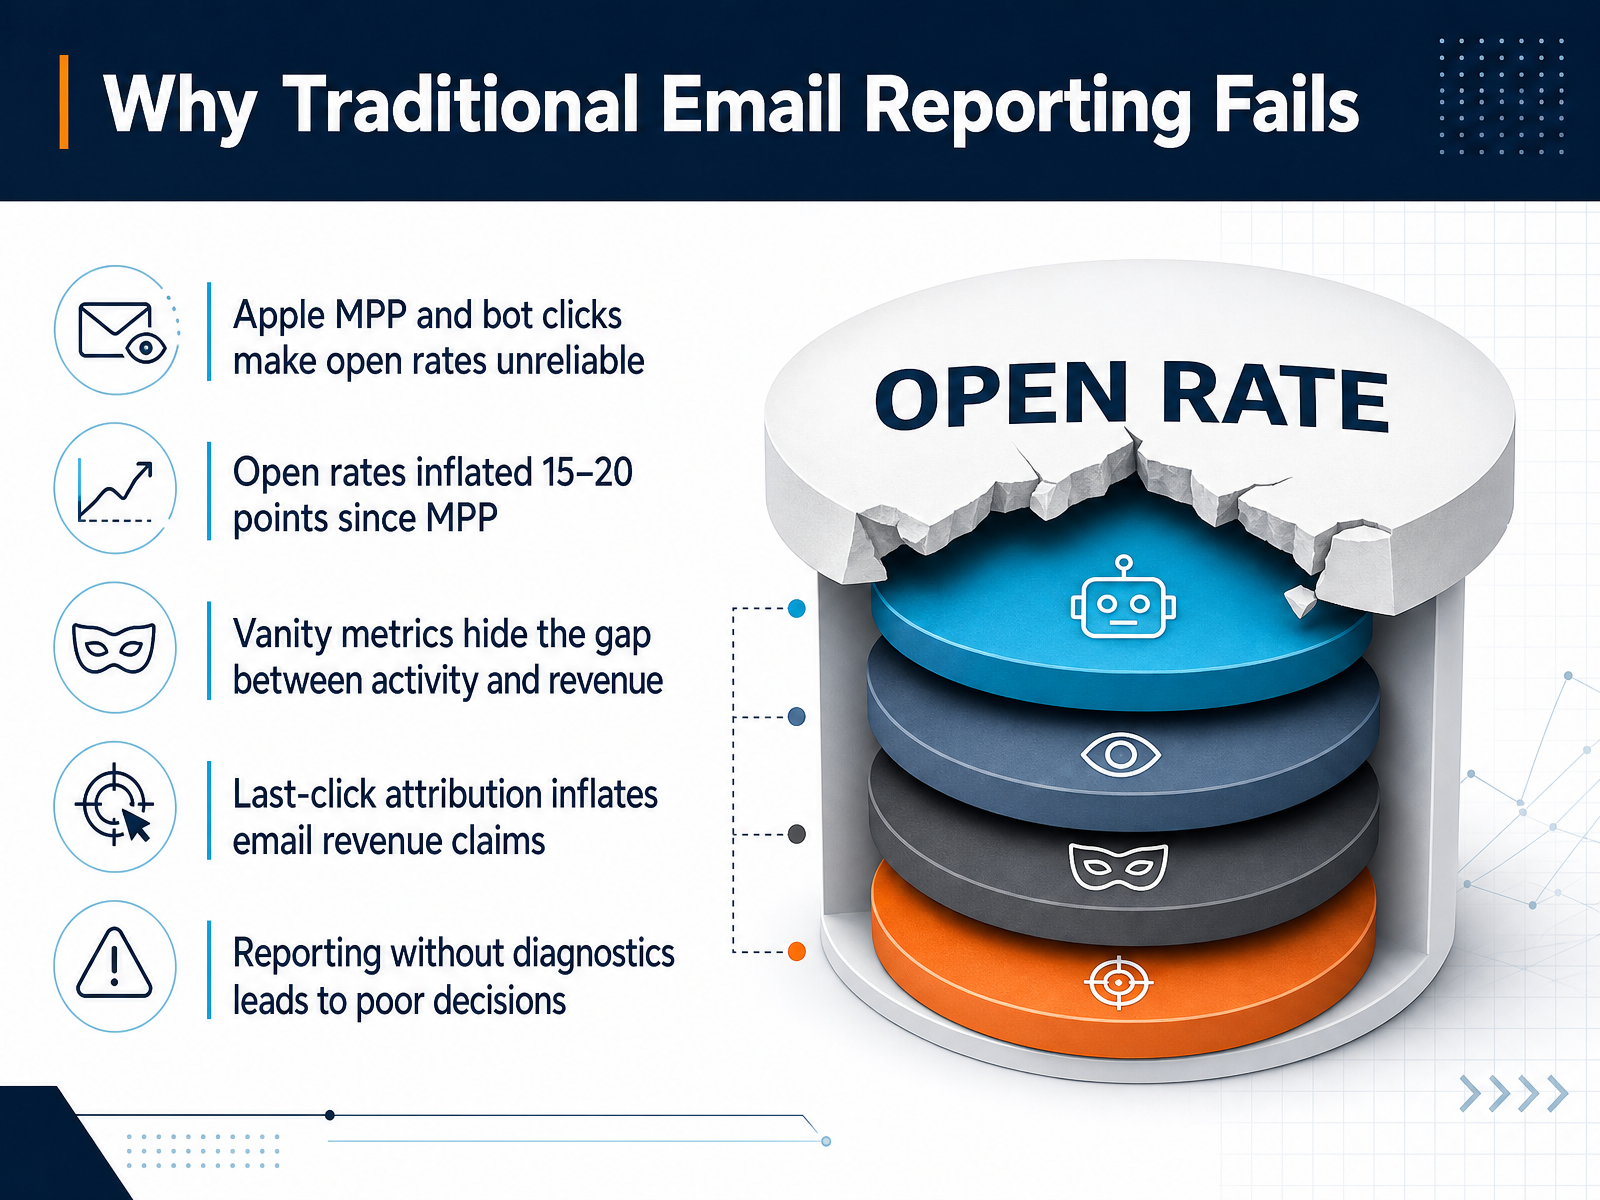
- 02Why Traditional Email Reporting FailsLet's be direct about why traditional email reporting is failing you. Since Apple introduced Mail Privacy Protection, open rates have been inflated by fifteen to twenty points. They are no longer a measure of genuine interest. They are a technical artifact. Click-through rates suffer from similar corruption through bot clicks, giving you activity that never involved a human decision. The real damage happens when you rely on vanity metrics like these to make strategic calls. They hide the gap between engagement and revenue. And when you add last-click attribution into the mix, you end up giving email credit for conversions it didn't drive. Reporting without diagnostics is just guesswork with a dashboard. You make poor decisions because the numbers look good while the business results don't. What we need is a framework that separates signal from noise and connects email activity directly to revenue outcomes. Let's build that framework now.
 litmus.comblog.hubspot.compushwoosh.com+21 min
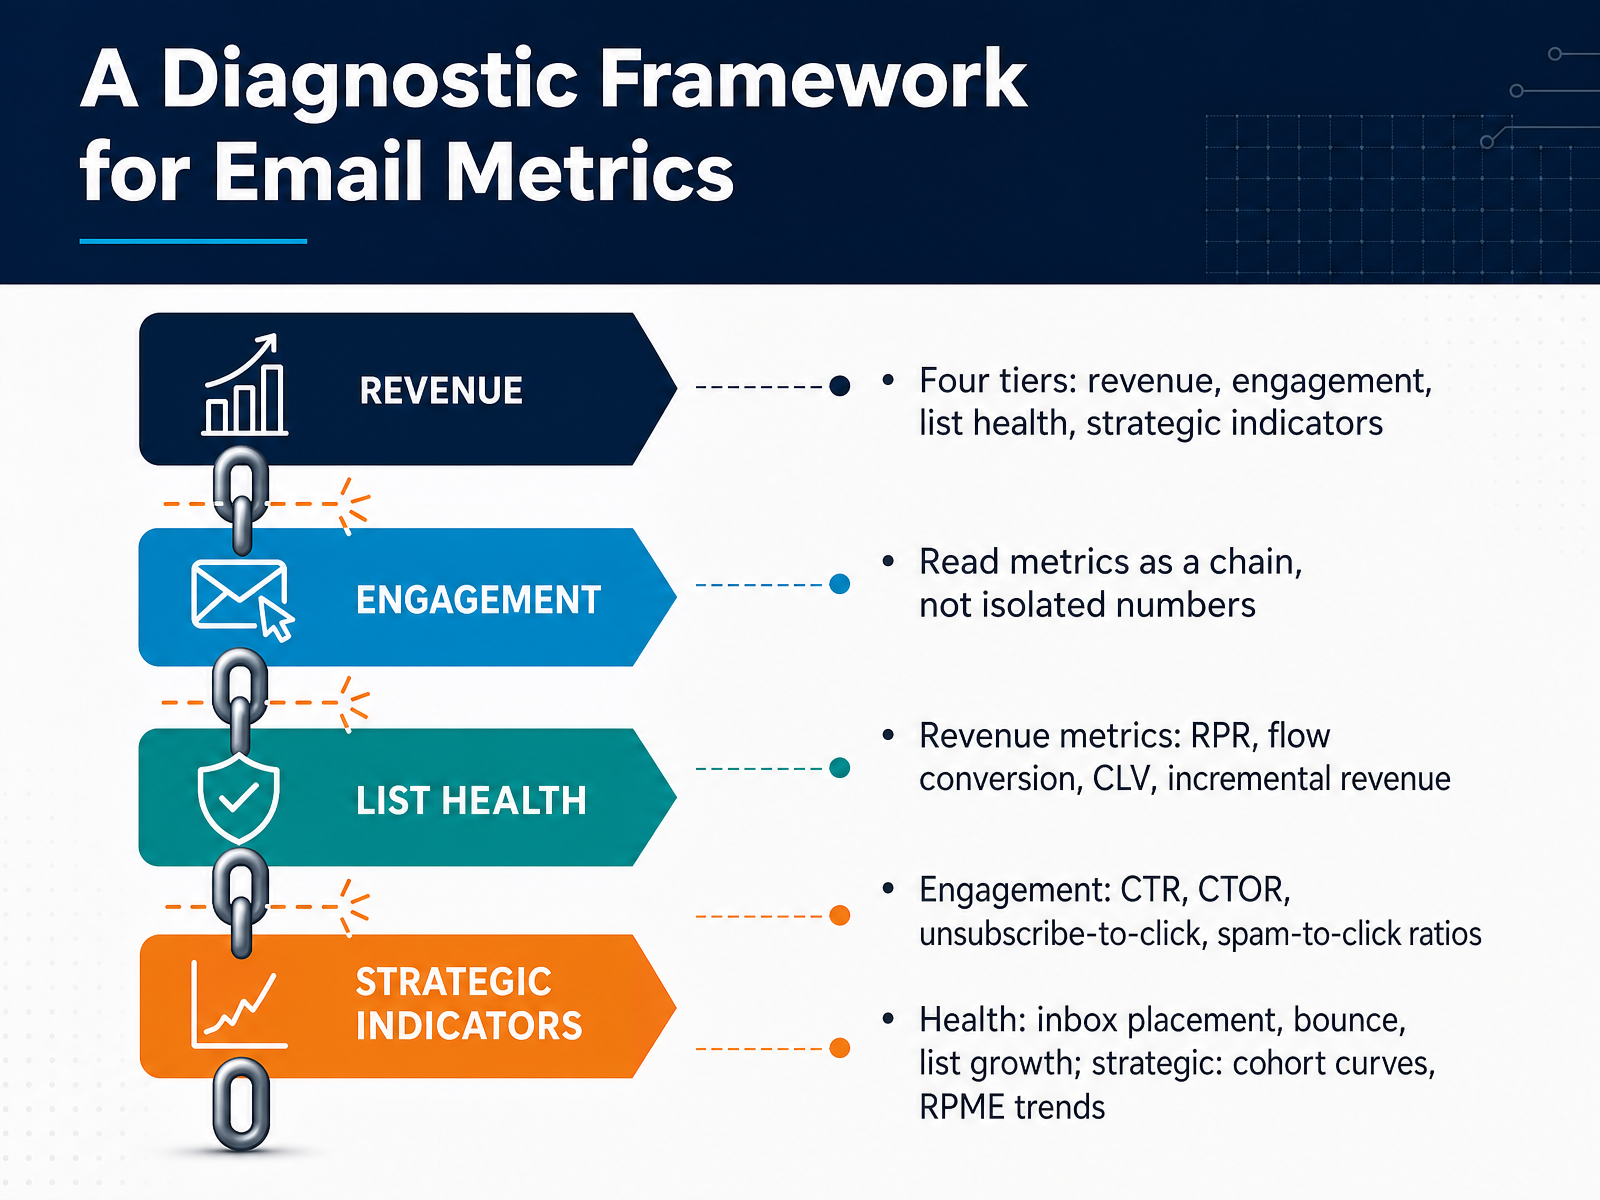
 - 03A Diagnostic Framework for Email MetricsNow let's shift to the diagnostic framework that will structure how we interpret every metric. Think of it in four tiers. Revenue, engagement, list health, and strategic indicators. The key is to read these as a chain, not as isolated numbers. One weak link changes the meaning of everything downstream. Revenue metrics come first. Look at revenue per recipient, flow-level conversion rates, customer lifetime value, and incremental revenue. That last one requires holdout testing, but it's the only way to prove email is actually driving new sales. Engagement comes second. Click-through rate tells you about overall reach, but click-to-open rate isolates content performance. Also watch unsubscribe-to-click and spam-complaint-to-click ratios. A standard unsubscribe rate can look fine while the unsubscribe-to-click ratio is sky-high, which signals your content is alienating the people who engage most. Third is list health. Inbox placement, bounce rate, and net list growth. These determine whether your carefully crafted message ever reaches a human. Finally, strategic indicators reviewed quarterly. Cohort retention curves tell you whether newer subscribers are as valuable as older ones, and revenue per thousand emails trend shows whether efficiency is improving over time. Campaign averages hide problems. Cohort analysis reveals them. That's the framework. Now let's get into the foundation of deliverability and list health.
 litmus.comblog.hubspot.compushwoosh.com+22 min
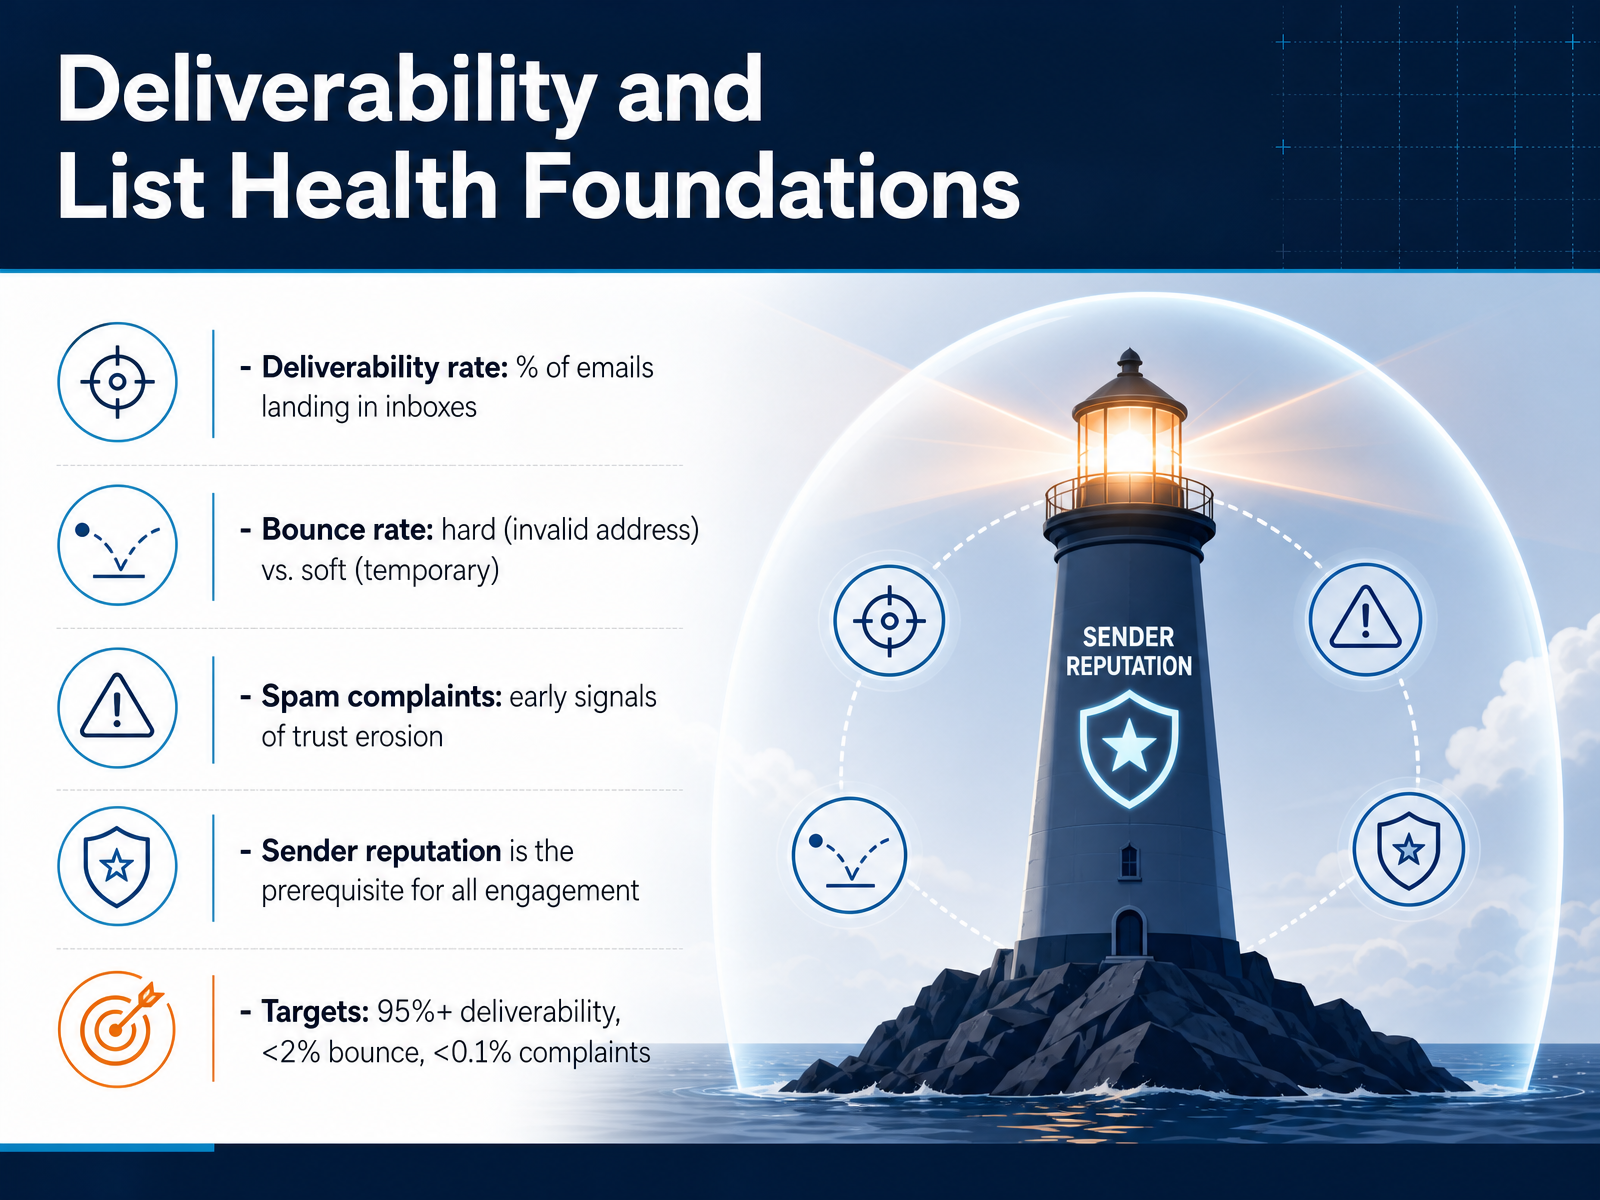
 - 04Deliverability and List Health FoundationsBefore we judge engagement, we have to confirm the foundation: are your emails actually reaching the inbox? Deliverability rate is the percentage of emails that land there, not in spam. This is the prerequisite for every other metric. Aim for at least ninety-five percent. Next, bounce rate. Hard bounces mean invalid addresses—remove them immediately. Soft bounces are temporary issues like a full inbox, but repeated soft bounces signal list decay. Keep your overall bounce rate under two percent. And watch spam complaints. Even a small spike—anything above one-tenth of one percent—can quickly erode sender reputation, which takes a long time to rebuild. The core message: list hygiene is not a maintenance task. It is a strategic safeguard. If these numbers are unhealthy, no amount of creative copy will fix your campaign. Now, with a healthy foundation in place, let's explore how we interpret the interaction itself: engagement metrics like opens, CTR, and CTOR.
 pushwoosh.comwebfx.comblog.hubspot.com+21 min
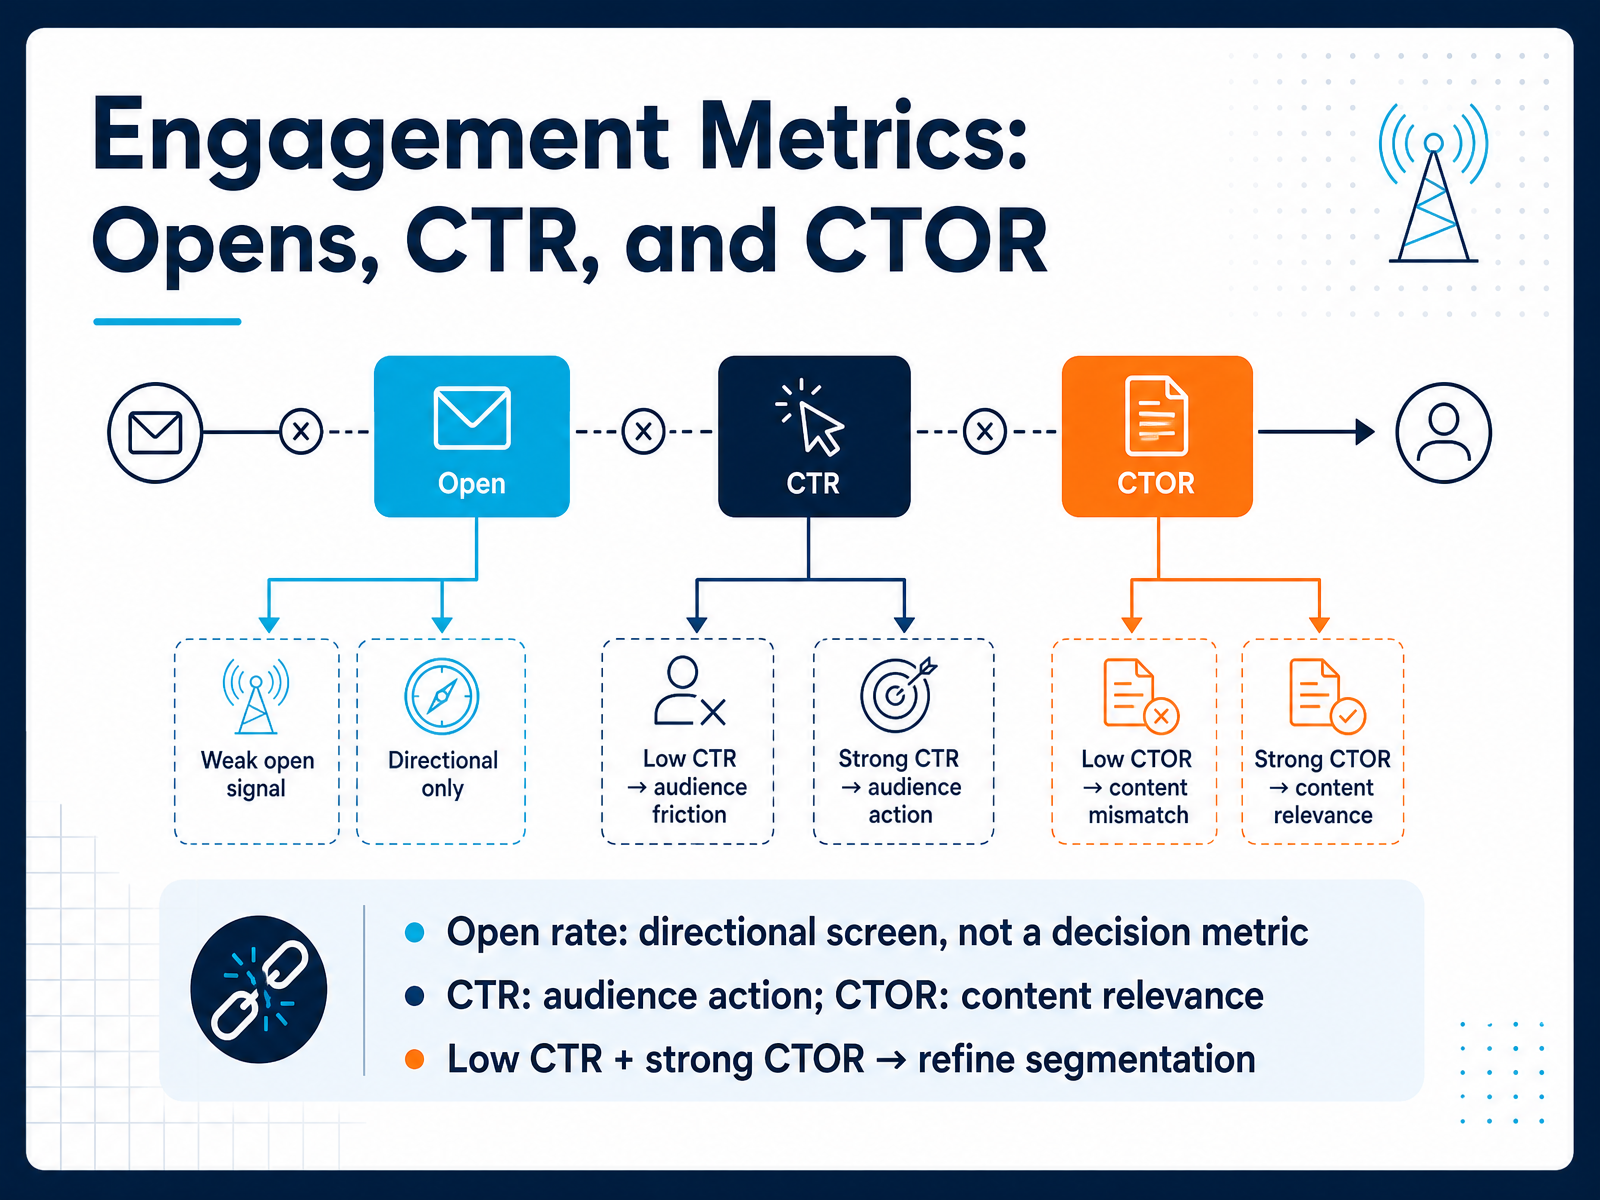
 - 05Engagement Metrics: Opens, CTR, and CTORLet’s turn our attention to engagement metrics. Start with open rate. Treat it as a directional screen, not a decision metric. Privacy changes have made it less precise, so use it to spot trends, not to judge a campaign’s final value. The real action metrics are click-through rate, or CTR, and click-to-open rate, or CTOR. CTR measures the percentage of delivered emails that got a click. It reflects whether your audience took action. CTOR measures clicks among those who actually opened. It isolates content performance. A healthy open rate paired with a low CTOR tells you the subject line worked, but the content or call-to-action lost the pitch. Here’s a useful diagnostic pattern. If CTR is low but CTOR is strong, the message resonates with the people who open it. The problem is you’re reaching the wrong audience. Refine your segmentation. Send to a more relevant subset, and watch both metrics improve. To recap: open rate is a filter, CTR is your audience-level engagement signal, and CTOR is your content-level diagnostic. Use them together, and they point directly at what to fix next. Now let’s shift to conversion and revenue-linked metrics.
 pushwoosh.comwebfx.comblog.hubspot.com+22 min
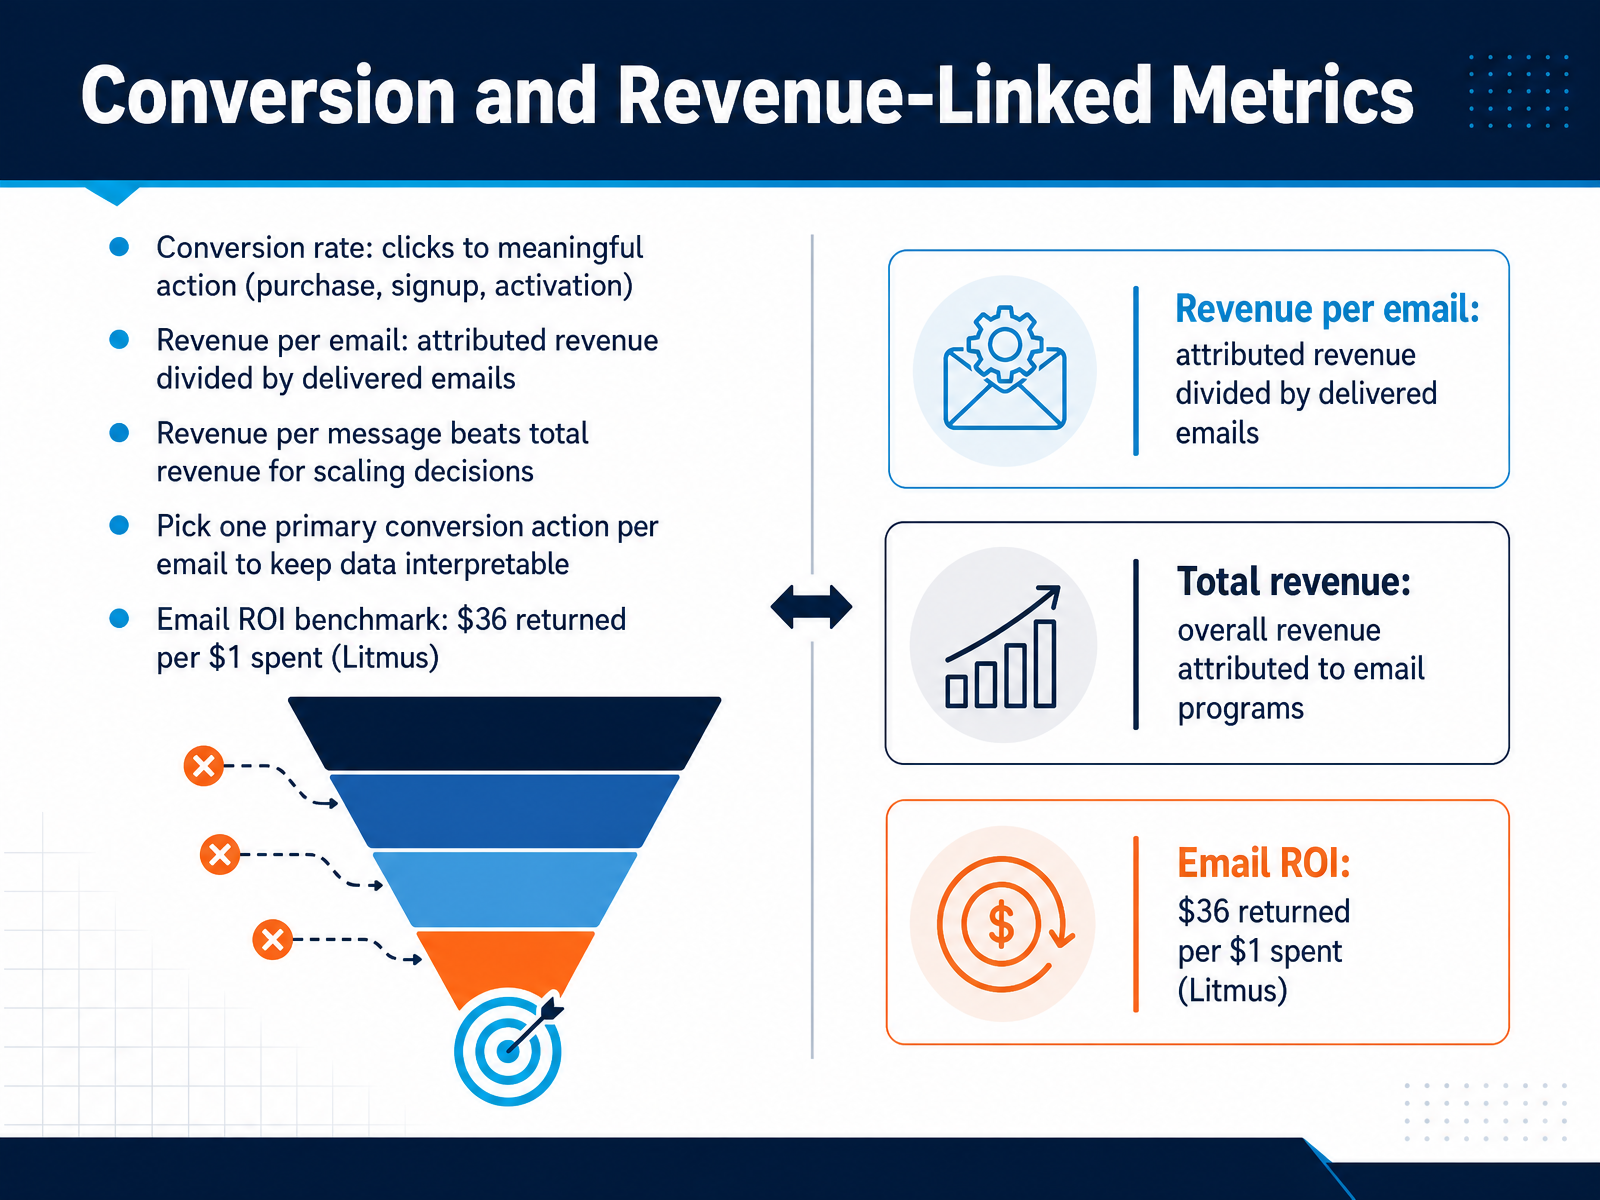
 - 06Conversion and Revenue-Linked MetricsNow we shift from engagement to the metrics that tie email directly to business outcomes. Conversion rate measures the percentage of recipients who click through and complete a meaningful action, whether that's a purchase, a signup, or an activation. This is where email proves its value. For example, if your goal is to drive trial signups, your conversion rate tells you how effectively your email and landing page work together. Next, revenue per email is attributed revenue divided by delivered emails. This is the metric that settles arguments about list size and campaign scale. A broad blast to fifty thousand contacts might generate more total revenue than a targeted send to six thousand, but if the segmented send earns more per delivered email, it's usually the one you should scale. To keep your data interpretable, choose one primary conversion action per email. Multiple competing goals make results impossible to read. And for context, the Litmus benchmark for email return on investment is thirty-six dollars returned for every one dollar spent. That's a strong reference point for evaluating your own program's efficiency. Remember, engagement metrics tell you what people do with your message. Conversion and revenue metrics tell you what that's worth. Next, we'll talk about the measurement infrastructure and data quality you need to trust these numbers.
 pushwoosh.comwebfx.comblog.hubspot.com+21 min
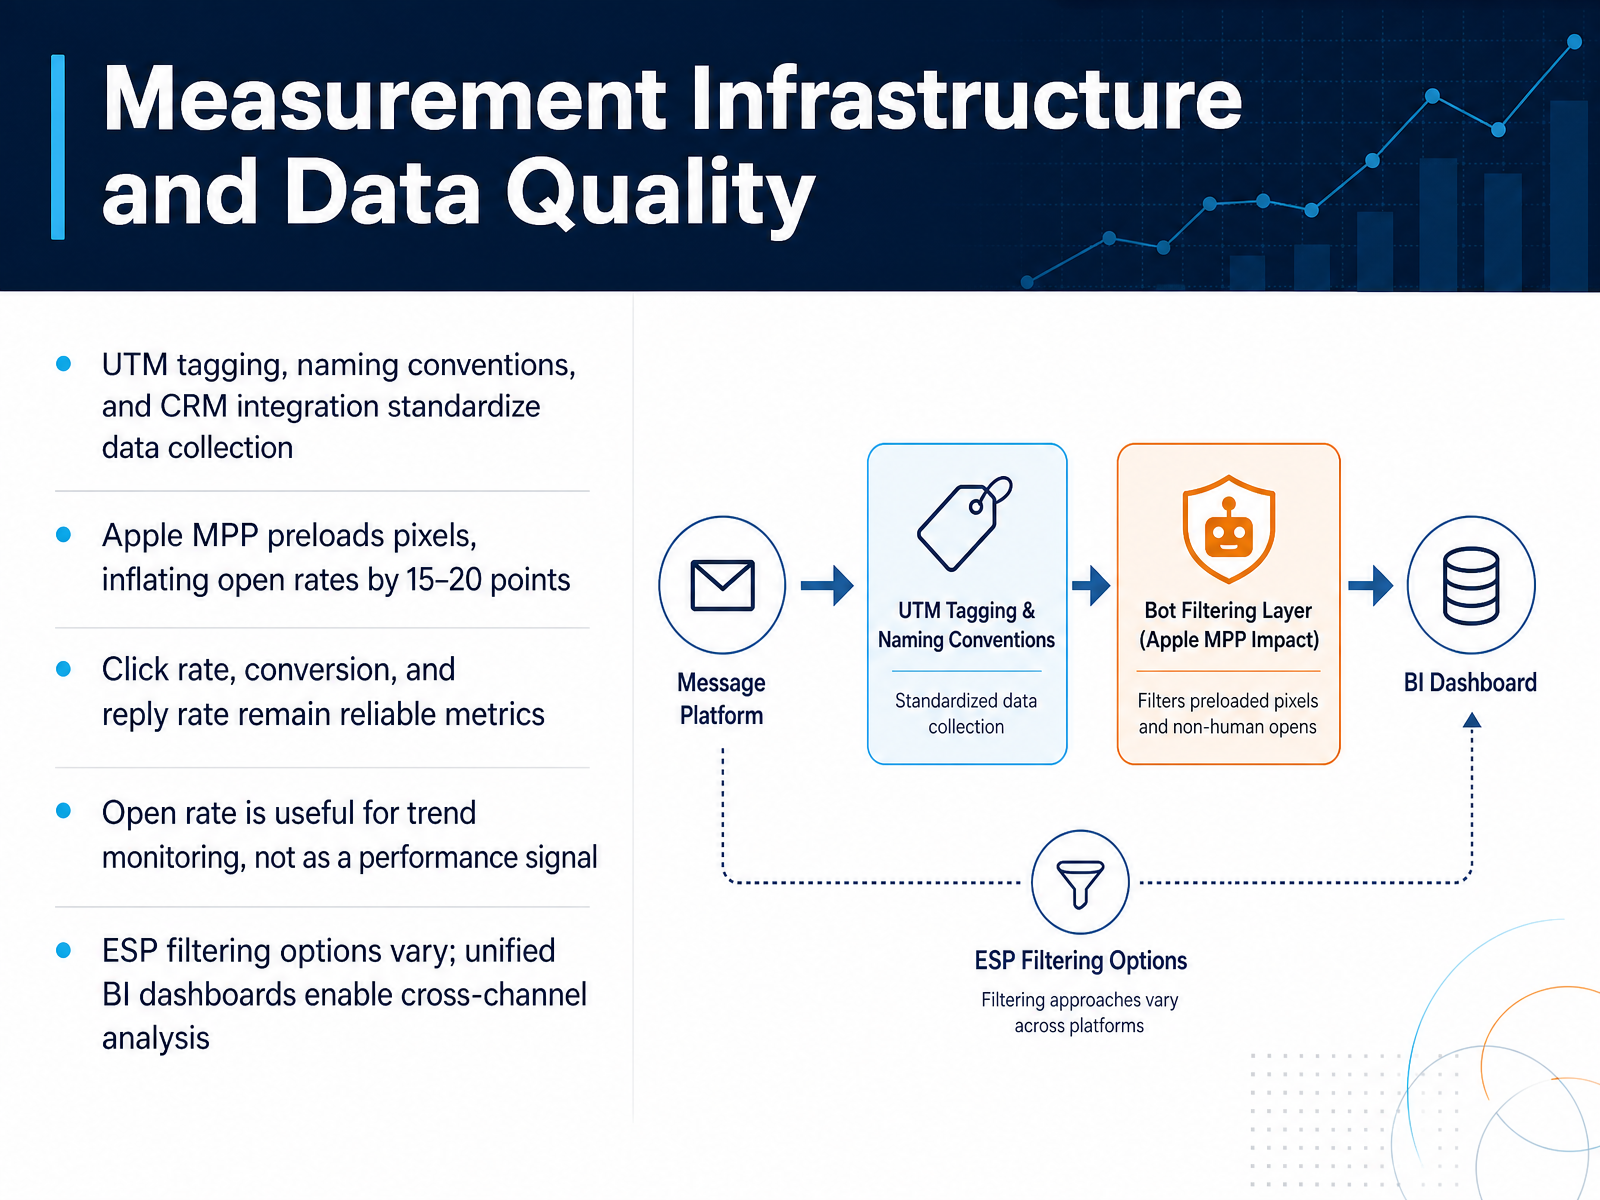
 - 07Measurement Infrastructure and Data QualityLet's talk about measurement infrastructure and data quality, because the metrics you rely on are only as trustworthy as the pipes that deliver them. Start with standardized data collection. Consistent UTM tagging, naming conventions, and CRM integration ensure every click and conversion lands in the same place with the same labels. But here's the catch: Apple's Mail Privacy Protection preloads tracking pixels, inflating open rates by 15 to 20 points. So a reported 45 percent open rate might really mean 25 percent of humans actually read your email. That's why click rate, conversion, and reply rate remain your reliable metrics; they require real intent, which a bot can't fake. Open rate is still useful for trend monitoring and deliverability health, not as a performance signal. A sudden drop of 50 percent indicates a deliverability problem. But don't base A/B test winners or automation triggers on opens. Finally, remember that ESPs vary in how they filter MPP-driven opens. Some let you exclude them; others don't. Unified BI dashboards that pull in click, conversion, and reply data across channels give you the cross-channel view you need to make solid decisions. Next, we'll look at benchmarking against relevant standards, so you know what good actually looks like.
 mailchimp.comsender.netoutsolvi.com+22 min
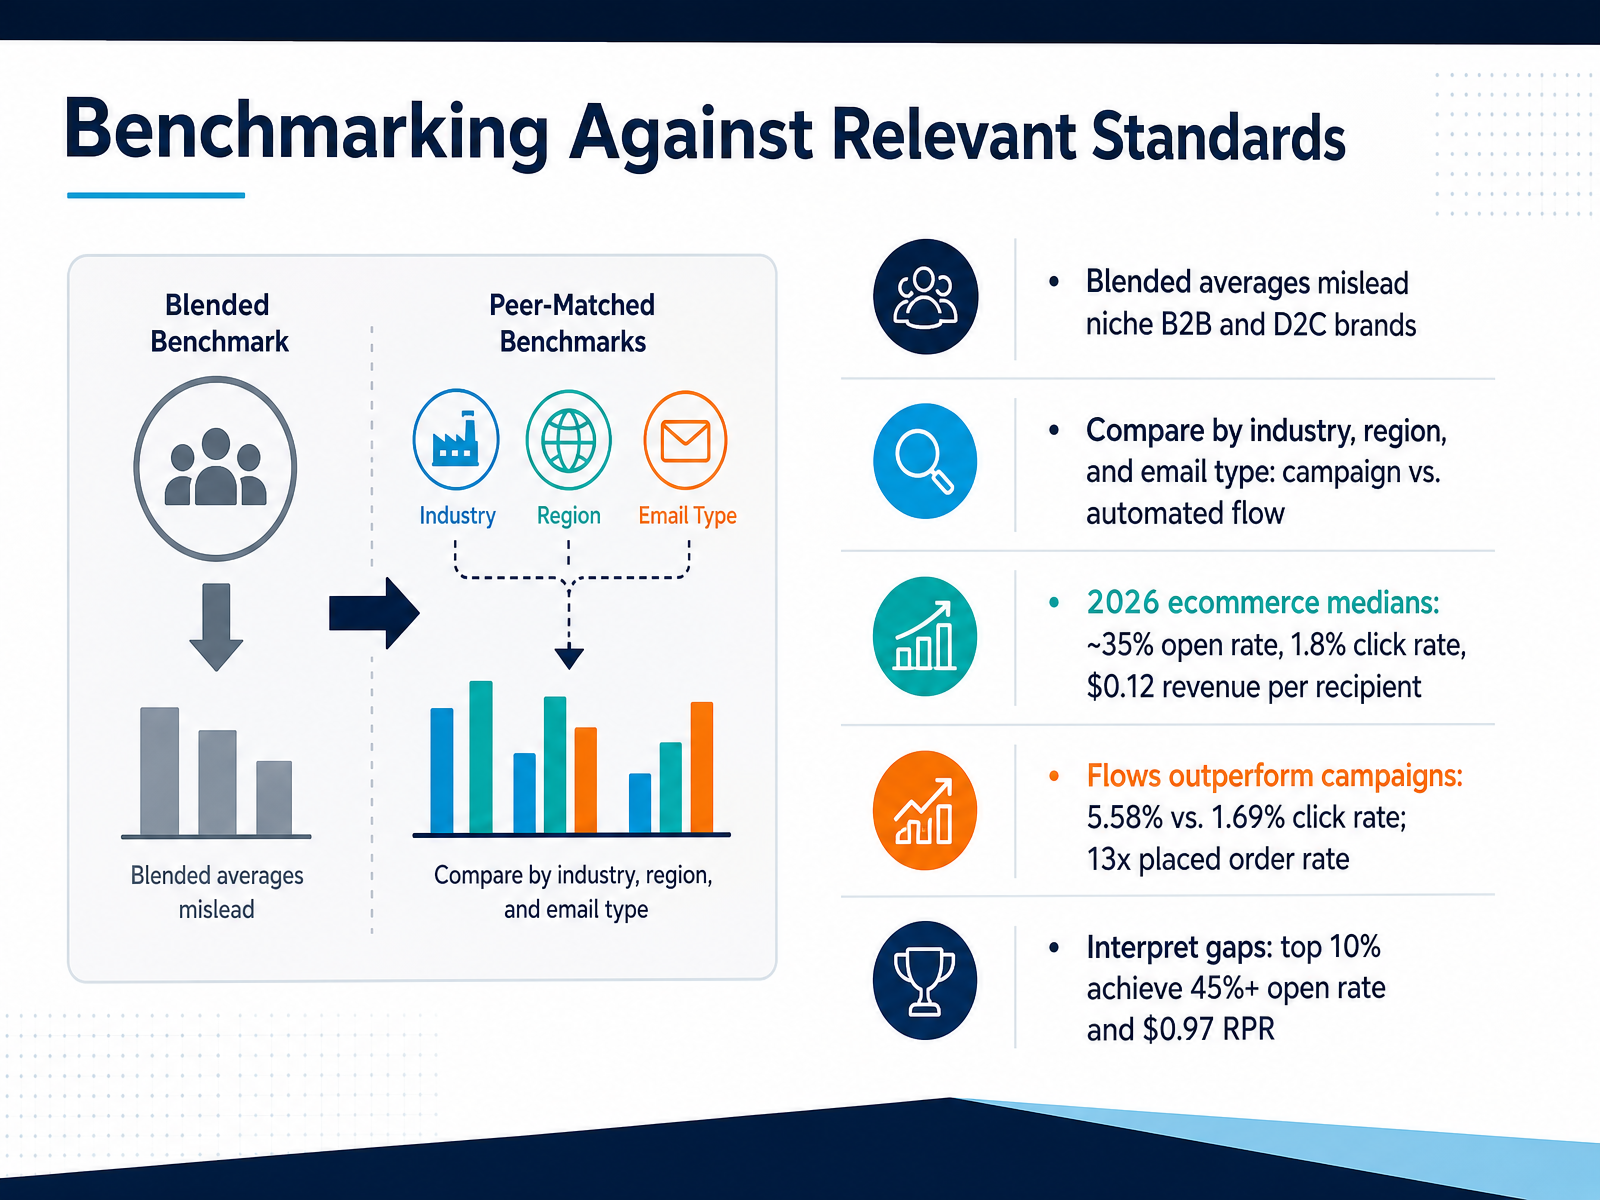
 - 08Benchmarking Against Relevant StandardsBenchmarking against the right standards is where most measurement strategies go wrong. Blended averages across all industries will mislead you, especially if you operate a niche B2B or D2C brand. Your comparison set must match your industry, your region, and critically, the email type. Campaigns and automated flows are fundamentally different animals. In 2026, ecommerce medians sit at roughly thirty-five percent open rate, a one-point-eight percent click rate, and twelve cents revenue per recipient. But flows tell a different story. They outperform campaigns dramatically, delivering a five-point-five-eight percent click rate versus one-point-six-nine, and they drive thirteen times the placed order rate. So when you interpret the gap between your numbers and the benchmark, don't just chase the median. The top ten percent of senders achieve over forty-five percent open rates and nearly a dollar in revenue per recipient. That's not a ceiling. It's a target. Benchmark against your peers, not the average, and let the gap define your optimization roadmap. Next, we'll move from engagement to lifetime value."
 klaviyo.comgeysera.comwebfx.com+21 min
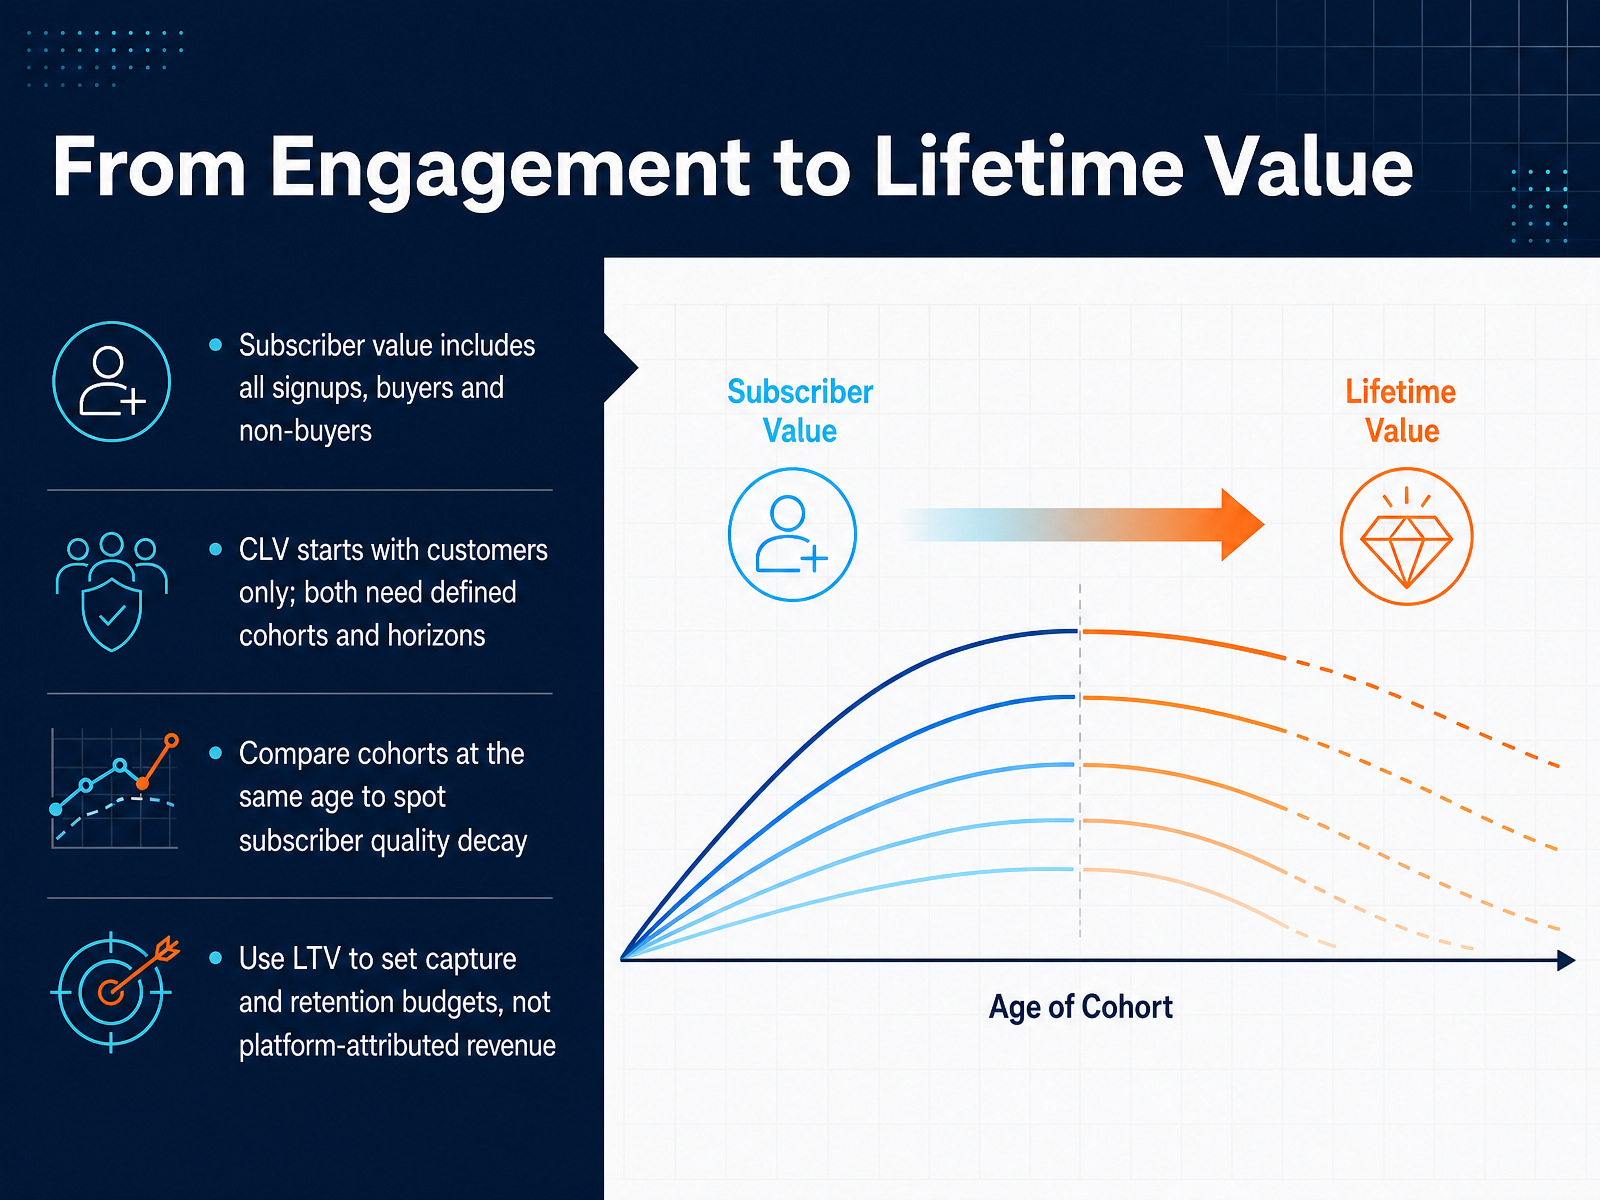
 - 09From Engagement to Lifetime ValueNow let's move from engagement metrics to the bigger picture: subscriber value and customer lifetime value. These two metrics are often confused, but they answer different questions. Subscriber value includes every signup in a cohort, even those who never buy. Customer lifetime value, on the other hand, starts only with customers. Both require defined cohorts, clear time horizons, and a consistent revenue definition. When you compare cohorts, always compare them at the same age. If you look at a twelve-month cohort and a six-month cohort side by side, you're not comparing like with like. That's where subscriber quality decay shows up—when newer cohorts generate less value at the same age than older ones did. Use lifetime value to set your budget for subscriber acquisition and retention. But be careful: platform-attributed revenue is a reporting model, not proof of causation. It tells you what email gets credit for, not what email actually caused. Base your investment decisions on incremental value, measured through holdouts or controlled experiments. The key takeaway: define your populations and horizons before you quote any number. Next, we'll look at attribution models for a multi-channel world.
 agence-deliver.comcount.cocometly.com2 min
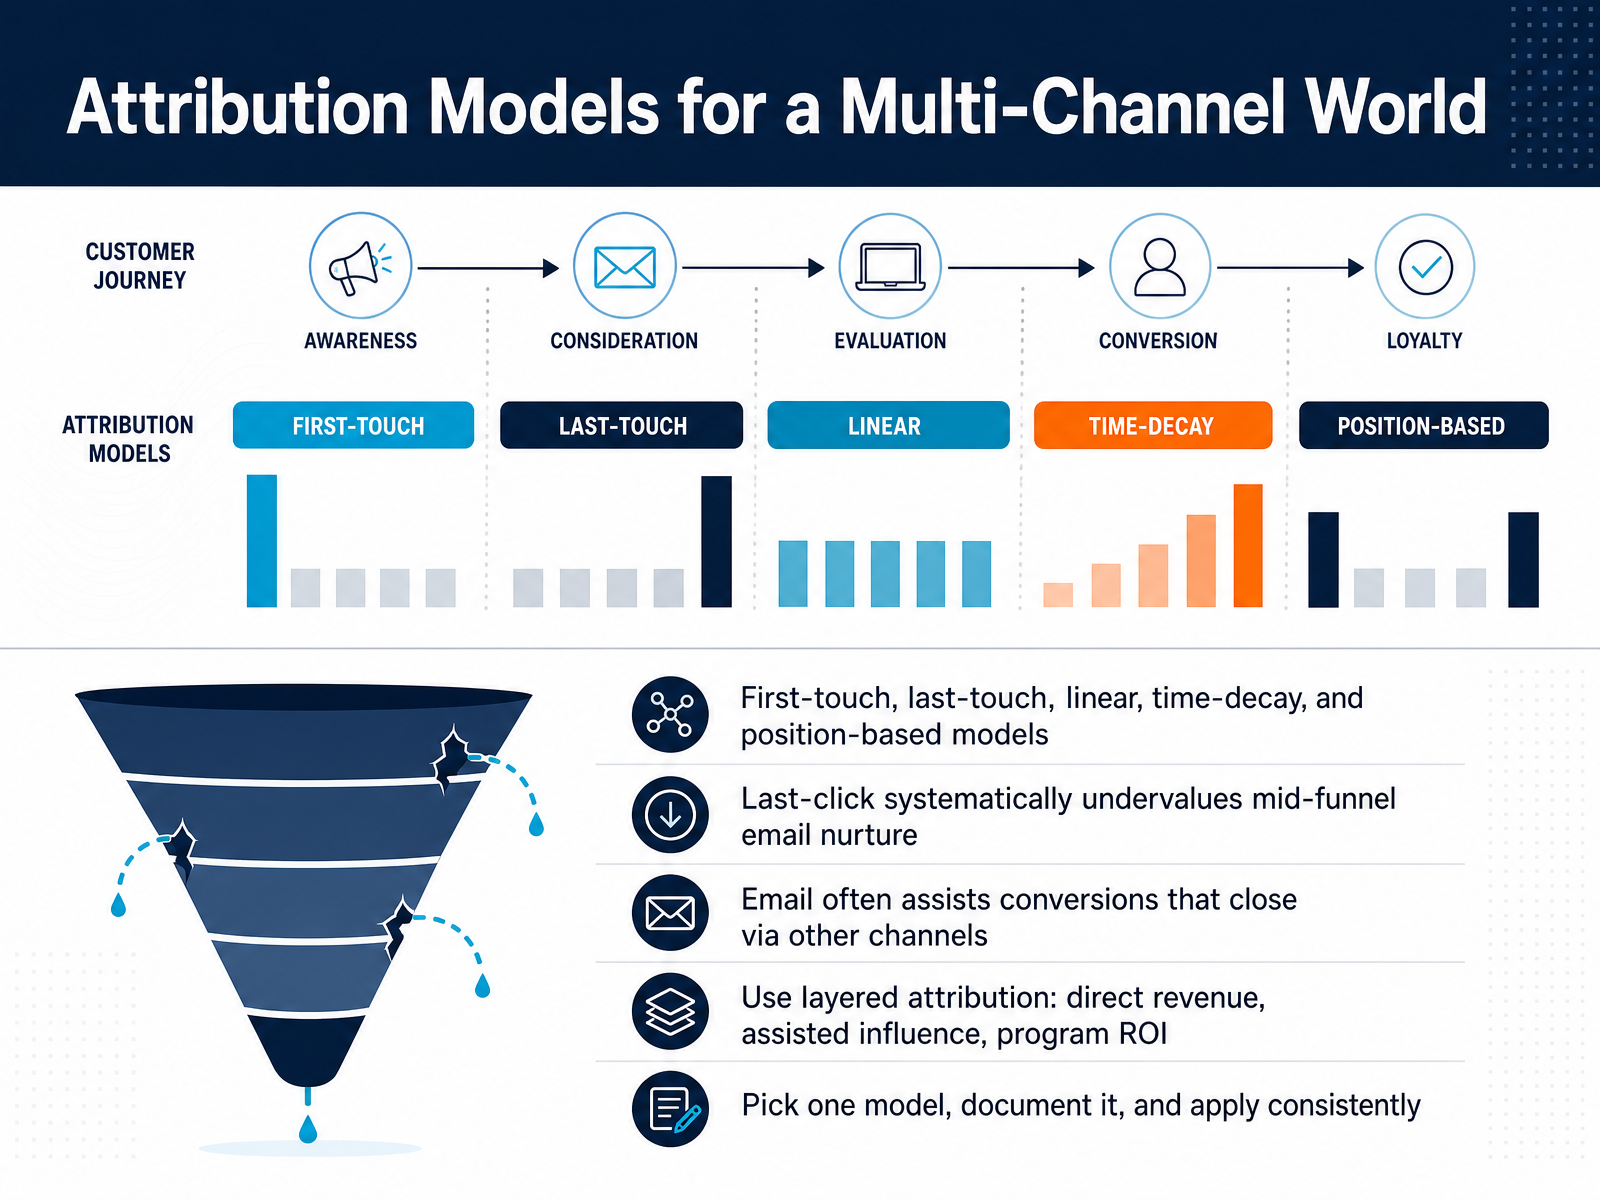
 - 10Attribution Models for a Multi-Channel WorldNow let's talk about attribution models. In a multi-channel world, no single model tells the whole story. First-touch credits the first interaction. Last-touch credits the final click. Linear spreads credit equally. Time-decay favors recent touches. And position-based emphasizes both the first and last. Here's the catch: last-click systematically undervalues email, because email usually works in the middle of the funnel, nurturing leads that close through other channels. So, email often assists conversions rather than finishing them. That's why you need a layered approach. Layer one: direct revenue, based on last-click email. Layer two: assisted influence, where email appears earlier in the journey. Layer three: program-level ROI, which combines the first two with costs for budgeting decisions. The key is to pick one model, document it clearly, and apply it consistently across all your reports. That way, you can compare performance over time without noise. And remember, platform-attributed revenue is a reporting model, not proof of causation. Use a holdout to measure true incrementality. Now, let's look at reading negative signals.
 agence-deliver.comcount.cocometly.com1 min
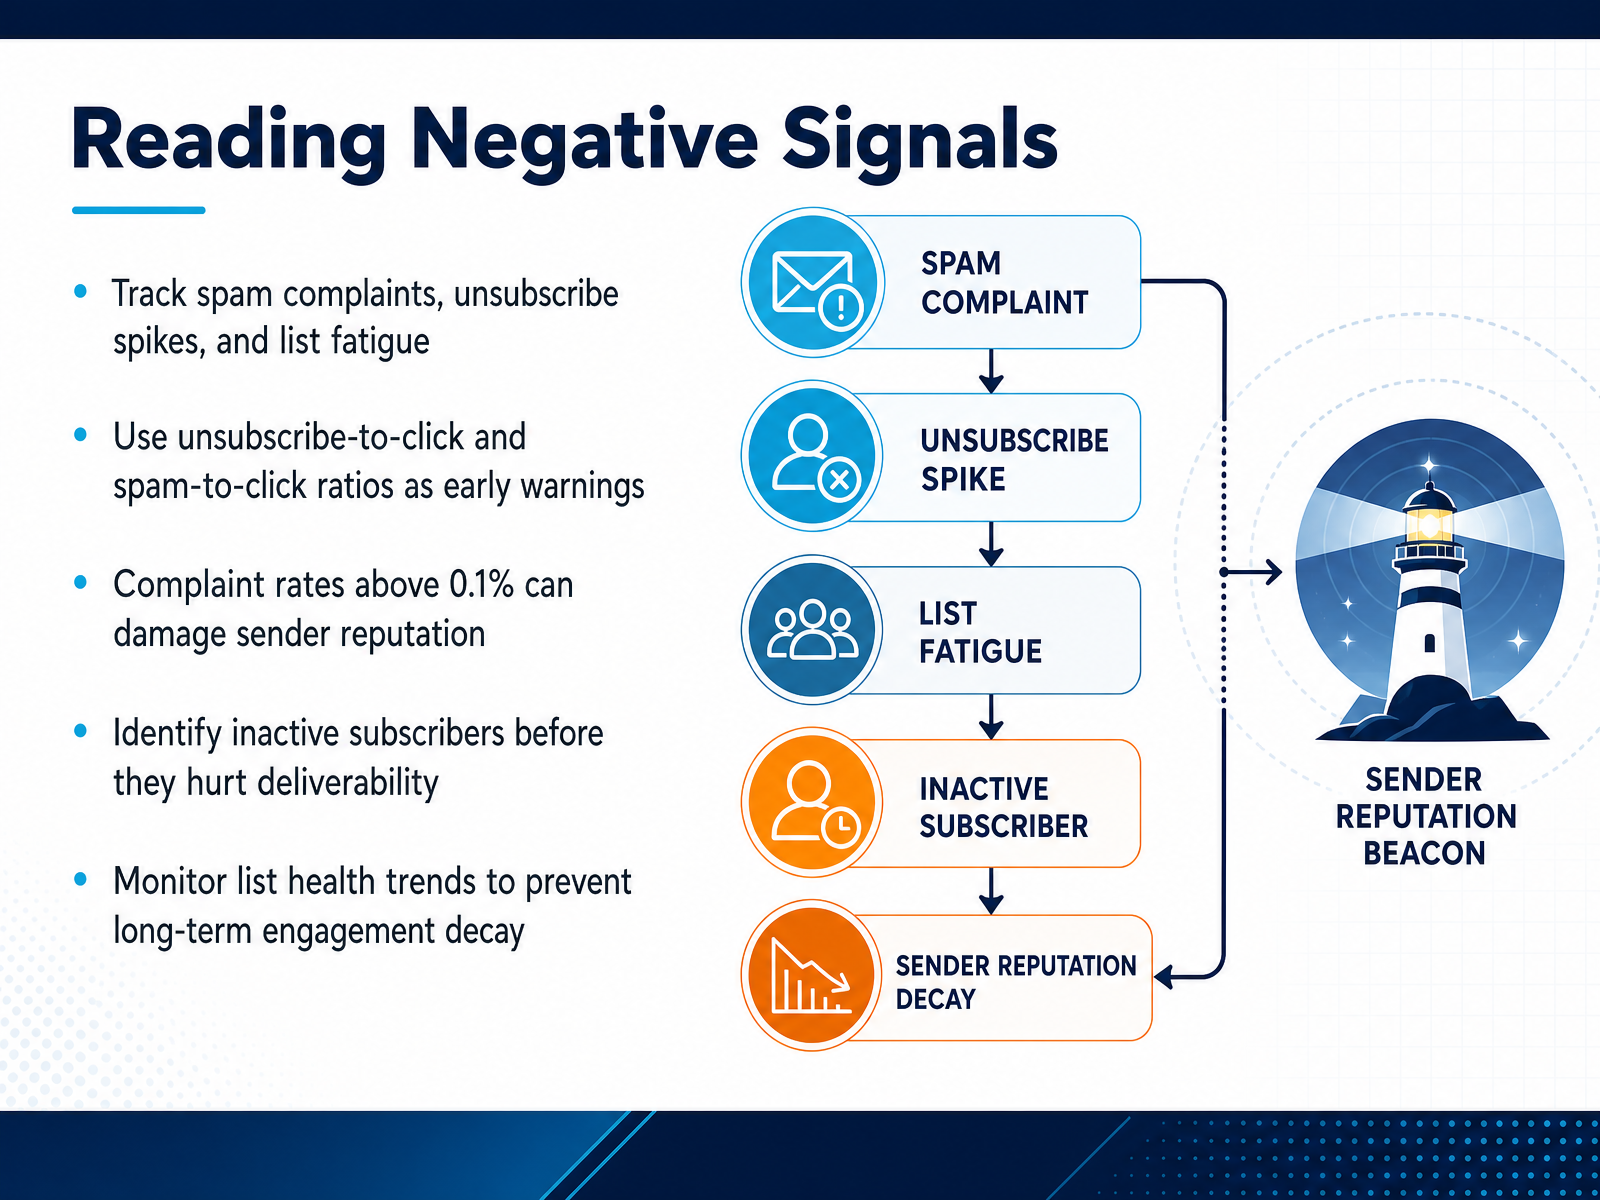
 - 11Reading Negative SignalsNow let's talk about reading negative signals. No campaign performs perfectly, and the numbers that flag trouble are often the most valuable. Track spam complaints, unsubscribe spikes, and the early signs of list fatigue. If unsubscribe rate climbs above one percent in a single send, that's not random; that's your audience telling you the frequency or relevance is off. Even more important: watch the ratios. Unsubscribe to click, and spam to click, give you early warning. When complaints outpace clicks, you have a relevance problem, not a deliverability one. And yes, complaint rates above one tenth of one percent can start damaging your sender reputation, so act before that becomes a pattern. Identify inactive subscribers early. If someone hasn't opened in three months, they're not just disengaged; they're a drag on your future deliverability. Move them to a reactivation flow, or suppress them. Monitor list health trends consistently, because engagement decay rarely happens overnight, it happens quietly, and only the numbers will catch it. Clean lists perform better, so let those negative signals guide your hygiene, not just your campaign postmortems. Next, we'll look at building a statistically valid testing program.
 pushwoosh.comwebfx.comblog.hubspot.com+22 min
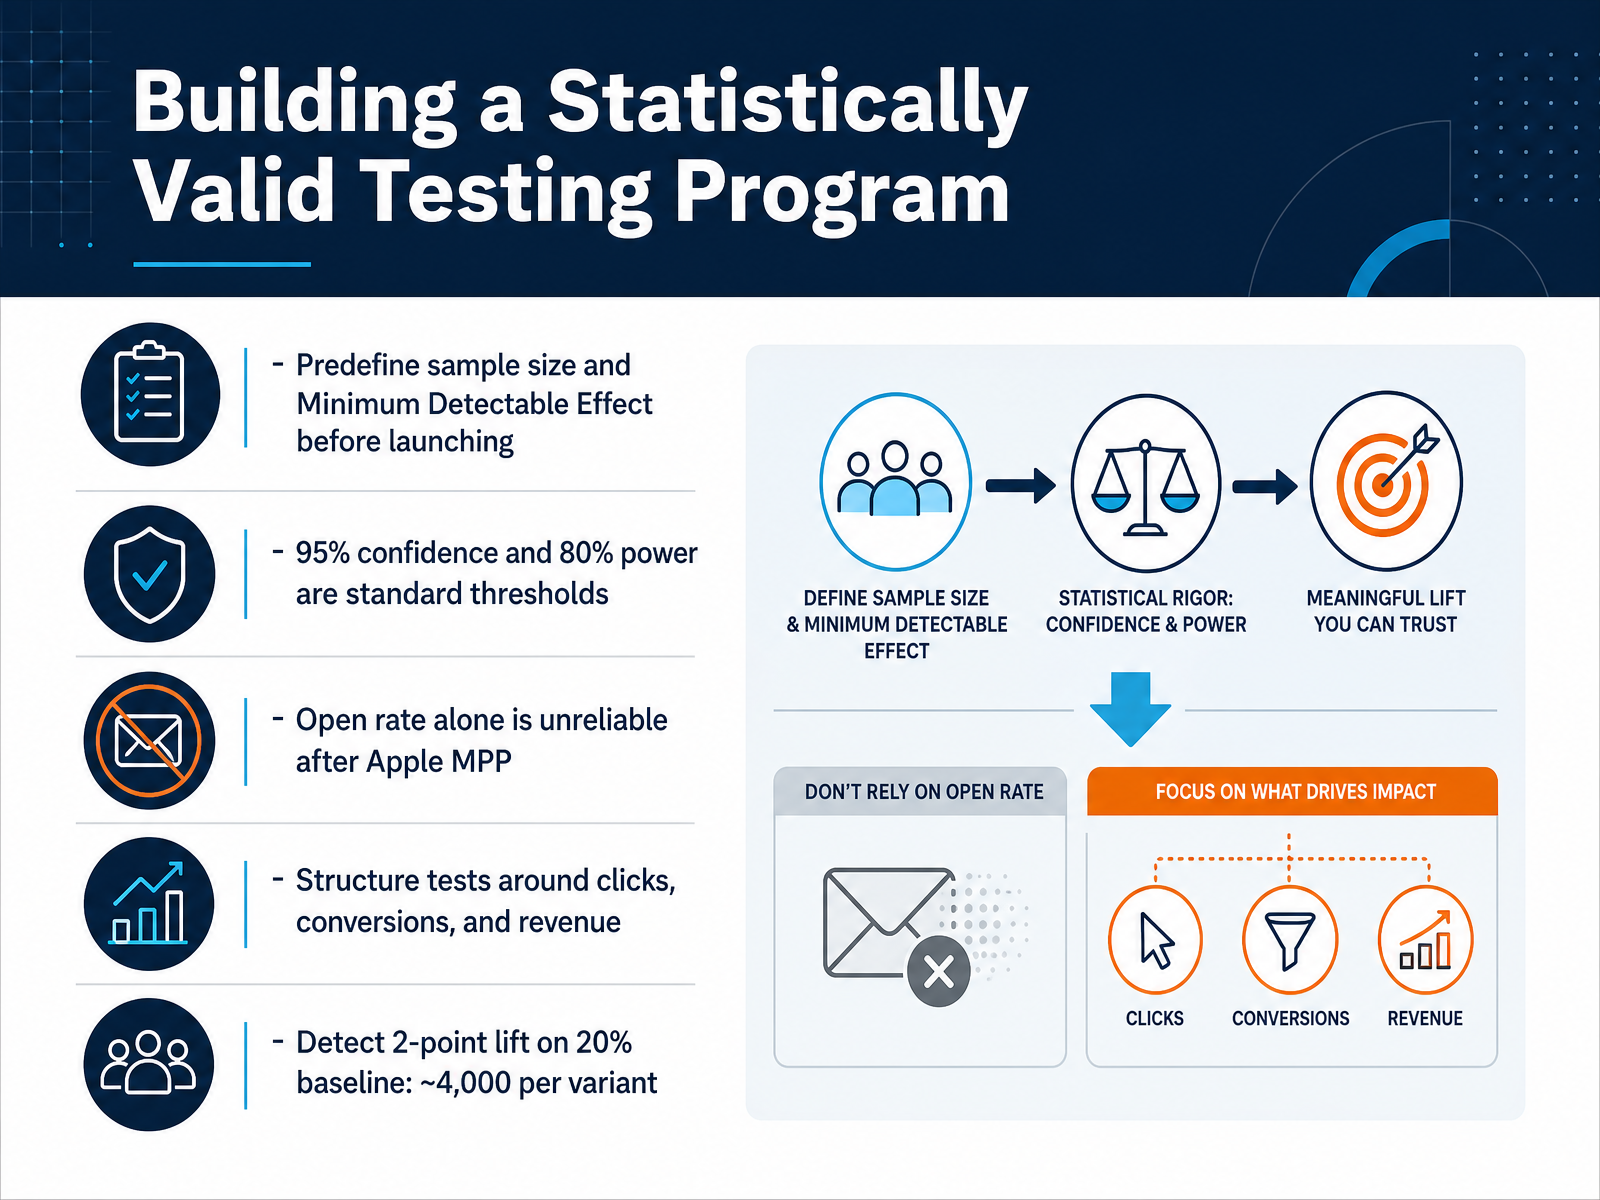
 - 12Building a Statistically Valid Testing ProgramBefore you hit send, define what a meaningful win actually looks like. Predefine your sample size and your Minimum Detectable Effect, or MDE, before launching. The industry standard is ninety-five percent confidence with eighty percent power. That means you accept a five percent false positive risk and retain an eighty percent chance of catching a real lift. Avoid building tests around open rate alone. Since Apple's Mail Privacy Protection, opens are an unreliable signal. Structure your tests around clicks, conversions, and revenue instead. For example, if your baseline click rate is twenty percent and you want to detect a two point lift, you need roughly four thousand contacts per variant. That is eight thousand total for a simple two arm test. Commit to that sample size before the test starts. Do not peek early, and do not extend the test hoping for significance. That inflates your error rate. A disciplined testing program compounds. Next, let's look at how cohort analysis improves retention.
 1 min
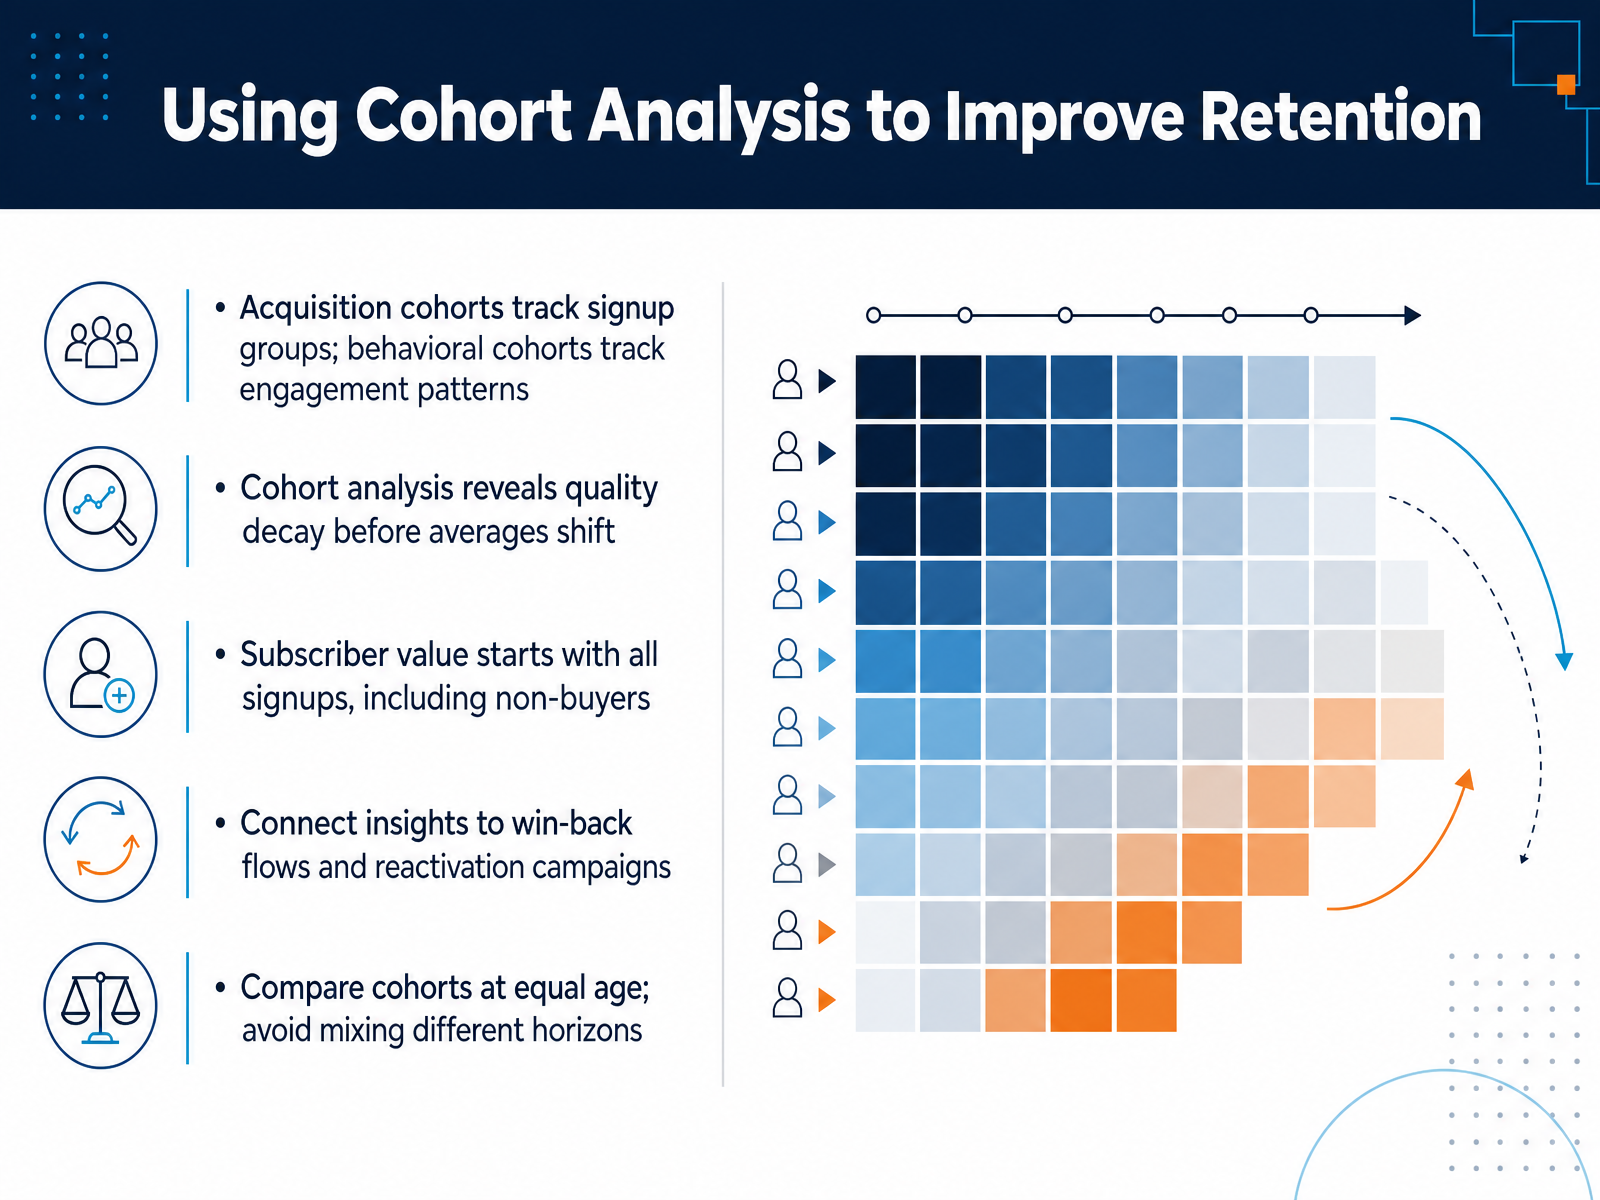
1 min - 13Using Cohort Analysis to Improve RetentionNow let's shift focus to retention. Cohort analysis is how you see the quality of your subscriber base before the averages catch up. Acquisition cohorts group people by signup date. Behavioral cohorts group them by engagement patterns. Use both. The real value is spotting quality decay early. If a recent cohort buys less at the same age than a previous one, you have a signal. You do not wait for the overall average to drop. Start with subscriber value. That means net revenue for the whole signup cohort, including people who never buy. Dividing only by buyers inflates the number and hides the cost of acquisition. Connect these insights to action. When a cohort's engagement drops at month two, trigger your win-back flow earlier. Build reactivation campaigns that target the specific behavior that predicts lapse. One critical rule: compare cohorts at equal age. Mixing a six-month cohort with a twelve-month cohort is not analysis. It is noise. A consistent horizon keeps your comparisons honest. That is how retention problems become measurable, addressable, and fixable. Next, we will look at how to pull all of these metrics into executive dashboards and stakeholder communication.
 agence-deliver.comcount.cocometly.com2 min
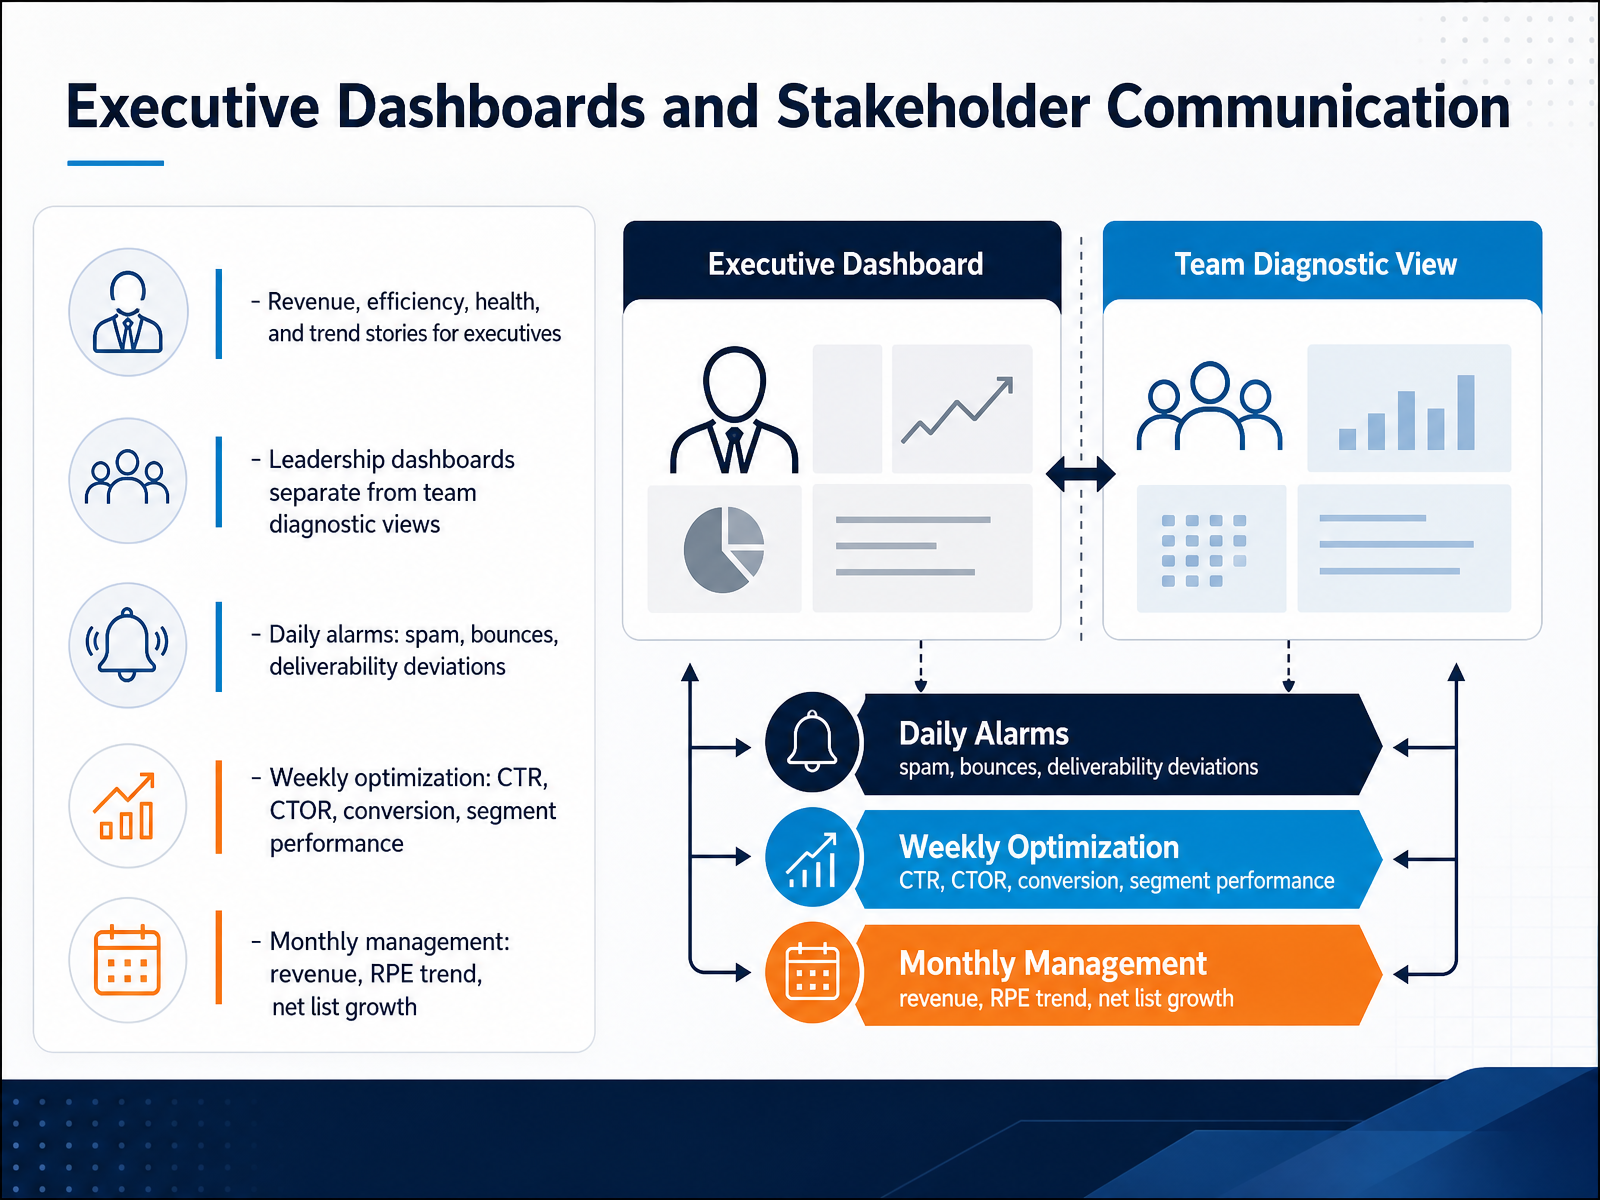
 - 14Executive Dashboards and Stakeholder CommunicationSo how do you take all this data and turn it into a conversation your executives actually want to have? Start by splitting your reporting into three layers. Your leadership dashboard should tell a story about revenue, efficiency, and audience health. Focus on the trend of revenue per email, return on investment direction, and net list growth. These are the numbers that justify budget and strategy. Keep your team’s diagnostic view separate. That is where you dig into click-to-open rate, segment performance, and specific campaign tests. Now, set your cadence. Daily alarms are for stopping the bleeding: spam complaints, hard bounces, and deliverability deviations need immediate attention. Weekly optimization reviews shape the next send, using click-through rate and conversions. Monthly management is the bigger picture: total revenue trends and net list growth. Remember, your leadership dashboard answers one question: is email a growth asset? Keep that view clean, focused, and tied to outcomes, and you will secure the resources you need. Thank you for joining. You now have the framework to measure, interpret, and communicate email performance with real confidence.
 litmus.comblog.hubspot.compushwoosh.com+22 min
Take the deck with you
Download this course as a file — free, no sign-up needed.
- PDF handoutEvery slide page, ready to print or share.15 pages · 3.4 MBDownload
- Narrated PowerPointThe deck that presents itself — every slide carries the digital human's narration video.15 pages · 17.1 MBDownload
- PowerPoint slidesThe full deck as a .pptx — open it in PowerPoint, Keynote, or Google Slides.15 pages · 3.2 MBDownload
Free to use in your own training — please keep the PersonWise credit page at the end.
Have your own deck? Turn it into a course
Sources consulted
Web sources consulted while building this course.
- Email Metrics That Matter: What to Measure in 2026 — litmus.com
- Email analytics: 13 email marketing metrics you should track — blog.hubspot.com
- 13 email marketing metrics every marketer should track in 2026 — pushwoosh.com
- Email marketing reporting: Our top best practices and tool recommendations for 2026 — blog.hubspot.com
- 15 Email Marketing Metrics That Really Matter In 2026 — omnisend.com
- Email Marketing Benchmarks by Industry: 2026 Data and Trends — webfx.com
- Email Marketing Metrics: The 2026 Guide — mailneo.co
- Email Analytics: Metrics, Benchmarks & Frameworks to Boost Email ROI — sender.net
- Apple Mail Privacy Protection (MPP) FAQs | Mailchimp — mailchimp.com
- Apple Mail Privacy Protection: The 2026 Guide to MPP, iOS 18, and the Metrics That Actually Matter — sender.net
- Why Apple Mail says everyone opened your email | Outsolvi — outsolvi.com
- Why Email Open Rates Are Broken in 2026 | SenderReputation.org — senderreputation.org
- Are Email Open Rates Dead? [2026 Data + Apple MPP] — geysera.com
- 2026 Email Marketing Benchmarks by Industry - Klaviyo — klaviyo.com
- Email Marketing Benchmarks by Industry [2026 Data] — geysera.com
- Email Marketing Benchmarks by Industry 2026 | Visionary — visionary-marketing.co.uk
- Email marketing benchmark report 2026: Open rates, CTR & ROI across 12 industries — siteimpact.com
- Customer Lifetime Value for Email Marketing: A Guide | Deliver — agence-deliver.com
- Email CLV: Calculate & Maximize Lifetime Value | Count — count.co
- Email Marketing Attribution Measurement: A Setup Guide — cometly.com