Excel Spreadsheet Creation Workflow
Begin
14 pages · ~28 min
Excel Spreadsheet Creation Workflow
Learn to create Excel spreadsheets from scratch using a practical, step-by-step workflow designed for beginners seeking foundational spreadsheet skills.
What you’ll learn
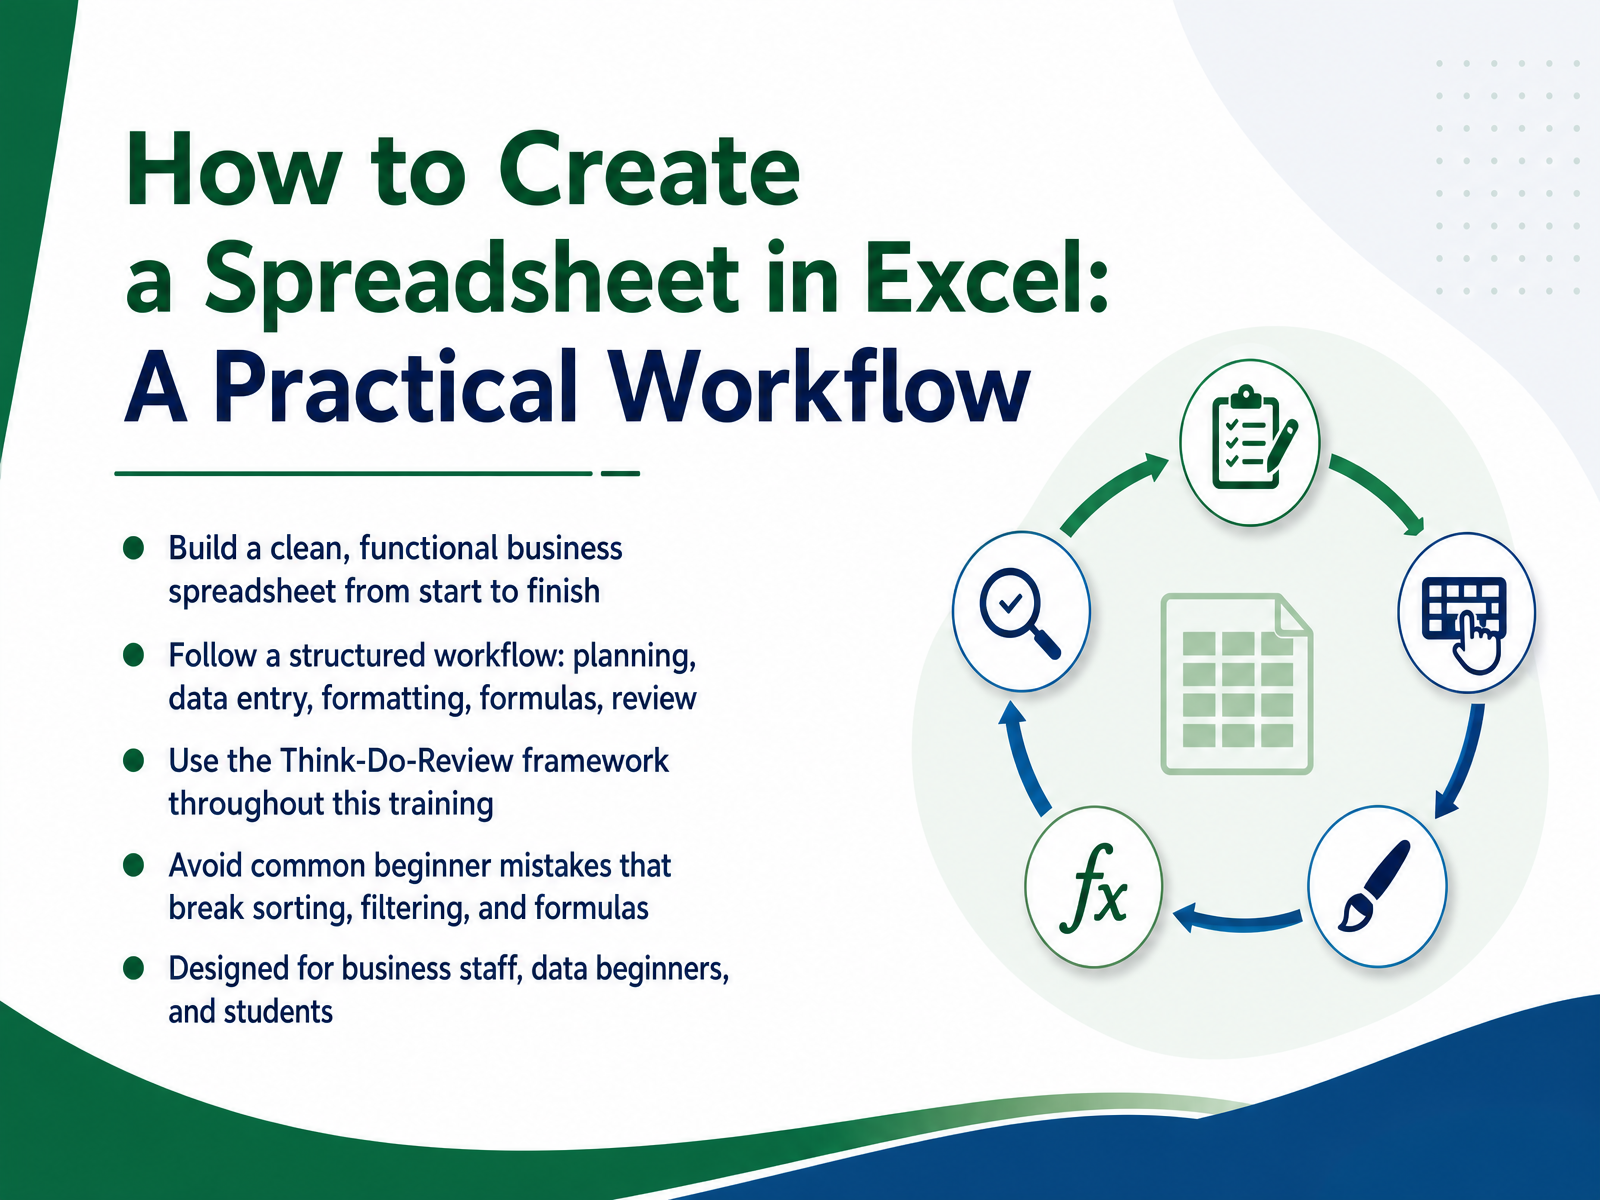
- 01How to Create a Spreadsheet in Excel: A Practical WorkflowWelcome. If you've ever felt that spreadsheets look complicated, you're in the right place. This training is all about building a clean, functional spreadsheet step by step. We'll follow a simple workflow: planning, data entry, formatting, formulas, and review. This keeps everything organized and easy to fix. You'll also learn to avoid common beginner mistakes, like merging cells or typing numbers as text, which can break sorting and calculations. This course is designed for business staff, data beginners, and students. We'll keep things practical and clear. By the end, you'll have a spreadsheet you can actually use at work or school. Let's get started. Next, we'll take a quick look at the Excel interface before you build anything.makeuseof.comdatacamp.comxplorexcel.com+21 min
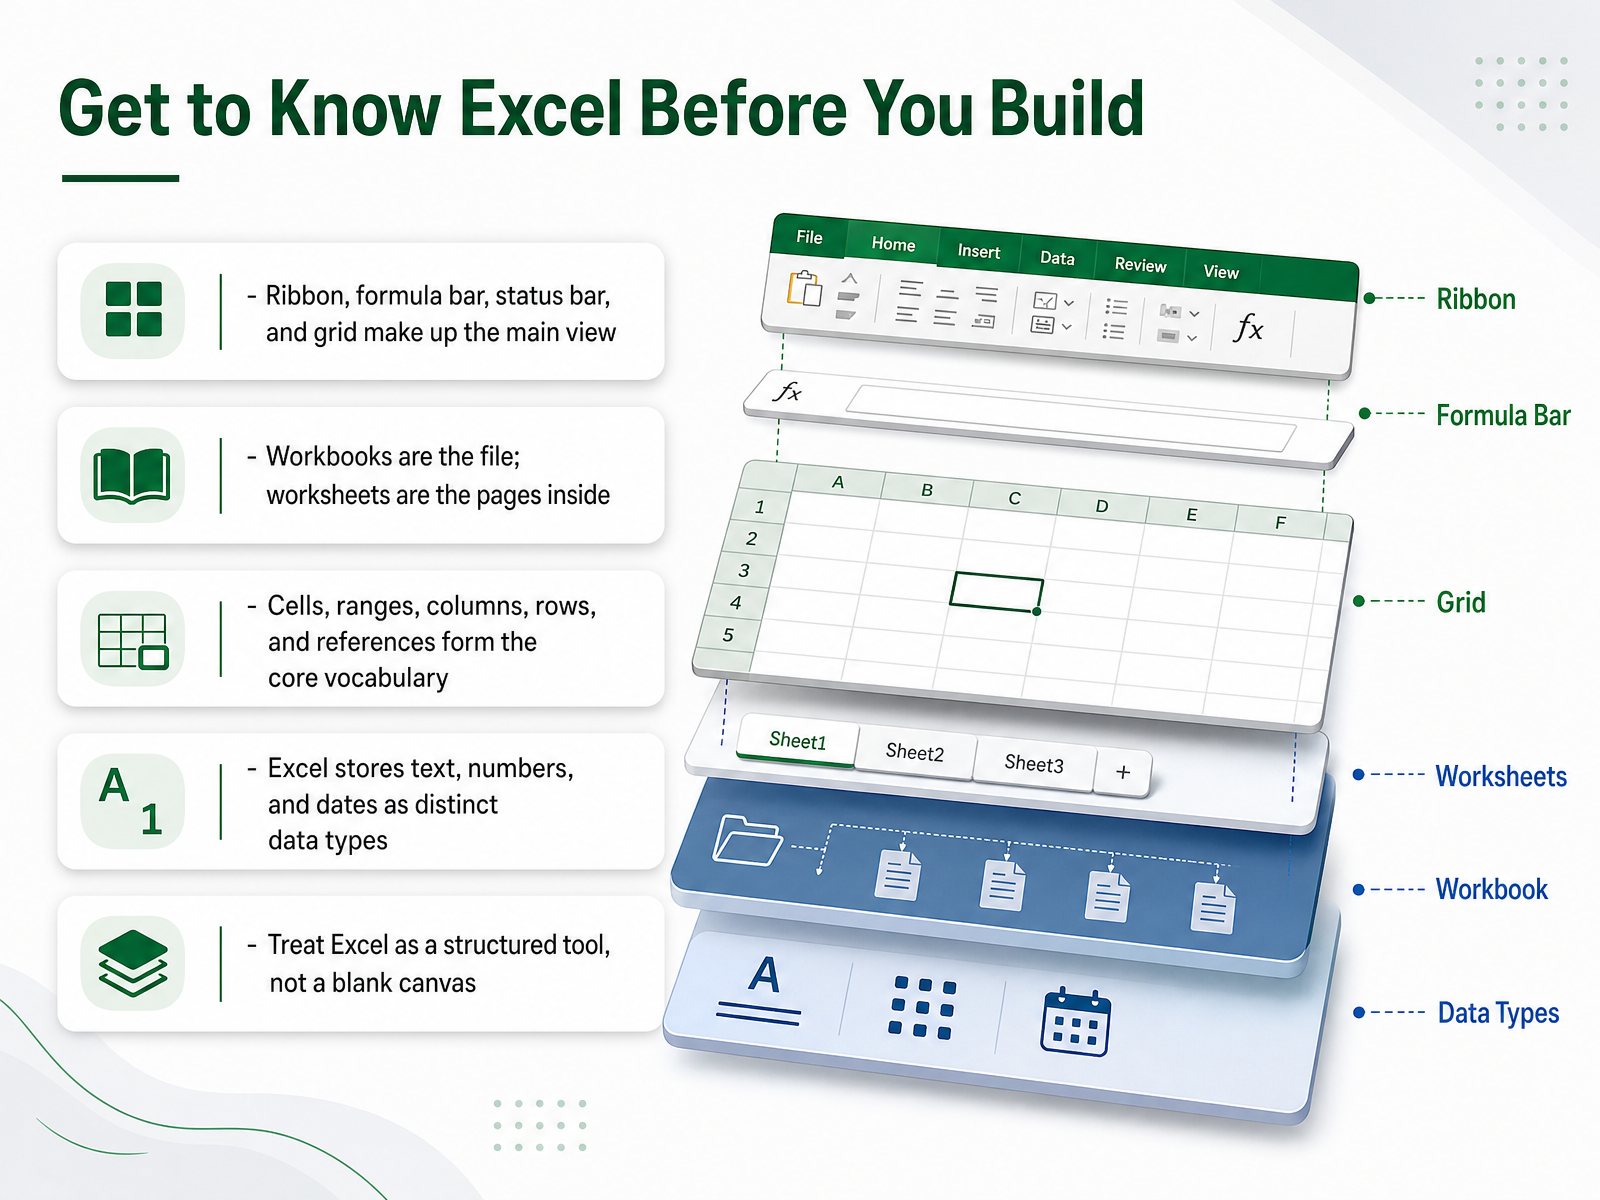
- 02Get to Know Excel Before You BuildBefore you type a single number, it helps to understand the space you are working in. Think of Excel as a structured tool, not a blank canvas. The main view is made of a few key parts. Across the top is the Ribbon, with tabs for commands like inserting charts or applying formulas. Below that, you'll see the formula bar, which shows what is truly inside the selected cell. The status bar at the bottom gives you quick calculations. And the grid itself is where all the work happens. Now, here is a mental shortcut: your file is the workbook, and each tab at the bottom is a worksheet, like pages inside a book. The core vocabulary is simple. Columns run up and down, rows run side to side, and where they meet is a cell. You refer to a cell by its column letter and row number. We call a group of them a range, and that address is what we use in formulas. Finally, remember that Excel treats data in types. Text, a number, and a date look similar but behave differently. Know which type you are working with, and your spreadsheet will act predictably. With this map in your head, you are ready to plan your structure. Next, we will talk about defining the purpose before you type.
 techcommunity.microsoft.comneowin.nettechcommunity.microsoft.com+22 min
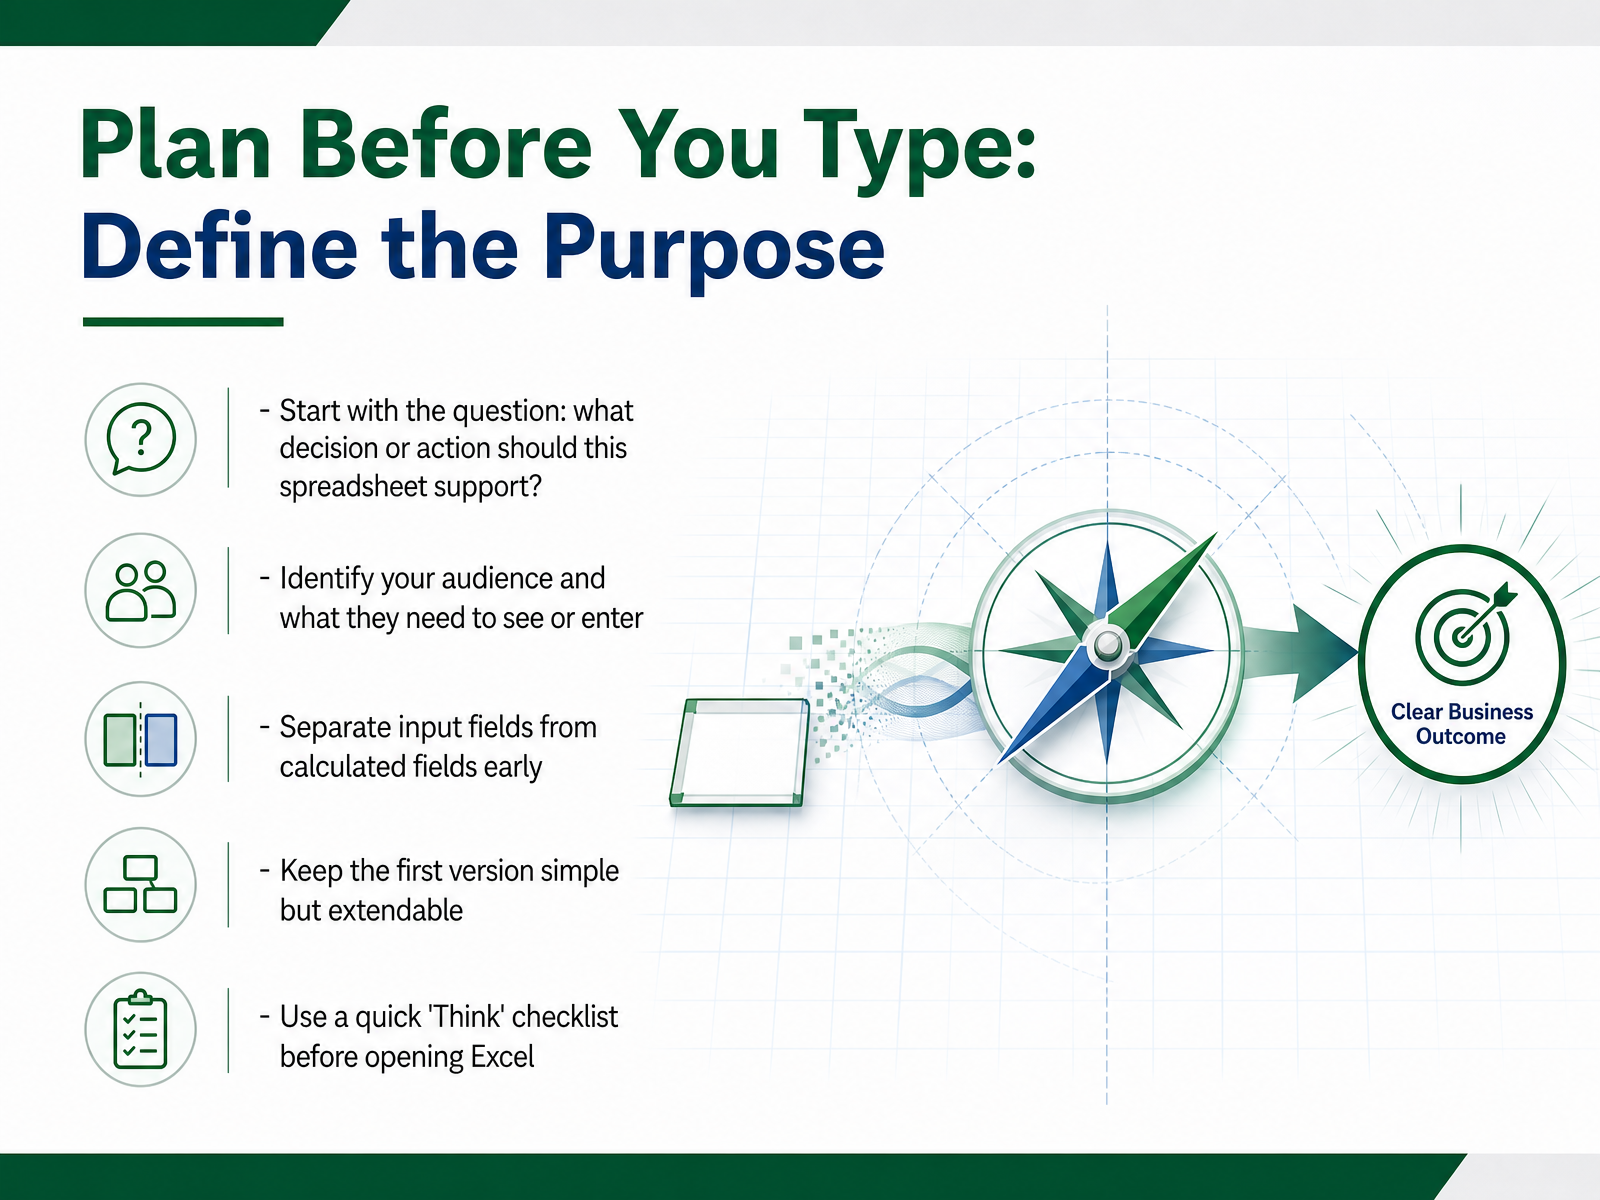
 - 03Plan Before You Type: Define the PurposeNow, before you open Excel, let's take a moment to plan. Ask yourself one question: what decision or action should this spreadsheet support? That's your north star. Next, think about your audience. Will they only read the numbers, or will they need to enter data themselves? Knowing this tells you what to show and what to keep out of sight. Here's a key habit: separate input fields from calculated fields from the very beginning. Inputs are things you type in; calculated fields are formulas that do the work. Keep them apart, and your sheet stays predictable. Also, resist the urge to build everything at once. Start simple, but leave room to grow. A clean first version is much easier to extend than a messy one. So, before you type a single number, run through a quick think checklist. What's the purpose? Who's using it? What data goes in, and what formulas turn that data into answers? Answer those four questions first, and you've already avoided the most common beginner mistakes. With a clear plan in hand, you're ready to sketch the structure: columns as fields, rows as records.
 howtogeek.compresago.comlearnexcel.io+22 min
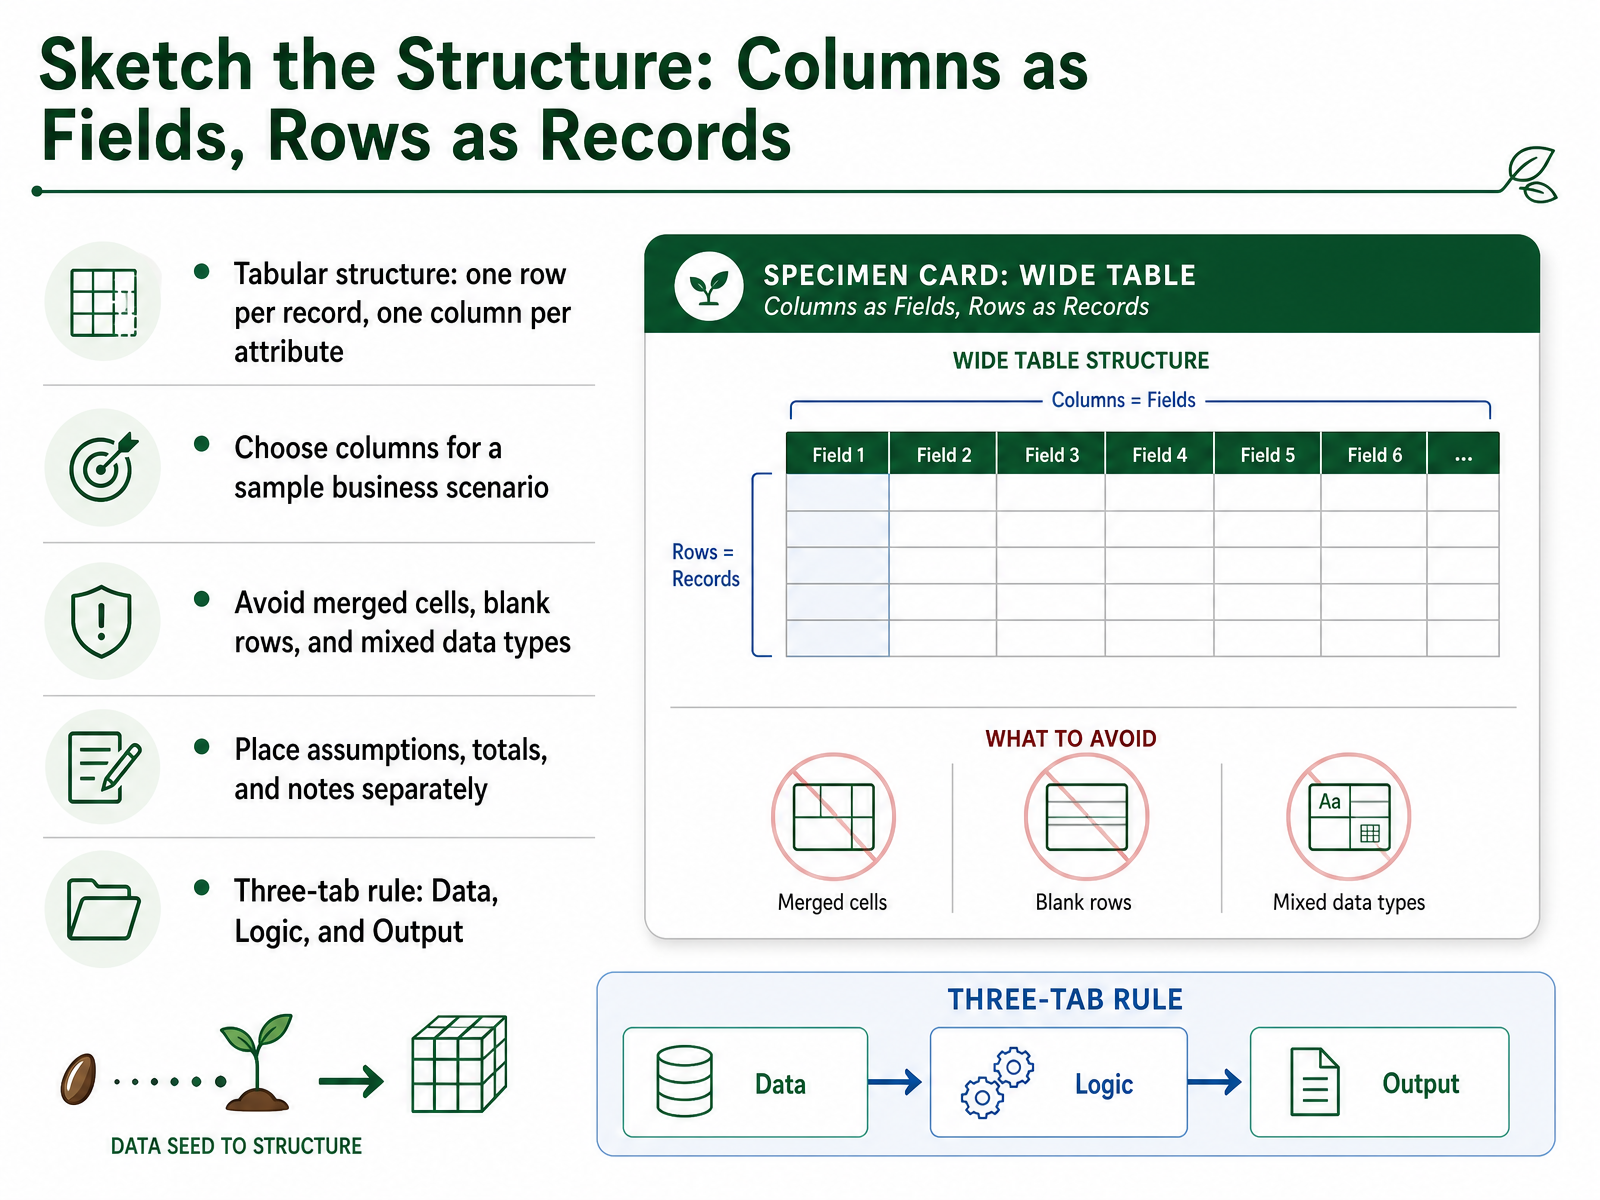
 - 04Sketch the Structure: Columns as Fields, Rows as RecordsNow let’s sketch the structure before we type anything. Think of a spreadsheet as a table. Each row is one record, like a single sale or one customer. Each column is a field, like the date, the product name, or the amount. Pick columns that match your business scenario. For instance, if you track orders, use columns like Order ID, Customer, Product, Quantity, and Price. And here’s the important part: keep the table clean. Avoid merged cells, blank rows, and mixing different data types in one column. A column should hold only dates, or only numbers, or only text, never a mix. Put assumptions, notes, and totals somewhere else, not inside your data table. A simple way to stay organized is the three-tab rule. Use one sheet for raw data, one for calculations, and one for the final output. This keeps your spreadsheet easy to audit and easy to update. Next, we’ll set up your workbook with these three tabs from the start.
 xplorexcel.comhowtogeek.comhelpme.safeoffice.de+21 min
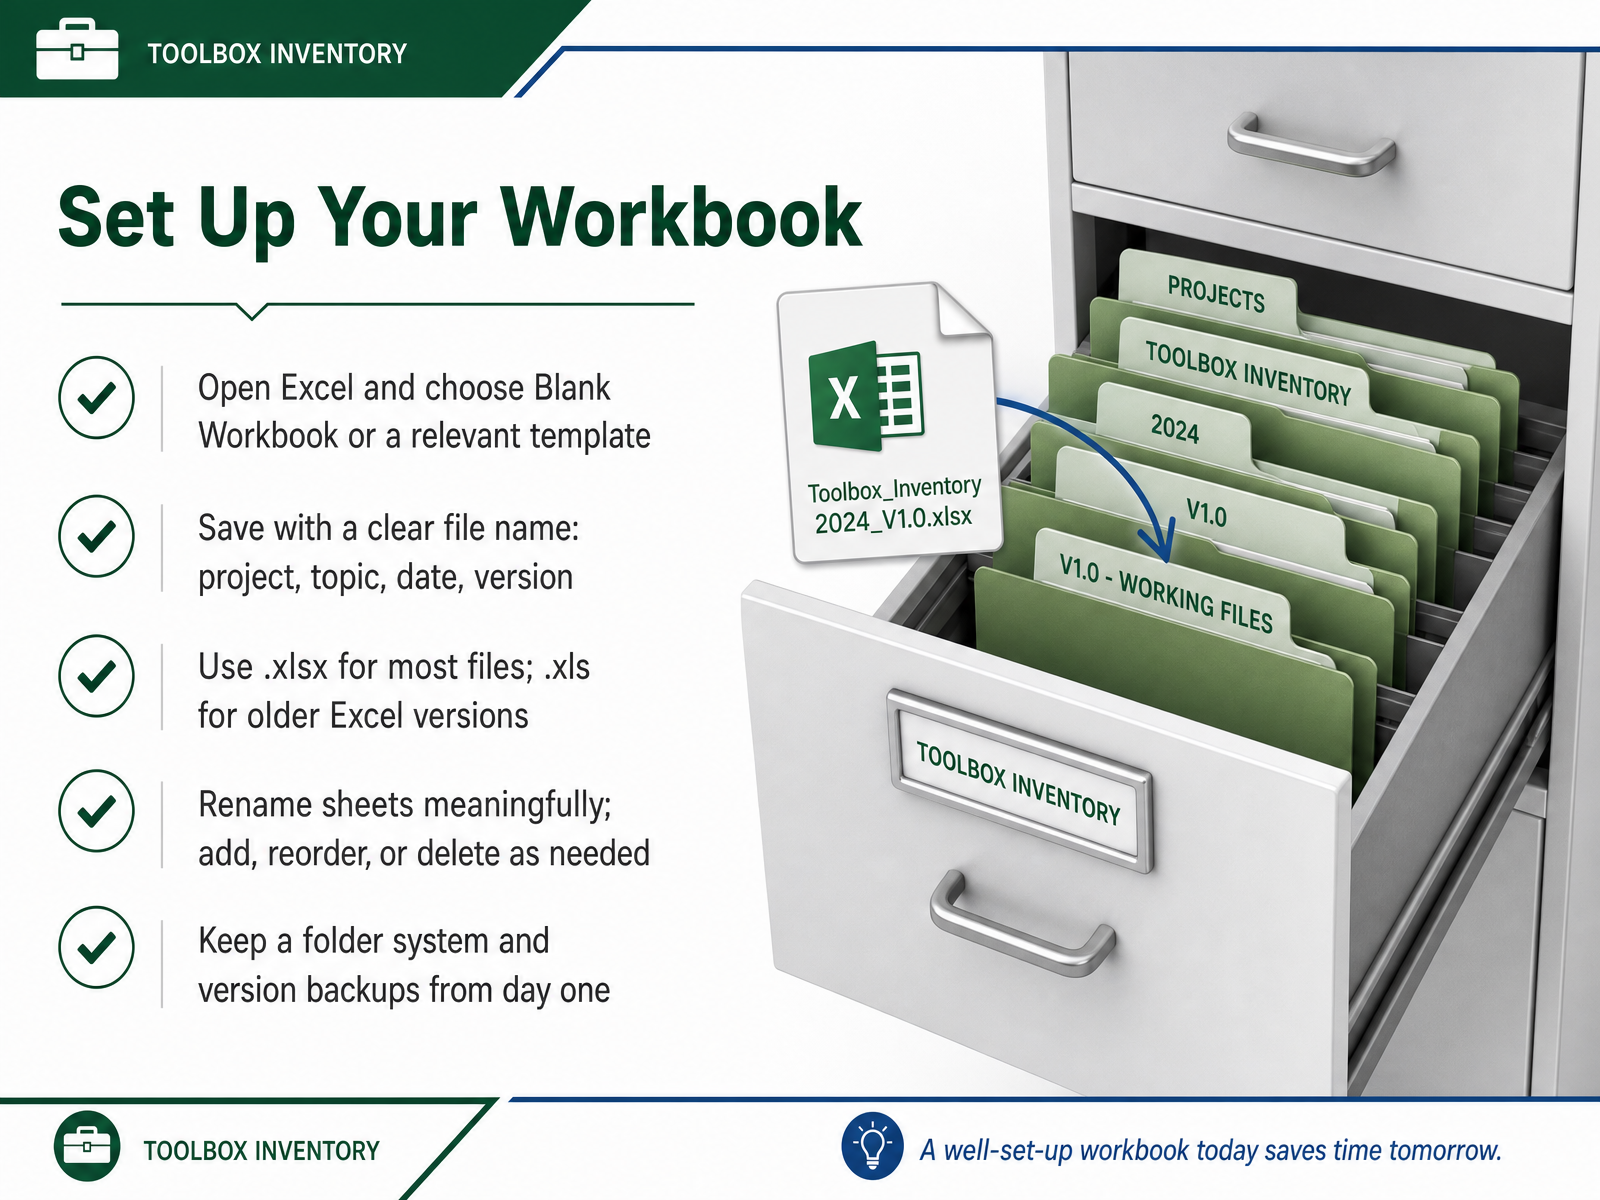
 - 05Set Up Your WorkbookNow that you're ready to build, the first step is setting up your workbook. Start Excel and choose a blank workbook, or pick a template if your task has a familiar structure. The moment you create the file, give it a clear name. Include the project, the topic, the date, and a version number. Something like "Q3 Sales Report 2025 v1" tells you everything at a glance. Save it in the modern .xlsx format for most work, and only use .xls if you know someone needs an older version. Next, look at the sheet tabs at the bottom. Rename them with meaningful labels like "Inputs," "Calculations," and "Summary." Add a new sheet with the plus icon, and drag the tabs to put them in the order you'll use them. Finally, set up a folder for this project on your computer. From day one, keep version backups so that if something goes wrong, you can step back to an earlier copy. A little structure now saves a lot of confusion later. Once your workbook is organised, it's time to start entering and organising your data.
 xplorexcel.comhowtogeek.comhelpme.safeoffice.de+21 min
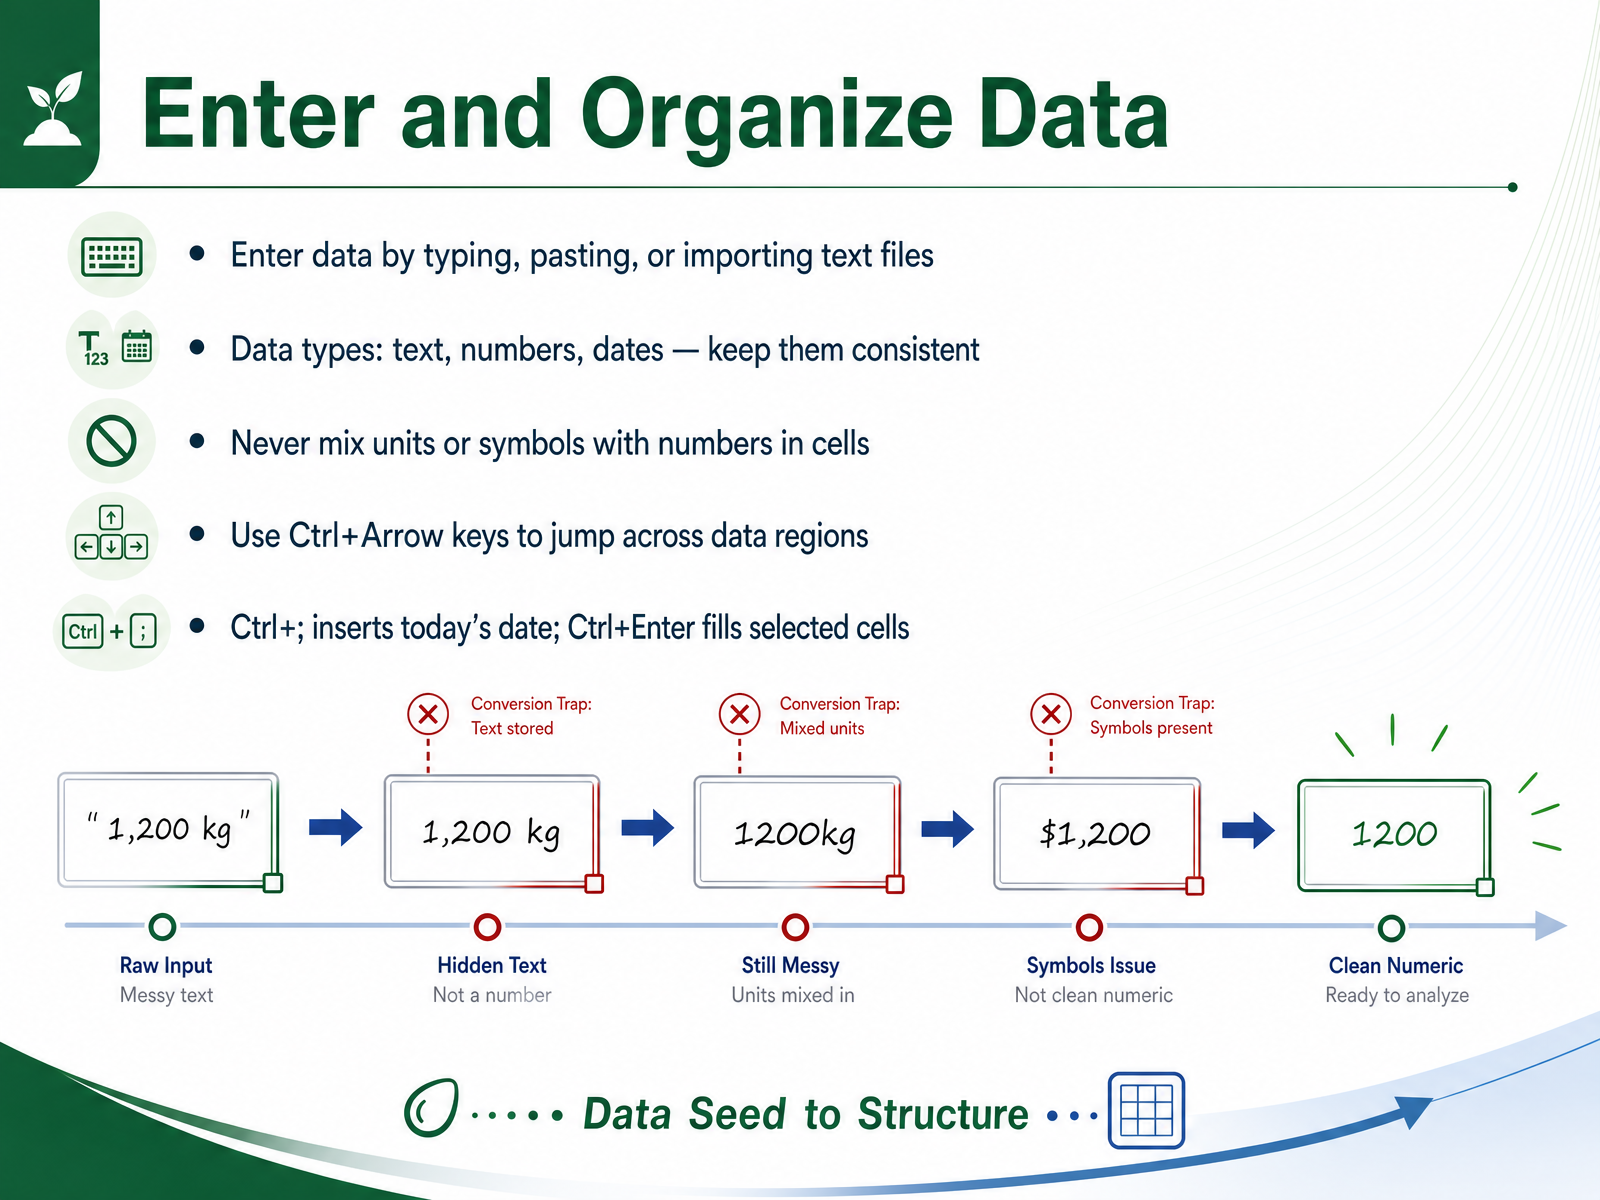
 - 06Enter and Organize DataNow let's talk about entering and organizing your data. You can type directly into cells, paste from another source, or import a text file. Keep each column consistent—text, numbers, or dates—and avoid mixing units with numbers. For instance, type 100 instead of 100 dollars, and use formatting to show the unit. This keeps your data calculable. Here are a few shortcuts to speed things up. Press Ctrl with an arrow key to jump to the edge of your data region. Press Ctrl and semicolon to insert today's date. And if you select multiple cells, Ctrl and Enter fills them all at once with the same entry. These small habits make your spreadsheet reliable and easy to work with. Next, we'll look at formatting for clarity and control.
 howtogeek.compresago.comlearnexcel.io+21 min
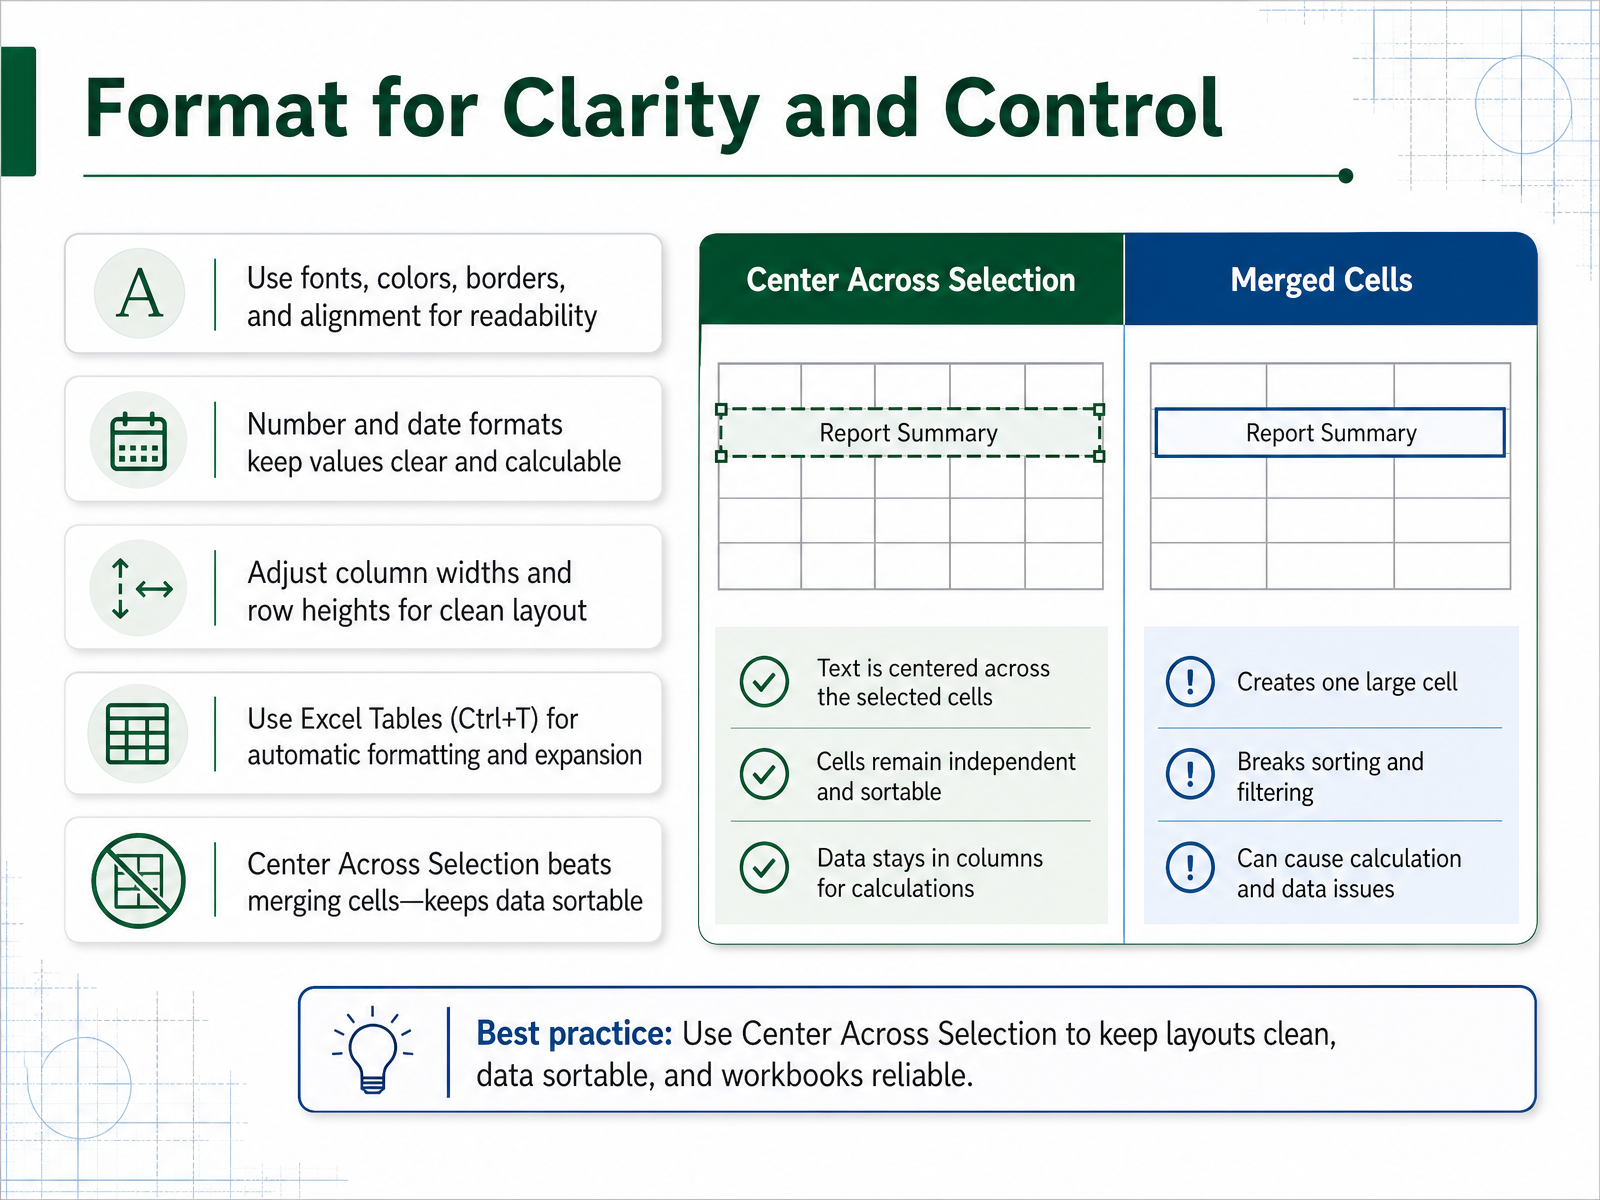
 - 07Format for Clarity and ControlNow let's talk about formatting, but not just to make things look pretty. Formatting is about control. Use fonts, colors, borders, and alignment to make your sheet easy to scan at a glance. But the real power comes from number formats. Keep your numbers pure, like typing 100 instead of $100, and let Excel display the currency symbol for you. That way, your values stay calculable. Adjust column widths and row heights so nothing feels cramped. And here's a big one: press Ctrl+T to turn your data into an Excel Table. This gives you automatic formatting and, more importantly, the table expands on its own when you add new rows. One more habit to adopt: avoid merging cells. It breaks sorting and filtering. Instead, use Center Across Selection. It looks identical but keeps every cell independent. These small choices add up to a spreadsheet that's both clear and reliable. Next, we'll look at the building blocks of calculations: formulas, functions, and references.
 howtogeek.compresago.comlearnexcel.io+21 min
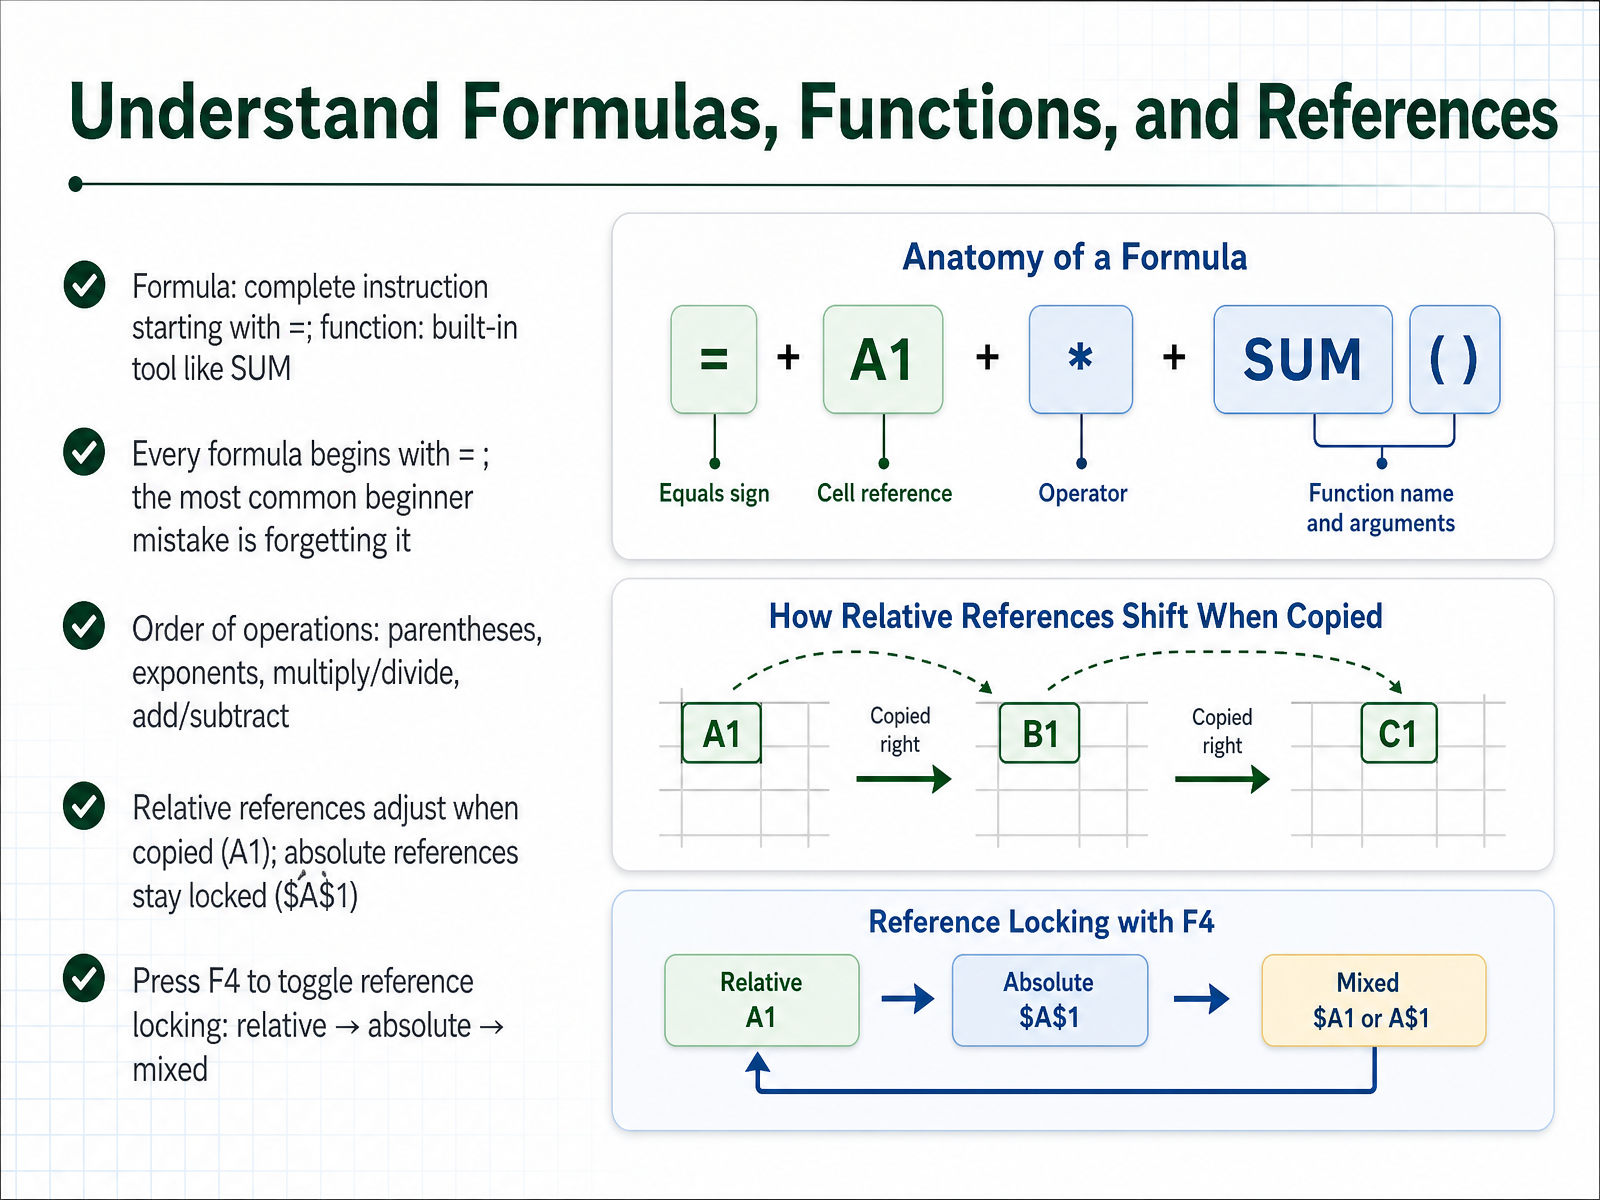
 - 08Understand Formulas, Functions, and ReferencesNow let's talk about formulas, functions, and references. A formula is a complete instruction you type into a cell, and it always starts with an equals sign. A function is a built-in tool like SUM or AVERAGE that lives inside your formula. The most common beginner mistake is forgetting that equals sign. If you type SUM without it, Excel just shows text. With it, Excel calculates. Also remember the order of operations. Parentheses first, then exponents, then multiplication and division, then addition and subtraction. When in doubt, add parentheses. They make your intent clear. Now, references. A relative reference like A1 adjusts when you copy the formula. That's usually what you want. An absolute reference like dollar sign A dollar sign 1 stays locked to one cell, which is essential when you're using a fixed value like a tax rate. Just press F4 to cycle through the reference types. Keep this in mind, and next we'll apply the essential functions that cover most of your daily needs.
 makeuseof.comdatacamp.comxplorexcel.com+21 min
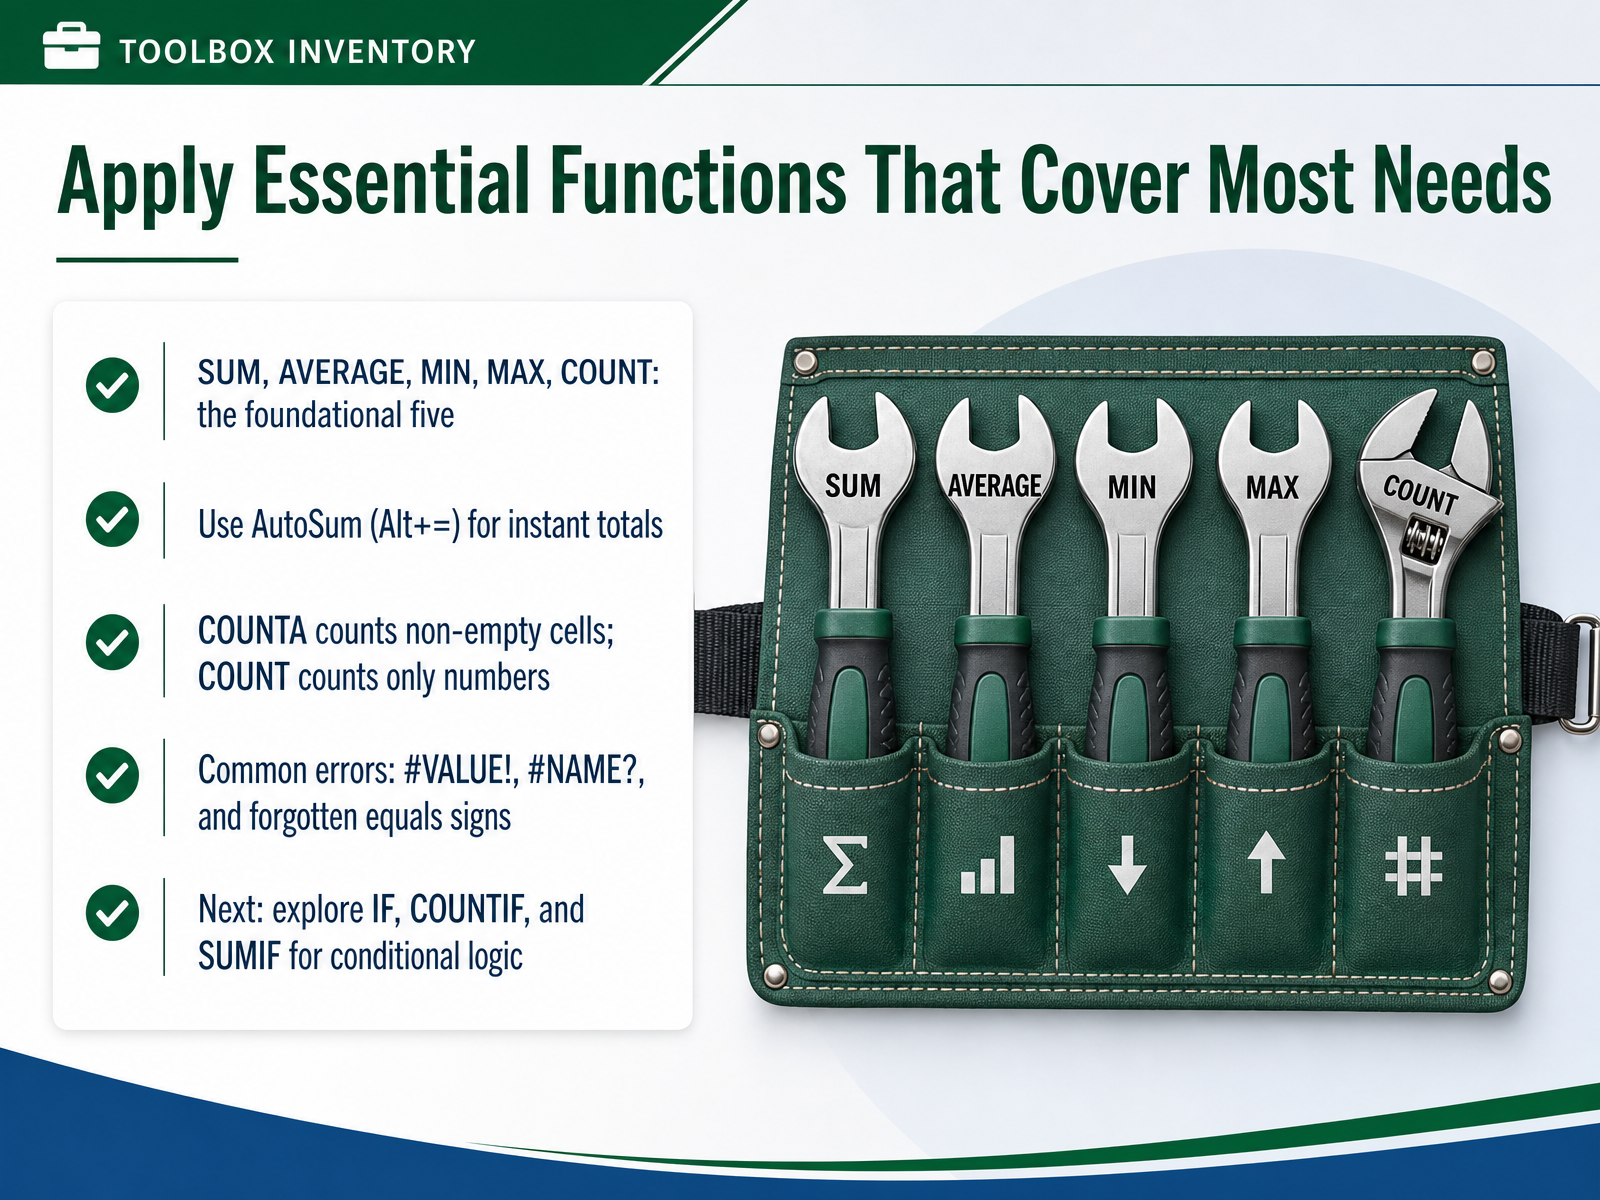
 - 09Apply Essential Functions That Cover Most NeedsNow let’s apply the functions that cover most everyday needs. Think of these five as your foundational toolkit: SUM, AVERAGE, MIN, MAX, and COUNT. SUM adds up a range of numbers. AVERAGE finds the mean. MIN and MAX return the smallest and largest values. And COUNT tells you how many cells contain numbers. Here’s a quick tip: instead of typing the whole SUM formula, select the empty cell below your numbers and press Alt plus the equals sign. That’s AutoSum, and it instantly suggests the total. Just press Enter to confirm. One distinction matters: COUNT only counts numeric entries, while COUNTA counts every non-empty cell, including text. So if your column has labels, use COUNTA. Now for common errors: if you see hash VALUE hash, your formula is trying to calculate text as a number. Hash NAME question mark means Excel doesn’t recognize the function name, usually a typo. And many beginners forget the equals sign entirely, which turns the formula into plain text. Always start with equals. Once you’re comfortable here, the next step is conditional logic with IF, COUNTIF, and SUMIF. But first, let’s look at how to sort, filter, and find what you need.
 makeuseof.comdatacamp.comxplorexcel.com+21 min
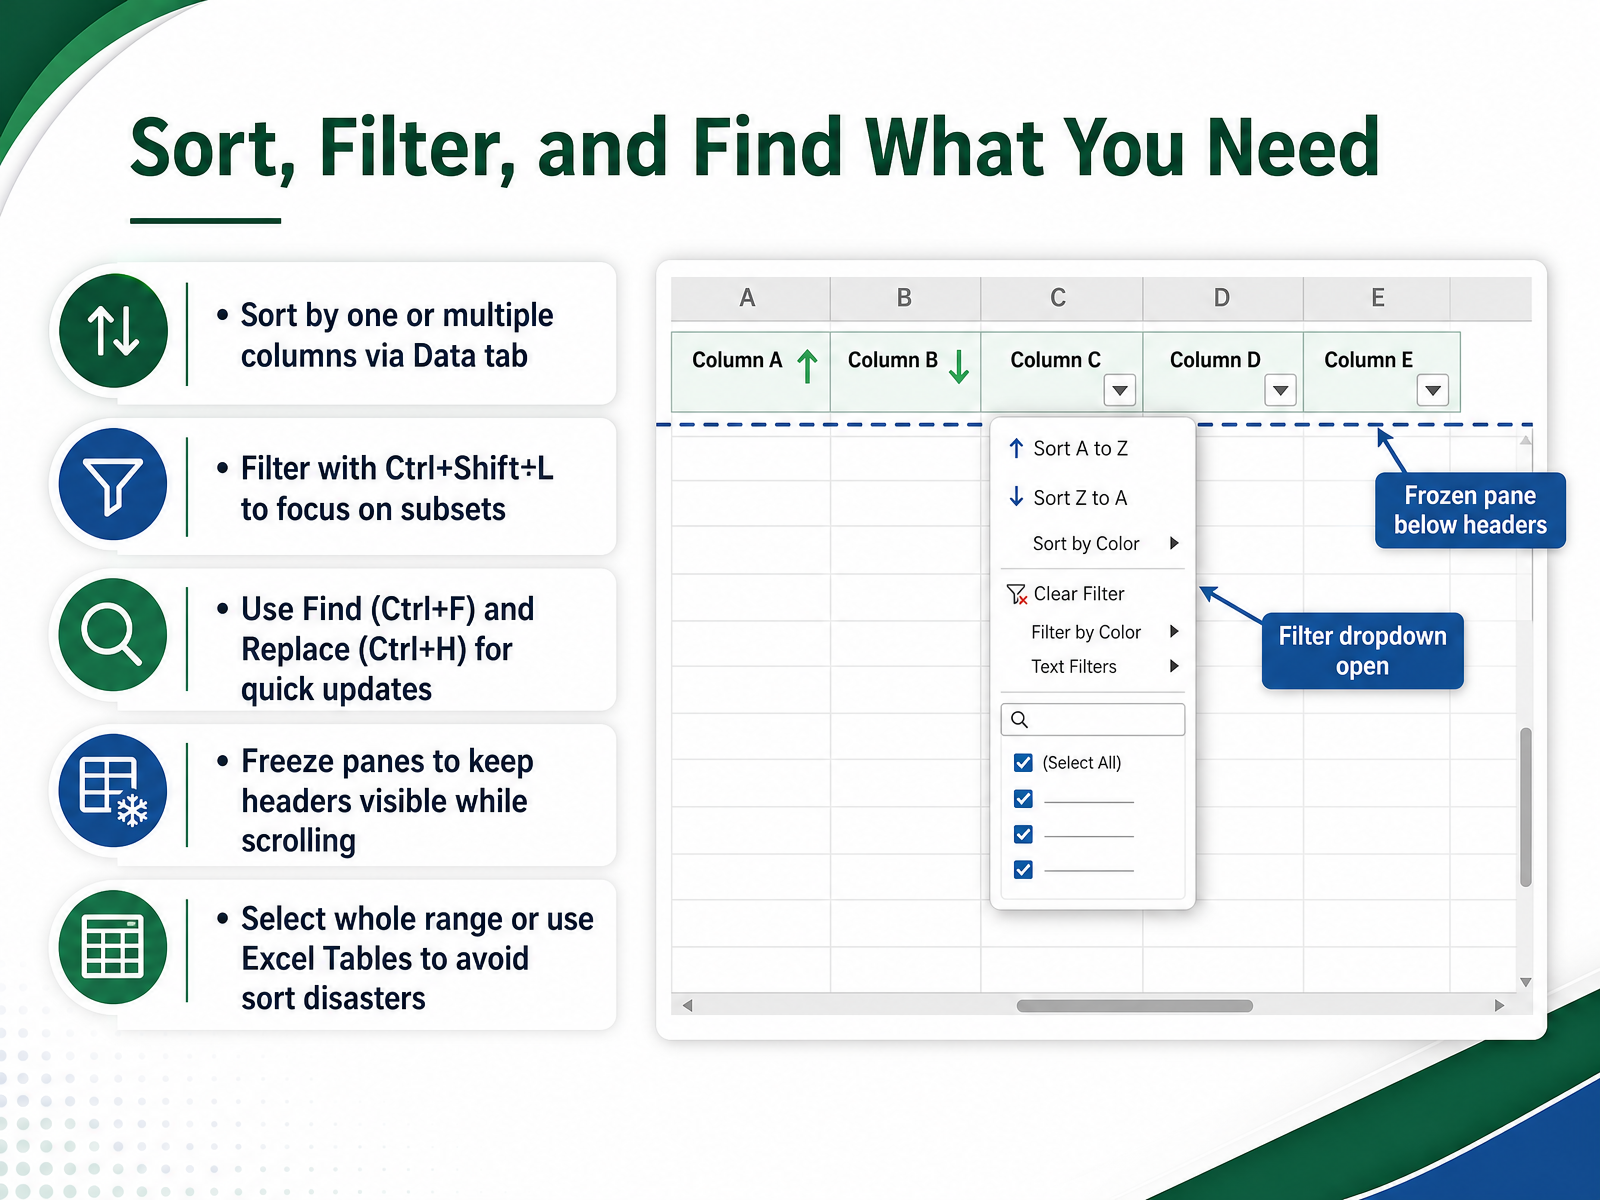
 - 10Sort, Filter, and Find What You NeedNow that your data is in place, let's make it work for you. Sorting is your first tool. Click anywhere in your data, go to the Data tab, and choose Sort. You can sort by one column, or add multiple levels to sort by, say, region and then by date. For quick filtering, press Ctrl+Shift+L. This adds dropdown arrows to your headers, letting you focus on just the subset you need. When you need to locate a specific value or update it everywhere, press Ctrl+F to find it, or Ctrl+H to replace it across the whole sheet. If your sheet is long, don't lose your headers. Use Freeze Panes on the View tab to keep the top row visible as you scroll down. One word of caution before you sort or filter: select the entire range, or better yet, convert your data to an Excel Table with Ctrl+T. Tables keep headers and rows together, which prevents the classic mistake of sorting one column and scrambling your entire dataset. With these tools, you can navigate and manage your data with confidence. Next, we'll review how to check your work for errors before sharing it.
 howtogeek.compresago.comlearnexcel.io+21 min
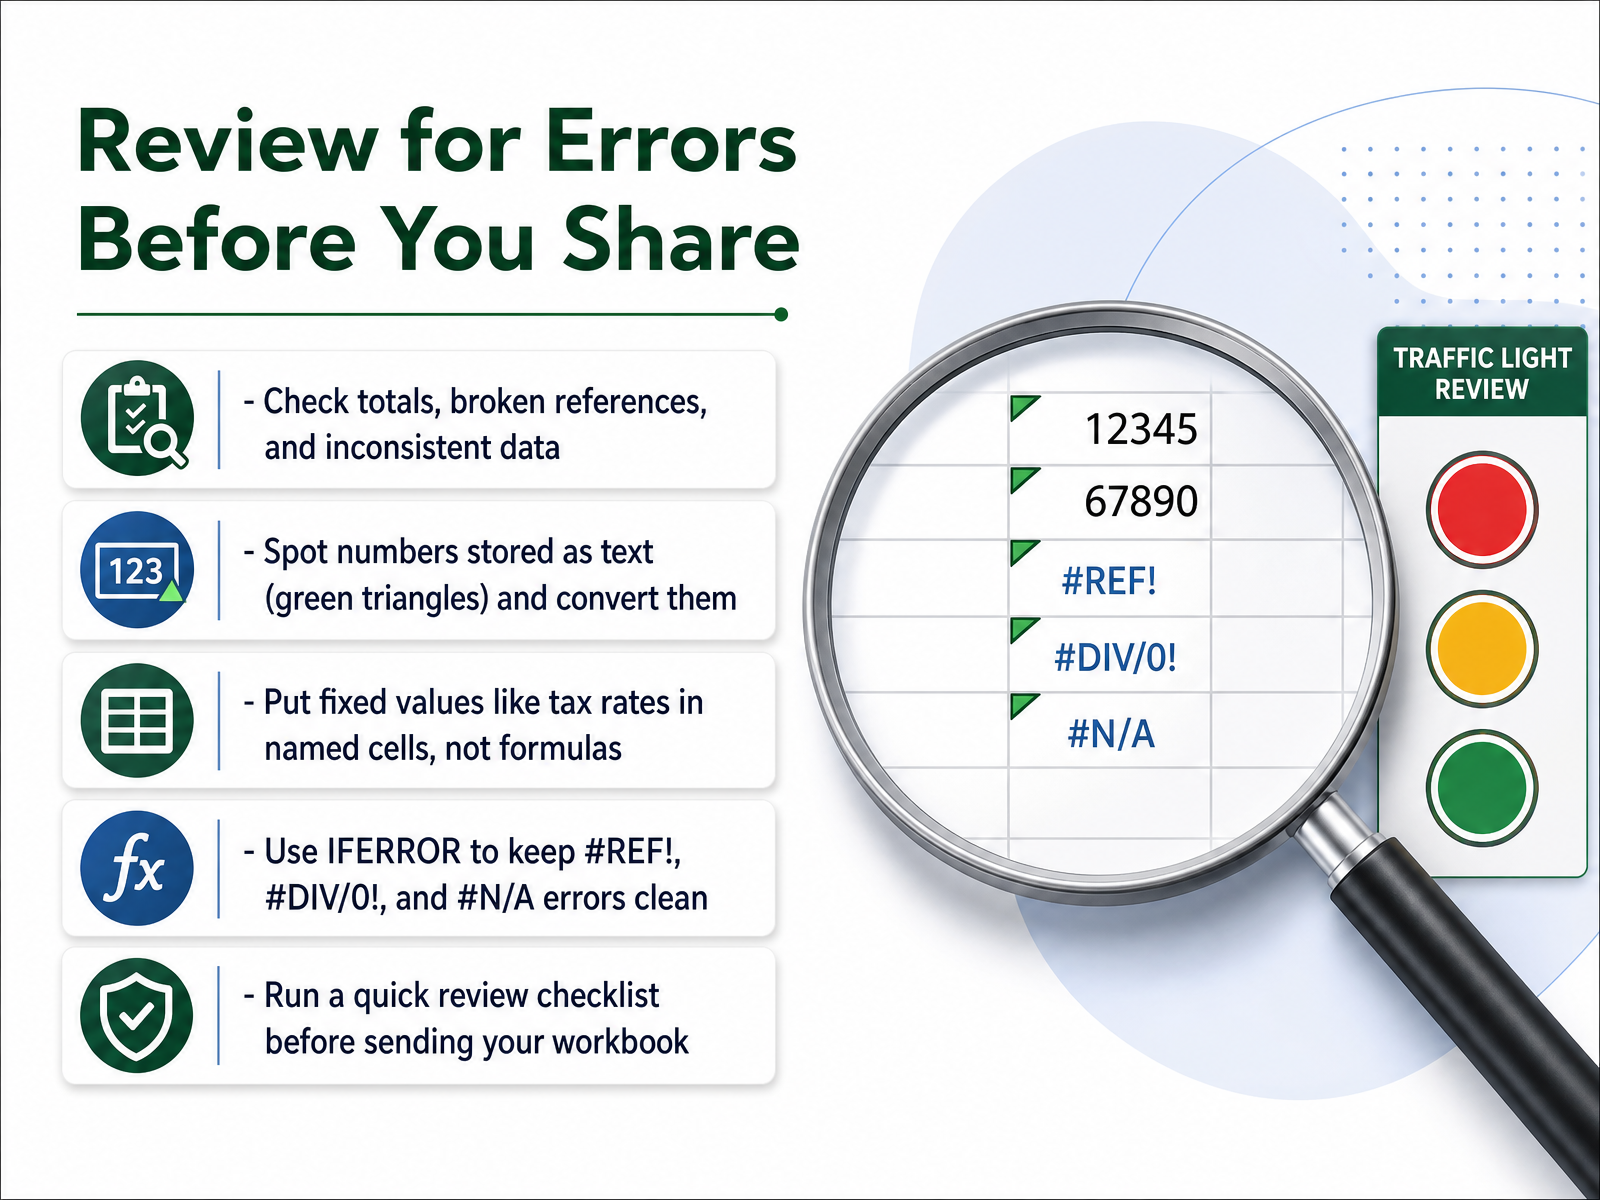
 - 11Review for Errors Before You ShareBefore you send your workbook to anyone, take a moment to review it for errors. Start by checking your totals, looking for broken references, and scanning for inconsistent data. If you see small green triangles in the corners of cells, that is Excel telling you a number is stored as text. Click the warning icon and choose Convert to Number to fix it. Next, avoid typing fixed values like tax rates directly into formulas. Instead, put them in their own clearly labeled cell, like we discussed earlier, and reference that cell. This way, if the rate changes, you update one spot and everything updates automatically. Also, wrap your formulas with IFERROR to keep error codes like hash REF, hash DIV by zero, or hash N A from showing up. A simple message like Not Available is much cleaner for your audience. Finally, run a quick checklist. Confirm your totals match, verify your filters work, and glance through a few key cells. It takes two minutes and it prevents small mistakes from becoming someone else's problem. Once you are confident everything is clean, you are ready to protect and share your work.
 howtogeek.compresago.comlearnexcel.io+22 min
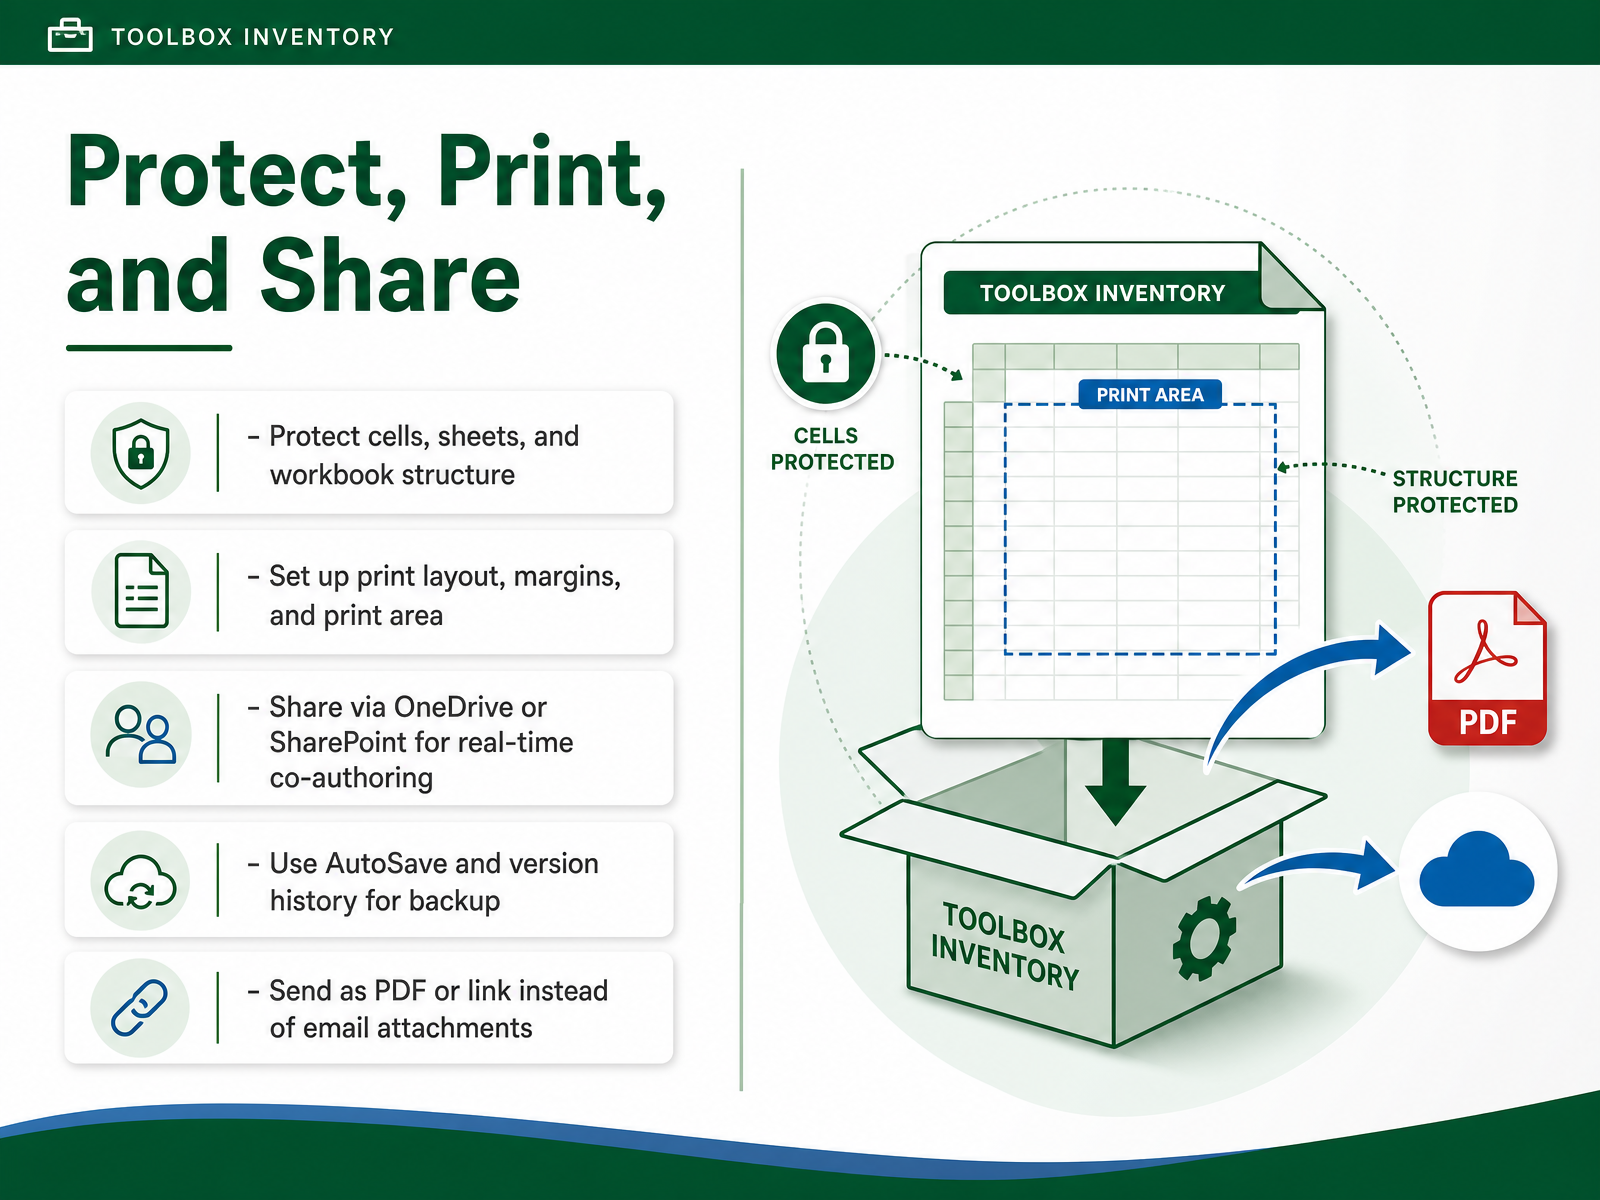
 - 12Protect, Print, and ShareNow that your workbook is ready, let’s talk about protecting it and getting it into other people’s hands. Start by protecting your work. You can lock specific cells to prevent accidental edits, then protect the whole sheet. If your workbook has multiple sheets, you can also protect the workbook structure so no one can move or delete the tabs. Next, think about printing. Before you hit print, open Page Layout, check the margins, and set a clear print area so your output doesn’t spill across extra pages. For collaboration, the modern way is sharing through OneDrive or SharePoint. Click Share, add email addresses, and choose whether people can edit or just view. When the file lives in the cloud, AutoSave keeps every change safe, and version history lets you roll back to an earlier copy if something goes wrong. For quick reviews, send a link instead of an email attachment. A link always points to the latest version, not a frozen copy. A quick tip: assign each collaborator a section or sheet so you don’t overwrite each other. Now, let’s put all these steps together and build your first practice spreadsheet.
 2 min
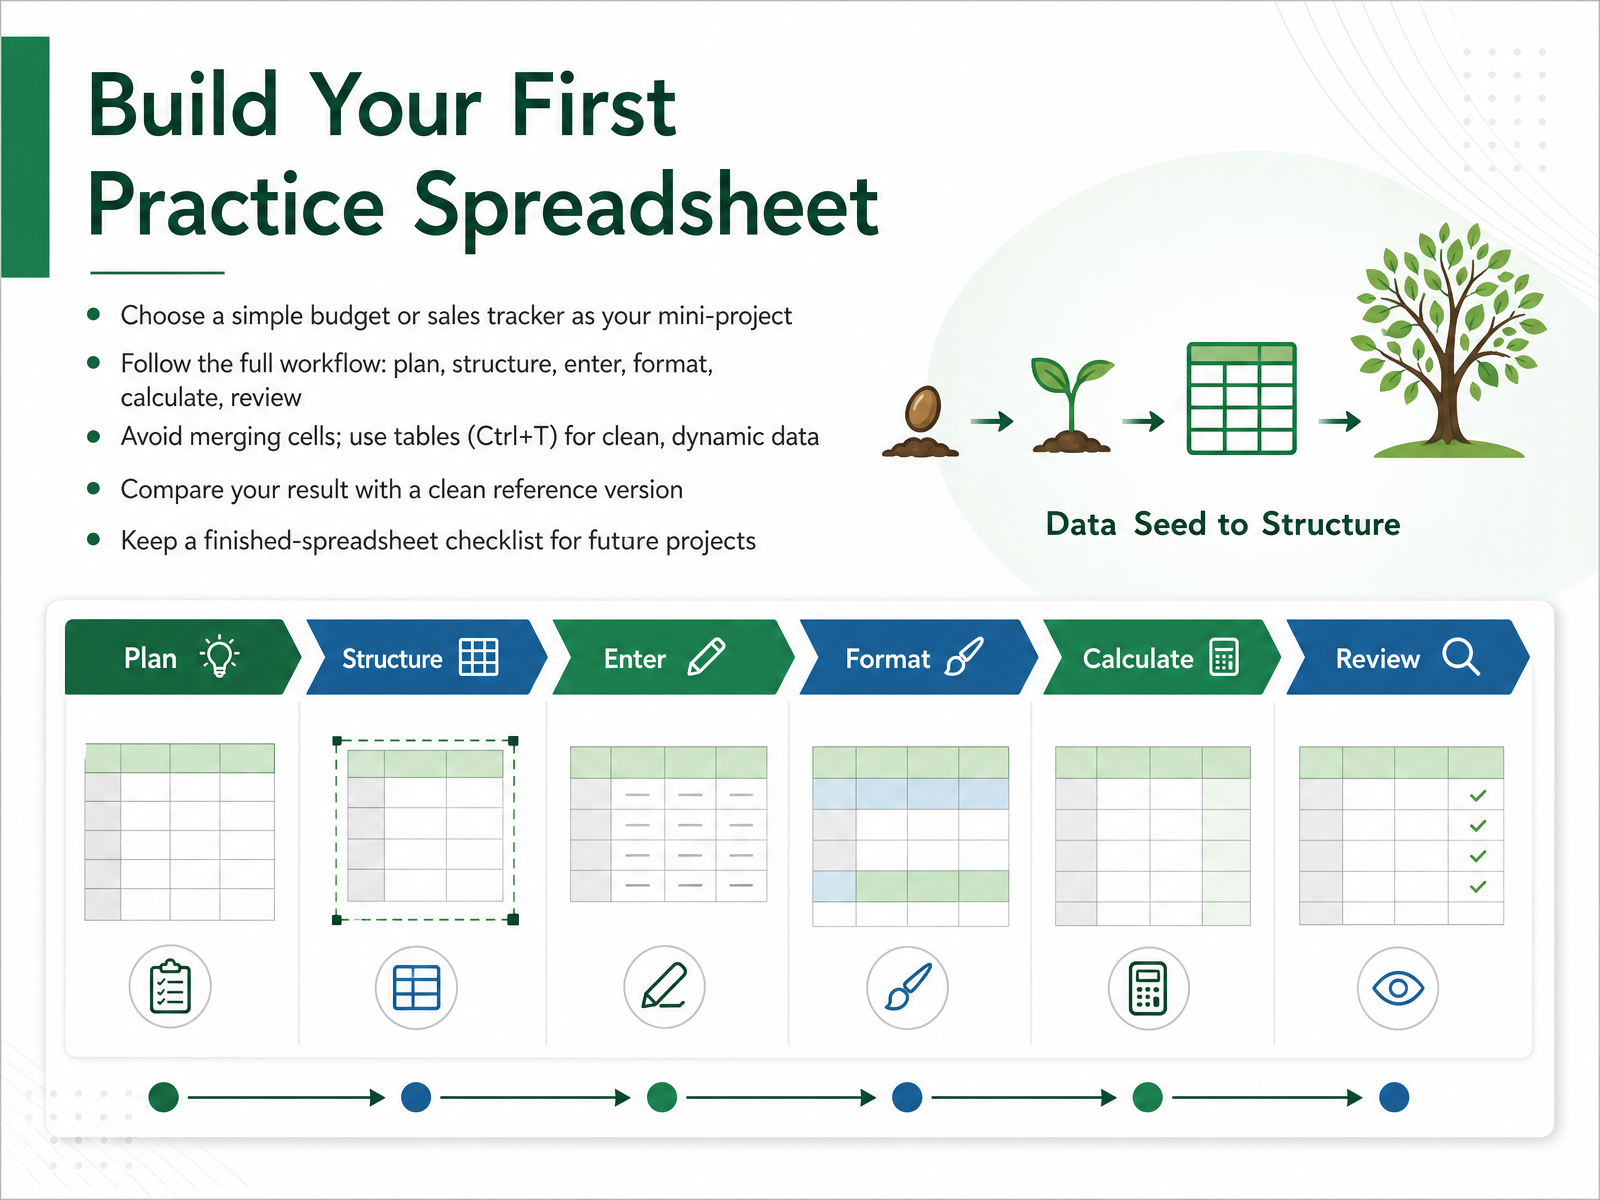
2 min - 13Build Your First Practice SpreadsheetNow it's time to put everything together. Pick a simple budget or a small sales tracker as your first mini-project. Follow the full workflow we've covered: plan the layout, structure your columns, enter the data, apply formatting, add your calculations, and review the result. As you build, keep one key habit in mind: avoid merging cells. Merged cells may look tidy, but they break sorting and filtering. Instead, select your data range and press Control plus T to convert it into a proper table. Tables expand automatically when you add new rows, so your formulas and charts stay accurate without any extra work. Once you finish, compare your work against a clean reference version. Check that totals match, that numbers are formatted correctly, and that no data is trapped as text. This comparison is one of the fastest ways to spot small issues before they become habits. Finally, keep a checklist of what a finished spreadsheet looks like: clear headers, one data type per column, no merged cells, and working formulas. That checklist will guide you through every future project. Up next, we will look at next steps and resources to keep your skills growing.
 howtogeek.compresago.comlearnexcel.io+21 min
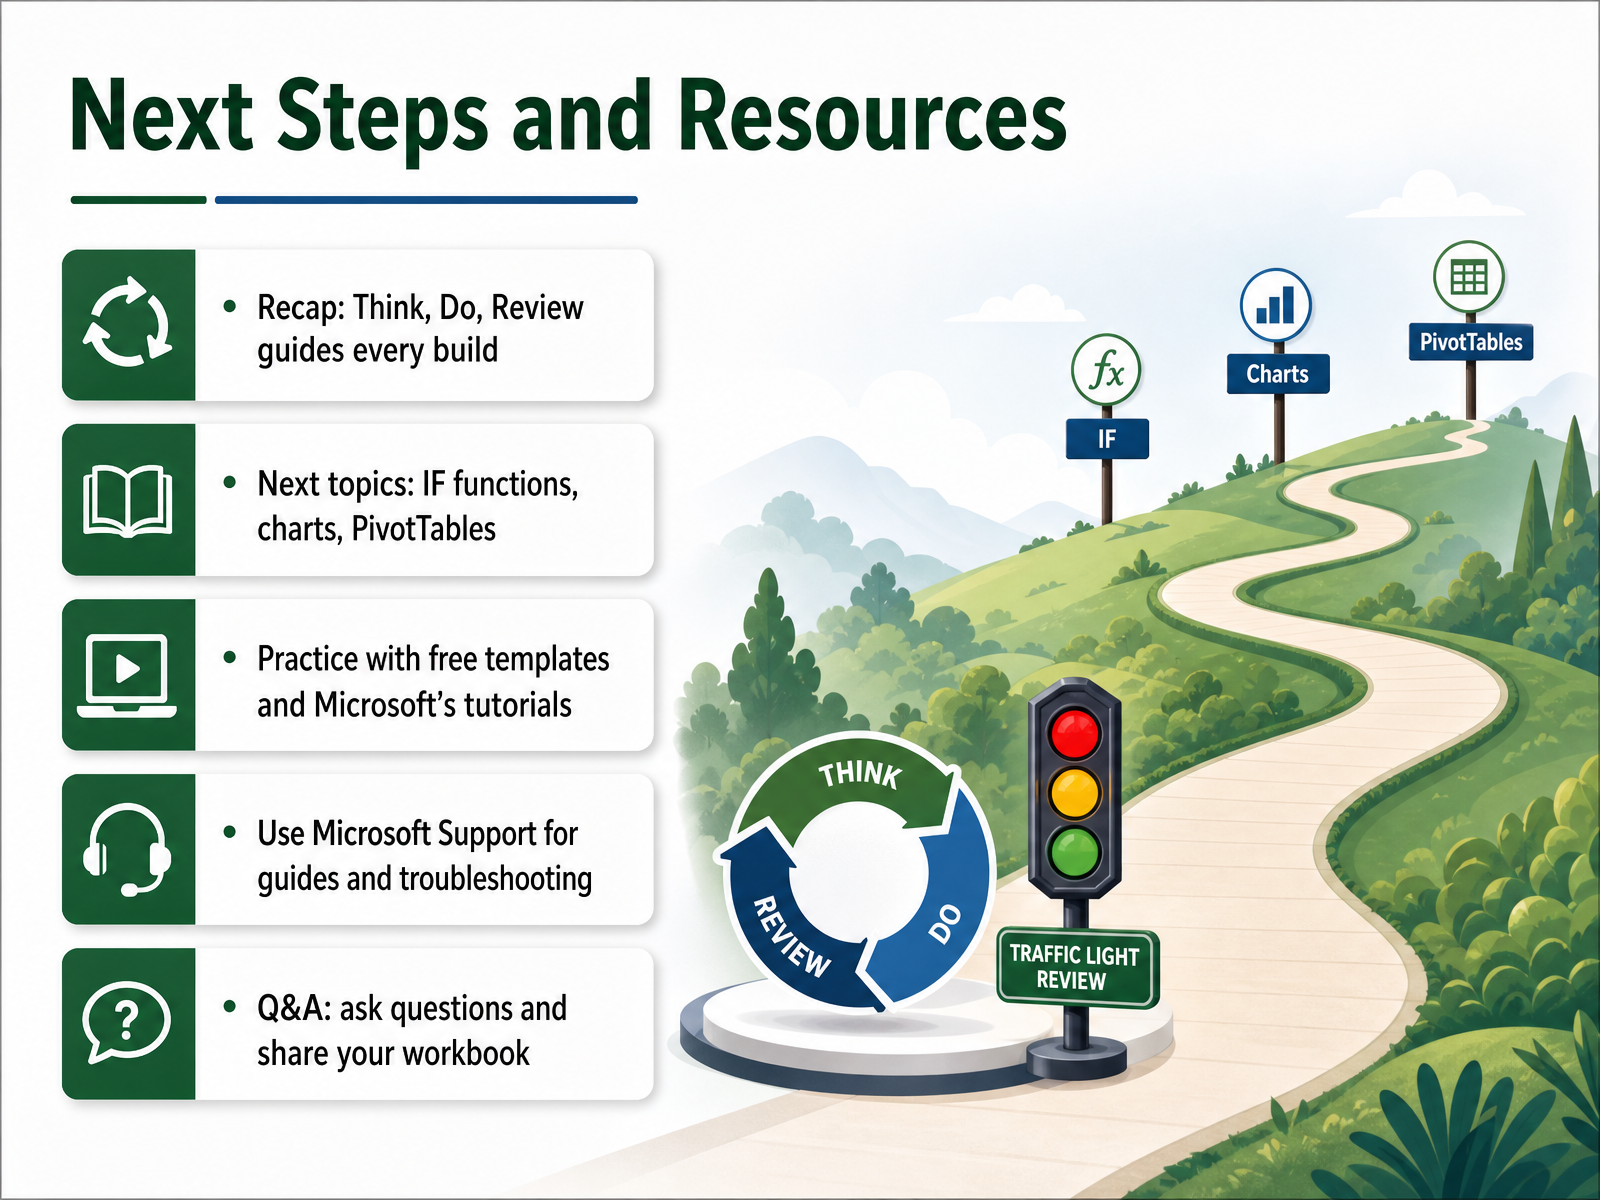
 - 14Next Steps and ResourcesYou’ve made it to the end, and you’ve built something real. Remember the rhythm that guided you here: think, do, review. That simple loop will carry you through every spreadsheet you create from now on. So where do you go next? Start with IF functions to make intelligent decisions in your data. Then try charts to tell the story behind the numbers. And when you’re ready, PivotTables will let you summarize and explore like a pro. The best way to practice is with free templates and Microsoft’s own tutorials. And if you ever get stuck, Microsoft Support has guides and troubleshooting built for exactly that moment. Before we close, I want to thank you for your focus and effort today. You’ve taken the first confident step. Keep opening new workbooks, keep experimenting, and don’t hesitate to ask questions. Your skills will grow with every file you create. Well done.
 1 min
1 min
Take the deck with you
Download this course as a file — free, no sign-up needed.
- PDF handoutEvery slide page, ready to print or share.15 pages · 3.4 MBDownload
- Narrated PowerPointThe deck that presents itself — every slide carries the digital human's narration video.15 pages · 13.1 MBDownload
- PowerPoint slidesThe full deck as a .pptx — open it in PowerPoint, Keynote, or Google Slides.15 pages · 3.3 MBDownload
Free to use in your own training — please keep the PersonWise credit page at the end.
Have your own deck? Turn it into a course
Sources consulted
Web sources consulted while building this course.
- 10 Essential Excel Functions for Beginners — makeuseof.com
- The 15 Basic Excel Formulas Everyone Needs to Know — datacamp.com
- Basic Formulas in Excel: SUM, AVERAGE, COUNT & More — xplorexcel.com
- 30 Essential Excel Formulas Explained with Examples (Beginner to Intermediate Guide) — learnproexcel.com
- The 12 Excel Functions Every Office Worker Should Know - Learn Excel — learnexcel.io
- What's New in Excel (July 2026) — techcommunity.microsoft.com
- Here are all the new features Microsoft added to Excel in August 2026 - Neowin — neowin.net
- What's New in Excel (April 2026) | Microsoft Community Hub — techcommunity.microsoft.com
- New Excel Features 2026 : 17 Tools to Speed up Work - Geeky Gadgets — geeky-gadgets.com
- What's New in Excel (May 2026) — techcommunity.microsoft.com
- 5 Excel mistakes beginners make that ruin their spreadsheets (and what to do instead) — howtogeek.com
- 6 Common Spreadsheet Mistakes (And How to Fix Them) — presago.com
- 10 Common Excel Mistakes That Break Your Spreadsheets (and How to Fix Them) - Learn Excel — learnexcel.io
- Fix Common Google Sheets Mistakes (and a Few Easy Wins) — spin.atomicobject.com
- Spreadsheet Best Practices: Stop Making These Mistakes | csv-x.com — csv-x.com
- Excel Best Practices: File Structure, Speed & Auditing — xplorexcel.com
- The 3-tab rule: How to structure your Excel file like a software developer — howtogeek.com
- How to structure an Excel workbook. The four-layer architecture for maintainable spreadsheets. | SafeOffice Support — helpme.safeoffice.de
- Guidelines for organizing and formatting data on a worksheet — support.microsoft.com
- How to Create and Organize Excel Workbooks – Step by Step Guide — myexcelonline.com