Business Intelligence Platform Selection
Begin
14 pages · ~28 min
Business Intelligence Platform Selection
This training helps data and analytics professionals select and architect a business intelligence platform, covering key tradeoffs to guide informed decisions.
What you’ll learn
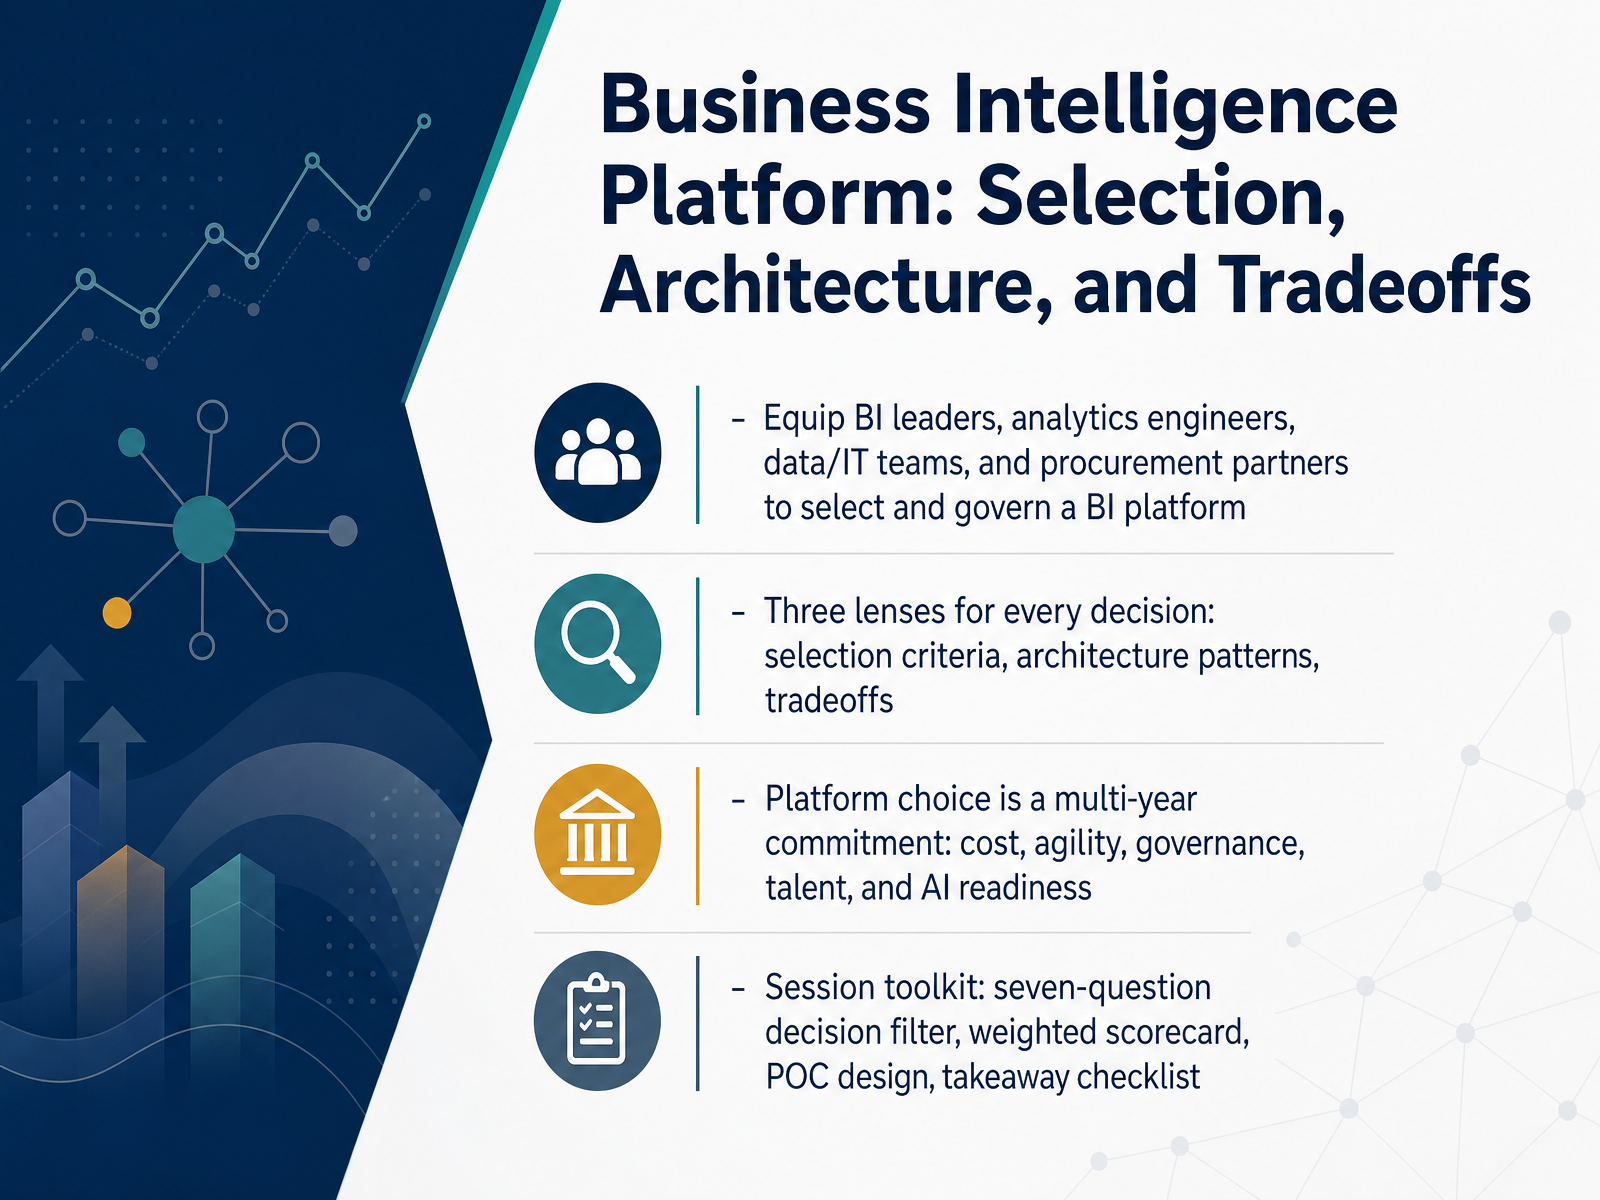
- 01Business Intelligence Platform: Selection, Architecture, and TradeoffsWelcome. Over the next several slides, we're going to work through one of the more consequential decisions in your data stack: selecting and governing a business intelligence platform. That's a decision that will touch finance, IT, analytics, and every line of business that consumes data, so the goal here is to equip BI leaders, analytics engineers, data and IT teams, and procurement partners to make it deliberately rather than by default.
We'll use three lenses for every decision: selection criteria, architecture patterns, and tradeoffs. And one framing to keep in mind throughout: this is a multi-year commitment. It shapes cost, agility, governance, the talent you'll need, and how ready you are for AI. Switching later means reconnecting data, migrating metrics, rebuilding dashboards, and retraining users, so it's worth getting right.
By the end, you'll have a working toolkit: a seven-question decision filter, a weighted scorecard, a proof-of-concept design, and a takeaway checklist.
Let's start with why this choice matters now.skopx.cominventive.aiflorence.cloud+22 min
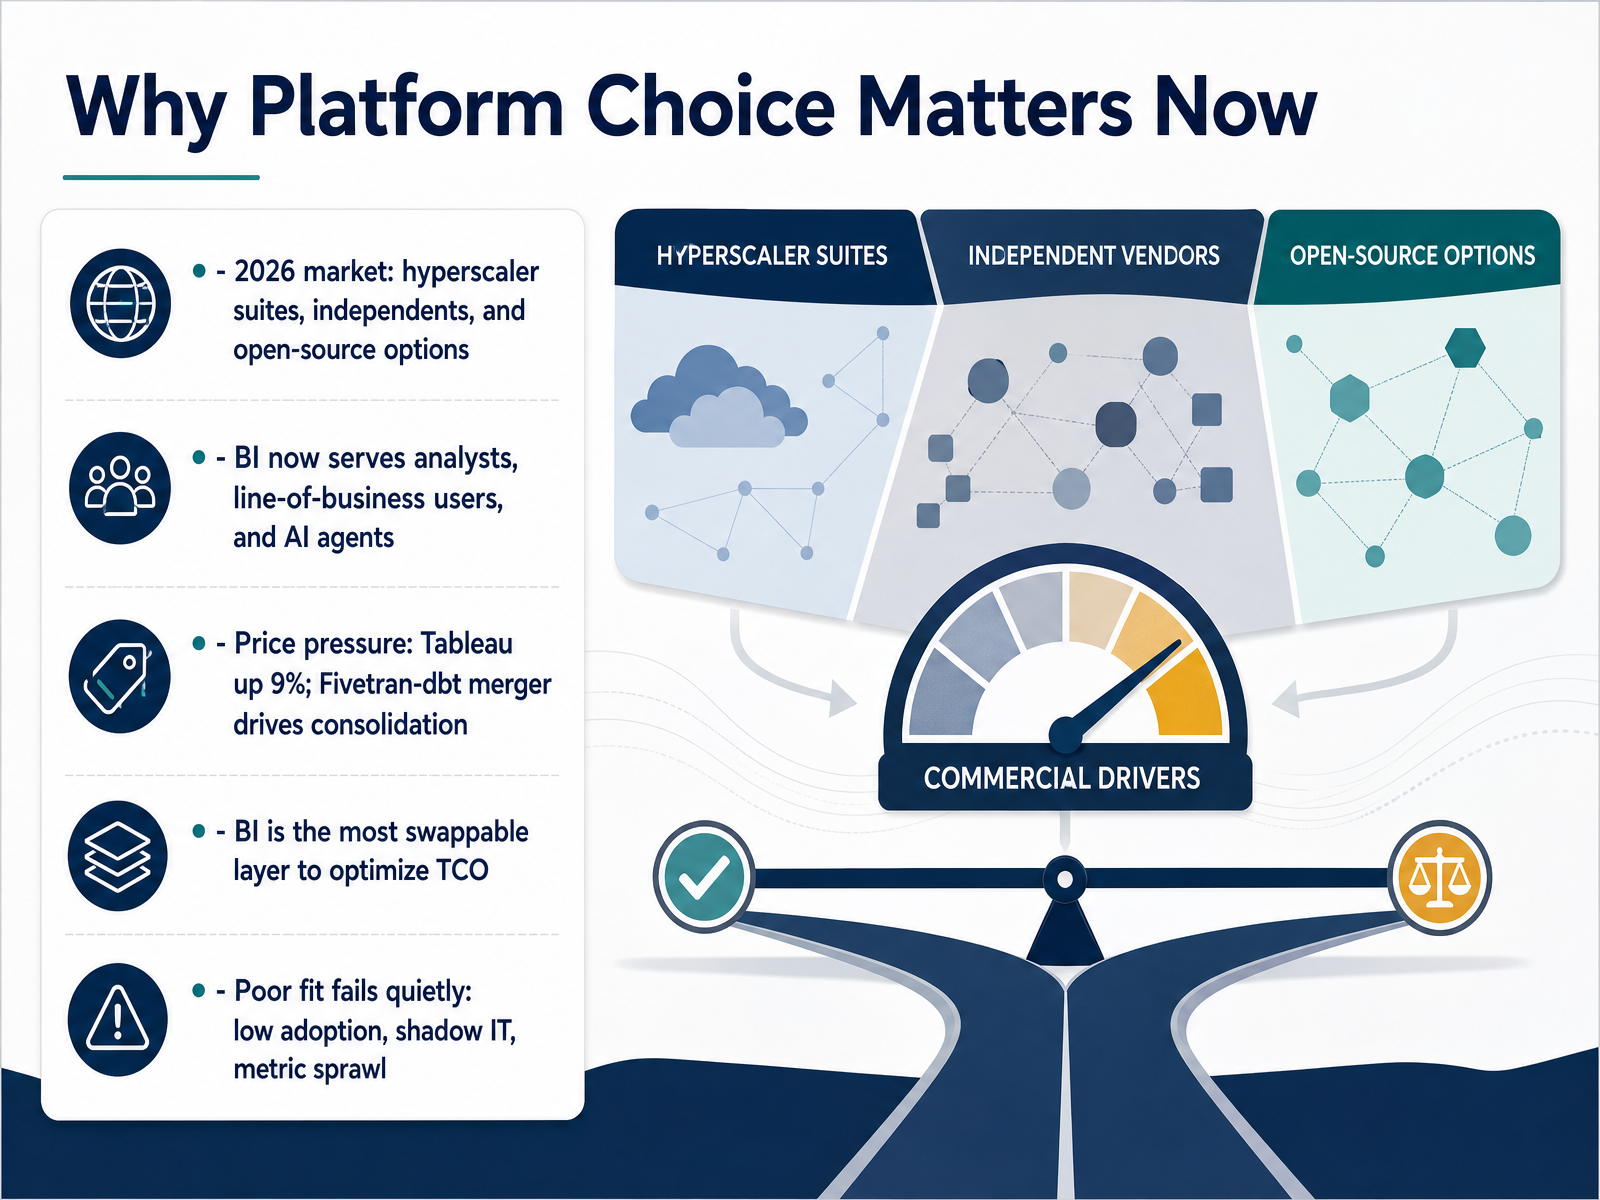
- 02Why Platform Choice Matters NowLet's look at why platform choice matters right now, more than it did even two years ago. The 2026 market splits into three broad camps: hyperscaler suites like Microsoft Fabric and Power BI, independents like Tableau and Qlik, and open-source options built on engines such as Apache Superset. Meanwhile, your audience has changed. BI now serves analysts, line-of-business users, and increasingly, AI agents querying governed metrics directly. Price pressure is real. Salesforce raised prices nine percent across products, including Tableau, and the Fivetran and dbt merger puts roughly two-thirds of a typical data stack under one vendor. Here's the useful part. BI is usually the most swappable layer in that stack. Your data stays in the warehouse, your models stay in dbt, so switching costs sit an order of magnitude below ripping out ingestion or transformation. That makes BI the practical place to optimize total cost of ownership. But a poor fit rarely fails loudly. It shows up quietly: low adoption, shadow IT spreadsheets, and metric sprawl that erodes trust in the numbers. Those signals matter more than feature checklists, because governance debt compounds over time. Next, let's walk through the core capability model for a BI platform.
 grandviewresearch.comgiiresearch.comthebusinessresearchcompany.com+22 min
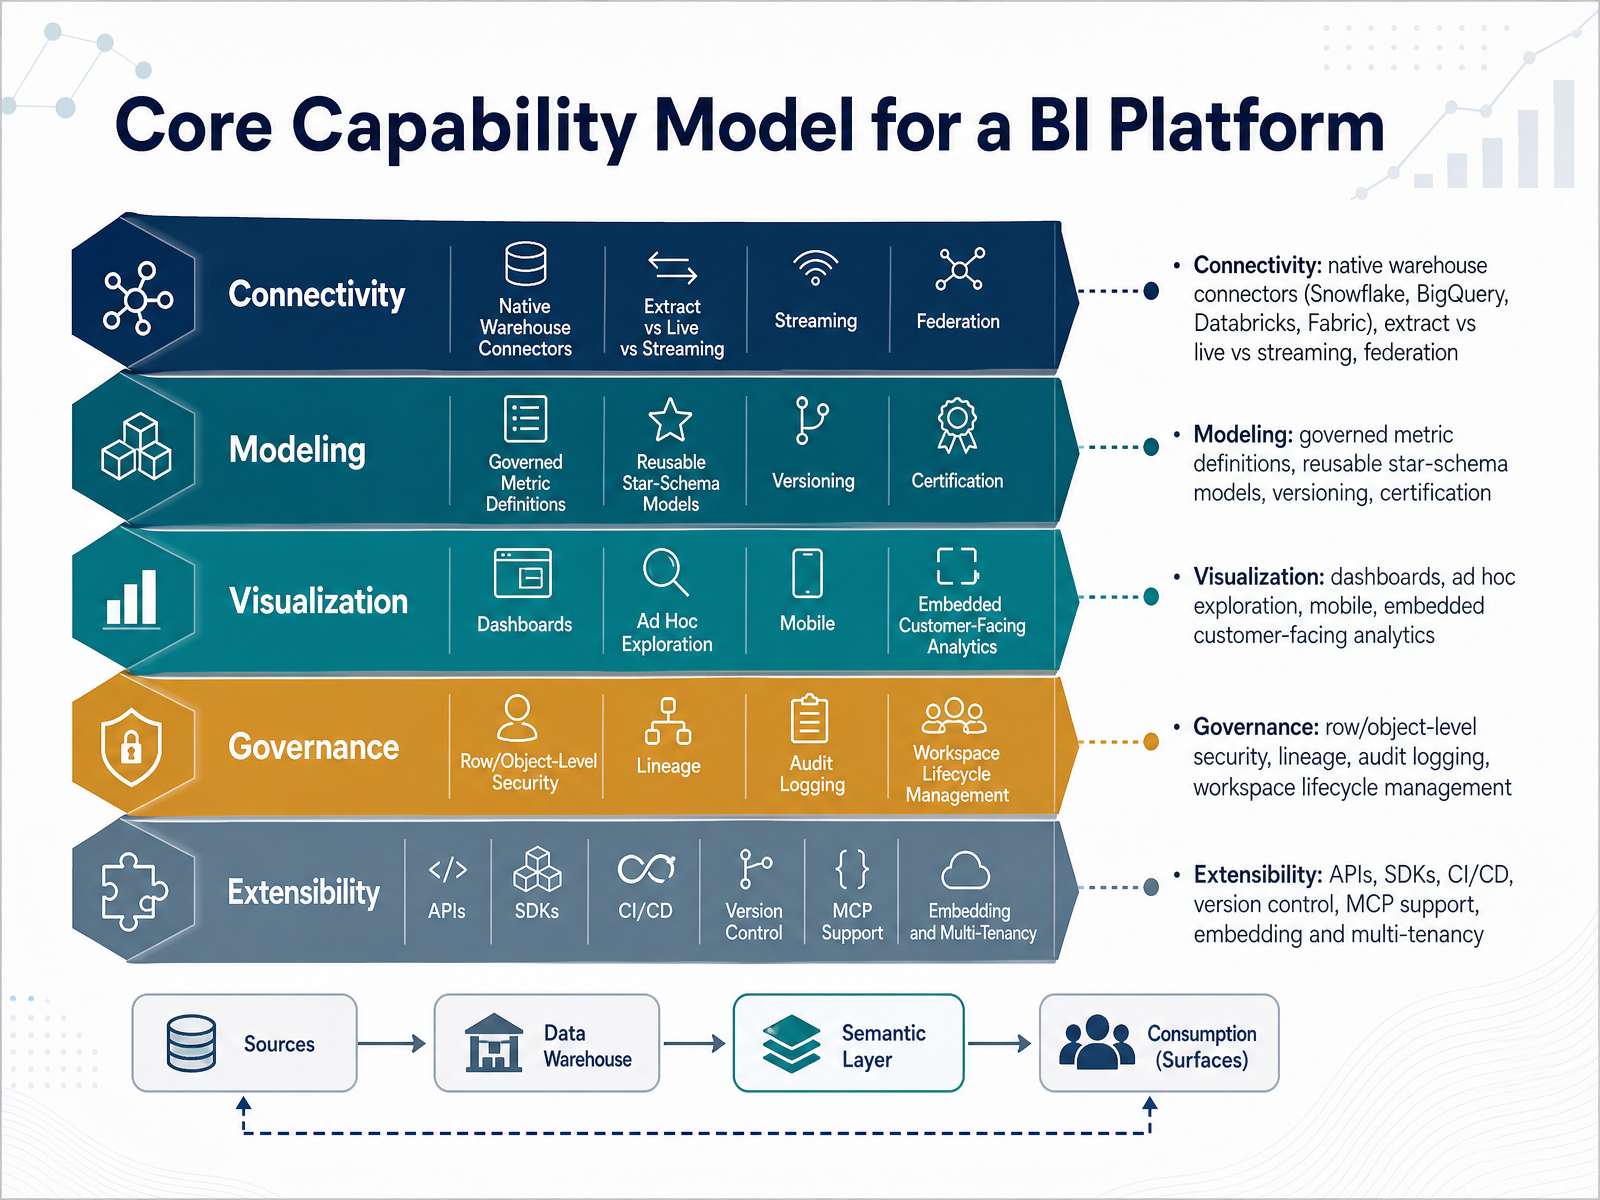
 - 03Core Capability Model for a BI PlatformLet's break the platform down into five capability areas, because these are what your scorecard should actually test. First, connectivity. Native connectors to Snowflake, BigQuery, Databricks, and Fabric matter, but the real question is whether each one supports live query, extracts, or streaming, and how it handles federation across sources. Second, modeling. Governed metric definitions, reusable star schemas, versioning, and certification. If definitions can drift, trust erodes quietly. Third, visualization: dashboards, ad hoc exploration, mobile, and embedded customer-facing analytics. Embedded analytics often forces cross-tool consistency sooner than internal reporting does. Fourth, governance: row and object-level security, lineage, audit logging, and workspace lifecycle management. Treat residency, audit logs, and security as pass or fail gates, not weighted scores. Fifth, extensibility: APIs, SDKs, CI/CD, version control, MCP support, embedding, and multi-tenancy. This is where lock-in shows up. A platform that models well but exposes weak APIs becomes expensive to leave. Now, architecture patterns.
 skopx.cominventive.aiflorence.cloud+22 min
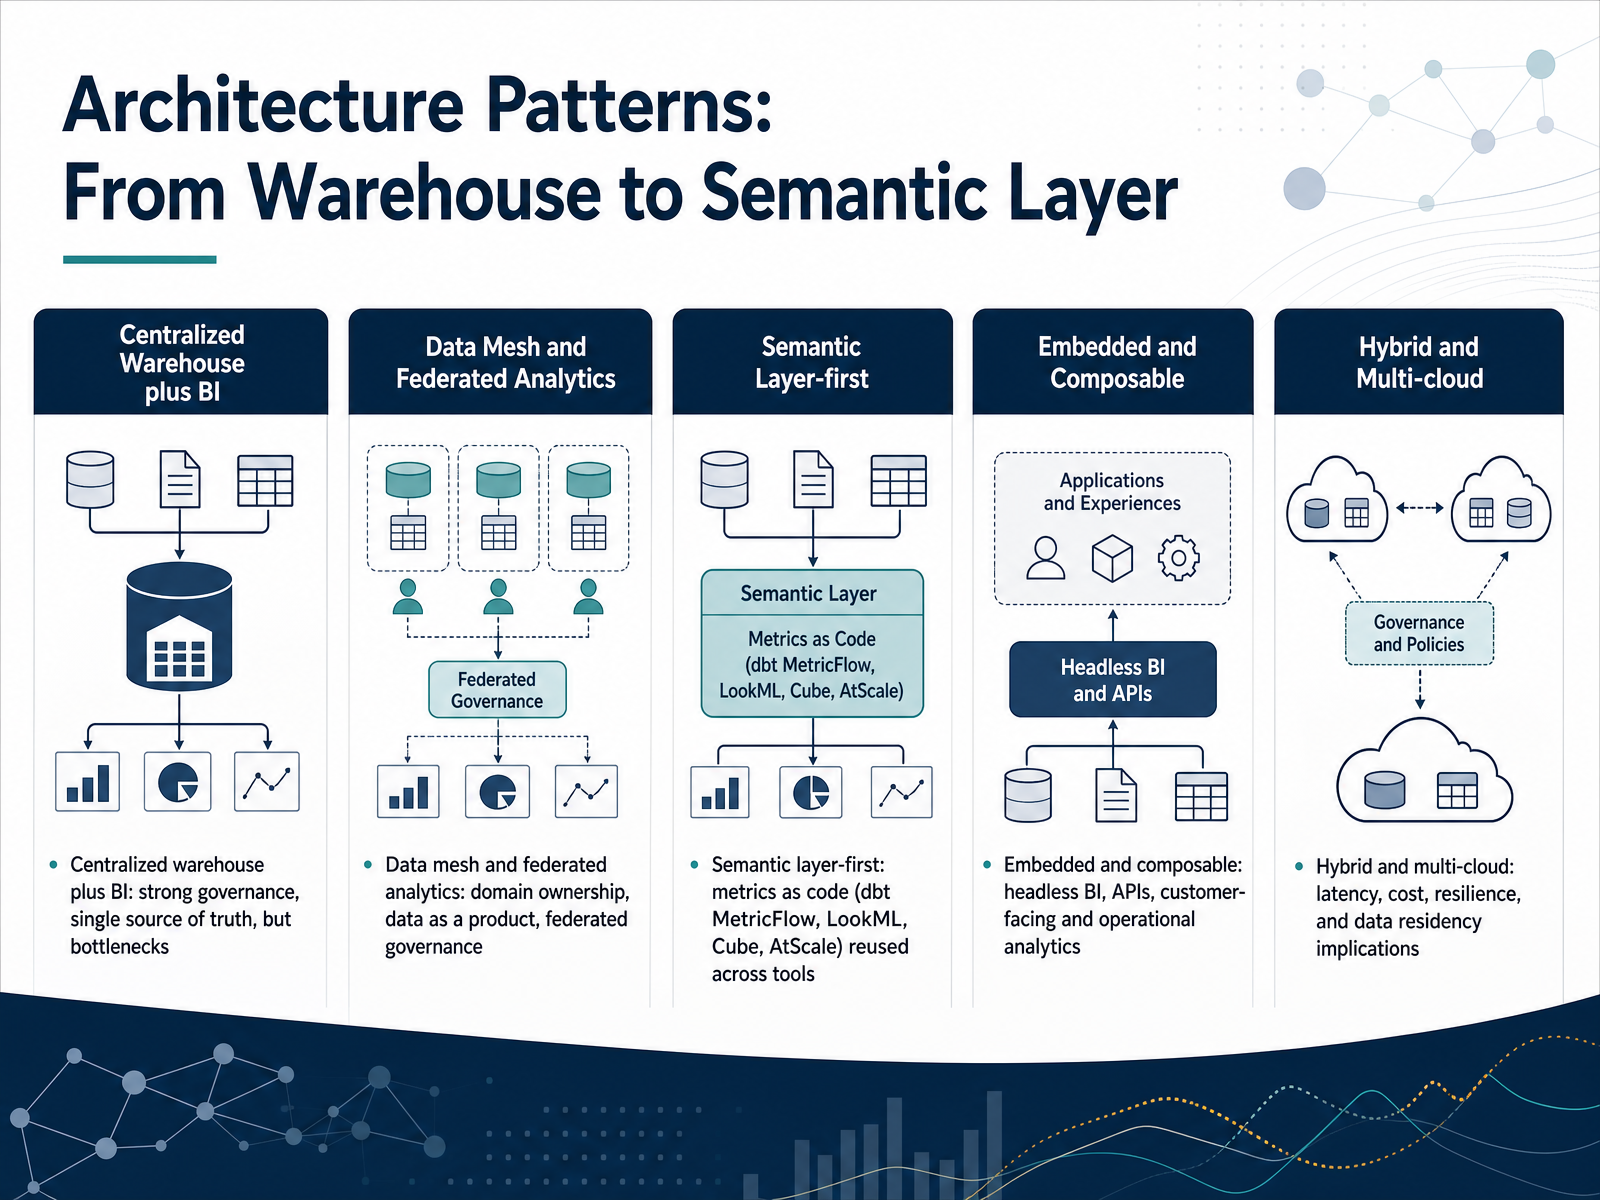
 - 04Architecture Patterns: From Warehouse to Semantic LayerLet's look at the architecture patterns you'll actually be choosing between. The first is a centralized warehouse plus BI. It gives you strong governance and a single source of truth, but it creates bottlenecks, because one team ends up owning every request. Data mesh and federated analytics flip that: domain ownership and data as a product, with governance also federated. Then semantic layer first, where metrics live as code, in tools like dbt MetricFlow, LookML, Cube, or AtScale, and get reused across every tool. Embedded and composable takes that further: headless BI, APIs, customer-facing and operational analytics. And hybrid or multi-cloud adds latency, cost, resilience, and data residency tradeoffs. These aren't mutually exclusive. Most organizations end up combining two. Where Should the Semantic Layer Live?
 knowi.comcube.devgetgalaxy.io+21 min
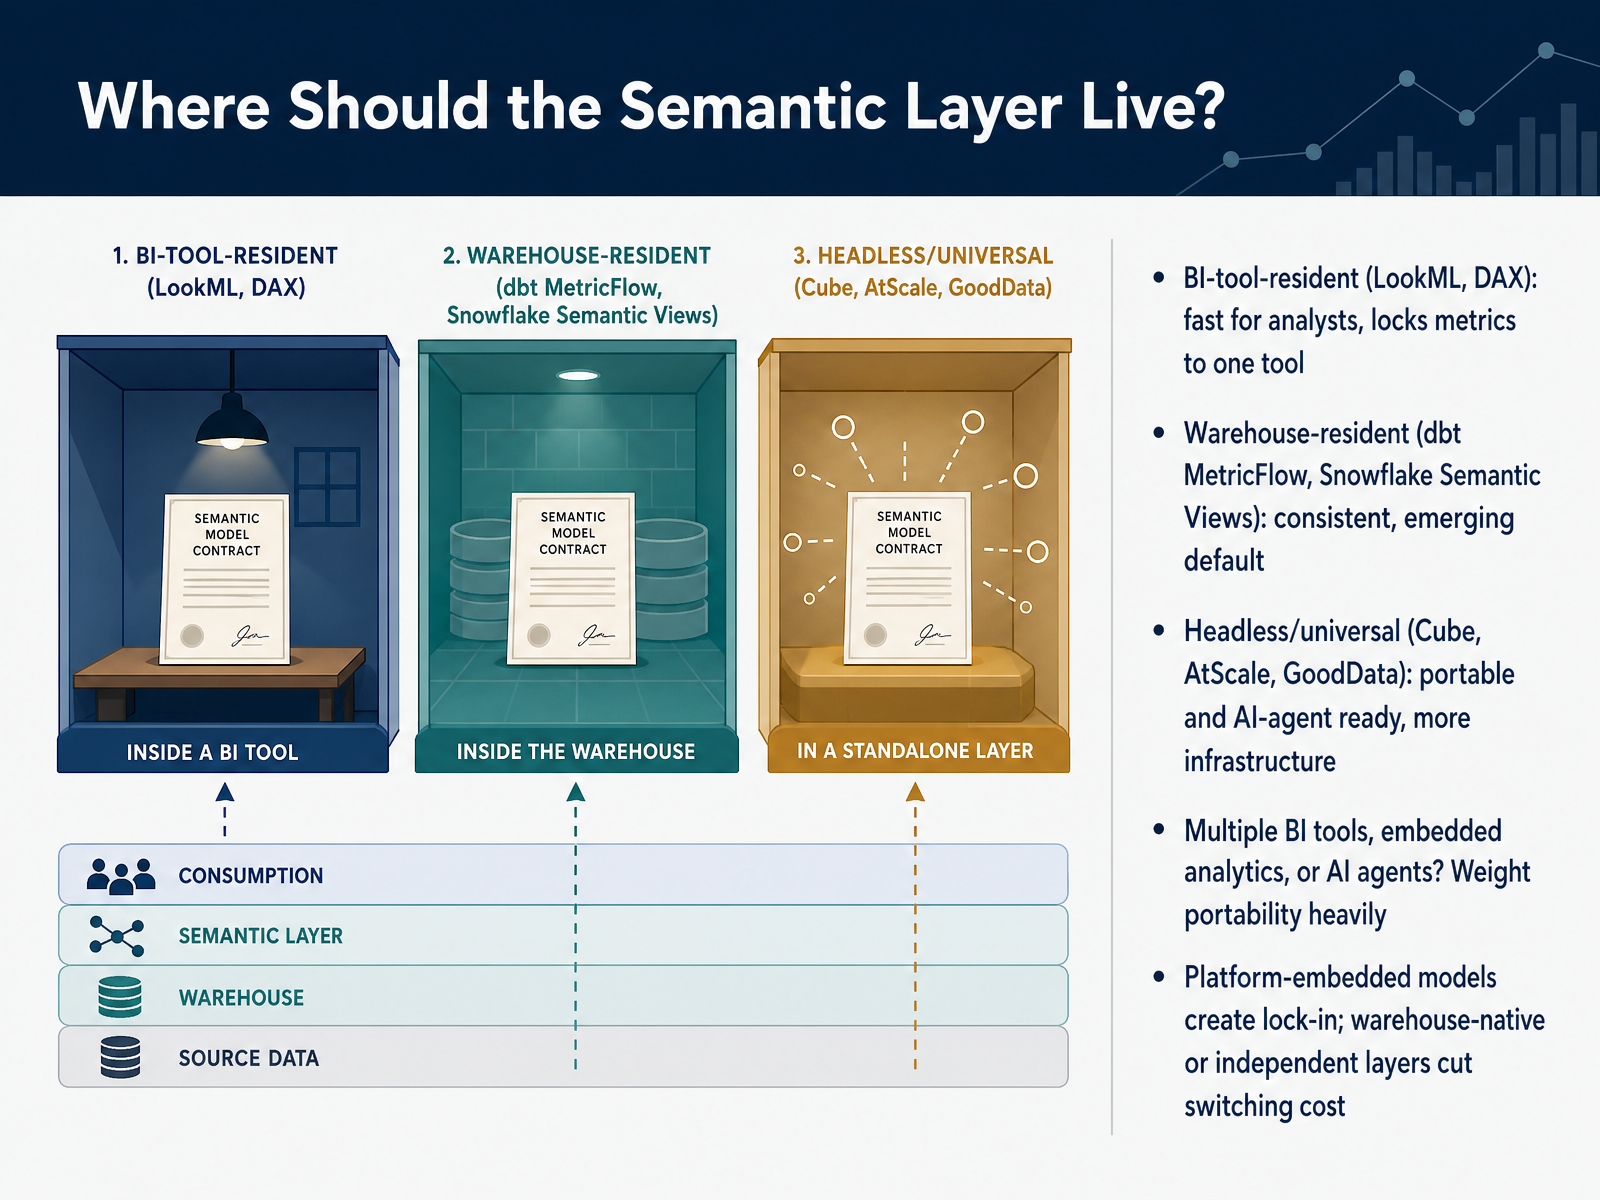
 - 05Where Should the Semantic Layer Live?Let's look at where the semantic layer should actually live. There are three main placements, and the tradeoff is really about coupling versus portability. First, BI-tool-resident, think LookML or DAX. This is fast for analysts because it sits next to the visualization layer. The cost: metrics are locked to that one tool, and anything outside it has to rebuild the logic. Second, warehouse-resident, like dbt MetricFlow or Snowflake Semantic Views. This is becoming the emerging default. Definitions sit close to the data, so consistency improves, though you take on some upstream complexity. Third, headless or universal, examples being Cube, AtScale, and GoodData. These are portable and ready for AI agents, but you operate more infrastructure. So the deciding question is your consumer landscape. If you run multiple BI tools, embedded analytics, or AI agents, weight portability heavily, because a platform-embedded model creates lock-in and raises your switching cost. Next, we'll work through selection criteria and weighted evaluation.
 knowi.comcube.devgetgalaxy.io+21 min
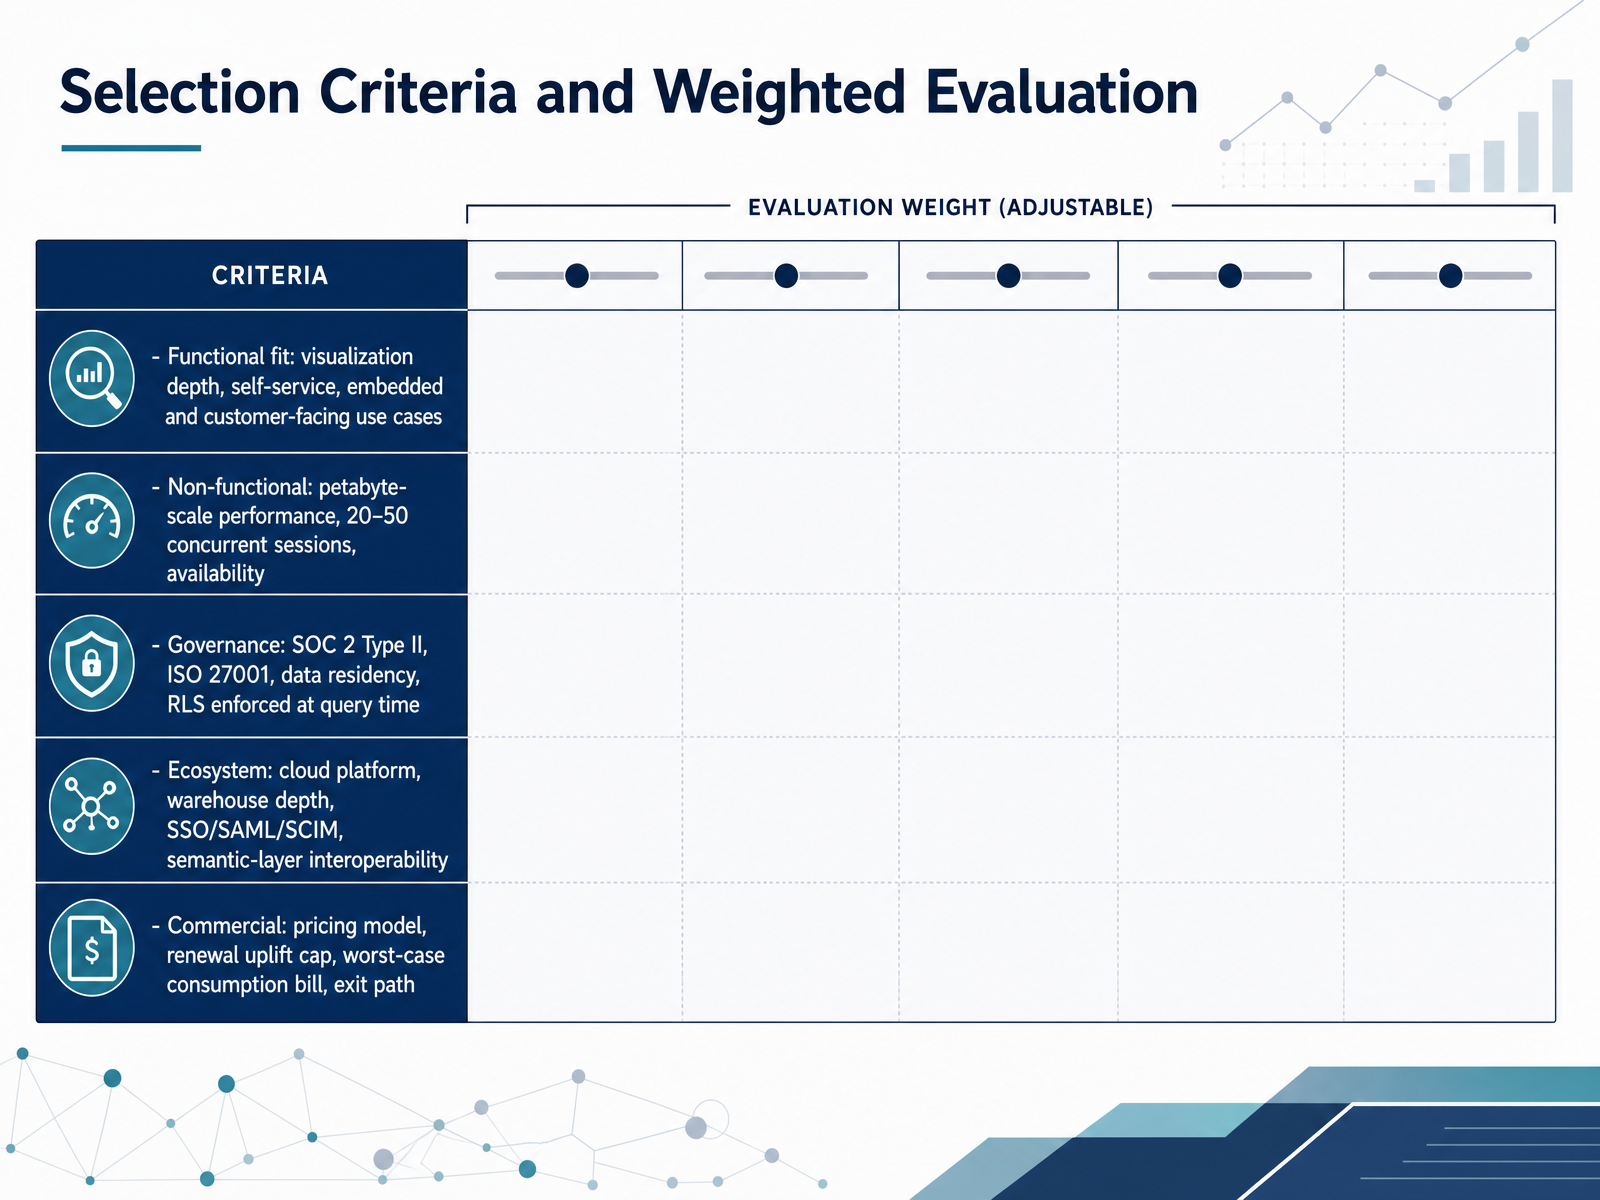
 - 06Selection Criteria and Weighted EvaluationWith the framing settled, let's talk about how you actually score the candidates. Five buckets. Functional fit covers visualization depth, self-service, and whether embedded or customer-facing analytics is in scope, because that changes the licensing model entirely. Non-functional means petabyte-scale performance, realistically twenty to fifty concurrent sessions, and availability targets. Governance is your hard gate. SOC 2 Type II, ISO 27001, data residency, and row-level security enforced at query time, not in the presentation layer. Ecosystem covers cloud platform alignment, warehouse depth, single sign-on, and semantic-layer interoperability. Commercial is its own category. Pricing model, a renewal uplift cap, the worst-case consumption bill, and a documented exit path. One caution. Mature platforms score similarly on features, so your weights do the separating. If most of your last ten data questions repeat, weight governance and TCO higher. If they were mostly ad hoc, weight self-service and time-to-first-insight higher, and consider whether you need a platform at all. Next, Pricing and TCO: Where BI Deals Quietly Fail.
 skopx.cominventive.aiflorence.cloud+22 min
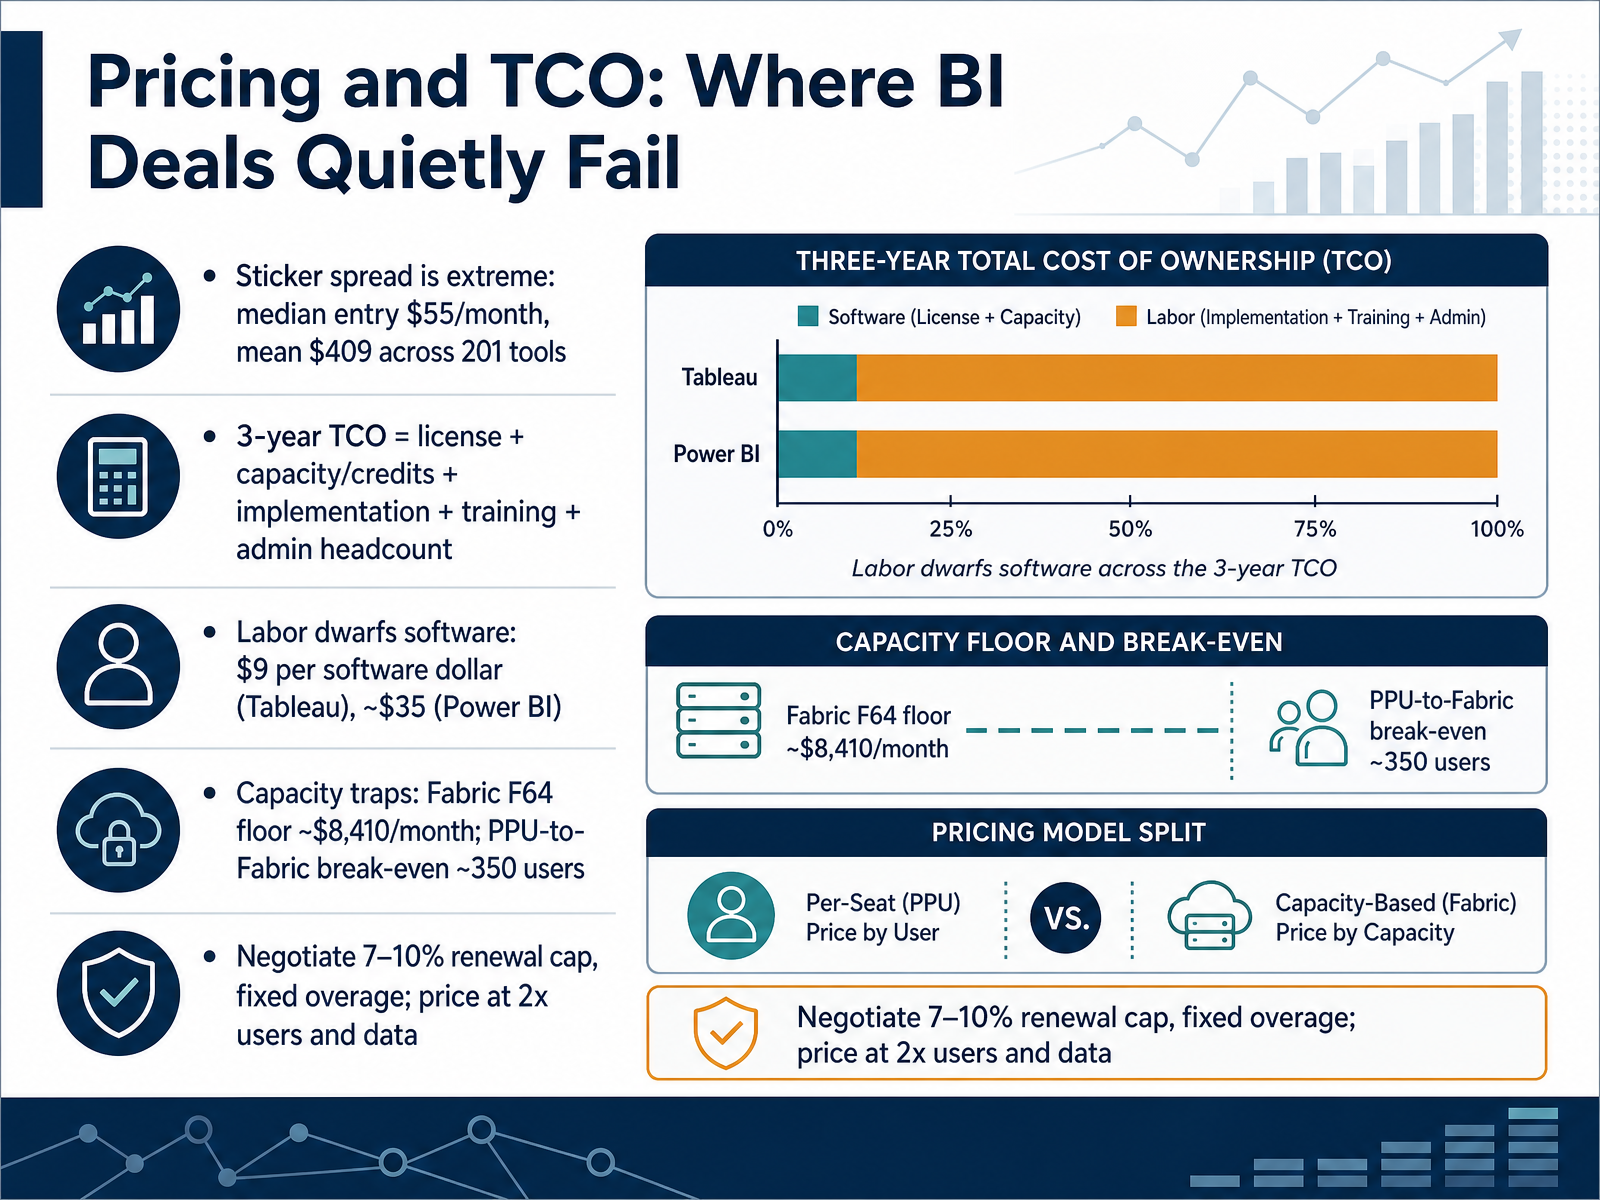
 - 07Pricing and TCO: Where BI Deals Quietly FailLet's talk about where BI deals quietly fail, and that is pricing and total cost of ownership. First, the sticker spread is extreme. Across two hundred and one tools, the median entry price is fifty five dollars a month, while the mean is four hundred and nine dollars. That gap tells you the median is a poor guide, because a few enterprise platforms sit far above a long tail of cheap dashboards. When you build a three year total cost of ownership, license is only one line. Add capacity or credits, implementation, training, and administration headcount. Labor usually dwarfs software. One analysis puts it near nine dollars of labor per software dollar for Tableau, and roughly thirty five for Power BI, largely because people build and maintain the reports. Capacity is the quiet trap. A Fabric F sixty four floor runs about eight thousand four hundred ten dollars a month, and the break even between Premium Per User and Fabric sits near three hundred fifty active users. Below that, PPU is generally cheaper. Above it, Fabric F sixty four wins on licensing alone. So negotiate while you still have leverage. Ask for a written renewal cap of seven to ten percent, a fixed overage rate, and pricing at twice your current users and data volume. That last clause is what separates an approved budget from a surprise. Tradeoffs That Decide the Outcome.
 nucleusresearch.comtechvendorindex.comtoolradar.com+22 min
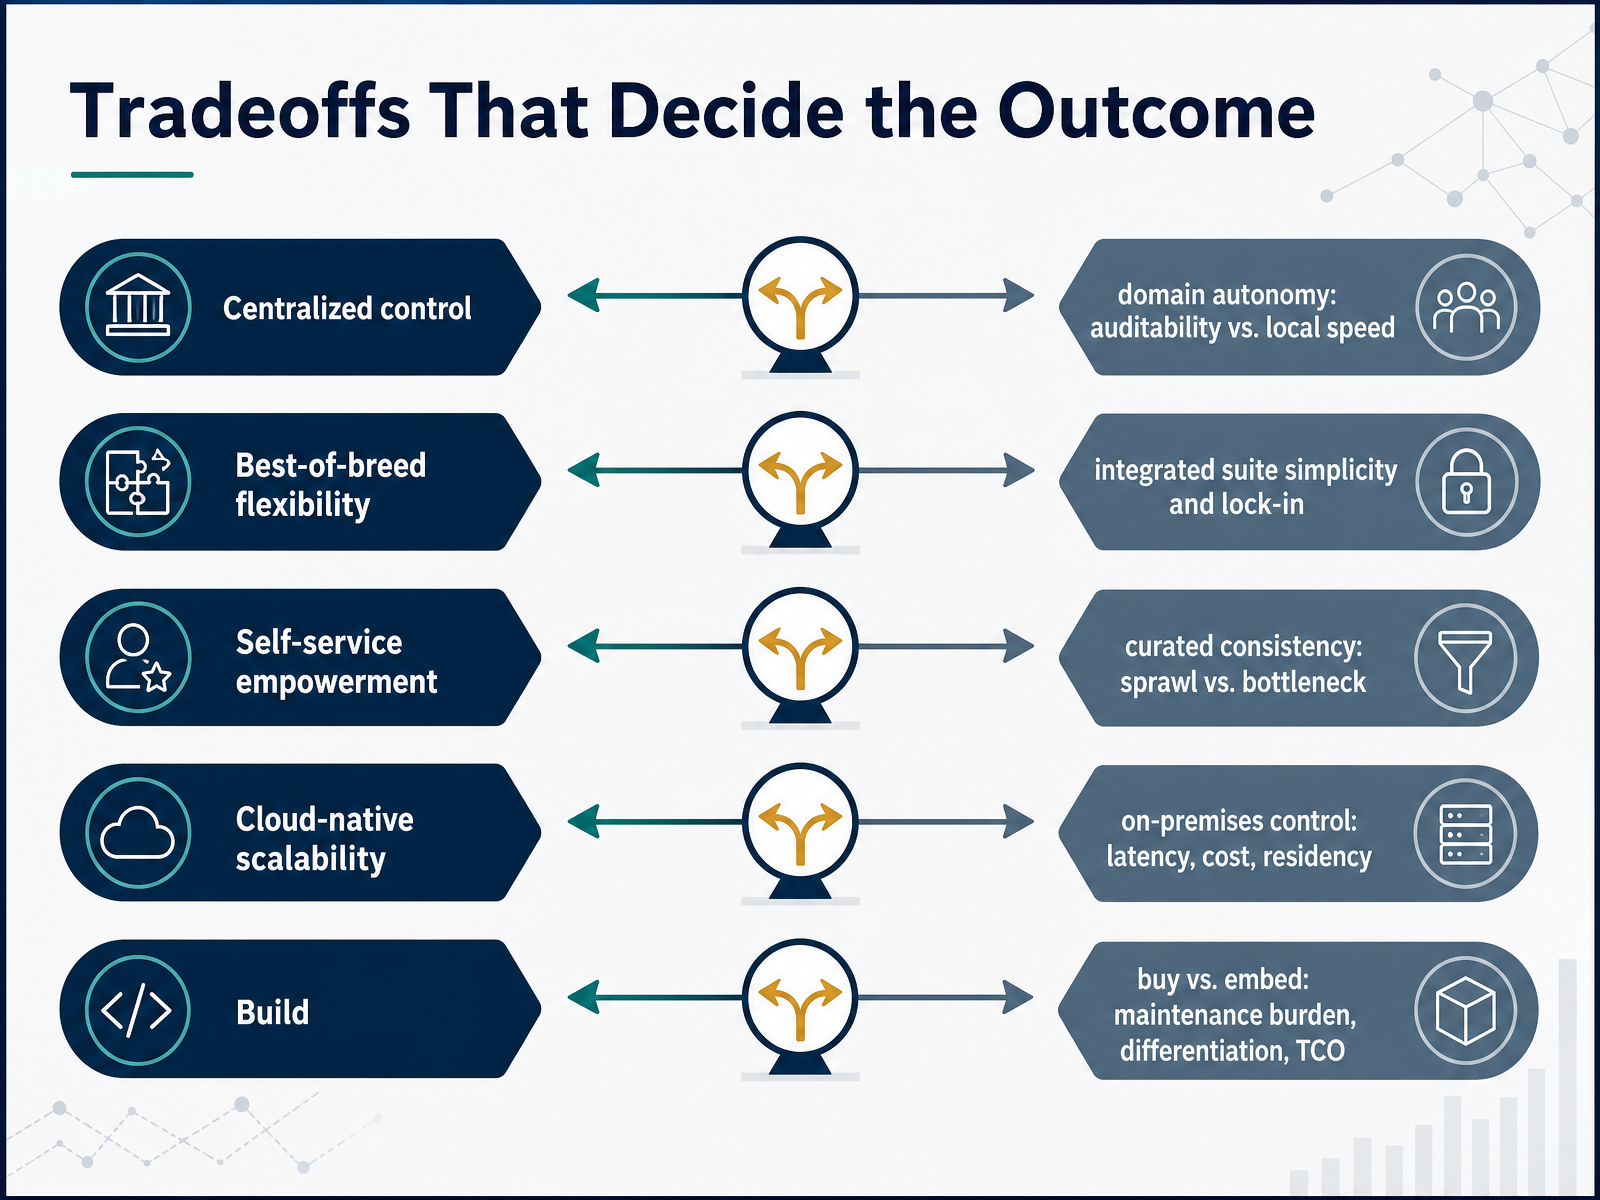
 - 08Tradeoffs That Decide the OutcomeLet's turn to the tradeoffs that actually decide the outcome. Most teams frame this as picking a tool. You're really picking a governance model, and the tradeoffs show up in how access is enforced, how fast questions get answered, and what audits cost you later. Centralized control gives you auditability and consistent definitions, but requests can take weeks, and that delay often pushes people into spreadsheets. Domain autonomy moves faster, and it fragments metrics unless the semantic layer holds definitions in place. Best-of-breed gives flexibility across specialized tools, while an integrated suite simplifies operations at the cost of lock-in and escalators at renewal. Self-service empowers users, though ungoverned it produces sprawl and competing numbers. Curate too tightly and you get a bottleneck. Cloud-native scales elastically, but on-premises still wins where residency, latency, or fixed cost control matters. And build versus buy versus embed comes down to maintenance burden, differentiation, and total cost of ownership, where licensing is often under half the real spend. There's no universally right answer. Match each decision to how costly a wrong number would be in that domain. Next, we'll look at how to get governance and speed together. Governed Self-Service: The Hybrid Model.
 promethium.ainucleusresearch.comtechvendorindex.com+22 min
 - 09Governed Self-Service: The Hybrid ModelLet's look at governed self-service, and why most mature organizations land on a hybrid model rather than picking one extreme. The evidence for centralization is real. Unified access controls and certification workflows correlate with fifty-seven percent fewer BI-related security incidents, and audit-intensive industries report eighty-three percent fewer compliance violations. Consolidated definitions and clear ownership can cut dashboard duplication by up to sixty percent. But the cost of control is latency. When every request queues behind one team, turnaround runs three to six weeks, and that friction pushes users into shadow BI. Decentralized execution flips that. Domain teams move twenty-five to forty percent faster on reporting cycles, but without guardrails you get metric drift, duplicate tools, and no clear owner when numbers conflict. The hybrid answer is a central semantic layer holding one definition per metric, with controlled self-service at the edge. Governance lives in the model, not in permissions. The maturity path is predictable: centralize first to earn trust, decentralize gradually as ownership strengthens, then run distributed ownership under guardrails. Watch for overload in both directions, either backlog and shadow BI, or drift and tool sprawl. Next, we turn to governance, security, and cost management.
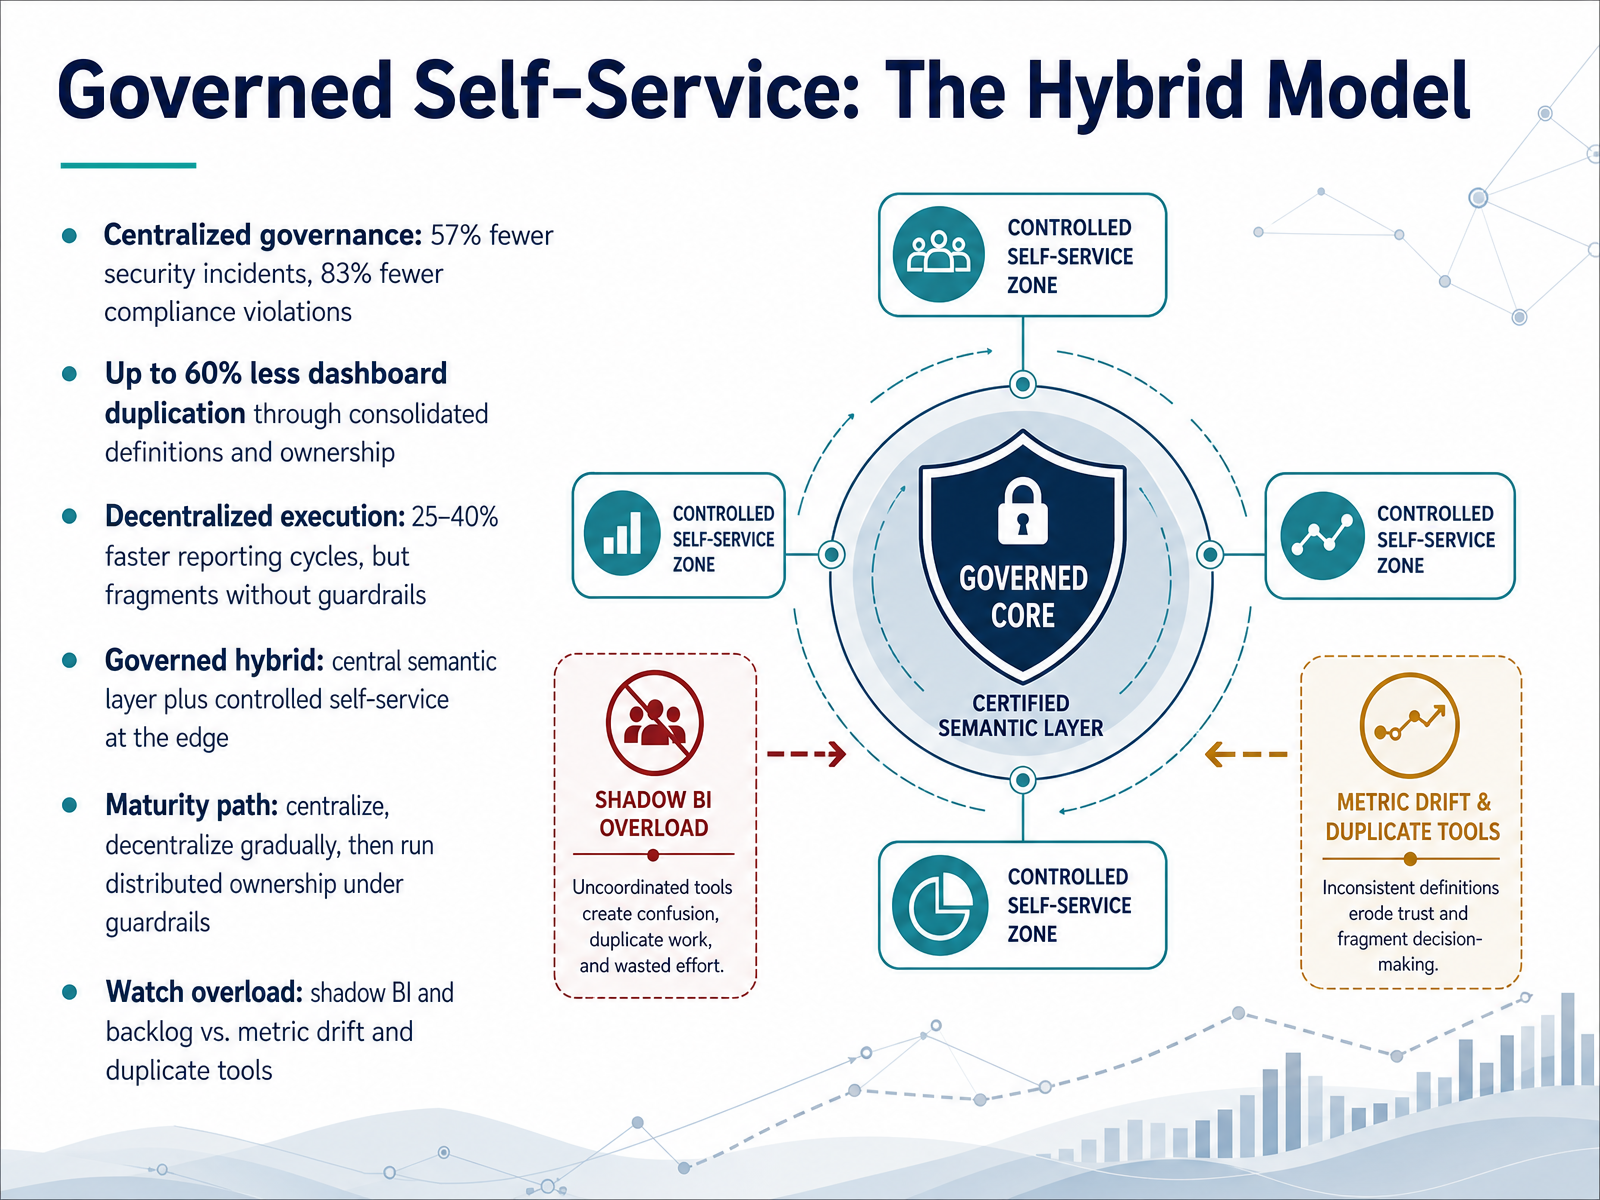 promethium.ai2 min
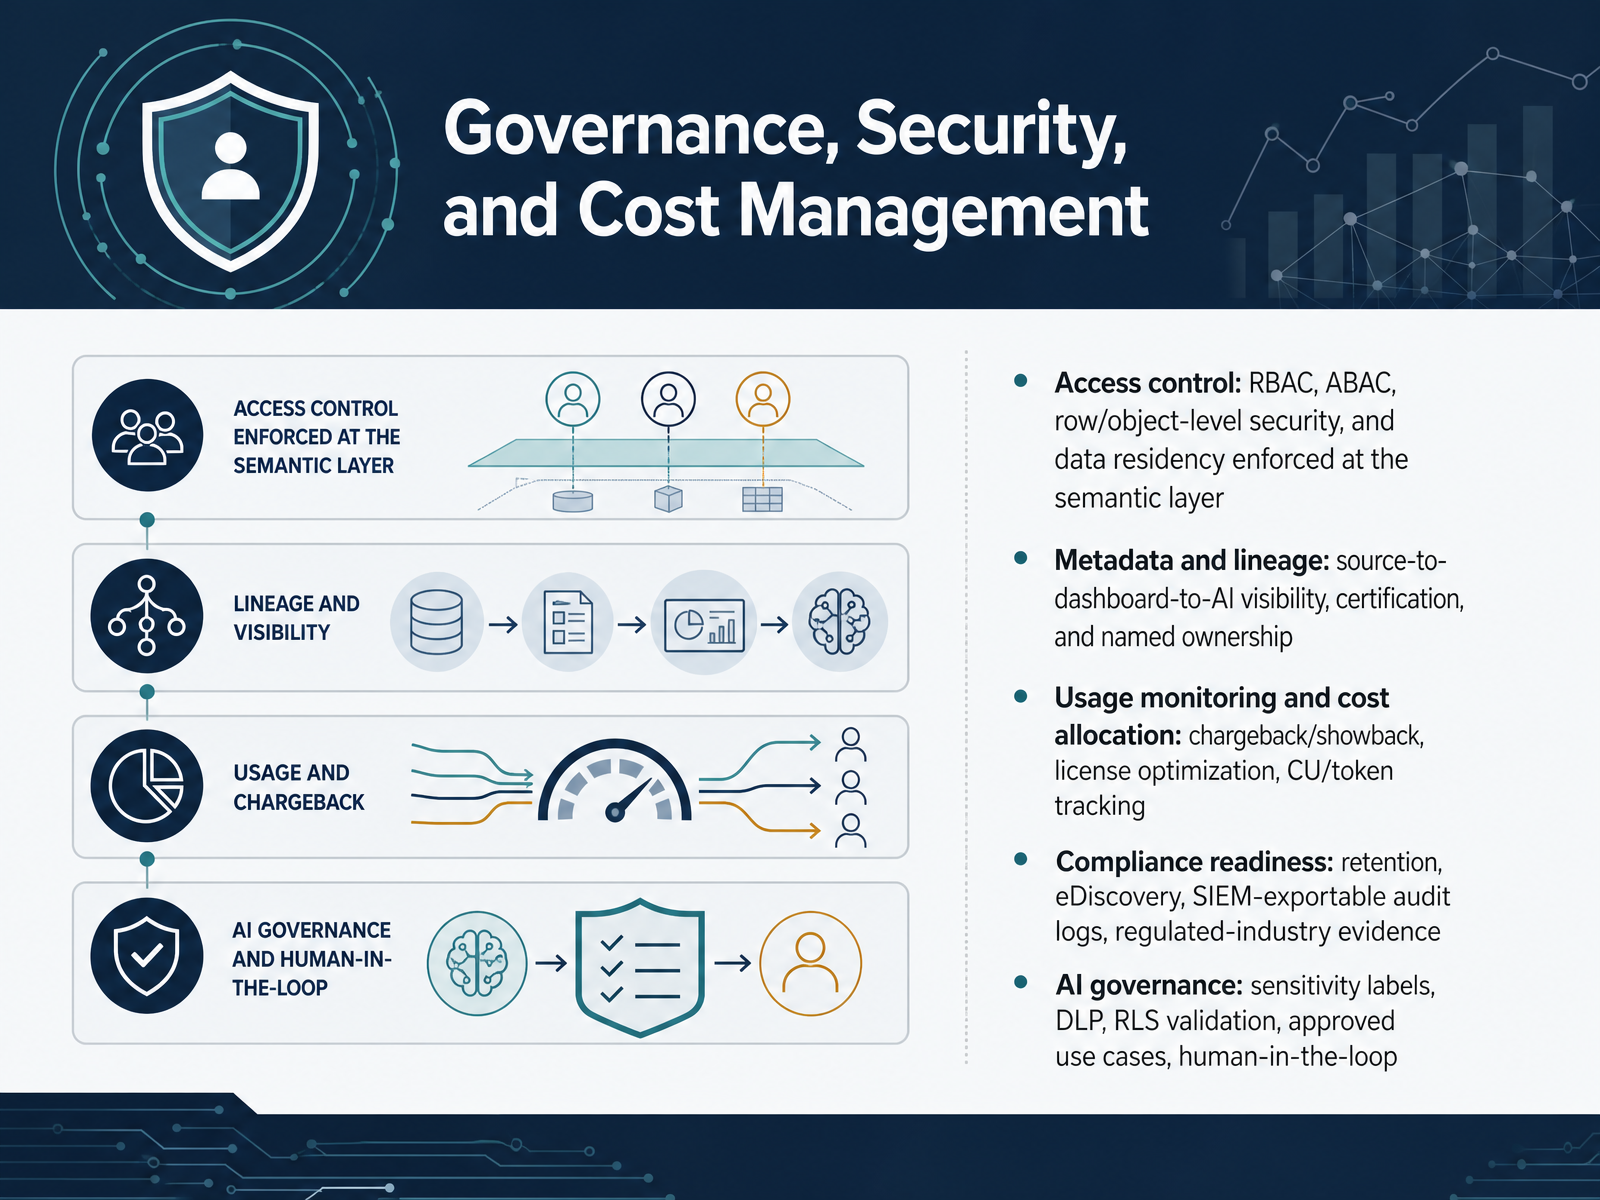
 - 10Governance, Security, and Cost ManagementLet's talk about governance, security, and cost management, because these are the controls that decide whether your platform is actually trustworthy at scale. Access control has to be enforced at the semantic layer through role-based and attribute-based models, row and object-level security, and data residency rules. If a user asks a Copilot question, that same row-level security still applies, so validate it, because generated queries can cross security boundaries in unexpected ways.
Metadata and lineage give you source-to-dashboard-to-AI visibility. Certification and named ownership matter here, because a definition without an owner goes stale.
On cost, the real shift is consumption. Copilot in Fabric has no separate per-seat license, but it consumes capacity units from your Fabric pool. Each invocation can run ten to forty times the compute of a normal query, so monitor usage, attribute it through chargeback or showback, and reserve headroom. A model surface restricted to certified semantic models can cut that consumption meaningfully.
For compliance, you want retention, eDiscovery, and exportable audit logs. For AI governance, sensitivity labels, data loss prevention, approved use cases, and human-in-the-loop review. Next, we'll look at AI and the Semantic Layer: Evidence and Limits.
 knowi.comovaledge.com2 min
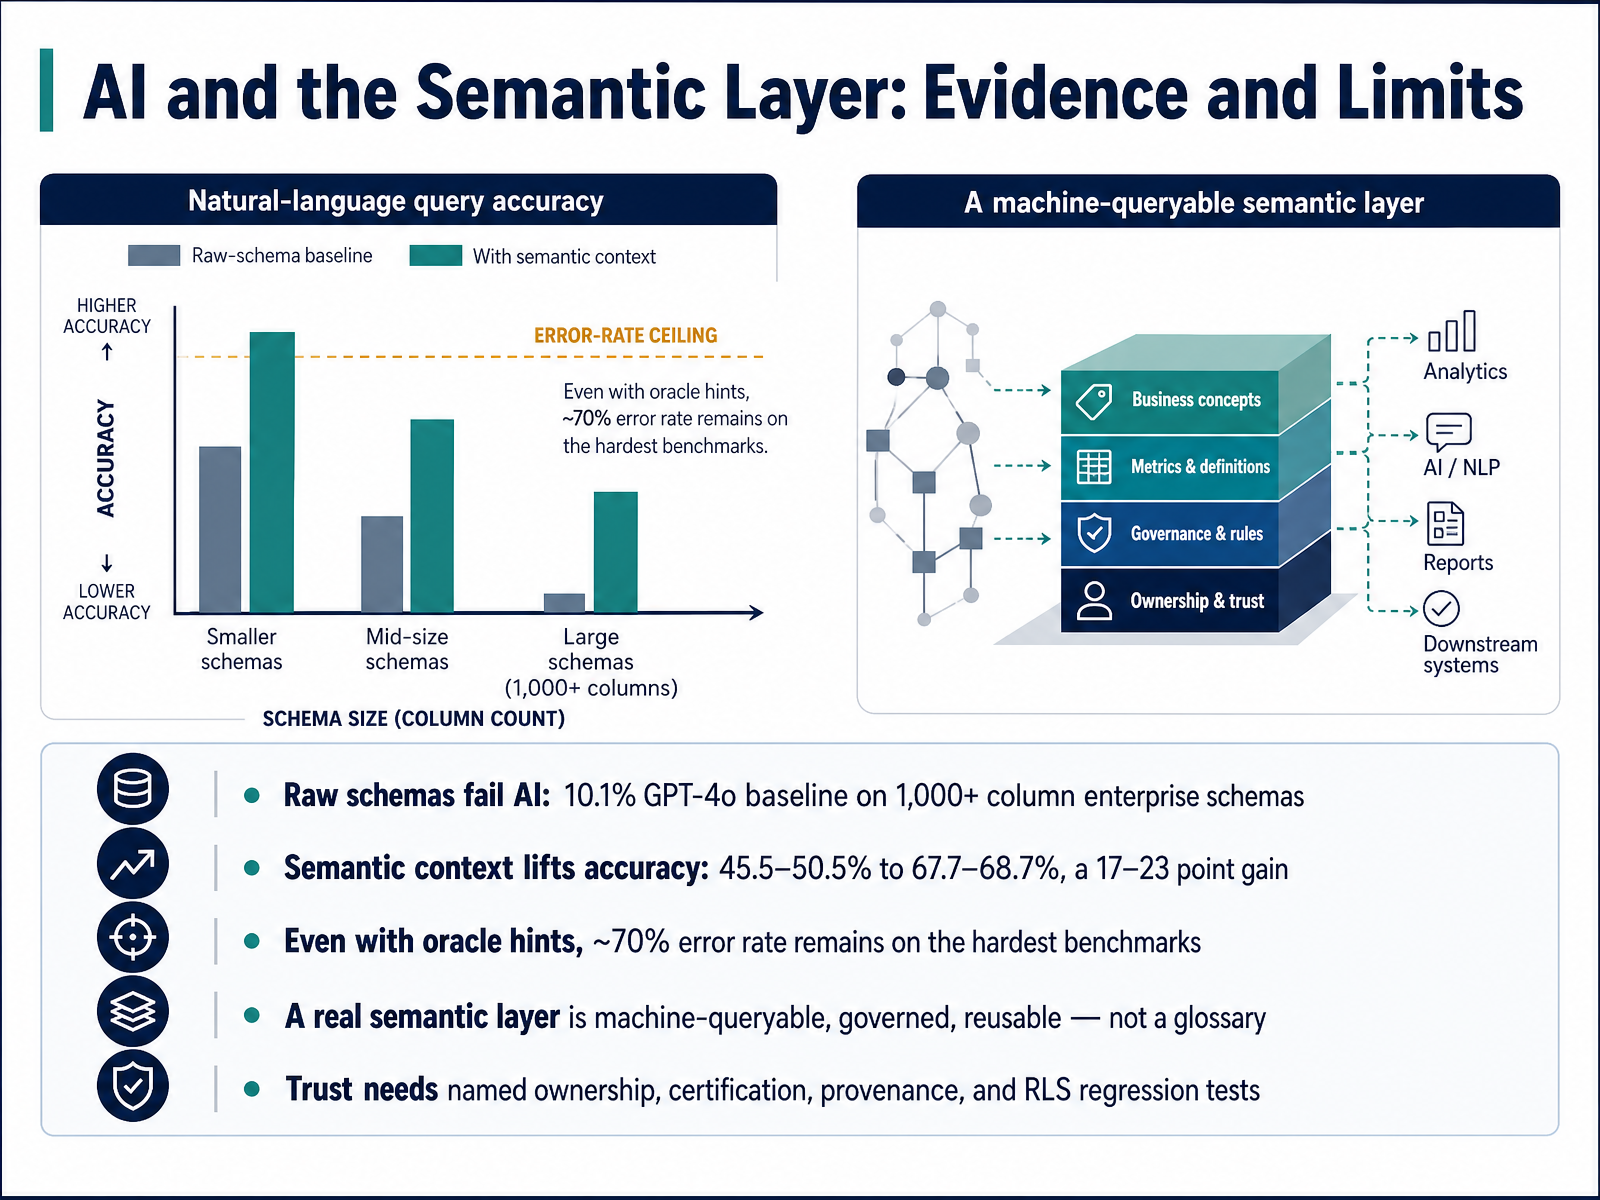
 - 11AI and the Semantic Layer: Evidence and LimitsLet's look at what the evidence actually says about AI and the semantic layer, because the claims here are stronger than the data. On raw enterprise schemas, with more than a thousand columns, GPT-4o scored a baseline of ten point one percent on text-to-SQL. Add a small semantic document, and three frontier models moved from roughly forty-five to fifty percent up to sixty-eight percent. That is a real gain of seventeen to twenty-three points. But note the limits. Even with oracle-level hints on the hardest benchmark, roughly a seventy percent error rate remained. So semantics help, and they do not solve it. Which means a real semantic layer must be machine-queryable, governed, and reusable. A glossary is not enough. Trust also needs named ownership, certification, answer provenance, and row-level security regression tests. Next, we turn to the migration and consolidation playbook.
 knowi.comovaledge.comcube.dev+22 min
 - 12Migration and Consolidation PlaybookNow let's talk about execution. The migration and consolidation playbook is where most programs succeed or quietly stall.
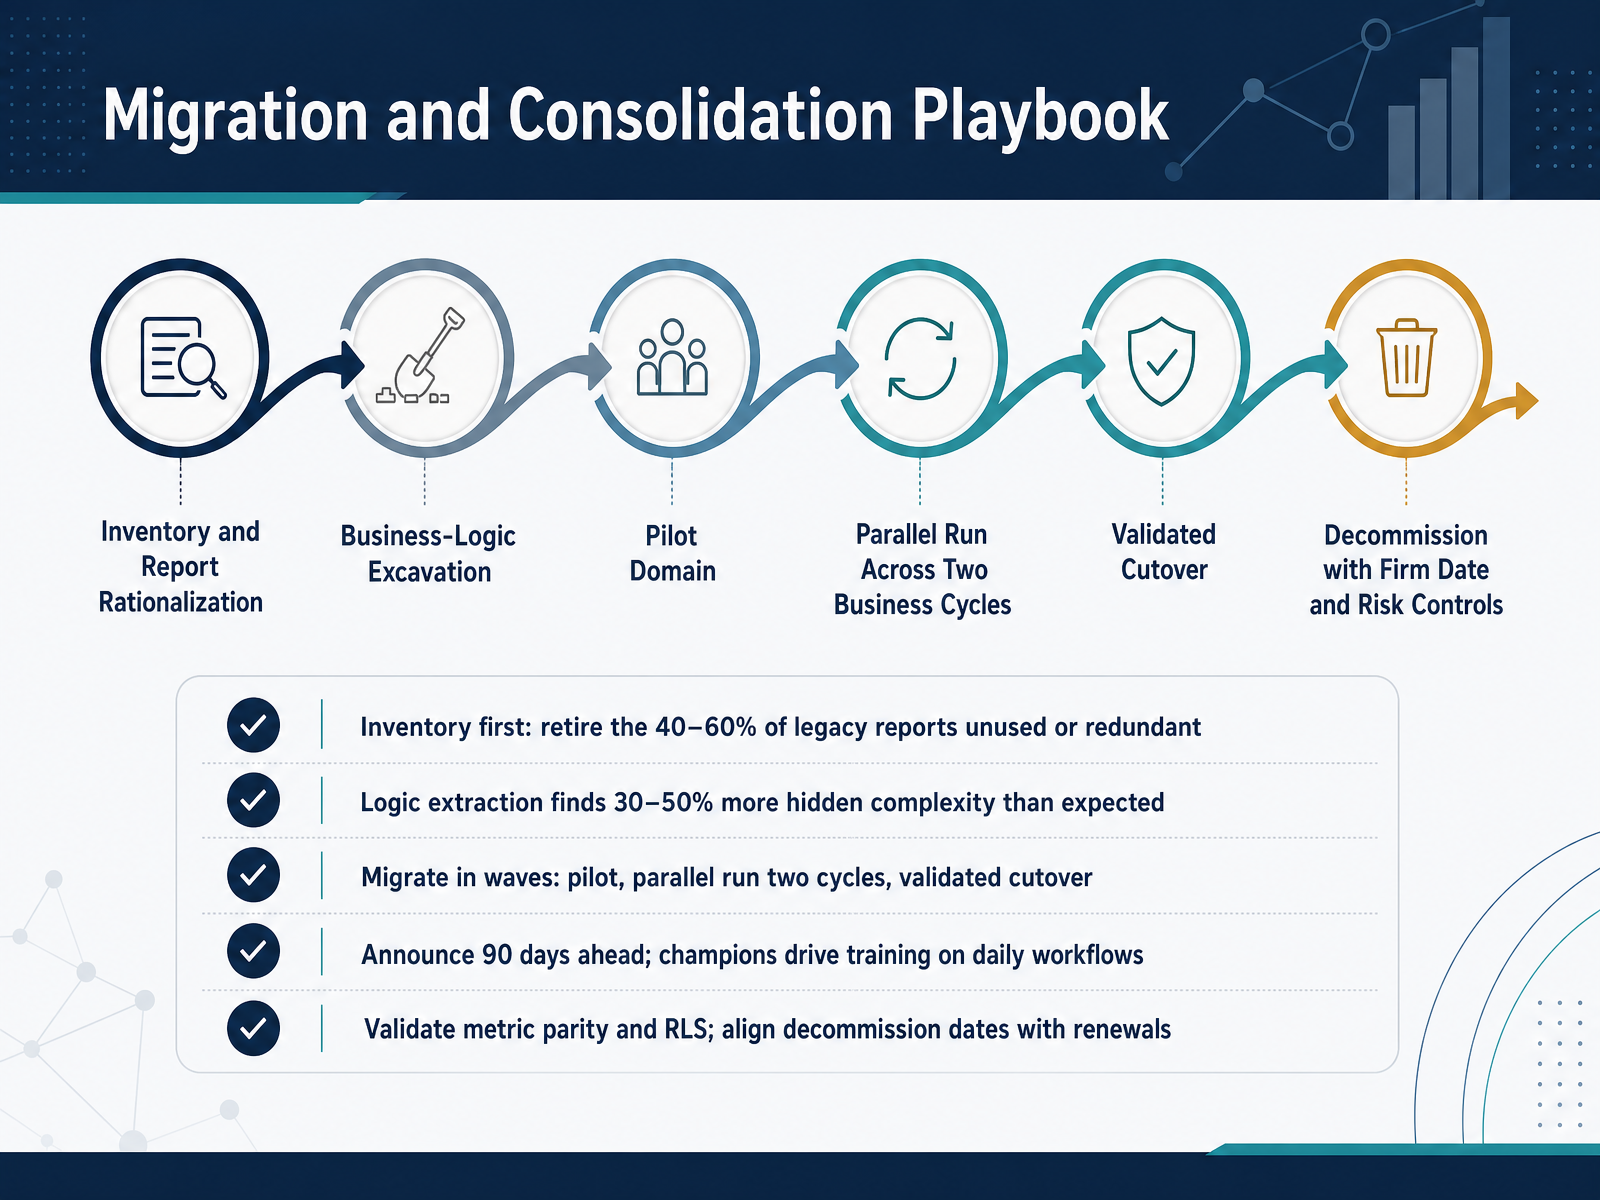
It starts with inventory, not conversion. Audit every report and dashboard, and you'll typically find that forty to sixty percent are unused, duplicated, or redundant. Retire those before you build anything. That single step cuts scope, cost, and timeline.
Then treat it as a logic-extraction project. Inventory consistently surfaces thirty to fifty percent more hidden business logic than expected. Calculated fields nobody documented, hardcoded SQL rules, scheduled jobs feeding the board pack. Find those early, because every one you discover late becomes a schedule slip.
Migrate in waves. Pilot one domain, run parallel for two full business cycles, validate, get written sign-off, then move to the next wave. Run parallel on metric parity and row-level security. Premature decommissioning costs more in lost trust than a longer overlap ever will.
Announce ninety days ahead, assign departmental champions, and tie training to daily workflows rather than generic platform tours. And align decommission dates with license renewals, or you'll pay for a year of seats you use for two months.
One caution. Consolidation is the broader decision. Migration is often its most expensive outcome. If the sprawl is cosmetic, rationalize lightly and leave the rest alone.
With that in place, how do you actually choose? Let's turn to the decision framework: seven questions and a weighted scorecard.
 nucleusresearch.comtechvendorindex.comtoolradar.com+22 min
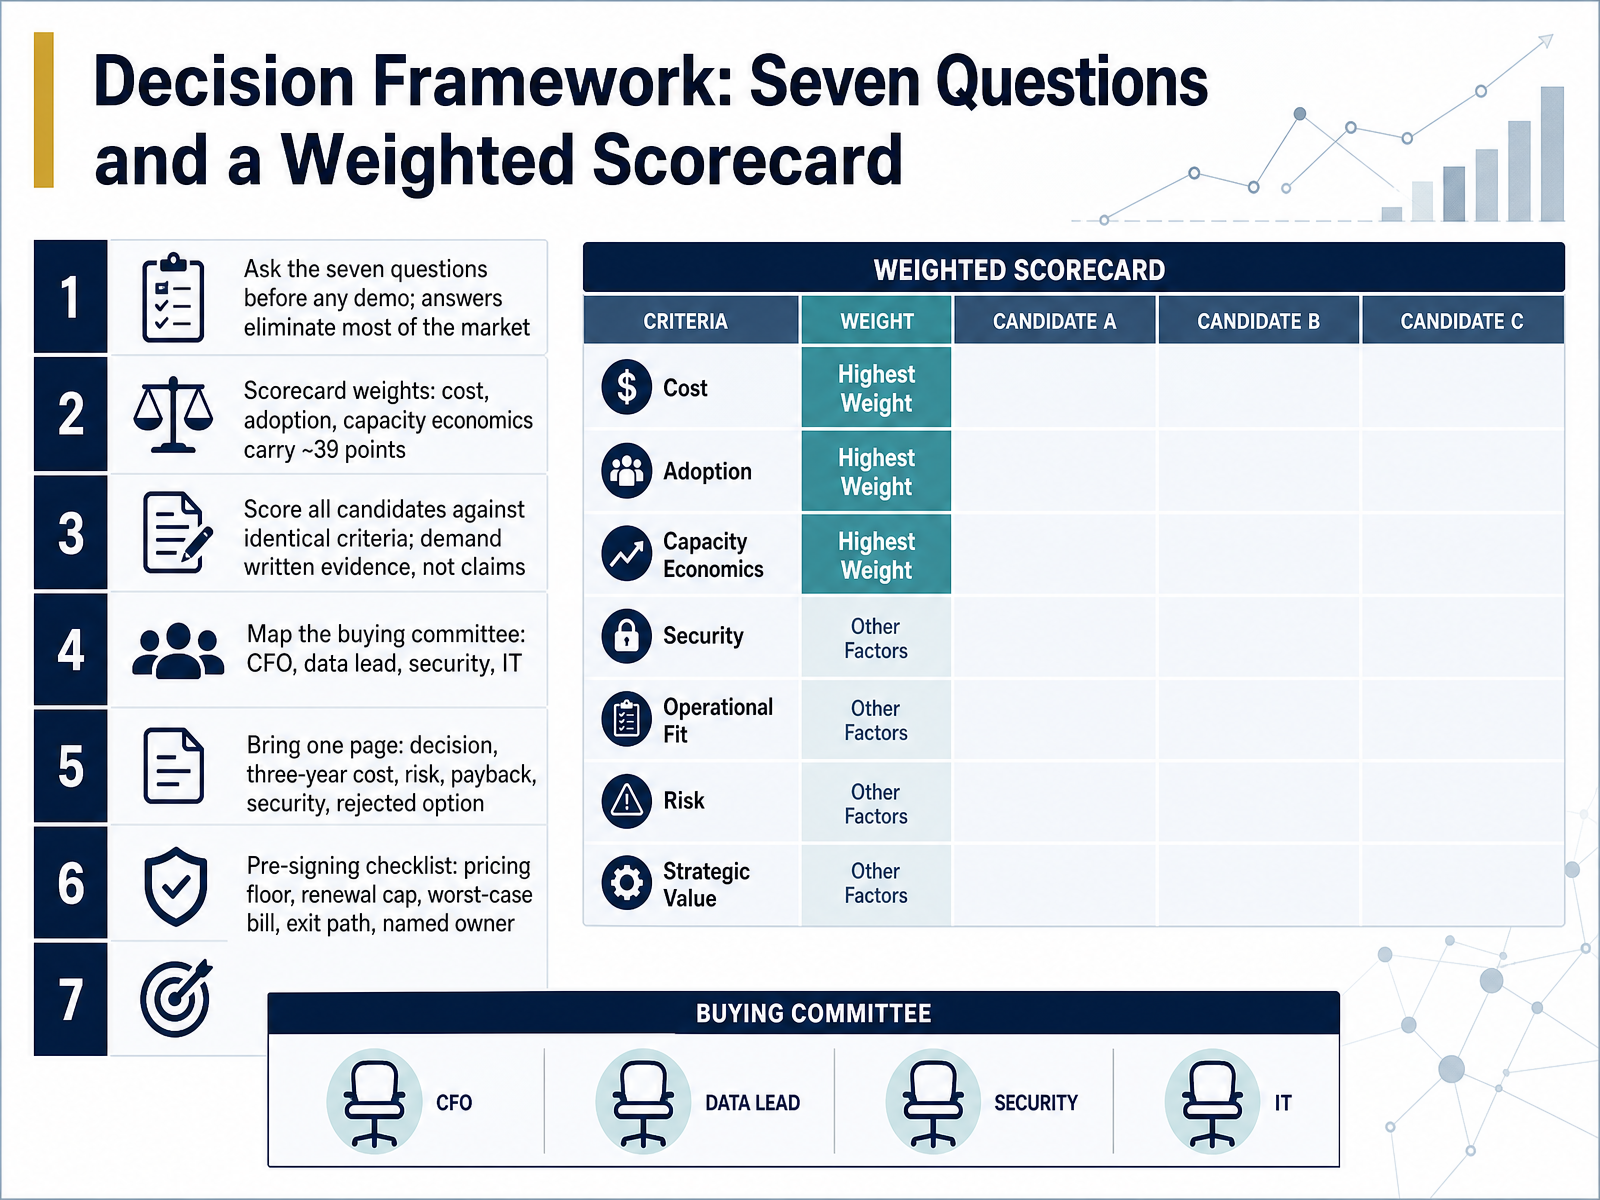
 - 13Decision Framework: Seven Questions and a Weighted ScorecardBefore you build your own scoring spreadsheet, start with the seven questions. Where does the data live? Who asks the questions, and who answers them today? How fresh does the answer really need to be? What is the output artifact? What governance do you owe, and to whom? What shape is your budget? And who fixes it at nine a.m. on a Tuesday? Answered honestly before the first demo, those seven questions eliminate most of the market. Then score every candidate against identical criteria. Cost, adoption, and capacity economics carry roughly thirty-nine of one hundred points, because that is where these deals quietly fail. Demand written evidence, not claims. Map the buying committee early: the CFO, the data lead, security, and IT each hold a different veto. And bring one page to the decision: the recommendation, three-year cost, main risk, payback, security clearance, and the rejected option with the reason why. Before signing, lock in the pricing floor, a renewal cap, a worst-case consumption bill, a documented exit path, and a named owner. Pilot design and the ten-question takeaway checklist come next.
 skopx.comdataarchitect.cotopickz.com+22 min
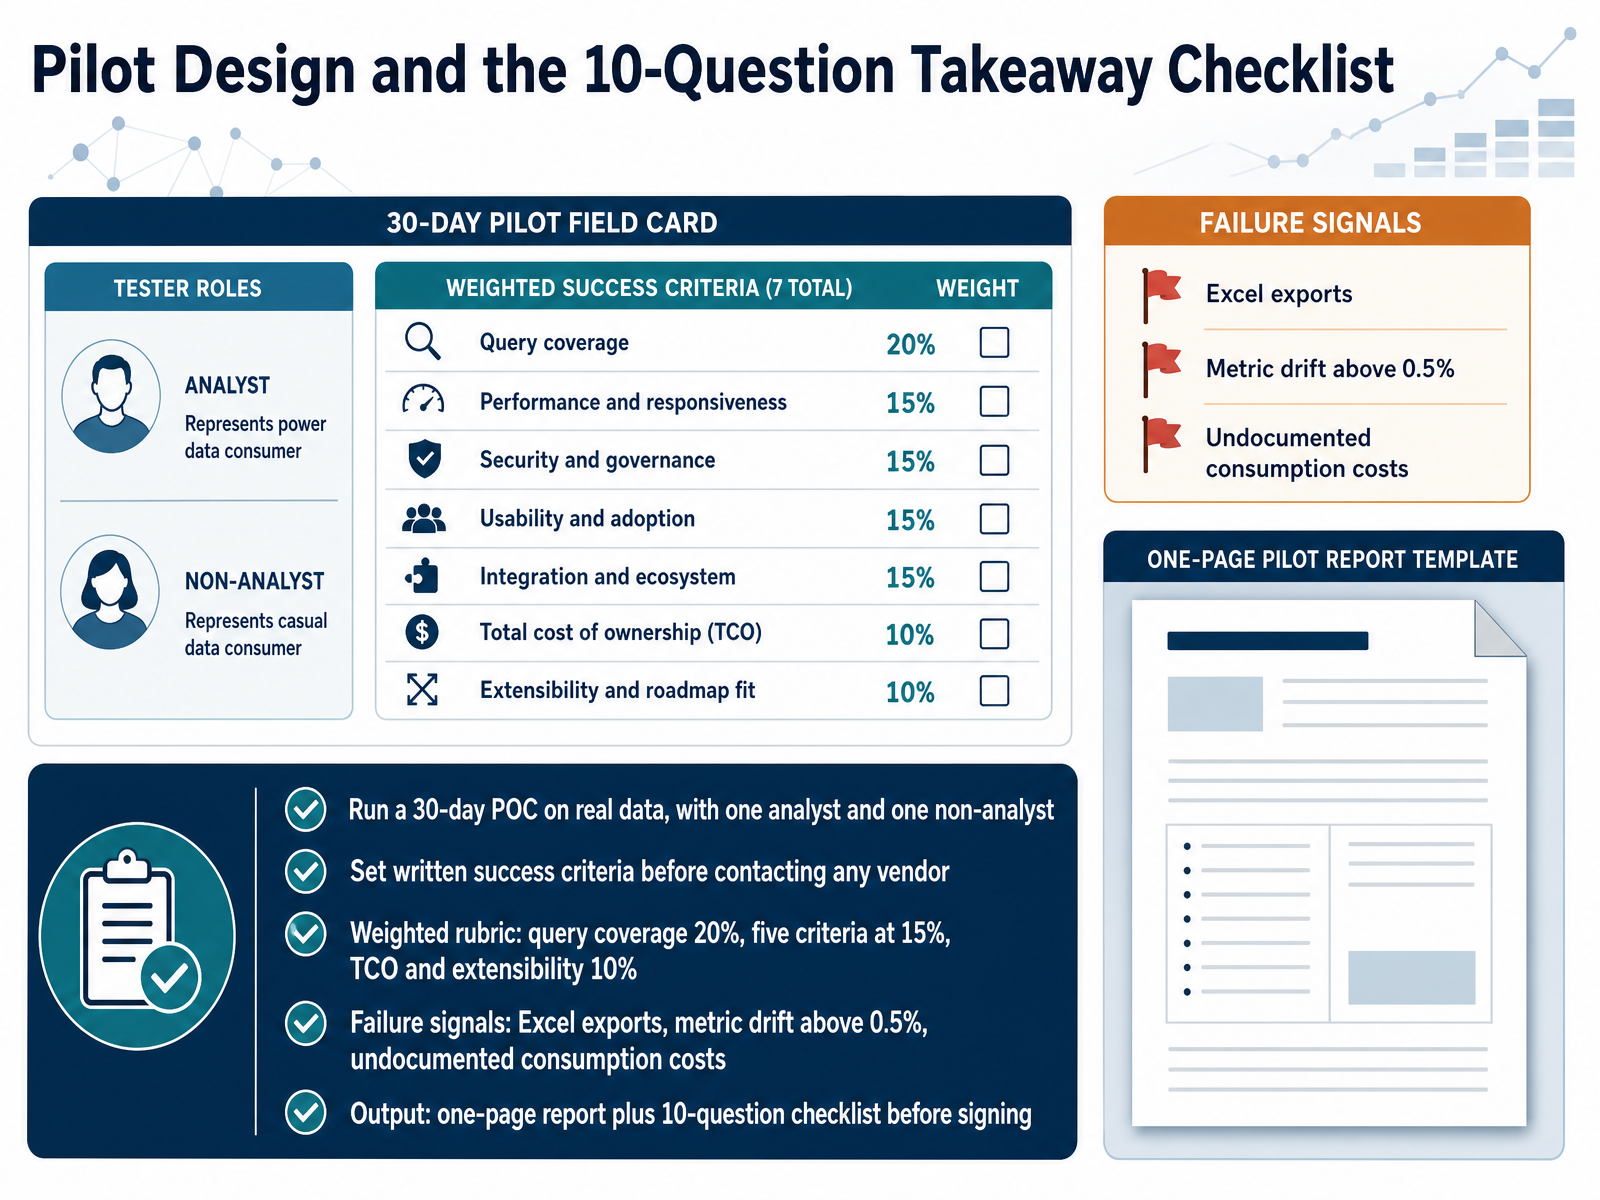
 - 14Pilot Design and the 10-Question Takeaway ChecklistLet's close with the pilot itself, because all the careful thinking in the world still fails without disciplined testing. Run a thirty-day proof of concept on your real data, with two named users: one analyst and one non-analyst. Set written success criteria before you contact any vendor, so the shortlist is driven by your requirements rather than the smoothest demo.
Score with a weighted rubric. Query coverage takes twenty percent. Five criteria take fifteen percent each, covering areas like semantic correctness, governance, and end-user adoption. Total cost of ownership and extensibility take ten percent each.
Watch for failure signals. Excel exports mean users have already reverted. Metric drift above zero point five percent is a red flag, not a rounding issue. And undocumented consumption costs will follow you into year two.
The output is one page: the recommendation, the score, the open risks, and a ten-question checklist you answer before signing. So to recap: define criteria first, test with real users on real data, score on a rubric, and decide in writing within the timebox. Thank you for working through this with me, and good luck with your selection.
 skopx.comdataarchitect.cotopickz.com+22 min
Take the deck with you
Download this course as a file — free, no sign-up needed.
- PDF handoutEvery slide page, ready to print or share.15 pages · 3.8 MBDownload
- PowerPoint slidesThe full deck as a .pptx — open it in PowerPoint, Keynote, or Google Slides.15 pages · 3.6 MBDownload
Free to use in your own training — please keep the PersonWise credit page at the end.
Have your own deck? Turn it into a course
Sources consulted
Web sources consulted while building this course.
- How to Choose a BI Platform: A 2026 Decision Framework — skopx.com
- Business Intelligence RFP Guide + Vendor Evaluation [2026] — inventive.ai
- Big Data & BI Vendor RFP Checklist for CTOs — florence.cloud
- How to Evaluate BI Tools (Before the Capacity Bill Surprises You) | TopickZ.com — topickz.com
- How to Select a BI Tool: The Evaluation Framework for Enterprise Analytics | DataArchitect.co — dataarchitect.co
- Business Intelligence Software Market Size Report, 2033 — grandviewresearch.com
- Business Intelligence (BI) Global Market Report 2026 — giiresearch.com
- Business Intelligence (BI) Vendors Market Size, Share Report 2026 — thebusinessresearchcompany.com
- Business intelligence software statistics 2026: pricing, ratings, market data | Toolradar Research — toolradar.com
- Business Intelligence Platform Market Research Report 2034 — marketintelo.com
- The Semantic Layer Playbook (2026): Evidence & Build Plan | Knowi — knowi.com
- Semantic Layer Architecture in the AI Era | Cube — cube.dev
- [Galaxy] What Is a Semantic Layer? Architecture, Examples, Implementation (2026) — getgalaxy.io
- Data Warehouse to BI Layer Arbitration Patterns: Where the Semantic Layer Should Live | Product Philosophy — productphilosophy.com
- Semantic Layer Architecture Explained for Enterprise AI — ovaledge.com
- BI and Analytics Technology Value Matrix 2026 — nucleusresearch.com
- Best BI for Enterprise 2026 — Top 8 Platforms Ranked — techvendorindex.com
- Microsoft Fabric vs Power BI Premium: 2026 Break-Even | Power BI — powerbiconsulting.com
- Your Data Stack Just Got More Expensive. Your BI Doesn't Have To. | Preset — preset.io
- Self-Service Analytics vs Traditional BI: 2026 Decision Framework — promethium.ai