Begin
14 pages · ~28 min
Describing Charts and Trends in English
This training helps professionals describe charts and trends accurately in English, building the vocabulary and phrasing needed for clear data presentations.
A digital instructor presents all 14 pages. Hold “Ask” at any point and ask out loud — the answer comes from this course. No sign-up needed.
What you’ll learn
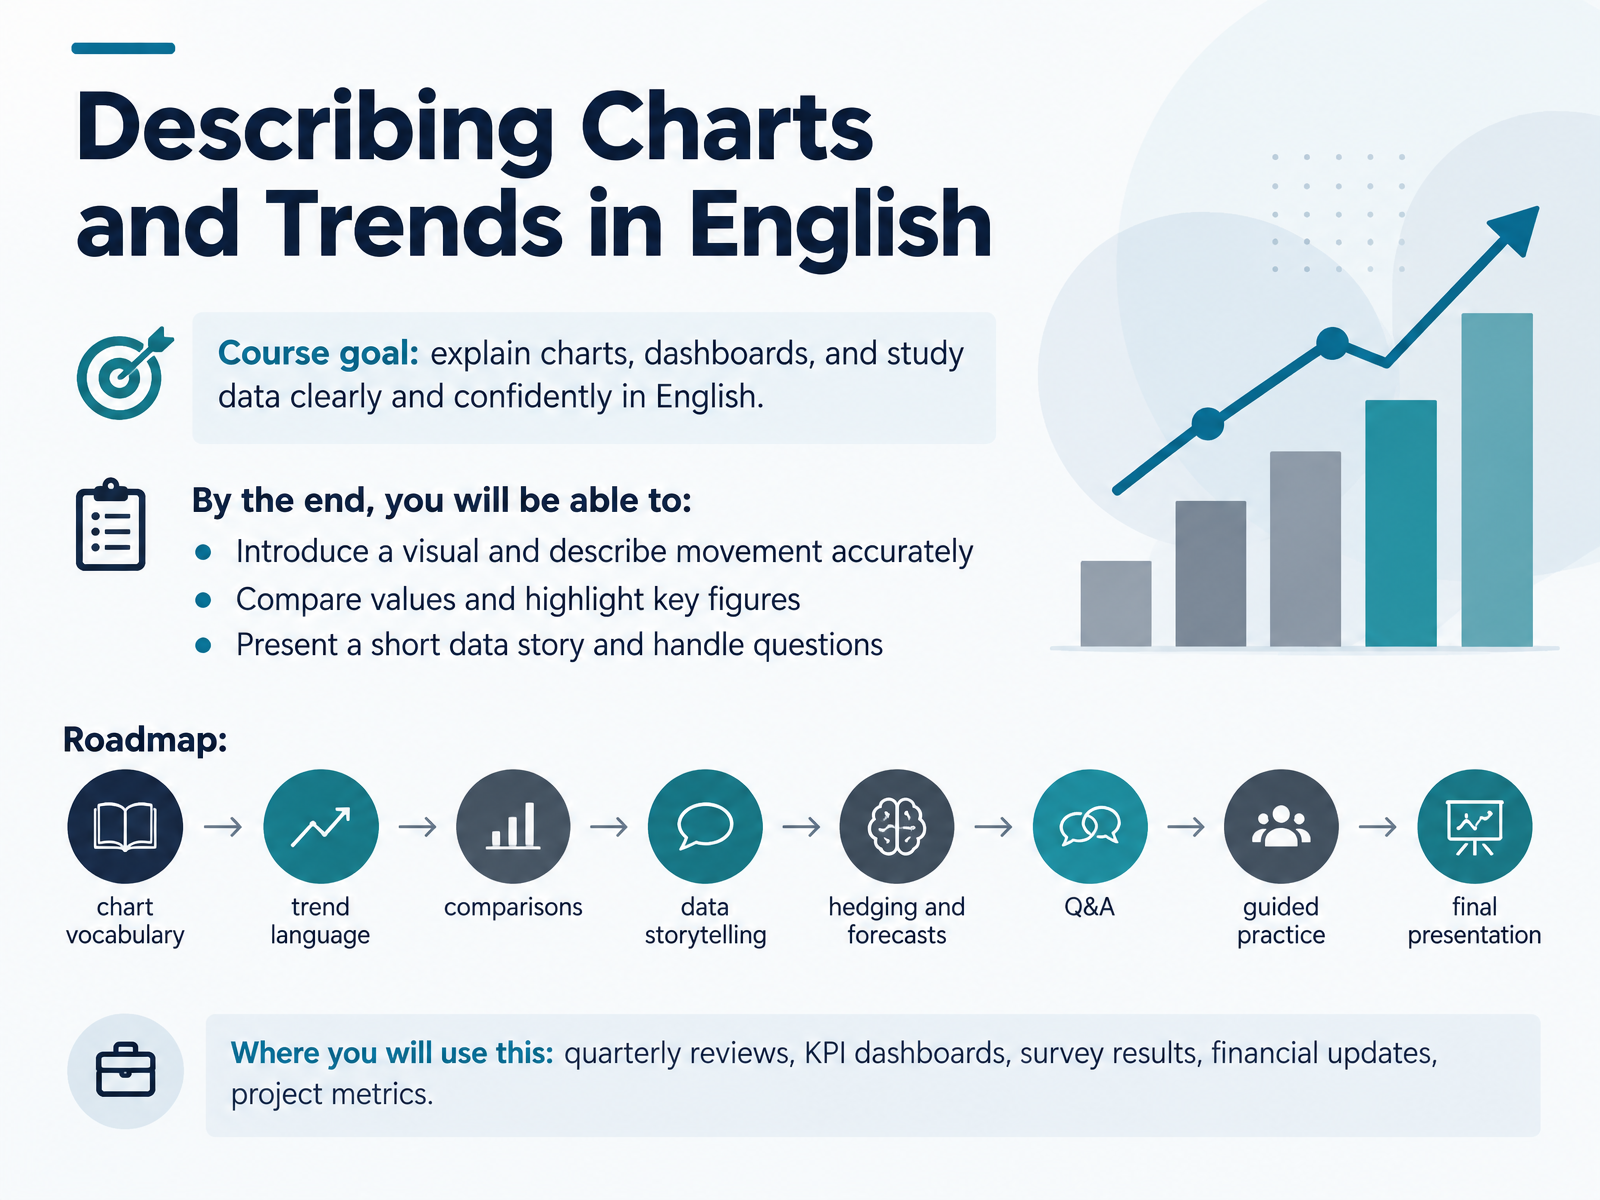
- 01Describing Charts and Trends in EnglishWelcome. If you present reports, dashboards, or study data in English, this course is for you. Our goal is simple: to help you explain charts and trends clearly and confidently. By the end, you will be able to introduce a visual and describe movement accurately, compare values and highlight key figures, and present a short data story and handle questions. Here is our roadmap. We will start with chart vocabulary, then trend language, comparisons, and data storytelling. From there, we move into hedging and forecasts, question and answer skills, guided practice, and a final presentation. A quick note on hedging: that means using cautious language, like saying a figure could reach a target rather than it will. Where will you use this? In quarterly reviews, K P I dashboards, survey results, financial updates, and project metrics. Think of one real chart you need to talk about. Keep it in mind as your practice material throughout the course. Let's begin with the building blocks.lessonpills.comnoxi.aiexa.ai+22 min
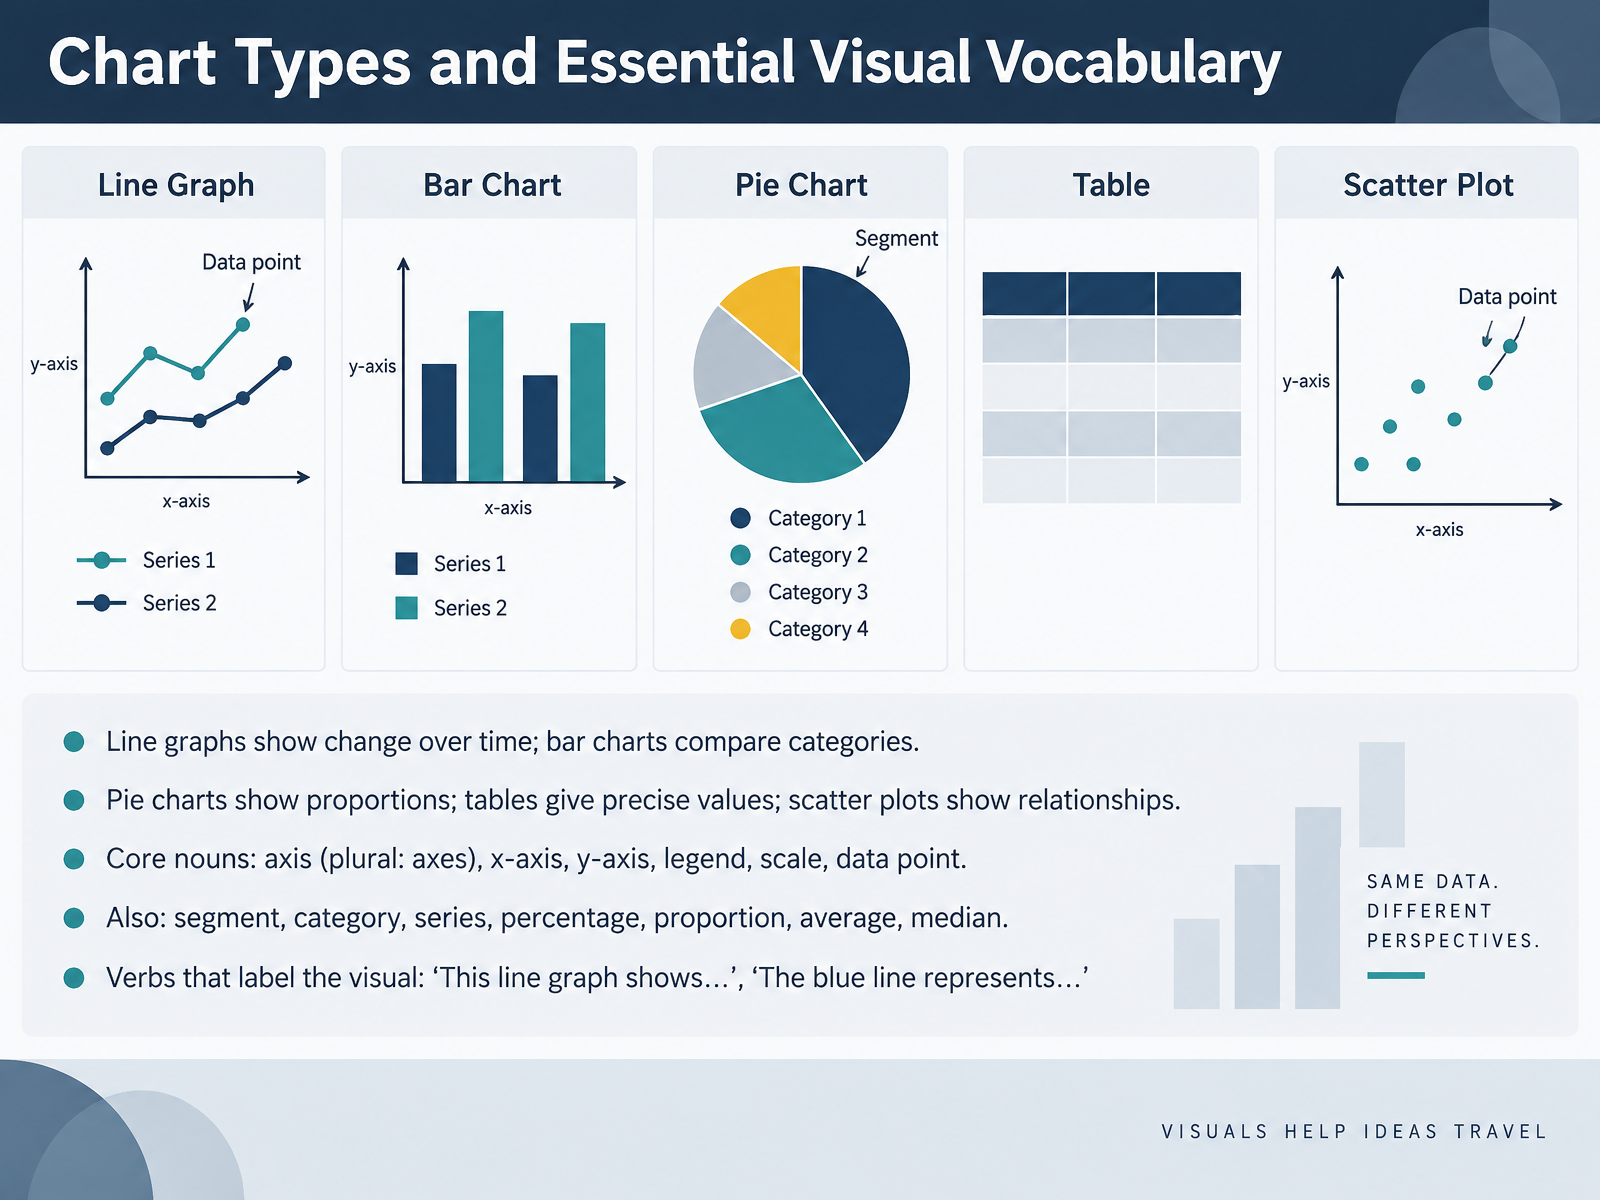
- 02Chart Types and Essential Visual VocabularyNow, let's look at chart types and the visual vocabulary you need to describe them. First, the chart types. A line graph shows change over time. A bar chart compares categories. A pie chart shows proportions, a table gives precise values, and a scatter plot shows relationships between two variables. Next, the core nouns. The axis is the reference line on a chart. The plural is axes, pronounced AK-seez. The horizontal one is the x-axis, and the vertical one is the y-axis. The legend explains what each color or symbol means, and the scale tells you the units. A single value on the chart is a data point. You will also hear segment, category, series, percentage, proportion, average, and median. Finally, use clear verbs to label the visual. Say, this line graph shows revenue by quarter, or the blue line represents online sales. Take a moment now, and describe one chart you used recently using one chart type and one noun. The Introduce, Orient, Name, Highlight routine is next.
 learnenglish.britishcouncil.orglearn-english-today.comacademic-englishuk.com+22 min
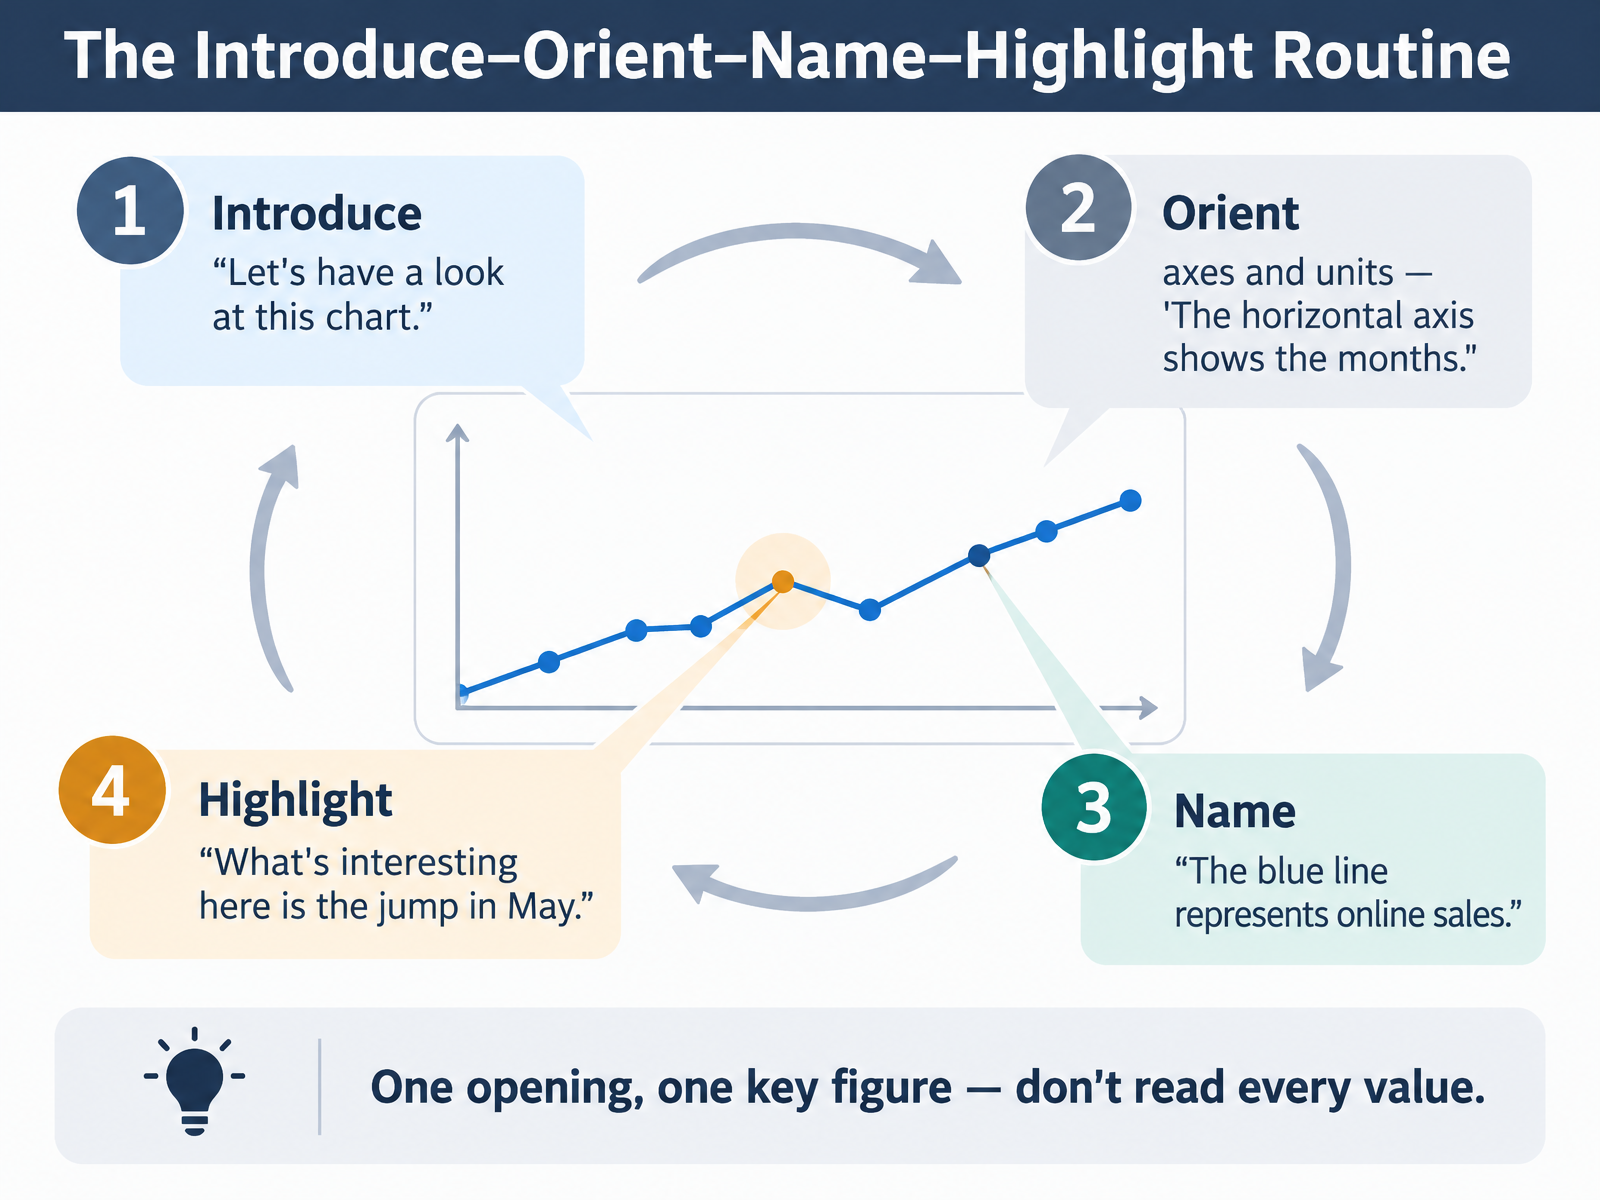
- 03The Introduce–Orient–Name–Highlight RoutineNow let's look at a simple routine that keeps your chart description clear and easy to follow. It has four steps: introduce, orient, name, and highlight.
First, introduce the visual. One short opening is enough. For example, "Let's have a look at this chart."
Second, orient your audience. Tell them what the axes and units show. For example, "The horizontal axis shows the months."
Third, name the key elements. Say what each line, bar, or segment represents. For example, "The blue line represents online sales."
Fourth, highlight one important point. Direct attention to what matters. For example, "What's interesting here is the jump in May."
Notice the pattern. You give one opening and one key figure. You do not read every value. Take a moment now and try the routine with your own chart, using one opening and one highlight.
Next, we'll build on this with trend language in Describing Movement: Trend Verbs and Adverbs.
 learnenglish.britishcouncil.orglearn-english-today.comacademic-englishuk.com+21 min
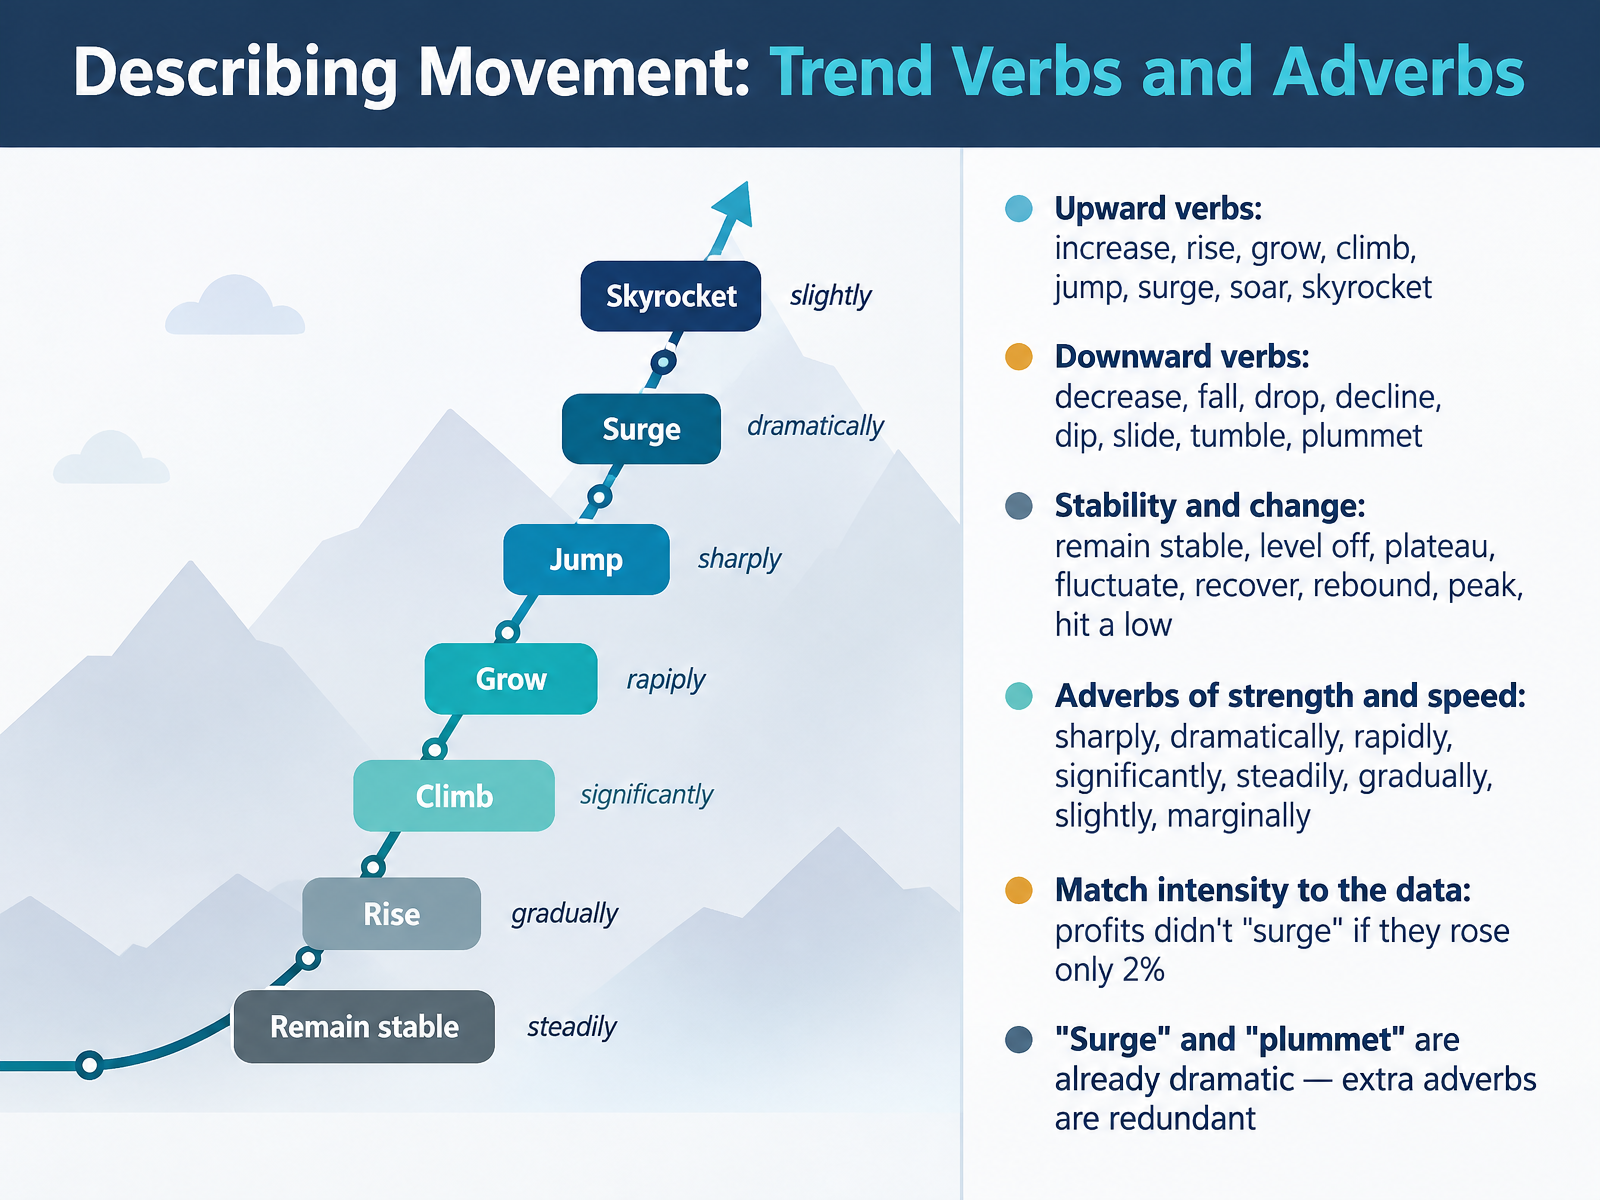
- 04Describing Movement: Trend Verbs and AdverbsNow let's look at the words that describe movement itself: trend verbs and adverbs. Start with direction. For upward movement, you can say increase, rise, grow, or climb. For stronger jumps, use jump, surge, soar, or skyrocket. For downward movement, use decrease, fall, drop, or decline. And for dramatic drops, choose dip, slide, tumble, or plummet. Next, add adverbs to show strength and speed: sharply, dramatically, rapidly, significantly, steadily, gradually, slightly, or marginally. Your job is to match intensity to the data. If profits rose only two percent, say they rose slightly. Don't say they surged. Also remember that surge and plummet already carry dramatic meaning, so adding dramatically is redundant. Take a moment now and describe one line from a chart you use at work. Then we'll move on to grammar patterns that carry the trend.
 blairenglish.comtoomeybusinessenglish.comrealbusinessenglish.com+21 min
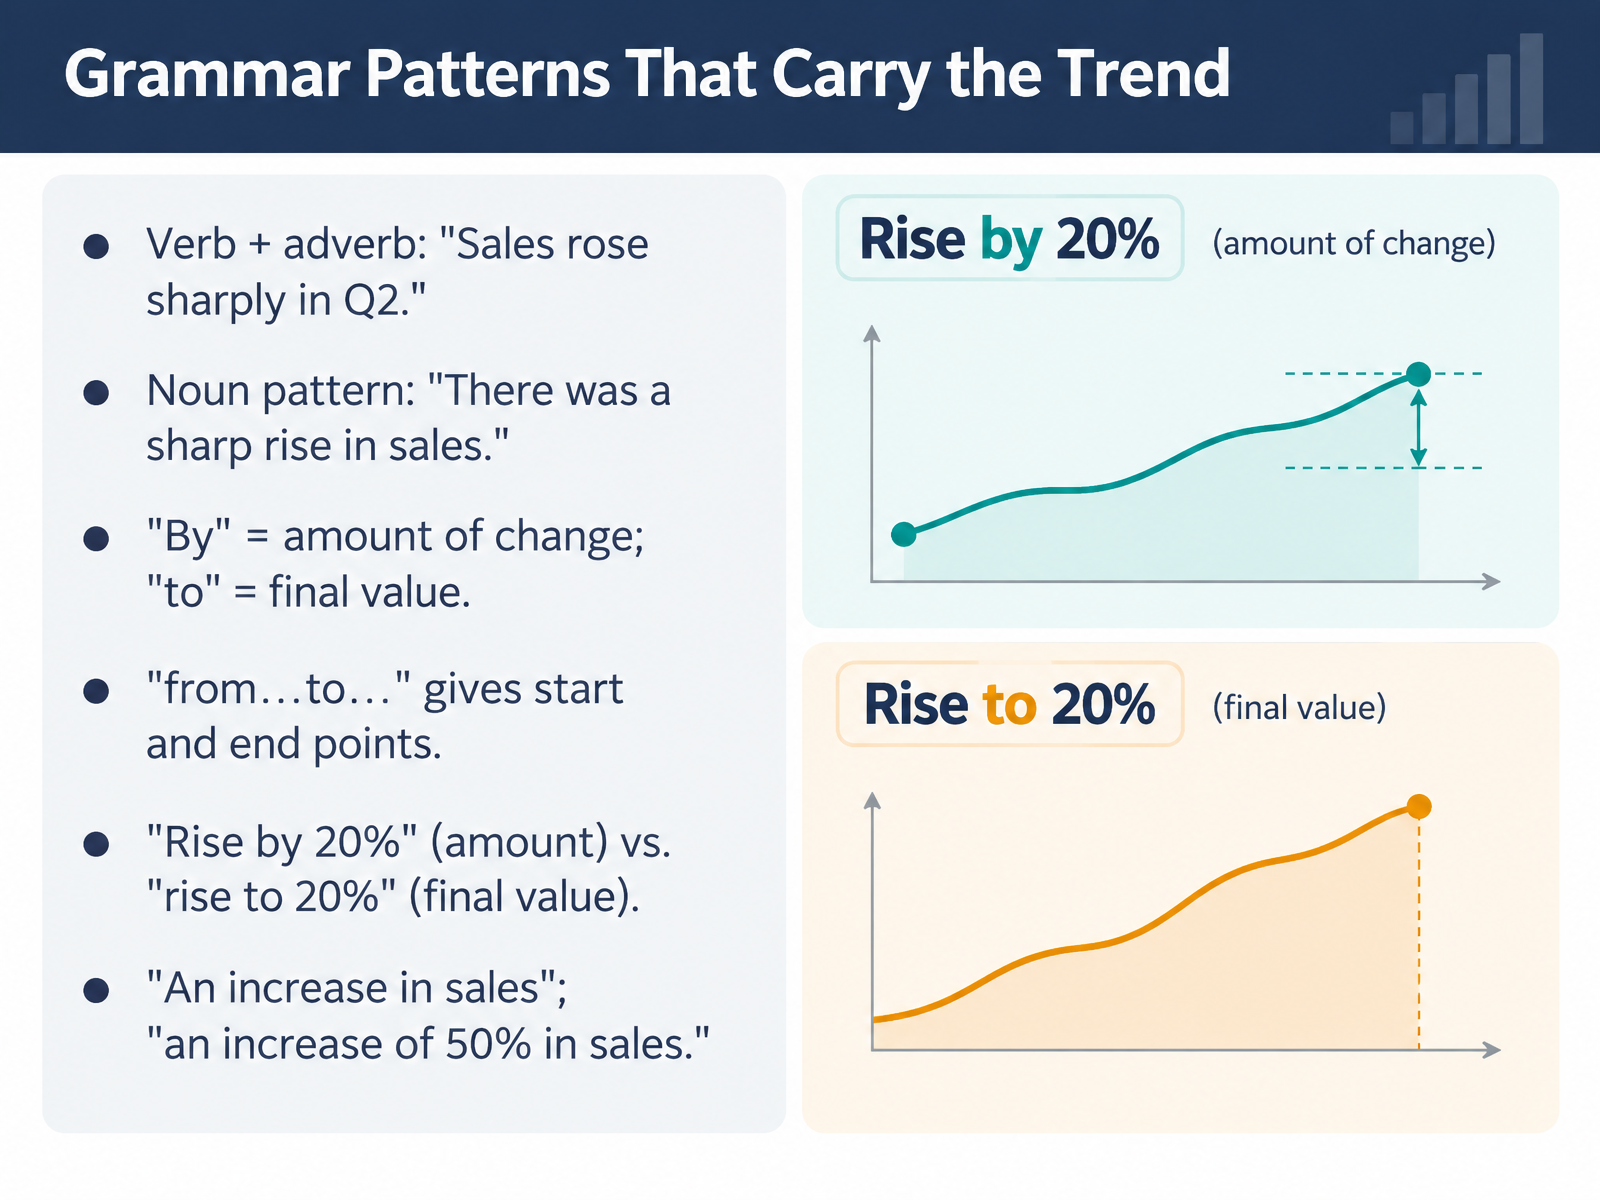
- 05Grammar Patterns That Carry the TrendNow let's look at the grammar patterns that carry the trend. You have two main options. First, verb plus adverb. For example, "Sales rose sharply in Q2." Second, the noun pattern: "There was a sharp rise in sales." Both are correct. The noun pattern often sounds more formal, which suits written reports. Next, watch your prepositions. Use "by" for the amount of change, and "to" for the final value. So "Sales rose by twenty percent" means the increase was twenty percent. "Sales rose to twenty percent" means twenty percent was the final level. And "from, to" gives start and end points: "Sales rose from ten million to fifteen million." Finally, with nouns, use "in" for the area and "of" for the amount: "an increase in sales," or "an increase of fifty percent in sales." Quick practice. Take one figure from your latest report and say it two ways: once with a verb and adverb, once with a noun phrase. Pause and try it now. Keep these patterns ready, because next we move on to making comparisons and highlighting extremes.
 blairenglish.comtoomeybusinessenglish.comrealbusinessenglish.com+22 min
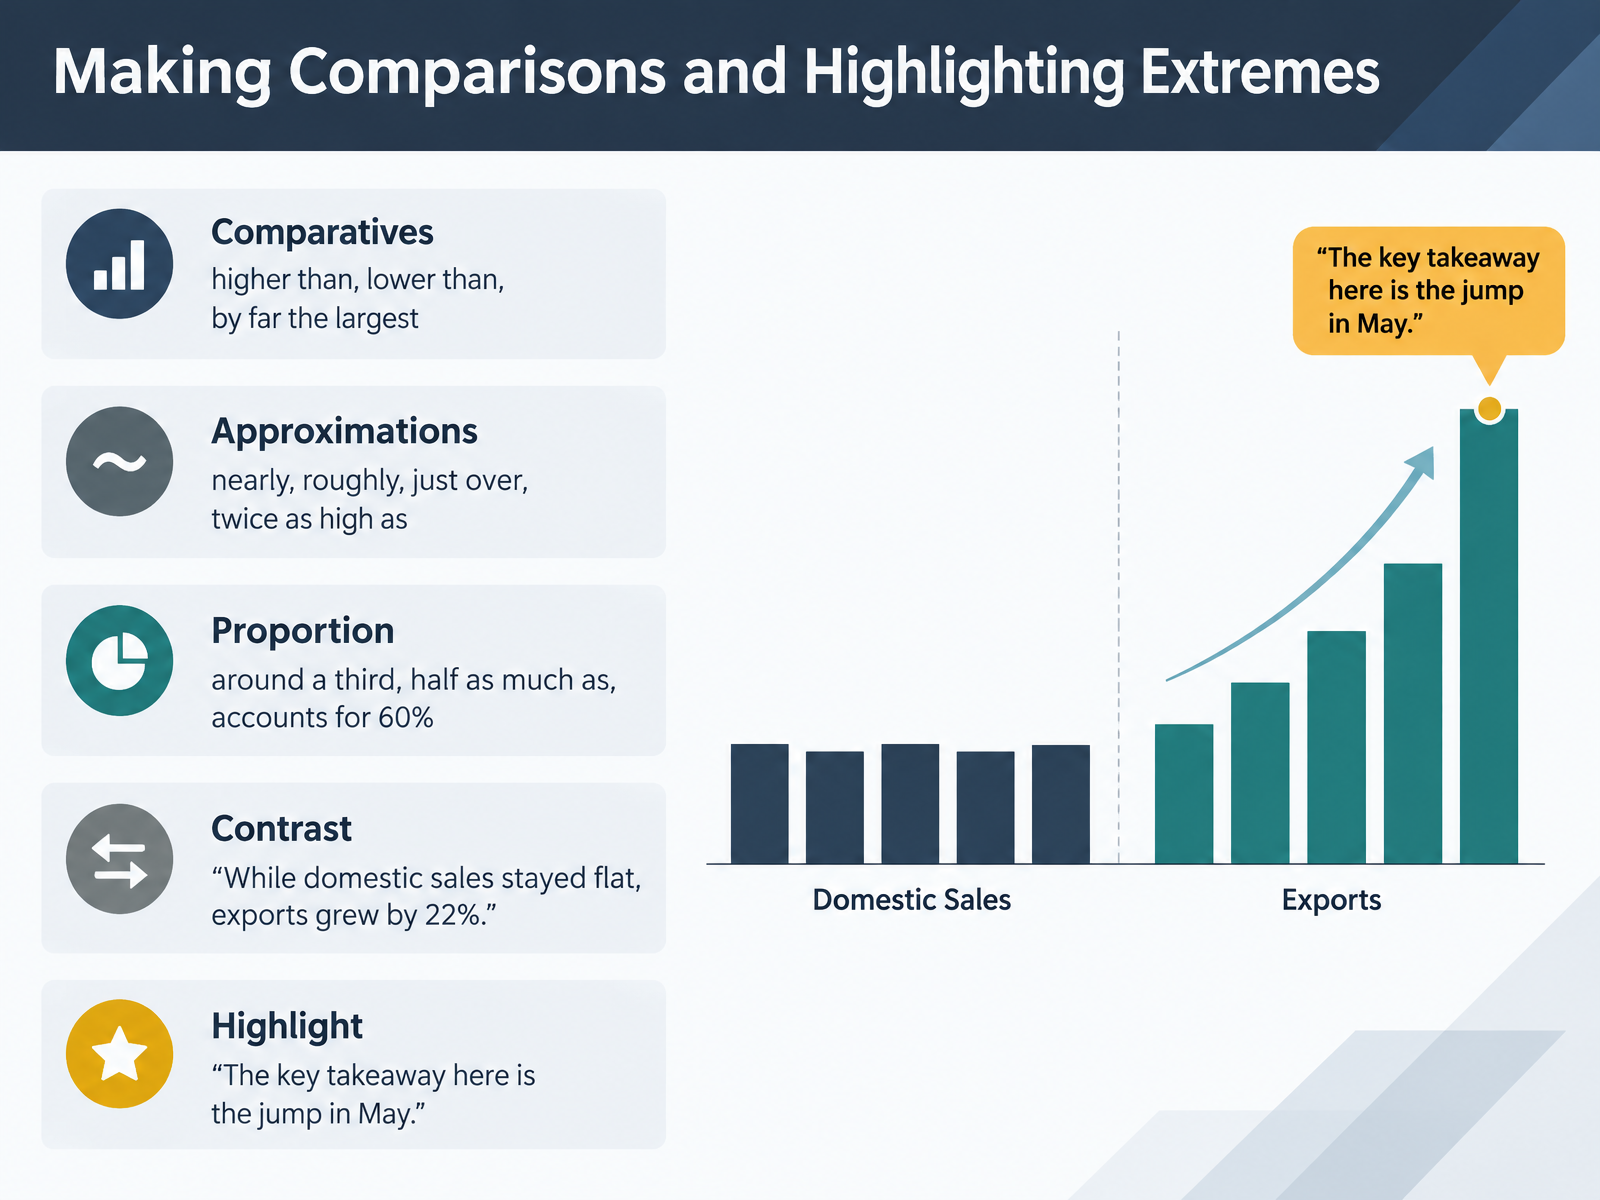
- 06Making Comparisons and Highlighting ExtremesNow let's talk about making comparisons and highlighting extremes. When two numbers sit side by side, your job is to show the relationship fast. For comparatives, keep it simple: one region is higher than another, or lower than last quarter. For the biggest gap, say by far the largest. Next, approximations. When a number is close but not exact, say nearly, roughly, or just over. You might say, exports were roughly twice as high as imports. For proportion, use around a third, half as much as, or accounts for sixty percent. Then use contrast to sharpen the point. Listen to this. While domestic sales stayed flat, exports grew by twenty two percent. Finally, highlight your headline. Say, the key takeaway here is the jump in May. Pause for a moment and build one comparison sentence from your own latest dashboard. Keep it short, specific, and tied to your message. Comparisons guide the eye, but the highlight tells people what to remember. That naturally leads into our next topic, Structuring a Data Story: Opening, Signposting, Closing.
 toomeybusinessenglish.commeltonlanguageservices.comenglisch-lehrer.com+22 min
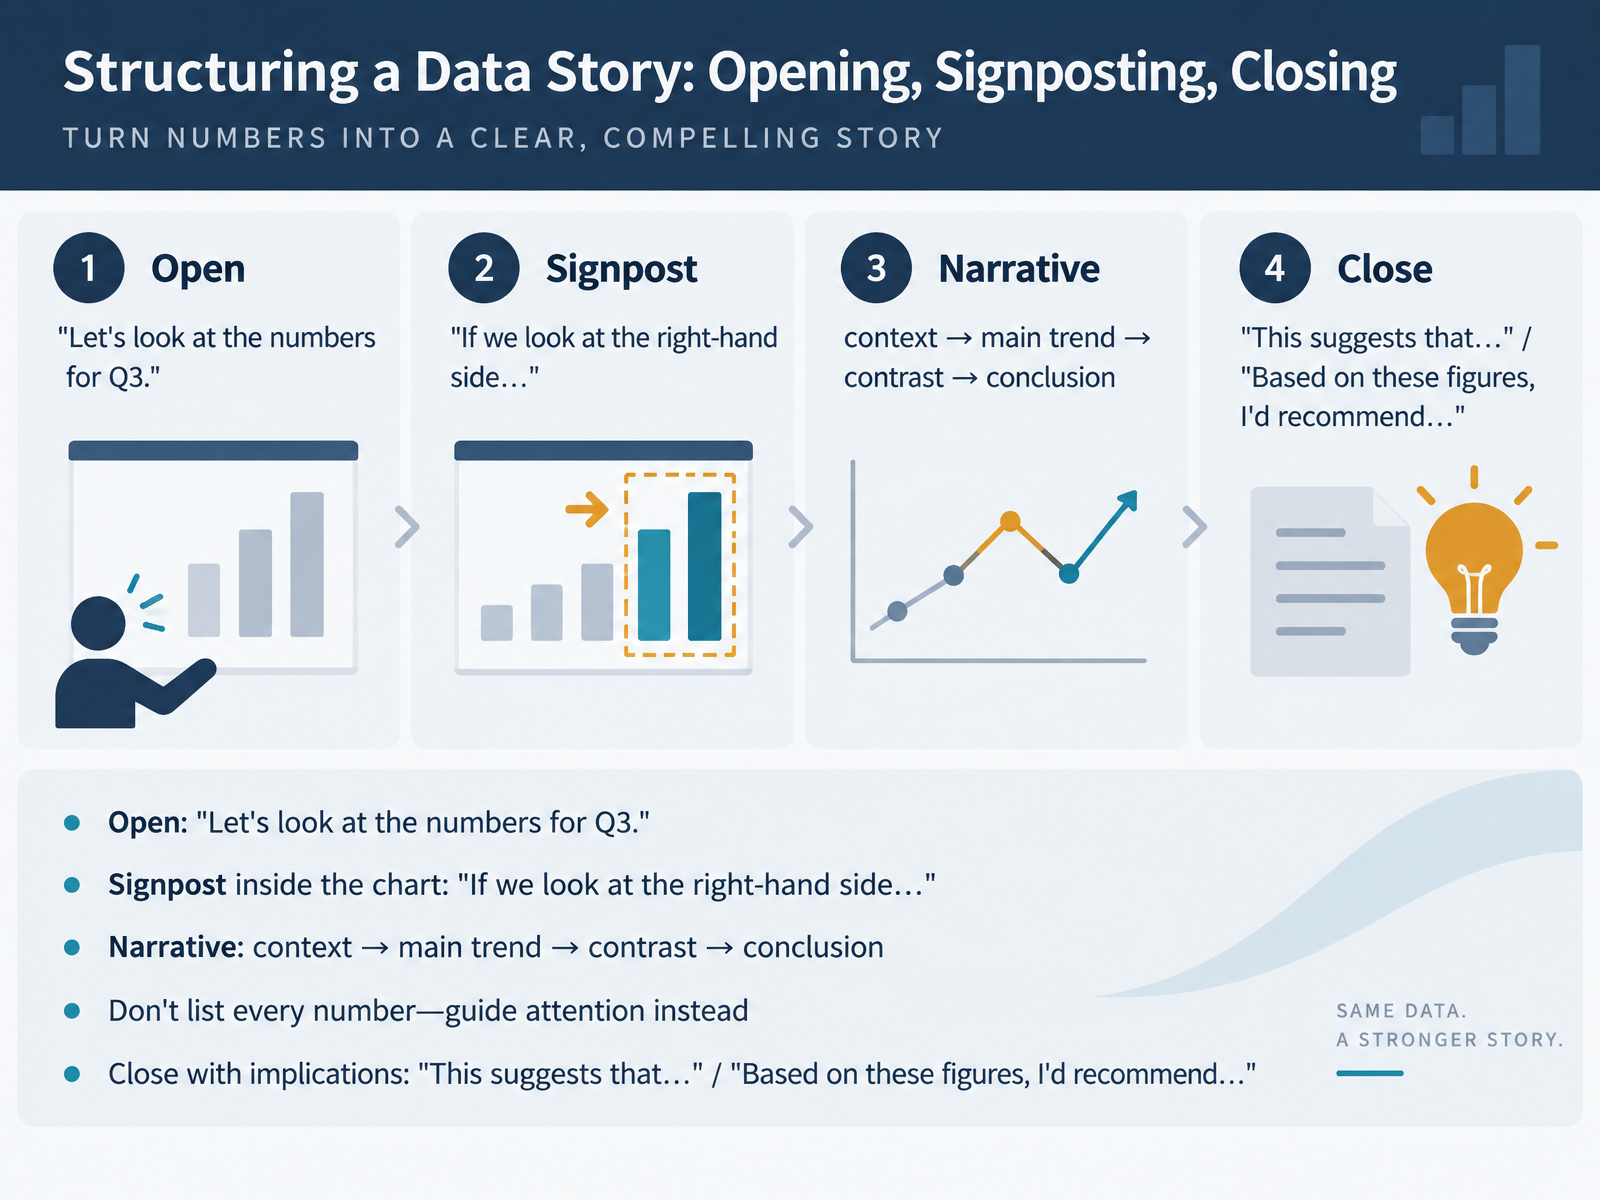
- 07Structuring a Data Story: Opening, Signposting, ClosingNow let's see how to structure a data story. A chart on its own is not a story. You give it a shape. You open with a simple signpost. For example, let's look at the numbers for Q3. Then you guide attention inside the chart. If we look at the right-hand side, you can see the trend clearly. From there, follow four steps: context, main trend, contrast, then conclusion. Here's the key point. Don't list every number. Your audience can read the chart themselves, so guide their attention to what matters instead. A useful pattern is: as you can see from the graph, sales rose steadily in the second quarter. Then close with implications. Say, this suggests that demand is shifting online. Or, based on these figures, I'd recommend increasing our budget for Q4. So the structure is simple: open, signpost, guide, and close with meaning. Next, let's look at how to add precision and caution to your claims.
 englisch-lehrer.commeltonlanguageservices.com1 min
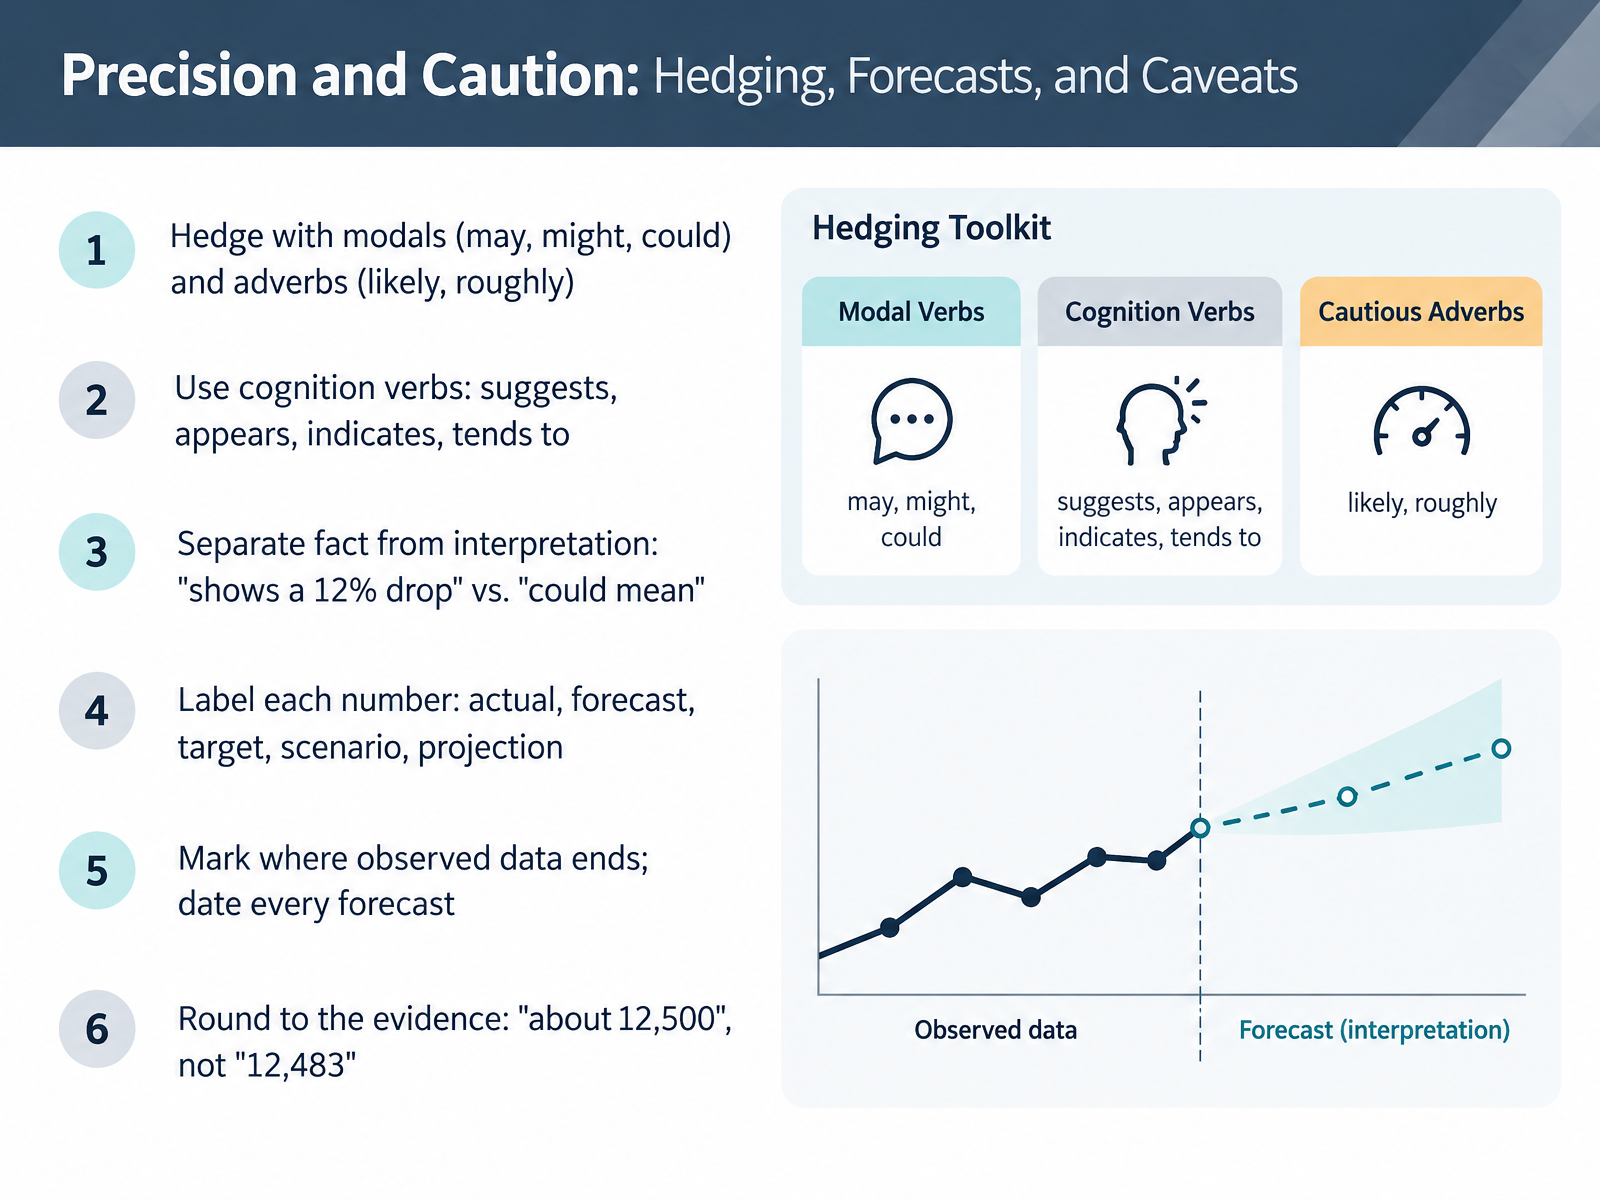
- 08Precision and Caution: Hedging, Forecasts, and CaveatsNow let's talk about precision and caution. When you report numbers, your language should match your evidence. First, hedge with modals like may, might, and could, and with adverbs like likely or roughly. For example, instead of saying sales will rise, say sales could rise by roughly ten percent. Second, use cognition verbs such as suggests, appears, indicates, and tends to. These show you are interpreting, not stating a fact. Third, separate fact from interpretation. A chart shows a twelve percent drop that is a fact. That drop could mean the campaign lost momentum that is an interpretation. Fourth, label every number by its role: actual, forecast, target, scenario, or projection. Fifth, mark where observed data ends, and date every forecast. Finally, round to the evidence. Say about twelve thousand five hundred, not twelve thousand four hundred eighty-three. Here is a quick prompt. Think of one number on your dashboard. Say it out loud as either an actual or a forecast, with one hedge and one condition. For example, we expect about twelve thousand five hundred requests, assuming the campaign launches as scheduled. Next, we will look at talking about forecasts and projections accurately.
 lessonpills.comnoxi.aiexa.ai+22 min
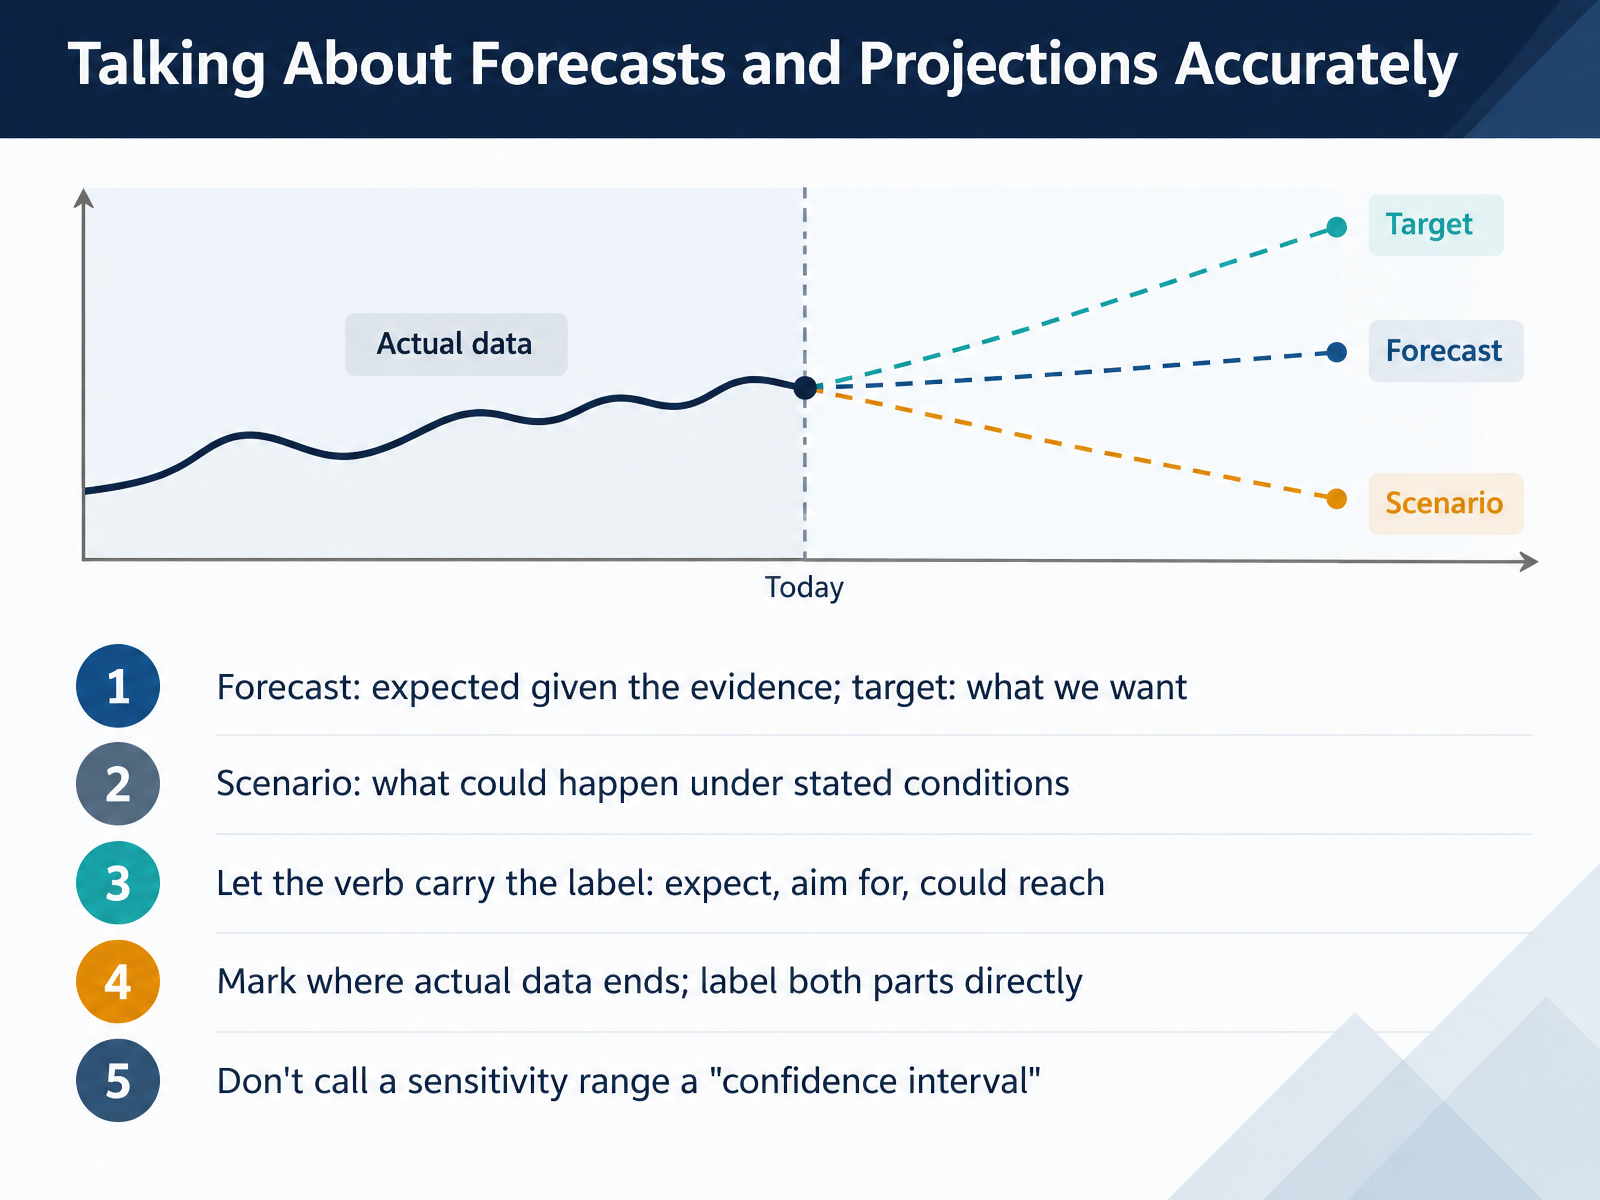
- 09Talking About Forecasts and Projections AccuratelyLet's talk about forecasts and projections, because this is where precision really matters. A forecast is what you expect given the evidence. A target is what you want to achieve. They are not the same, so keep them separate. A scenario describes what could happen under stated conditions. For example, you might say, demand could reach fifteen thousand units if the campaign launches on schedule. Notice the verb carries the label. Expected means forecast. Aim for means target. Could reach means scenario. When your chart mixes past and future, mark where actual data ends. Label both parts directly, like actual through September and forecast prepared in October. And one important warning: do not call a sensitivity range a confidence interval. They are not interchangeable. Before we move on, take a moment. Pick one number from your latest report. Say whether it is a forecast, a target, or a scenario. Then say it out loud with the right verb. Next, we will look at calibrating certainty, and deciding when to hedge and when to be direct.
 lessonpills.comnoxi.aiexa.ai+22 min
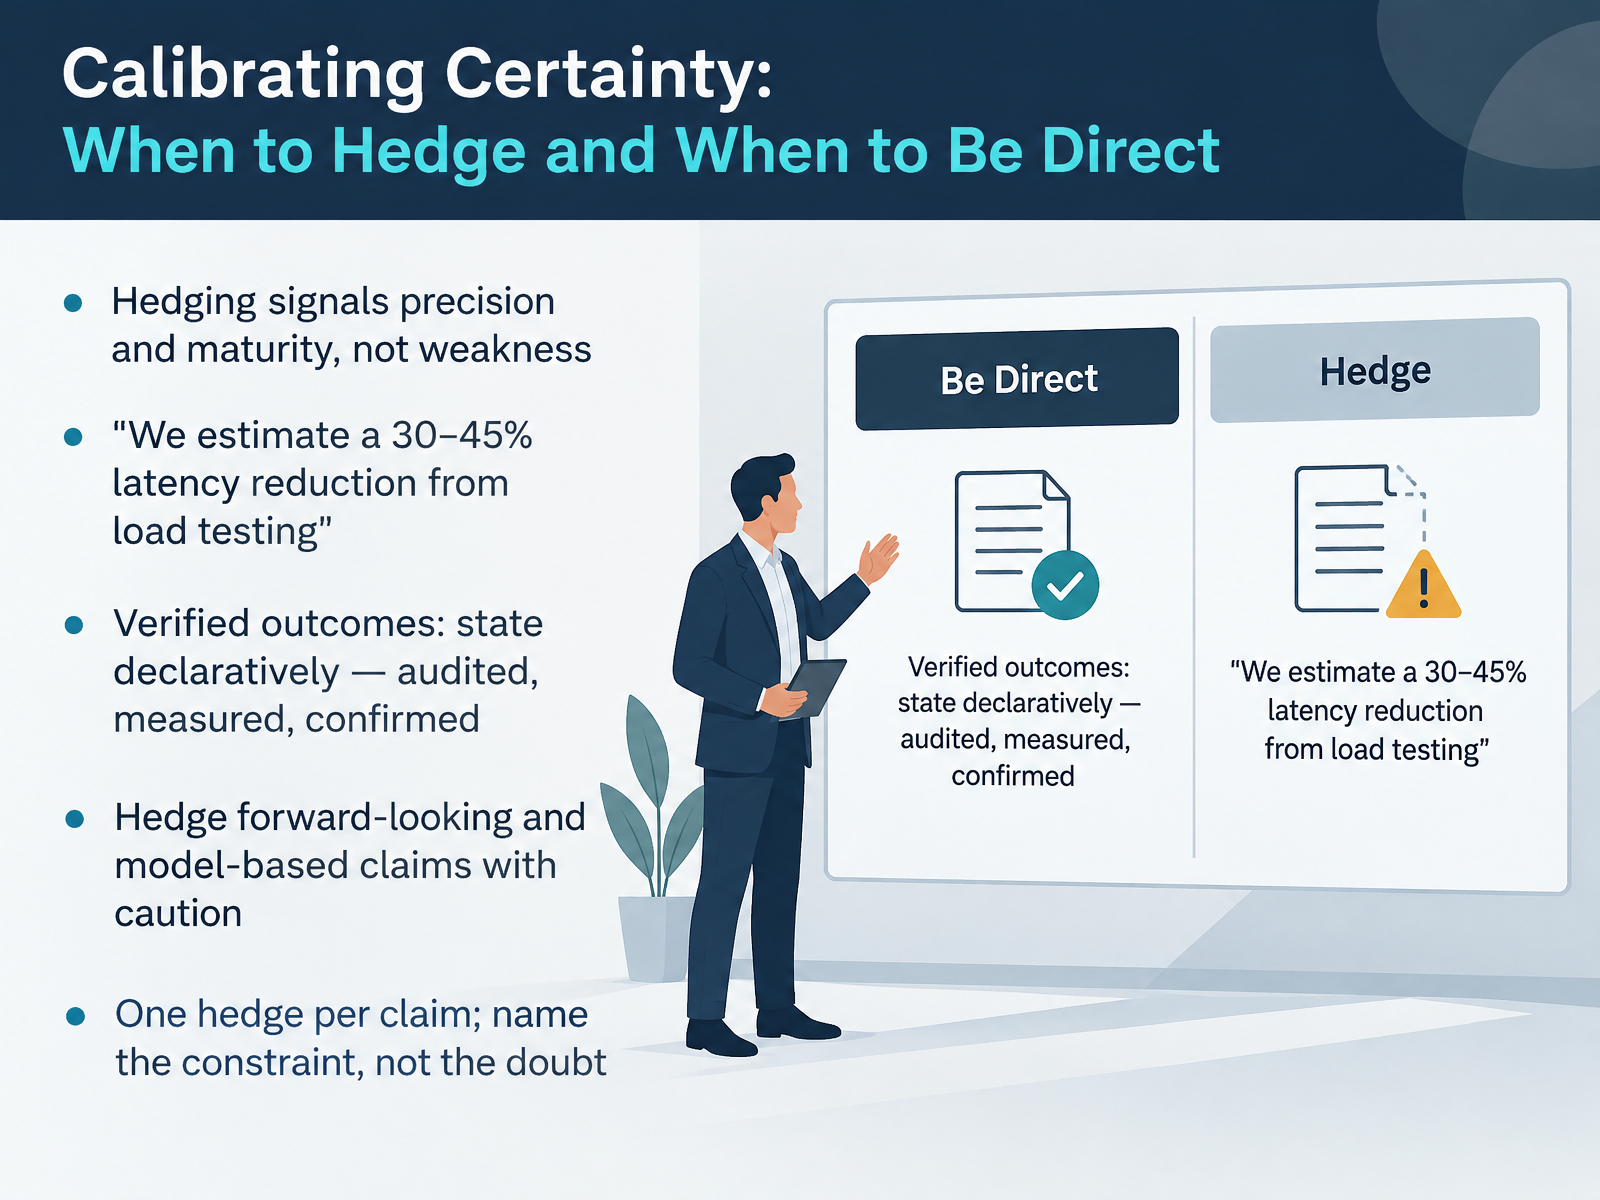
- 10Calibrating Certainty: When to Hedge and When to Be DirectNow let's talk about calibrating certainty. Hedging is not weakness. It signals precision and maturity, because it shows you know exactly where your evidence ends and your judgement begins. Compare these two claims. "This will reduce latency by forty percent" is a promise you may not keep. Instead, say, "We estimate a latency reduction of thirty to forty five percent from load testing." That is honest and more persuasive. For verified outcomes, state them declaratively. Use words like audited, measured, or confirmed. If performance was audited, say it achieved twenty percent growth, not that it may have. Hedge forward-looking and model-based claims, especially forecasts and projections. And keep one hedge per claim. Name the constraint, not the doubt. So say, "We can deliver by October, subject to the API being ready," rather than stacking maybes. Before we move on, pause the video and write one sentence for a claim you cannot yet verify. Now, let's move to answering questions about data.
 lessonpills.comnoxi.aiexa.ai+22 min
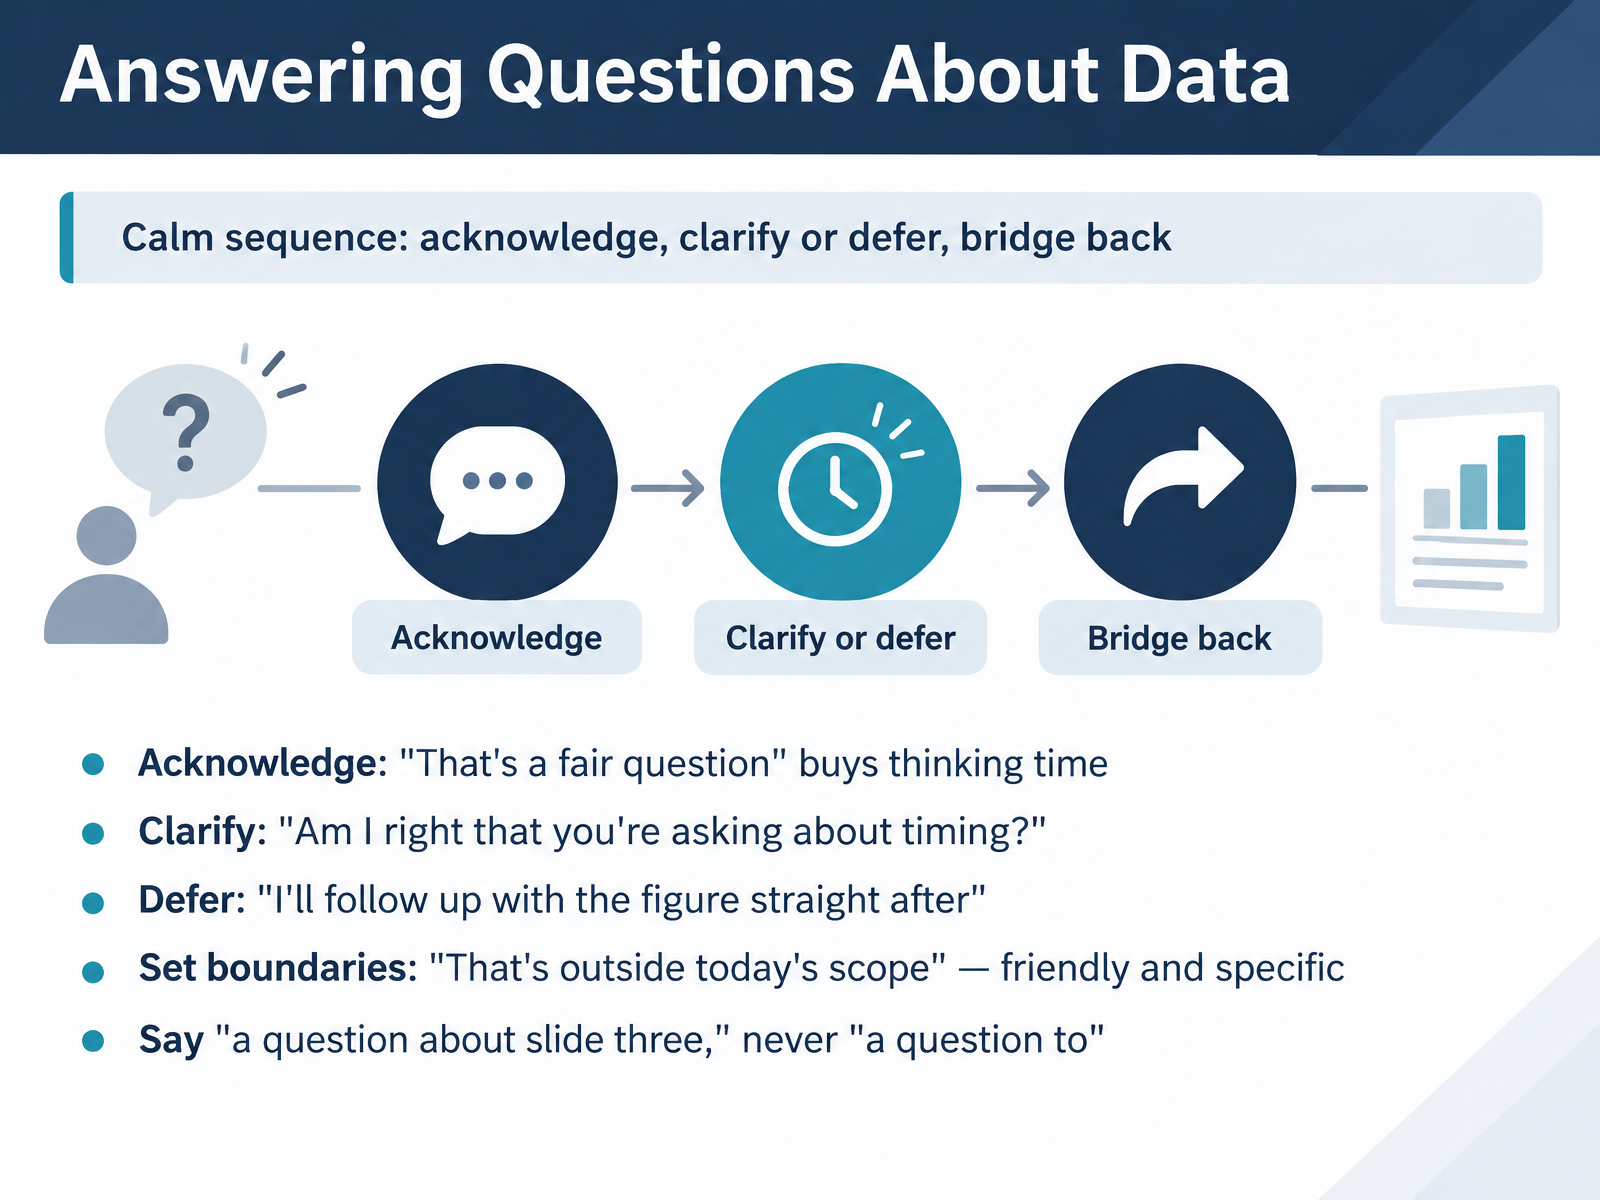
- 11Answering Questions About DataNow let's talk about answering questions about your data. When someone challenges your chart, stay calm and follow a simple sequence: acknowledge, clarify or defer, then bridge back. Start with a neutral acknowledgement. Saying "That's a fair question" values the person and buys you a moment to think. If the question is unclear, check it. Ask, "Am I right that you're asking about timing?" That confirms the topic before you answer. If you don't have the number, defer with a concrete step. Say, "I'll follow up with the figure straight after." It sounds honest, not evasive. For off-topic questions, set a friendly boundary. "That's outside today's scope, and I'm happy to discuss it afterwards." One small language fix. Say "a question about slide three," never "a question to slide three." So remember the sequence: acknowledge, clarify or defer, then bridge back to your key message. Next, we'll clean up common errors in the Accuracy Clinic.
 2 min
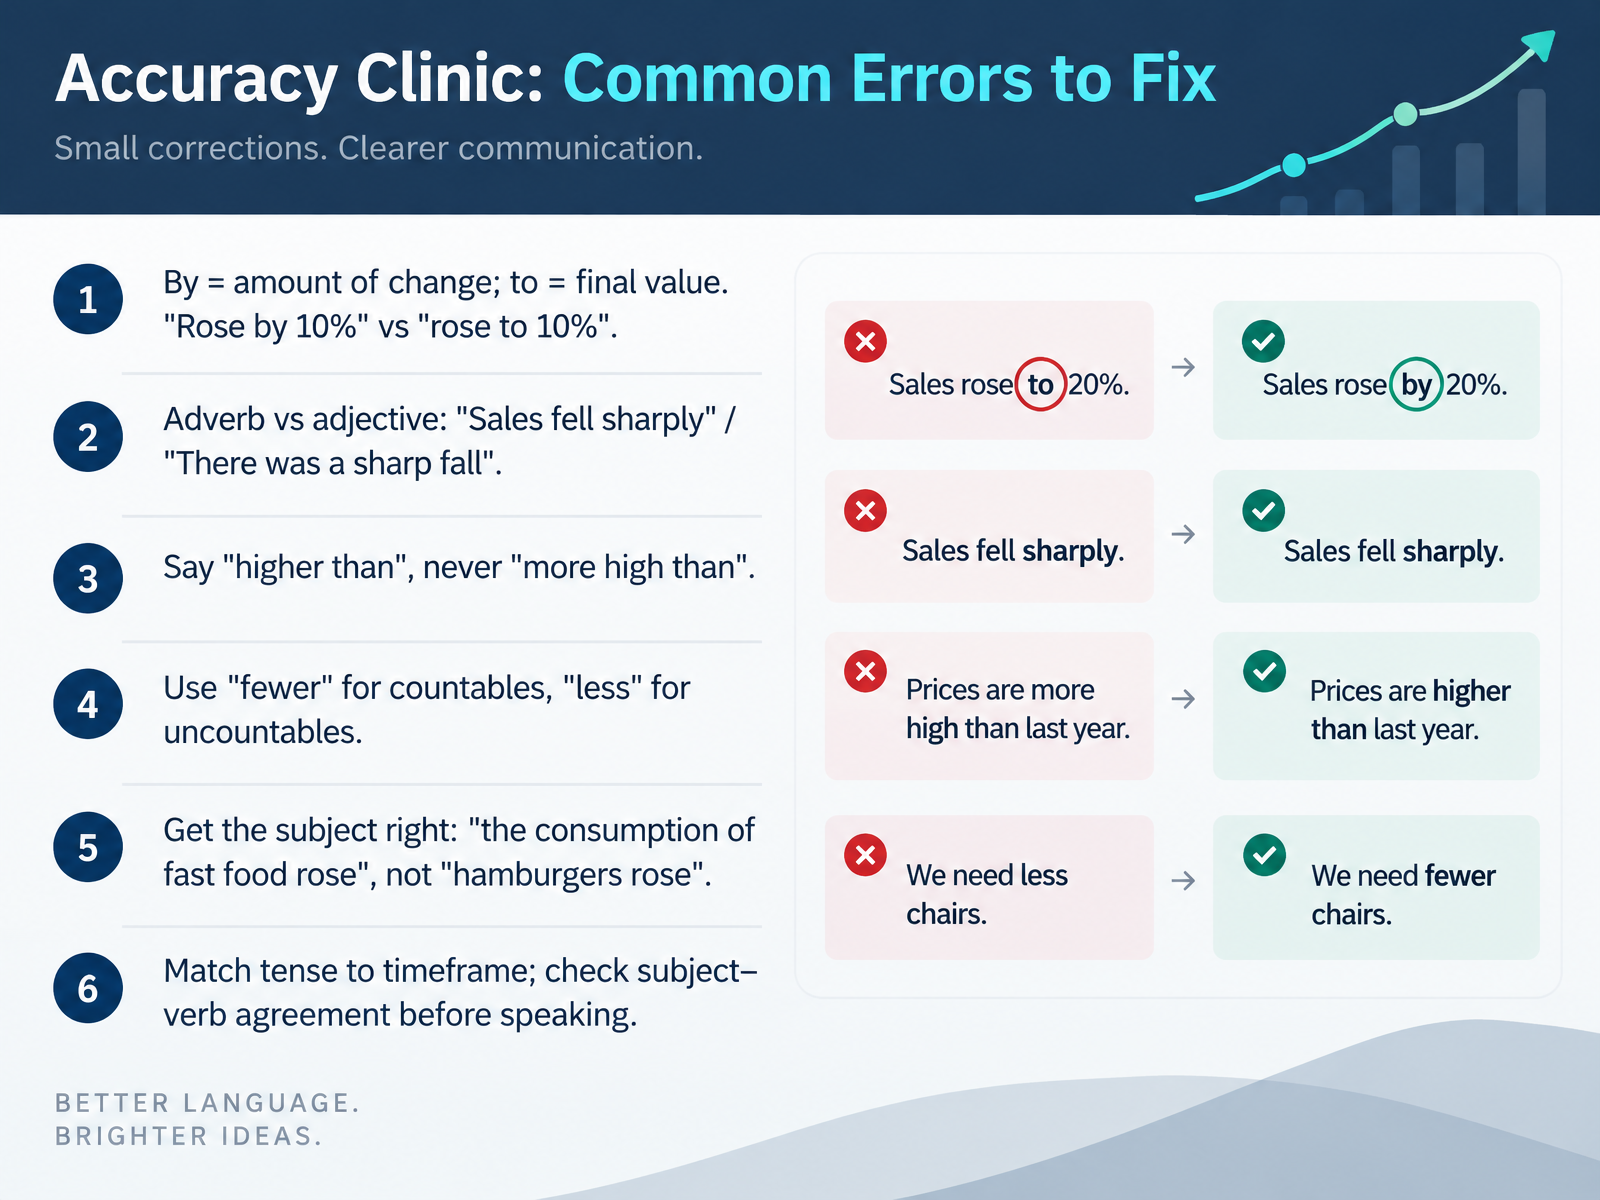
- 12Accuracy Clinic: Common Errors to FixNow let's move into the accuracy clinic, where we fix the errors that show up most often in real reports. First, by and to. By shows the amount of change, and to shows the final value. So, sales rose by ten percent, meaning they grew by that amount. But sales rose to ten percent, meaning ten percent was the end point. Very different messages. Second, keep adverbs and adjectives straight. We say sales fell sharply, or there was a sharp fall. Third, always say higher than, never more high than. Fourth, use fewer for things you can count, and less for things you cannot. Say fewer customers, but less demand. Fifth, check your subject. Write the consumption of fast food rose, not hamburgers rose. Hamburgers cannot rise, but consumption can. Finally, match your tense to the timeframe, and check subject verb agreement before you speak. Quick pause here. Pick one chart you reported recently and correct one sentence using by or to. Fixing these small errors makes your data descriptions sound precise and credible. Next, we will apply everything in guided practice, describing a real dashboard.
 2 min
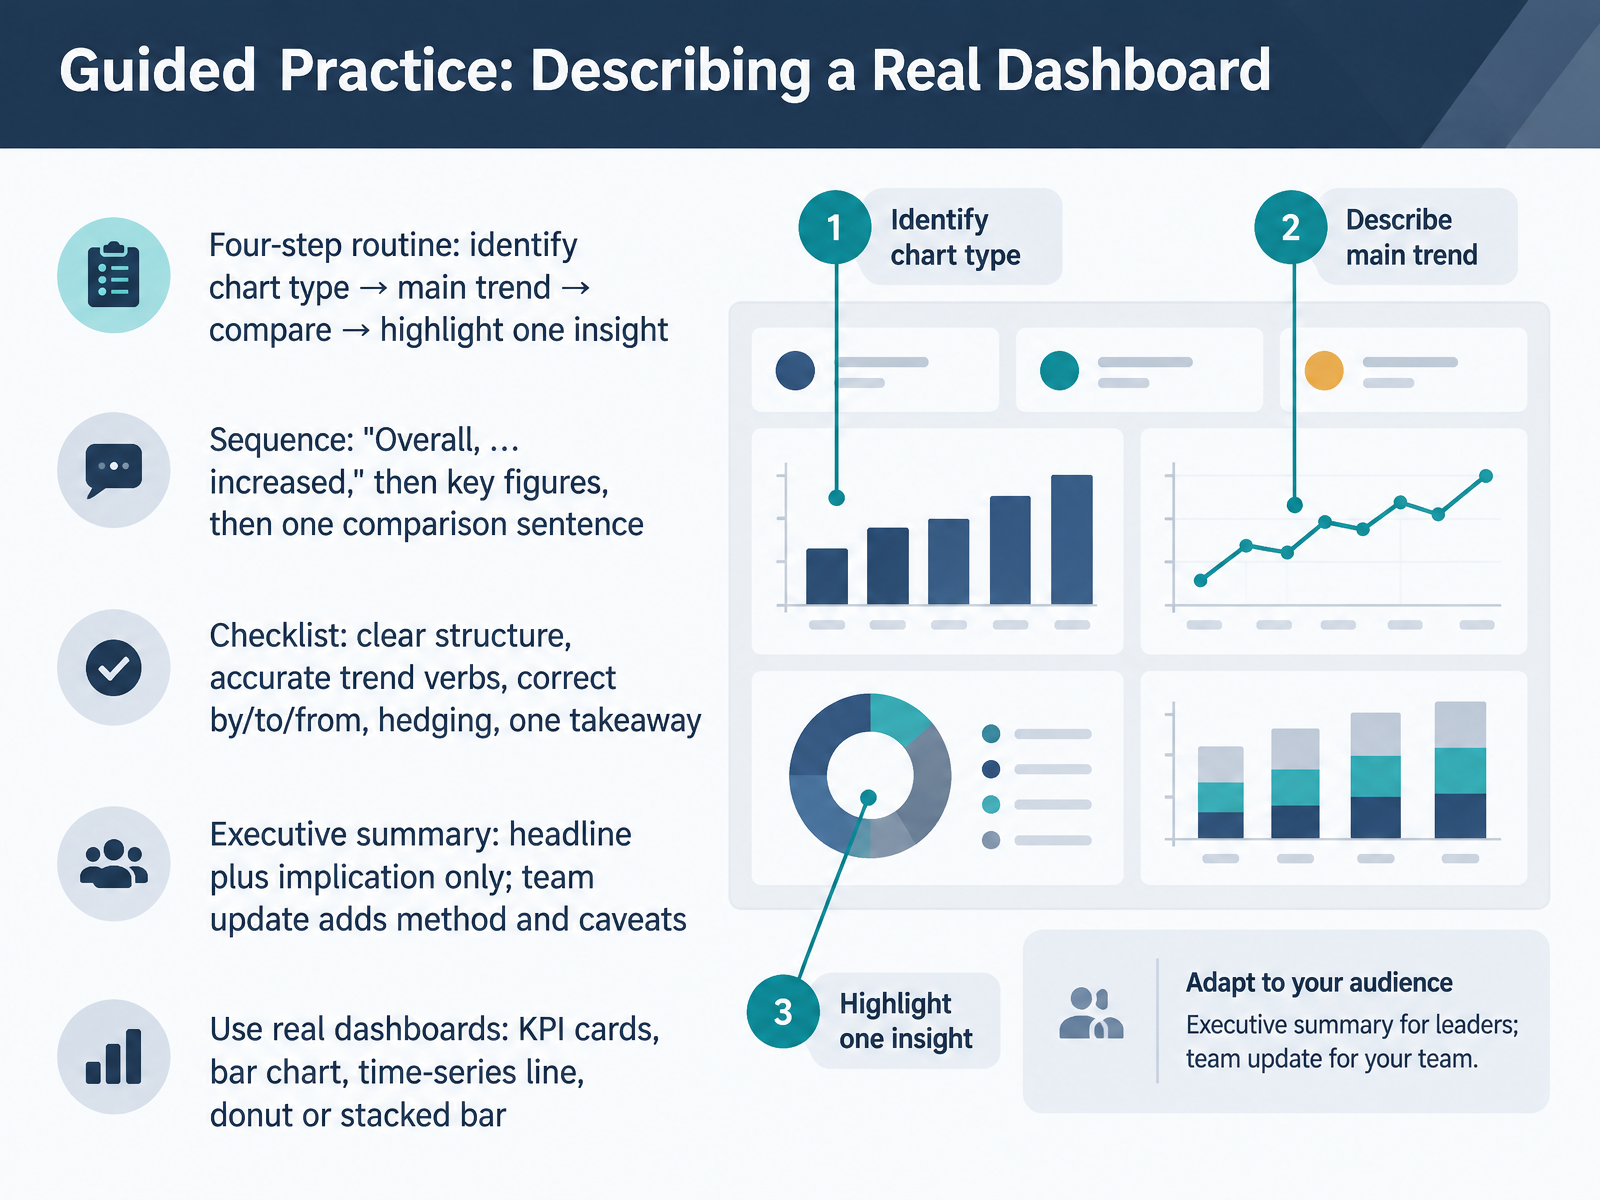
- 13Guided Practice: Describing a Real DashboardNow let's put it all together with a guided practice routine. When you face a real dashboard, work through four steps in order. First, identify the chart type: a KPI card, a bar chart, a time-series line, a donut, or a stacked bar. Second, state the main trend. Third, make one comparison. Fourth, highlight one insight. Your sequence sounds like this: "Overall, revenue increased," then the key figures, then one comparison sentence, then your takeaway. Check your structure, your trend verbs, and your prepositions. Remember, "rose by two million to twelve million" means the amount of change is by, and the final value is to. Also from is your starting point. Match your delivery to your audience. An executive summary gives the headline and the implication only. A team update adds method and caveats. So open a real dashboard and practice out loud. Now, let's move on. Your Turn: Presenting, Feedback, and Action Plan.
 learnenglish.britishcouncil.orglearn-english-today.comacademic-englishuk.com+22 min
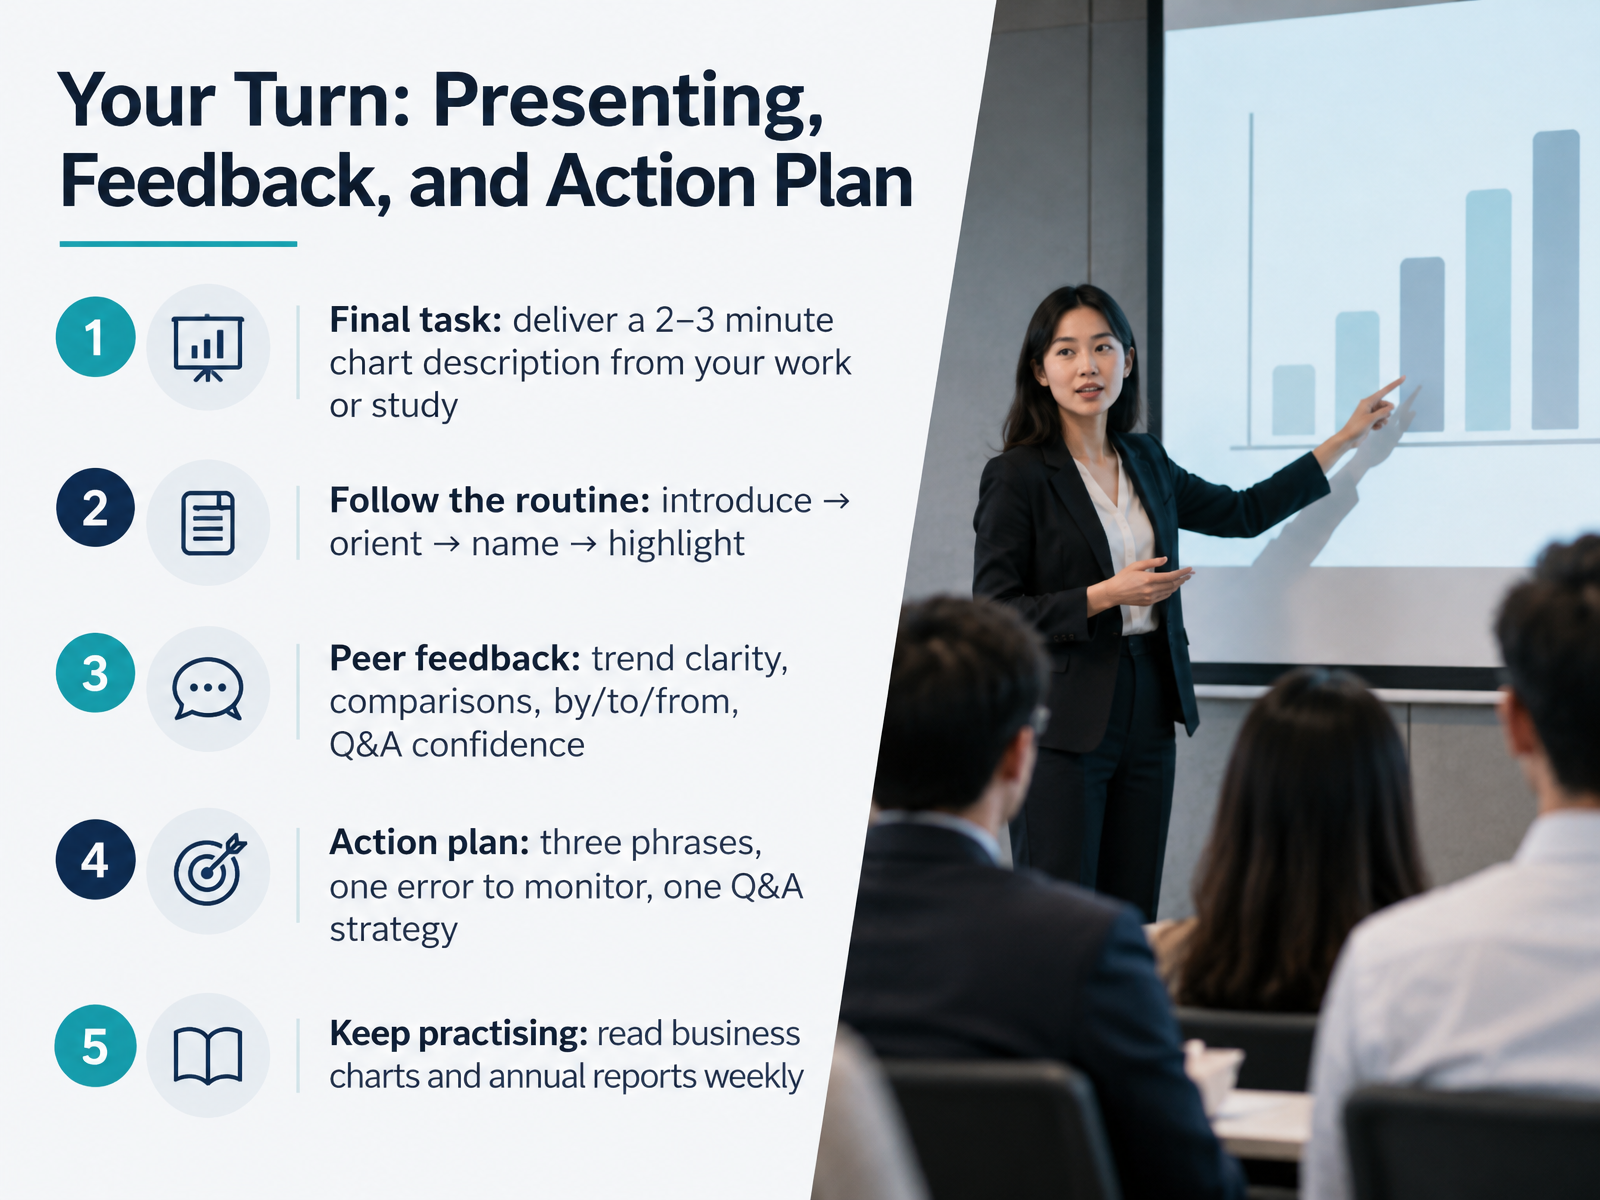
- 14Your Turn: Presenting, Feedback, and Action PlanNow let's bring everything together. Your final task is to deliver a two to three minute chart description from your own work or study. Follow the routine we have practised: introduce the chart, orient your audience to the axes and units, name the key series, then highlight one important figure. For peer feedback, focus on four things: trend clarity, the comparisons you make, your use of by, to, and from, and your confidence in the question and answer session. Then build a simple action plan. Choose three phrases to reuse, one error to monitor, and one Q and A strategy, such as acknowledging a question before you answer it. Keep practising by reading business charts and annual reports every week. That regular exposure builds fluency fast. Thank you for your work across this course, and good luck with your next presentation.
 learnenglish.britishcouncil.org1 min
Take the deck with you
Download this course as a file — free, no sign-up needed.
- PDF handoutEvery slide page, ready to print or share.15 pages · 2.9 MBDownload
- Narrated PowerPointThe deck that presents itself — every slide carries the digital human's narration video.15 pages · 15.0 MBDownload
- PowerPoint slidesThe full deck as a .pptx — open it in PowerPoint, Keynote, or Google Slides.15 pages · 2.8 MBDownload
Free to use in your own training — please keep the PersonWise credit page at the end.
Have your own deck? Turn it into a course
Sources consulted
Web sources consulted while building this course.
- ESL lesson plan | B2 | Sales pipeline and forecasting discussions — lessonpills.com
- How to Present Forecast Uncertainty Without False Precision — noxi.ai
- `We expect to report on significant progress in our product pipeline in the coming year': hedging forward-looking statements in corporate press releases — exa.ai
- Presenting Ambiguous Data: The Three-Tier Read — winningpresentations.com
- JT Blog: Slides: Hedging in Business Presentations — janpha.blogspot.com
- Describing charts | LearnEnglish — learnenglish.britishcouncil.org
- Business English - Graphs and Charts | Learn English Today — learn-english-today.com
- Describing Graphs — academic-englishuk.com
- Vocabulary for explaining & comparing chart data/trends online exercise | Blair English — blairenglish.com
- Vocabulary for describing data & charts in presentations online exercise | Blair English — blairenglish.com
- Vocabulary for describing trends online exercise part 2 | Blair English — blairenglish.com
- Adverbs and Verbs for Accounting Trends: Master Business English Vocabulary for Finance Professionals - Toomey Business English — toomeybusinessenglish.com
- 10 Business English Verbs for Talking About Sales and Trends (With Practice Quiz) — realbusinessenglish.com
- Business English: Graphs and Trends Describing Data | JIMMYESL — jimmyesl.com
- Describing Trends in English: Key Phrases | Simmonds — englisch-lehrer.com
- Graphs, Charts,Visuals in Presentations : Toomey Business English — toomeybusinessenglish.com
- Describing Graphs and Tables in English: Key Phrases — meltonlanguageservices.com
- Describing Charts in English: Key Phrases | Simmonds — englisch-lehrer.com
- English Phrases To Describe Graphs And Charts | Yak Yacker — yakyacker.com
- IELTS Academic Writing Task 1 — Full Guide | IWCS — ieltswritingcorrectionservice.com