Business Analytics Framework Components
Begin
14 pages · ~28 min
Business Analytics Framework Components
This training introduces the Business Analytics Framework, teaching participants to identify core components and apply them to real-world scenarios. Ideal for professionals seeking practical data-driven decision-making skills.
What you’ll learn
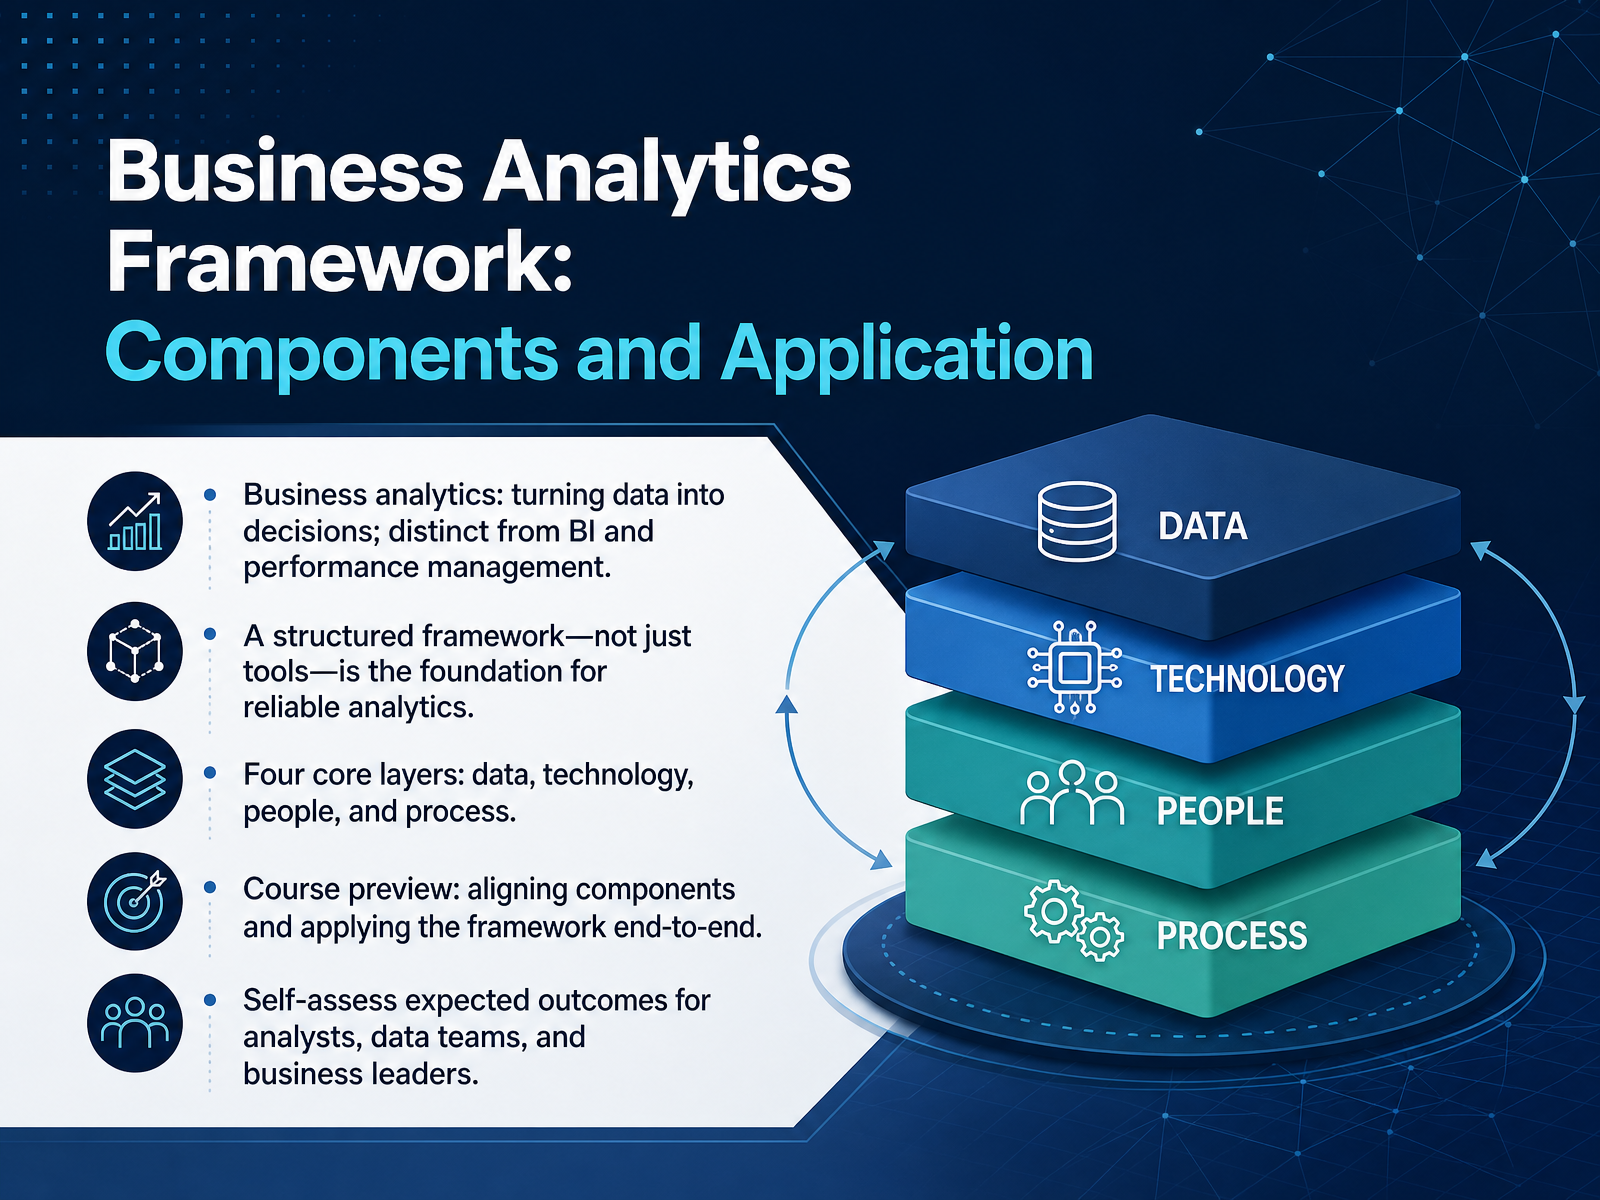
- 01Business Analytics Framework: Components and ApplicationWelcome. If you are here, you already know the difference between having data and using it. This course is about closing that gap. We will build a practical business analytics framework, not just a stack of tools. Because tools without structure give you dashboards, but not decisions. We will define what analytics really means, and why it is different from business intelligence or performance management. Then we will break the framework into its four core layers: data, technology, people, and process. You will see how those layers align, and how to apply the whole thing end to end. Along the way, you will assess your own expected outcomes, whether you are an analyst, a data team lead, or a business owner. The goal is simple. You should leave with a clear path from raw information to confident action. Now, before we start building, let us look at why a structured framework matters so much in the first place.dataforest.aiconcentrix.comgrowthanalyticsengine.com+22 min
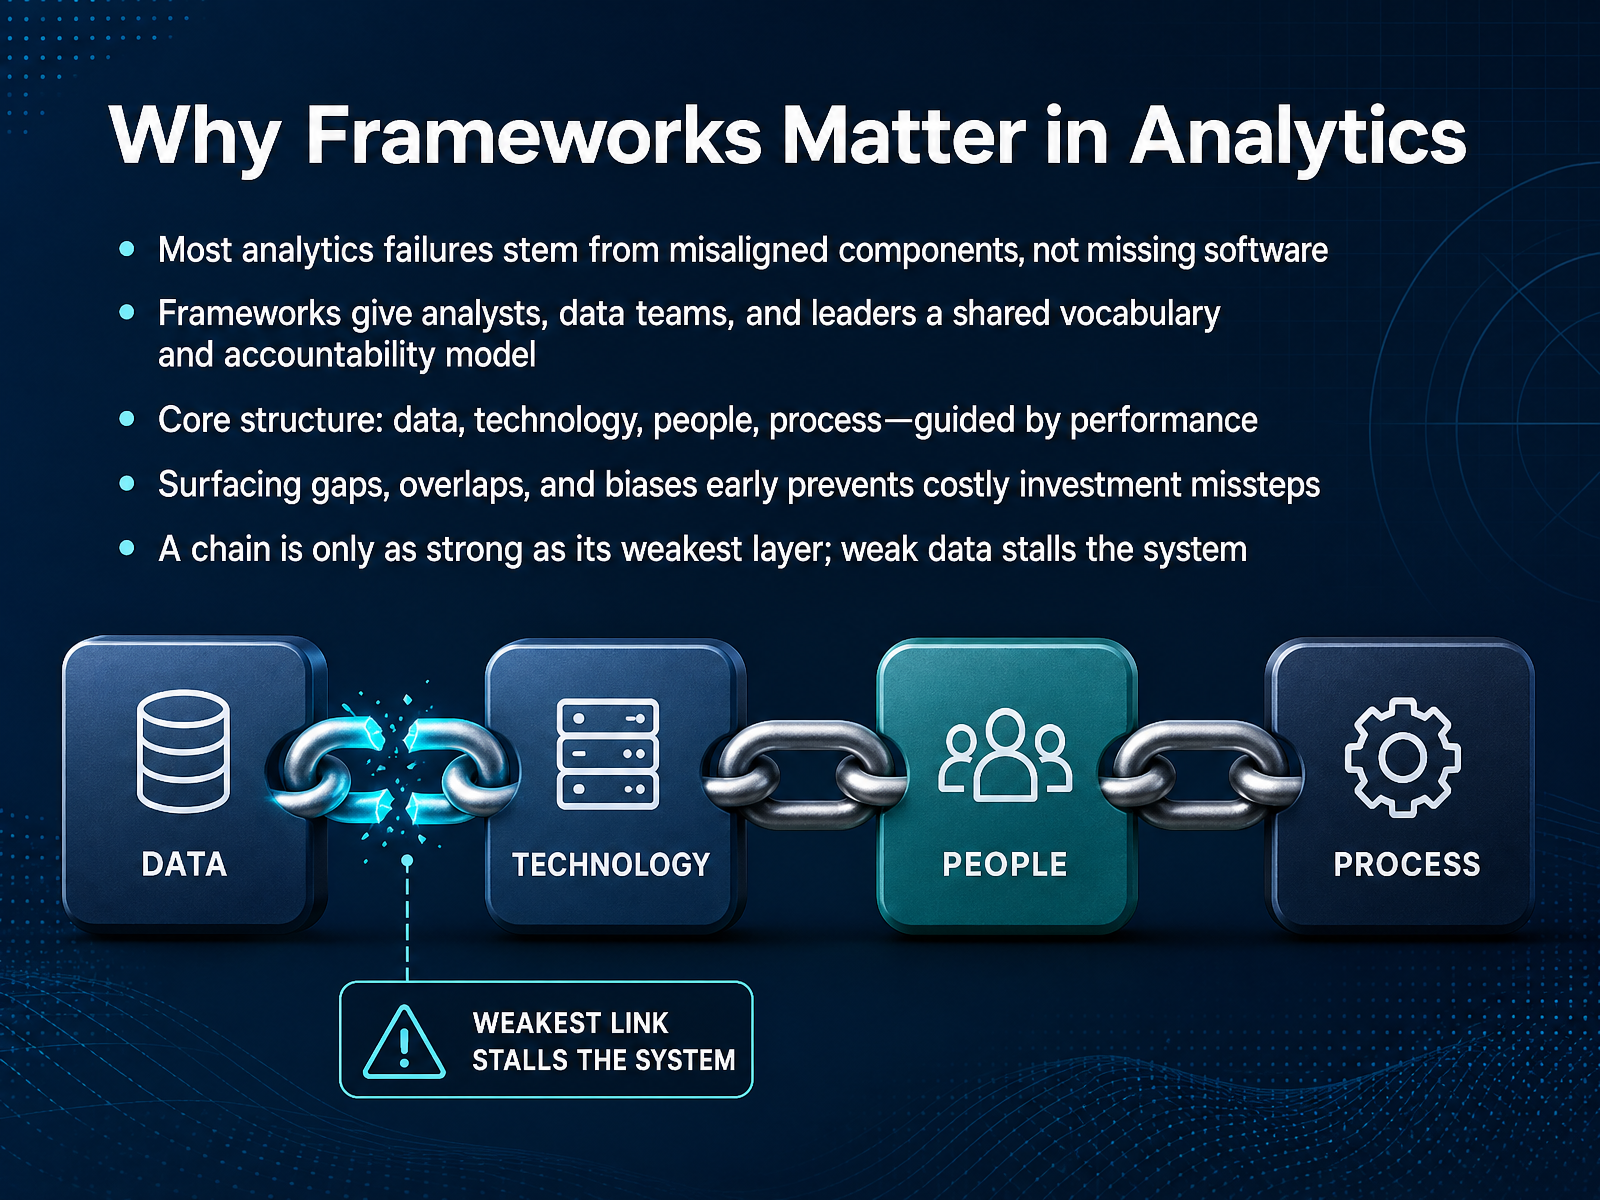
- 02Why Frameworks Matter in AnalyticsSo, why do frameworks matter in analytics? The short answer: most analytics failures are not caused by missing software. They're caused by misaligned components. A framework gives analysts, data teams, and business leaders a shared vocabulary and a clear model of accountability. The core structure is built on four layers: data, technology, people, and process—all guided by performance. When these layers are aligned, you can surface gaps, overlaps, and biases early, before they become costly investment mistakes. Think of it like a chain: it's only as strong as its weakest link. If your data layer is weak, the whole system stalls, no matter how good your tools are. A framework helps you spot that weak layer before it breaks. Now, let's look at how analytics has evolved to get here.
 mdpi.comrepositori.mypolycc.edu.myibimapublishing.com+21 min
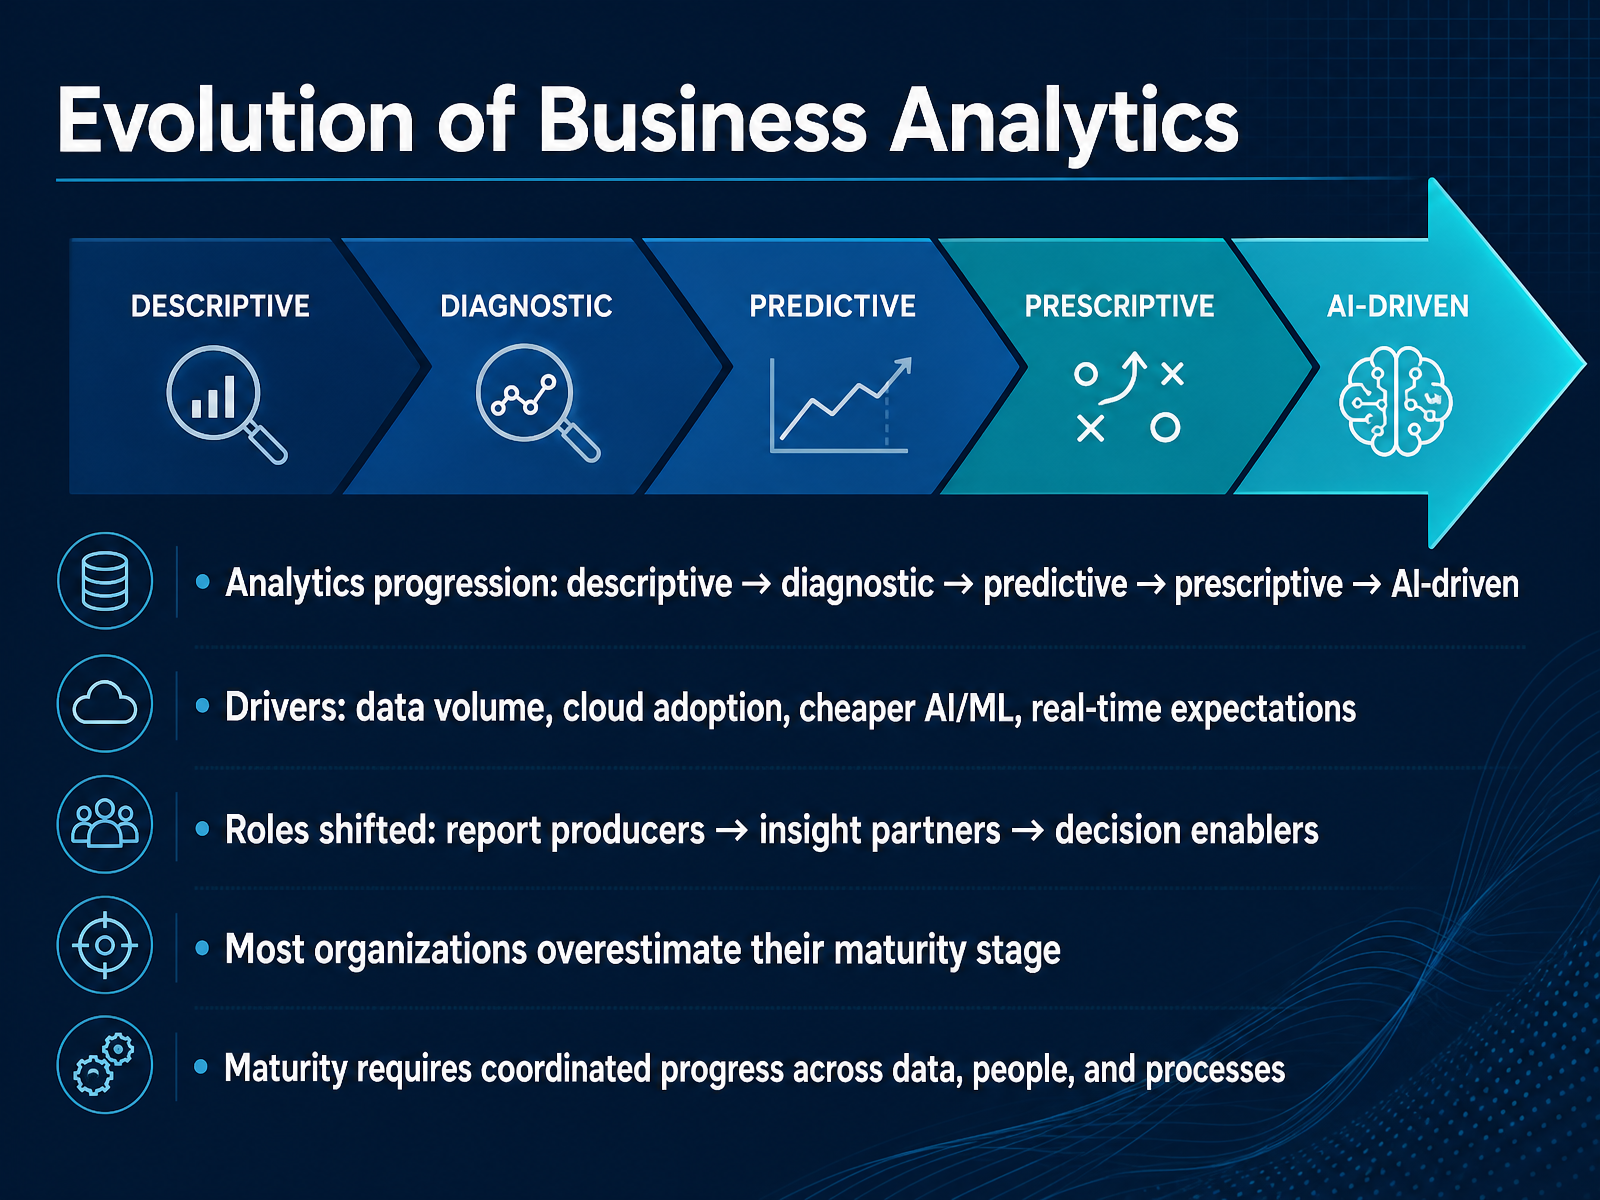
 - 03Evolution of Business AnalyticsNow let's look at how business analytics has evolved. The journey typically starts with descriptive analytics—understanding what happened. Then we move to diagnostic, asking why it happened. Predictive comes next, forecasting what will happen. Prescriptive recommends what we should do about it. And increasingly, we see AI-driven analytics making autonomous decisions. What's driving this shift? Three things: the explosion in data volume, cloud adoption making storage and compute cheaper, and AI and machine learning becoming more accessible. Real-time expectations have also changed the game—users want answers now, not next quarter. This evolution has transformed roles. Analysts used to be report producers. Now they're insight partners, and increasingly, decision enablers. Here's the catch: most organizations overestimate their maturity. They think they're at predictive when they're really at diagnostic. And maturity doesn't happen by buying better software. It requires coordinated progress across data, people, and processes. You can't skip stages. Understanding where you truly are is the first step. Next, we'll explore the four-layer framework that structures this journey.
 dataforest.aiconcentrix.comgrowthanalyticsengine.com+21 min
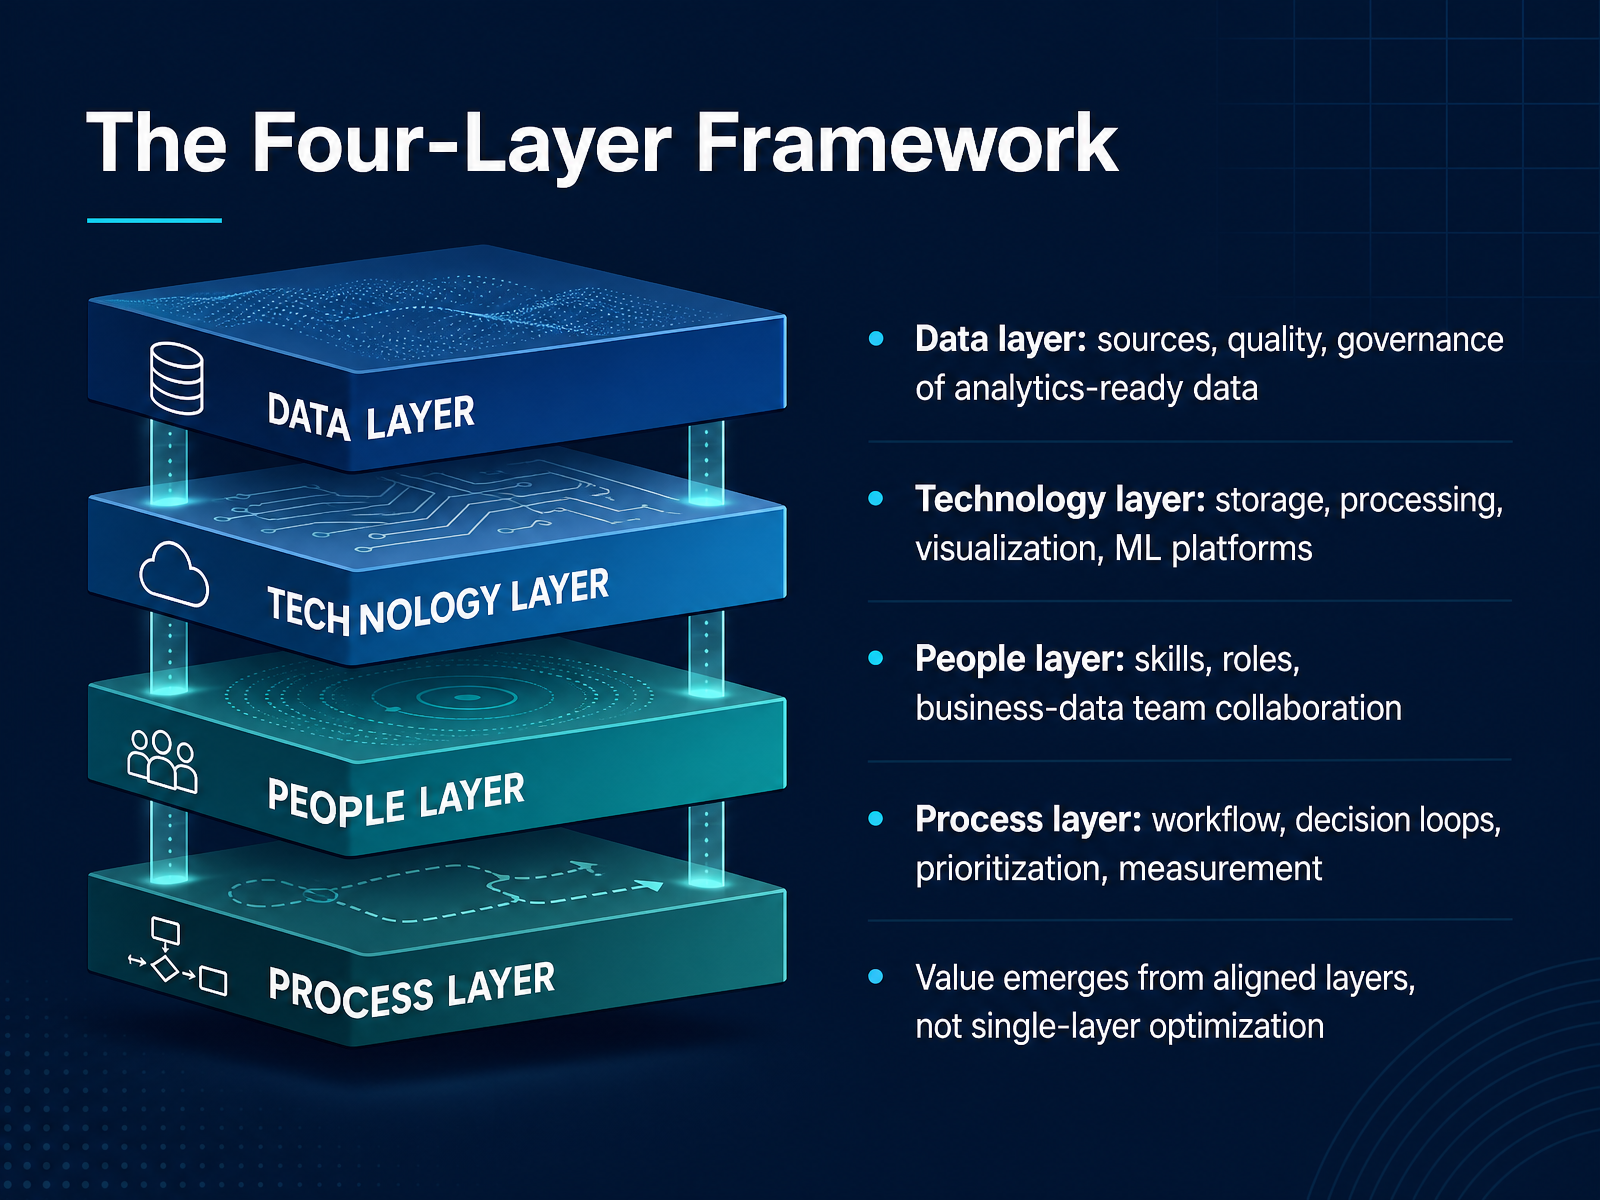
 - 04The Four-Layer FrameworkThat brings us to the core of how analytics actually works in practice: the four-layer framework. The first layer is data. This covers your sources, data quality, and governance. Without analytics-ready data, everything downstream starts to crack. The second layer is technology, meaning storage, processing, visualization, and machine-learning platforms. These tools do the heavy lifting once the data is in good shape. Then comes the people layer. It’s not just about technical skills; it’s about clear roles and real collaboration between the business and data teams. The final layer is process. This is about workflows, decision loops, prioritization, and measurement. Now here’s the key takeaway: value emerges when all four layers are aligned. Optimizing just one layer in isolation won’t move the needle. For example, you can have great technology, but if your data is messy or your business team isn’t involved, the output won’t be trusted. So as you evaluate your own programs, look at the alignment, not just the parts. Next, let’s get into the foundation of that first layer, data preparation and quality.
 mdpi.comrepositori.mypolycc.edu.myibimapublishing.com+22 min
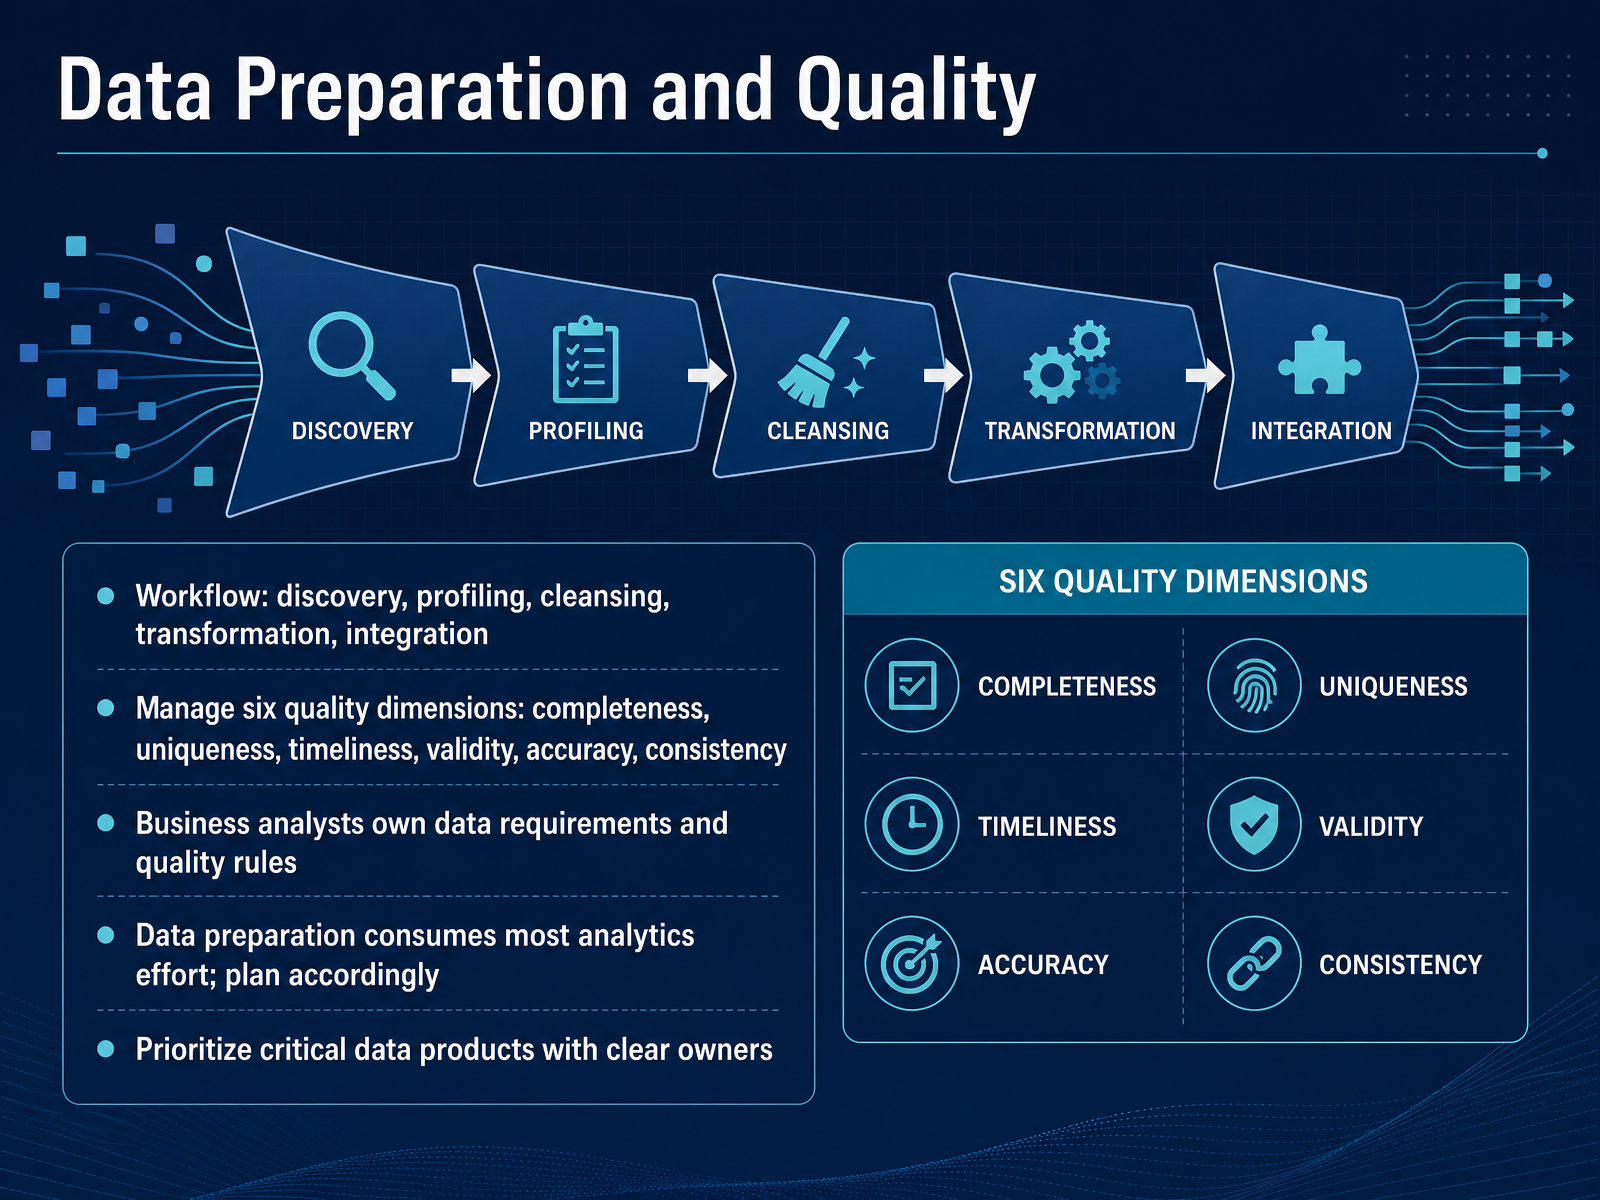
 - 05Data Preparation and QualityNow let's talk about the part that consumes most of your analytics effort: data preparation and quality. Before any model or dashboard can deliver value, the data underneath it has to be trustworthy. Think of this as a workflow with five stages: discovery, profiling, cleansing, transformation, and integration. But the real key is how you define quality. We measure it across six dimensions: completeness, uniqueness, timeliness, validity, accuracy, and consistency. Each one needs its own rule and its own threshold. A few missing fields might be tolerable for one analysis, but duplicate records or stale data could be fatal for another. And here's the important part: as business analysts, you own the data requirements and the quality rules. Engineers build the pipelines, but you define what good looks like. So plan for this. Data preparation is not a side task. You should prioritize your critical data products and make sure each one has a clear owner. That ownership is what separates successful analytics programs from the ones that stall. Now, once your data is clean and fit for purpose, we can turn to the next challenge: choosing the right analytical method.
 prophecy.aidatakrypton.aicdn.standards.iteh.ai+21 min
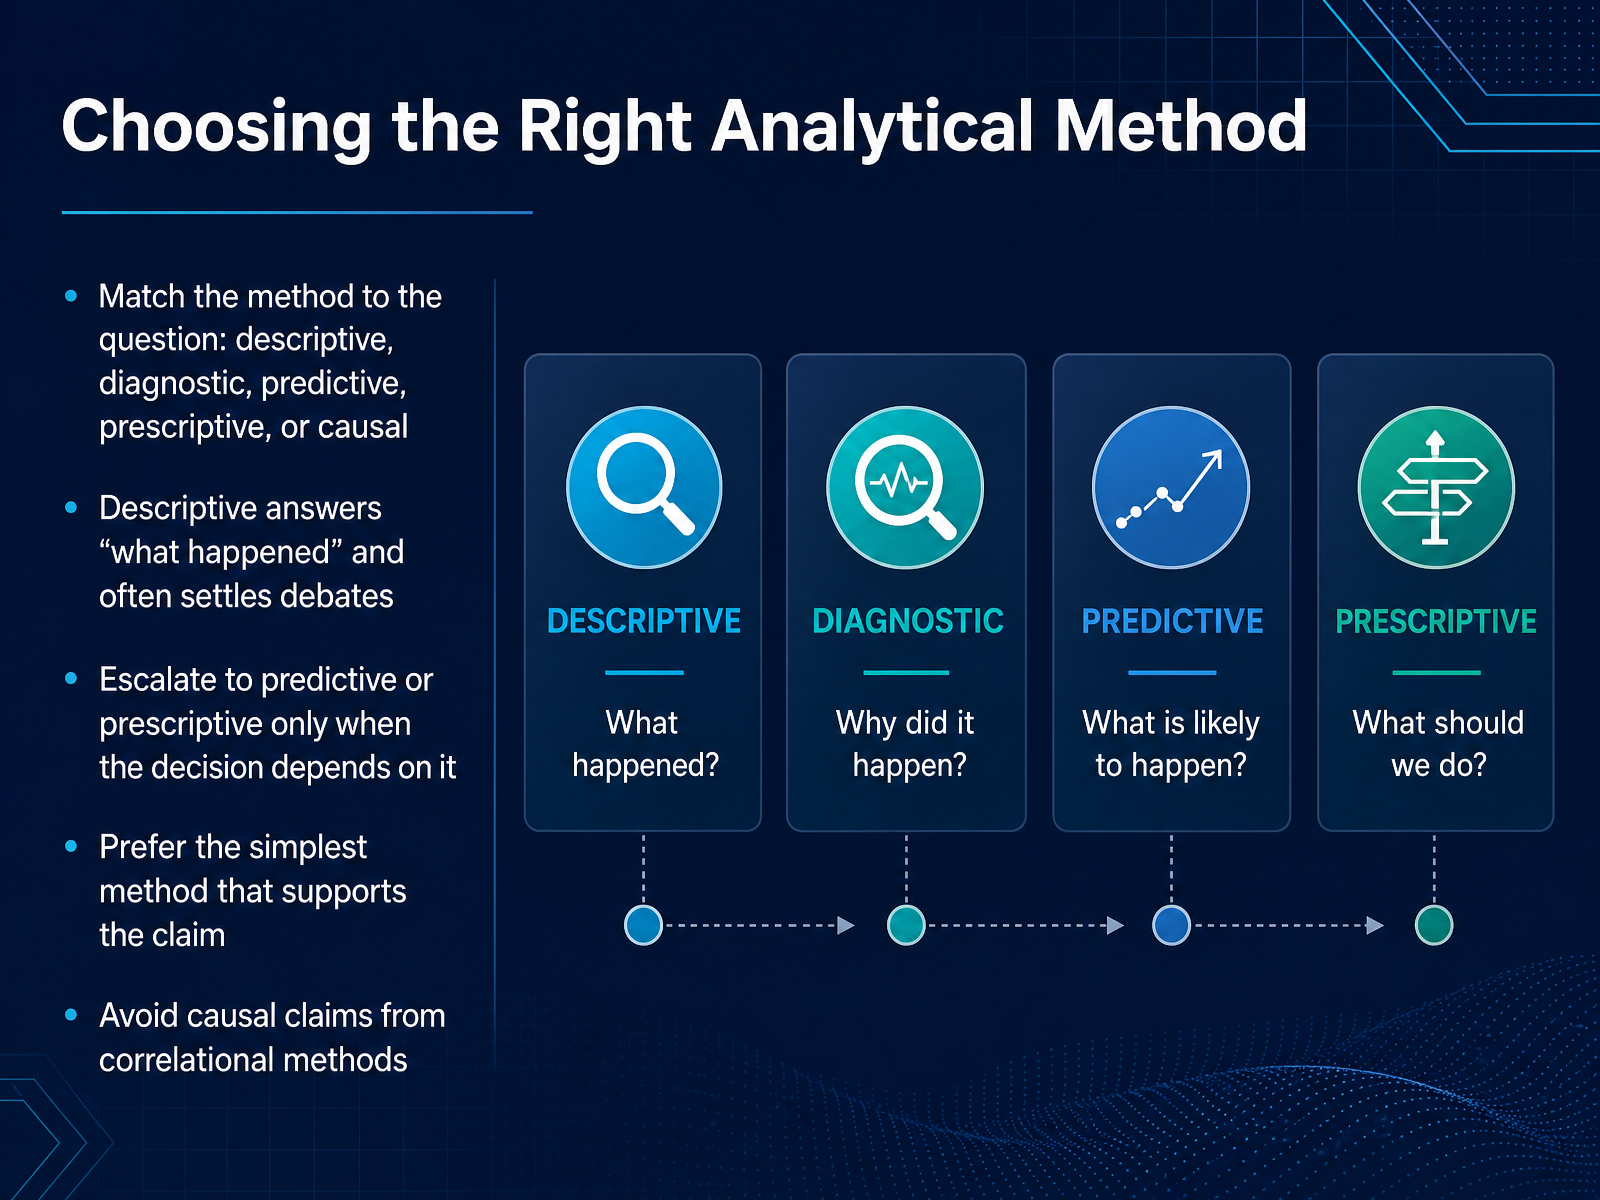
 - 06Choosing the Right Analytical MethodNow let's talk about choosing the right analytical method. The key is to match the method to the question you're asking. Descriptive analytics answers 'what happened,' and it's often enough to settle a debate. Think about a simple count of sales by region—that can end a disagreement faster than any model. Only escalate to predictive or prescriptive when a decision truly depends on it. And when you do escalate, prefer the simplest method that supports your claim. A well-built cohort table often beats a complex model that nobody can check. One caution: don't make causal claims from correlational data. Just because two trends move together doesn't mean one caused the other. So, start descriptive, escalate deliberately, and always keep your claim in line with your method. That discipline sets up the next piece: how the right technology enables this whole framework.
 skopx.comnumerious.comewadirect.com+21 min
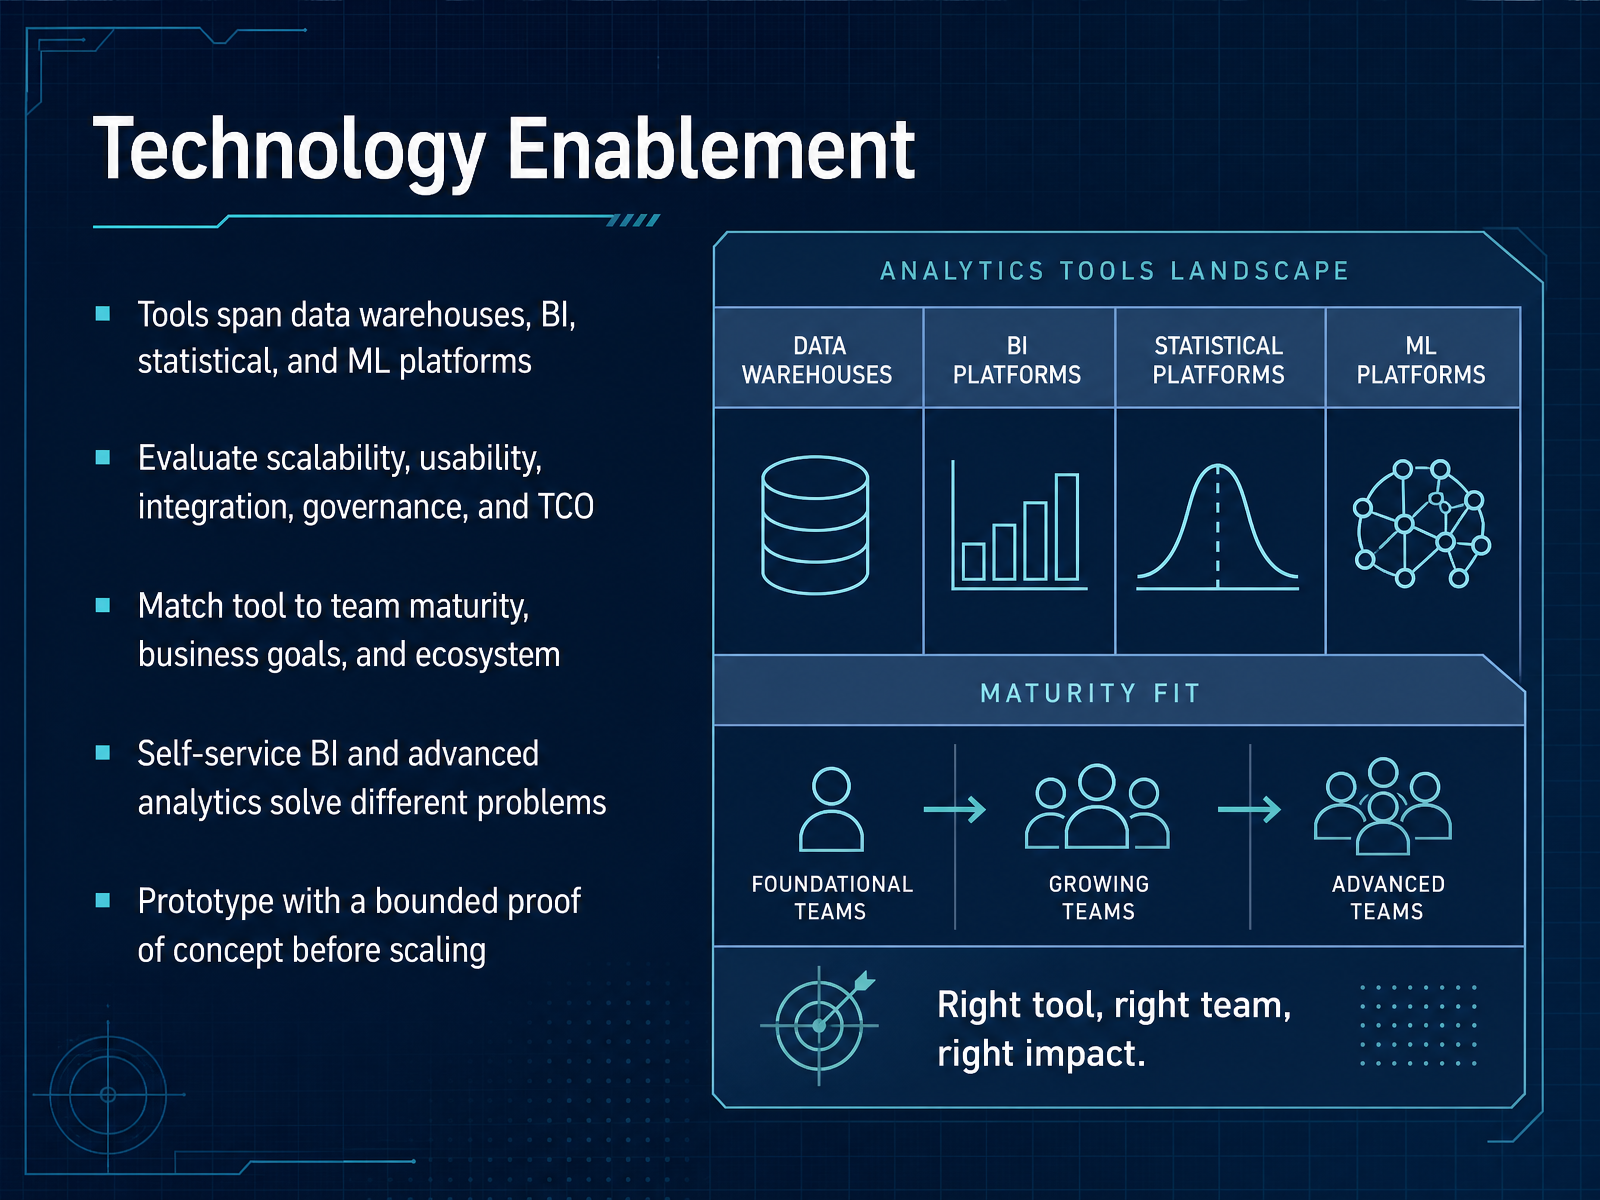
 - 07Technology EnablementNow let's talk about technology enablement, because this is where the framework meets the real world. The tool landscape is broad, from data warehouses to BI platforms, and statistical or machine learning environments. But before you pick any of them, think about your evaluation criteria. Scalability matters, usability matters, and so does integration with your existing ecosystem. And don't forget governance and total cost of ownership; those hidden costs often exceed license fees. The key is to match the tool to your team's maturity and your business goals, not just to the latest trend. Remember that self-service BI and advanced analytics solve different problems. A dashboard tool won't do deep predictive modeling well, and a statistical platform may frustrate business users. So, prototype with a bounded proof of concept before you scale. Test it on a real business question, time-box the pilot, and let the results guide your decision. Now, let's consider how to design the analytics operating model that brings all of these components together.
 mdpi.comrepositori.mypolycc.edu.myibimapublishing.com+21 min
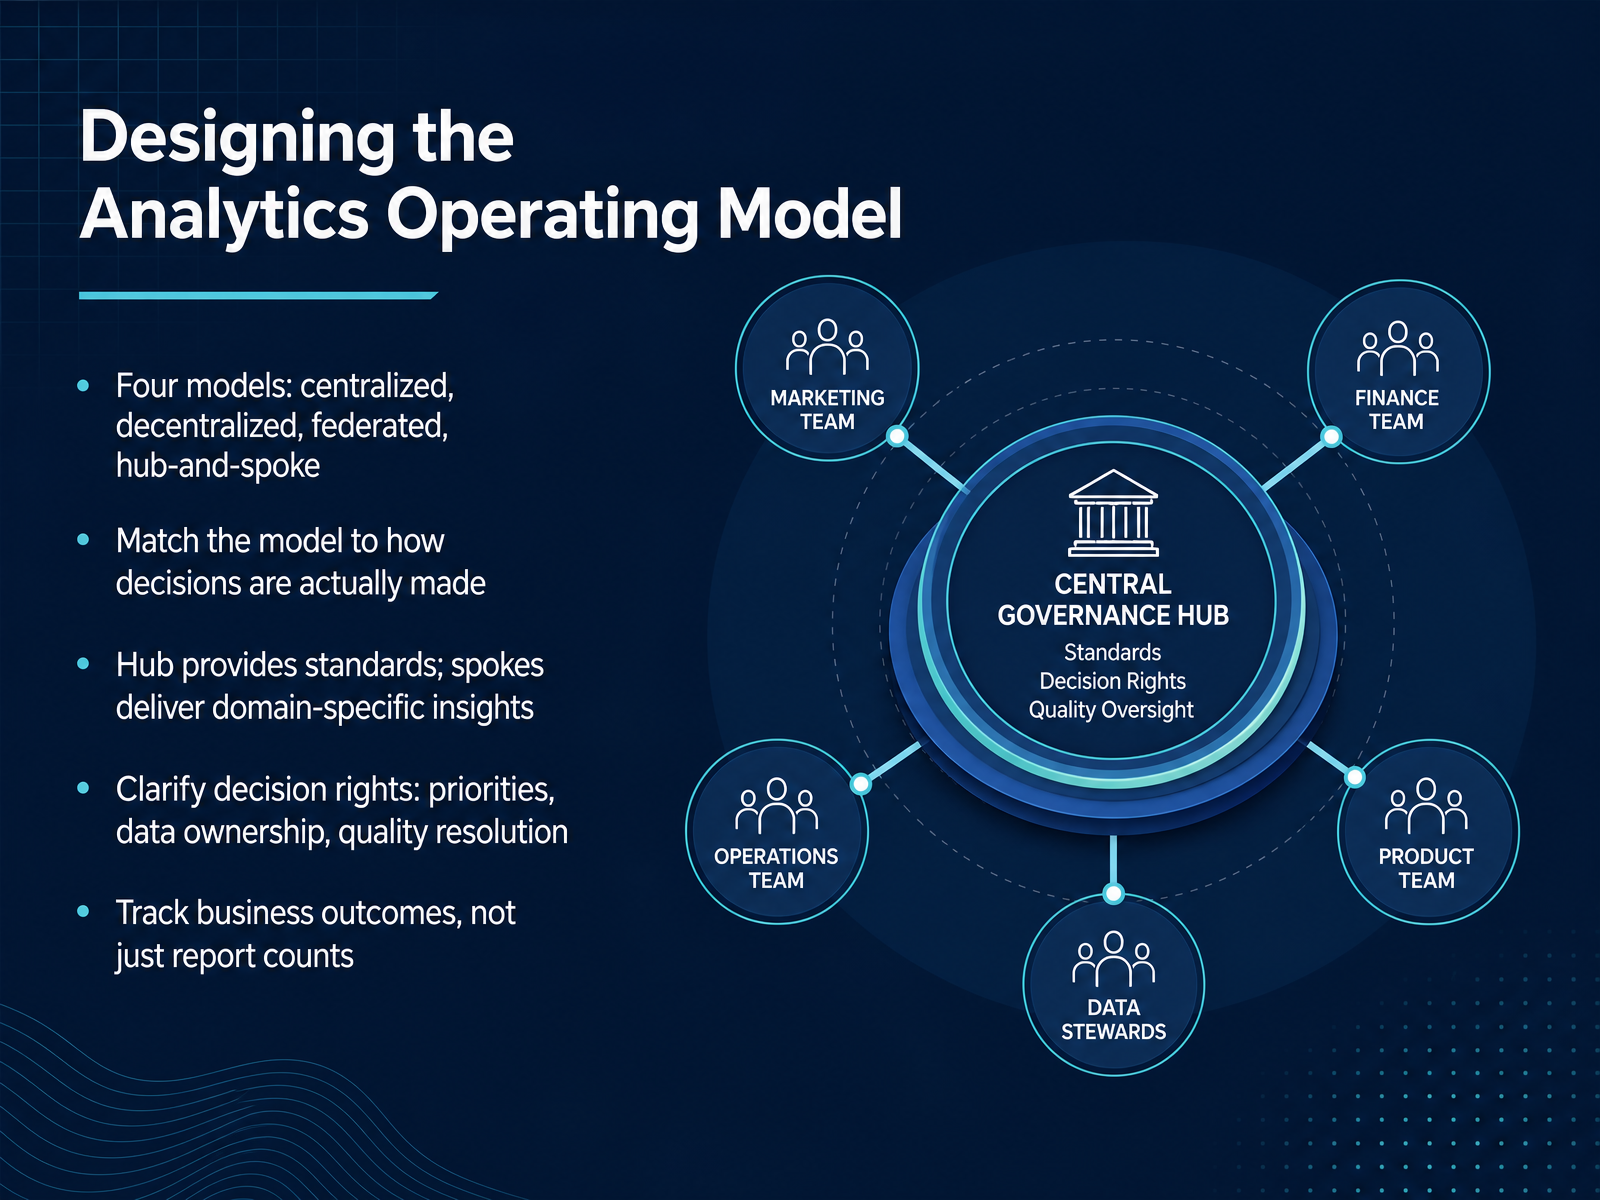
 - 08Designing the Analytics Operating ModelNow let's talk about how you actually organize the analytics function. There are four common operating models: centralized, decentralized, federated, and hub-and-spoke. The key is to match the model to how decisions are really made in your organization, not just to an org chart. A centralized model works well when there's a lot of commonality across business units. A decentralized model fits when domains have high autonomy. But for most organizations, the hub-and-spoke model strikes the right balance. The hub, often a center of excellence, sets the standards, manages the platform, and owns governance. The spokes, the domain teams, deliver insights specific to their business needs. This prevents both bottlenecks and chaos. For this to work, you must clarify decision rights. Who sets priorities? Who owns data quality? Who resolves conflicting definitions? If that's ambiguous, the model will fail. And finally, track business outcomes, not just report counts. The goal is better decisions and measurable value, not more dashboards. When you design your operating model, keep the hub lean, the spokes empowered, and the outcomes visible. Next, we'll walk through how to apply this entire framework end-to-end.
 mdpi.comrepositori.mypolycc.edu.myibimapublishing.com+22 min
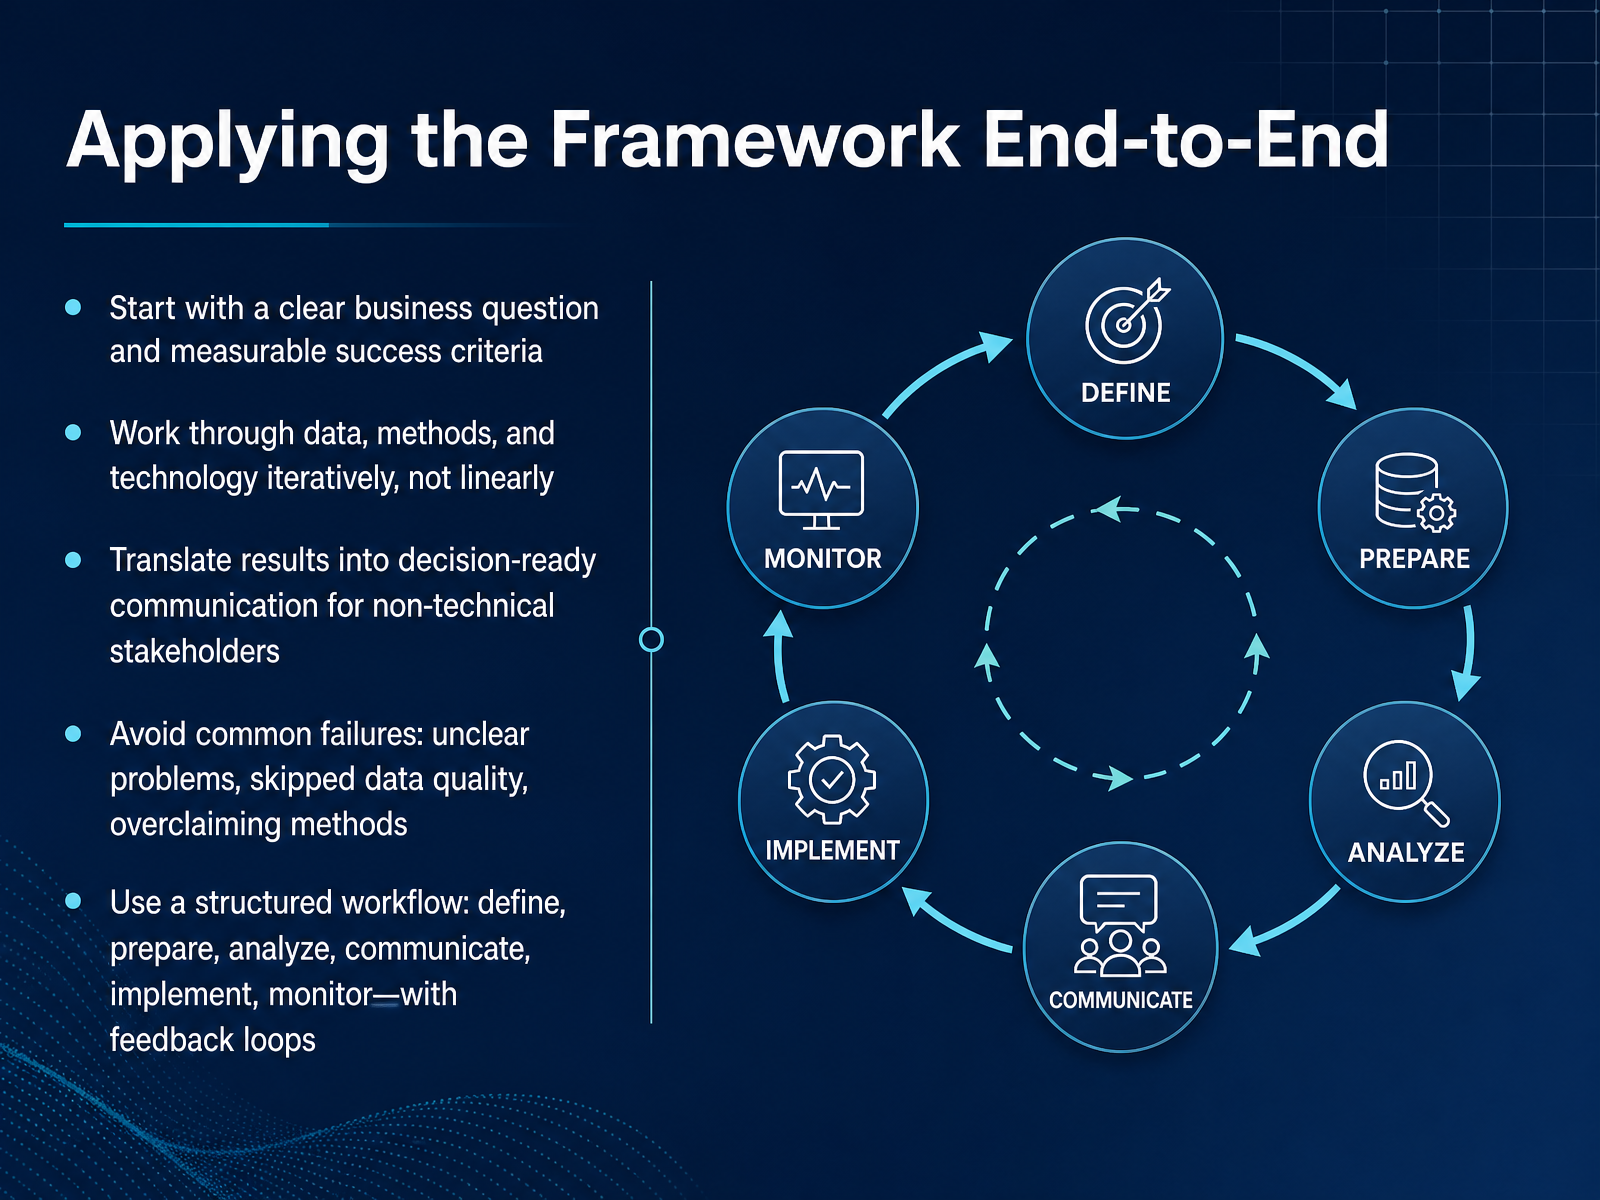
 - 09Applying the Framework End-to-EndNow let’s bring the framework to life. Every analytics initiative works best when you follow a structured workflow: define, prepare, analyze, communicate, implement, and monitor. And critically, this is not a straight line. You’ll move back and forth as you learn more, and that’s exactly as it should be. Start with a sharp business question. Vague goals produce vague results. Pair that question with measurable success criteria so you know what winning looks like. Work through your data, methods, and technology iteratively. Test, refine, and adjust. When you have results, don’t just hand over a spreadsheet. Translate them into decision-ready communication that a non-technical stakeholder can act on. And watch for the classic failure modes: an unclear problem, skipped data quality checks, and overclaiming what your methods can actually prove. Use your feedback loops. The monitoring phase isn’t the end. It feeds new questions back into the process, keeping the whole cycle alive. Now let’s look at some real-world case patterns to see this in action.
 mdpi.comrepositori.mypolycc.edu.myibimapublishing.com+21 min
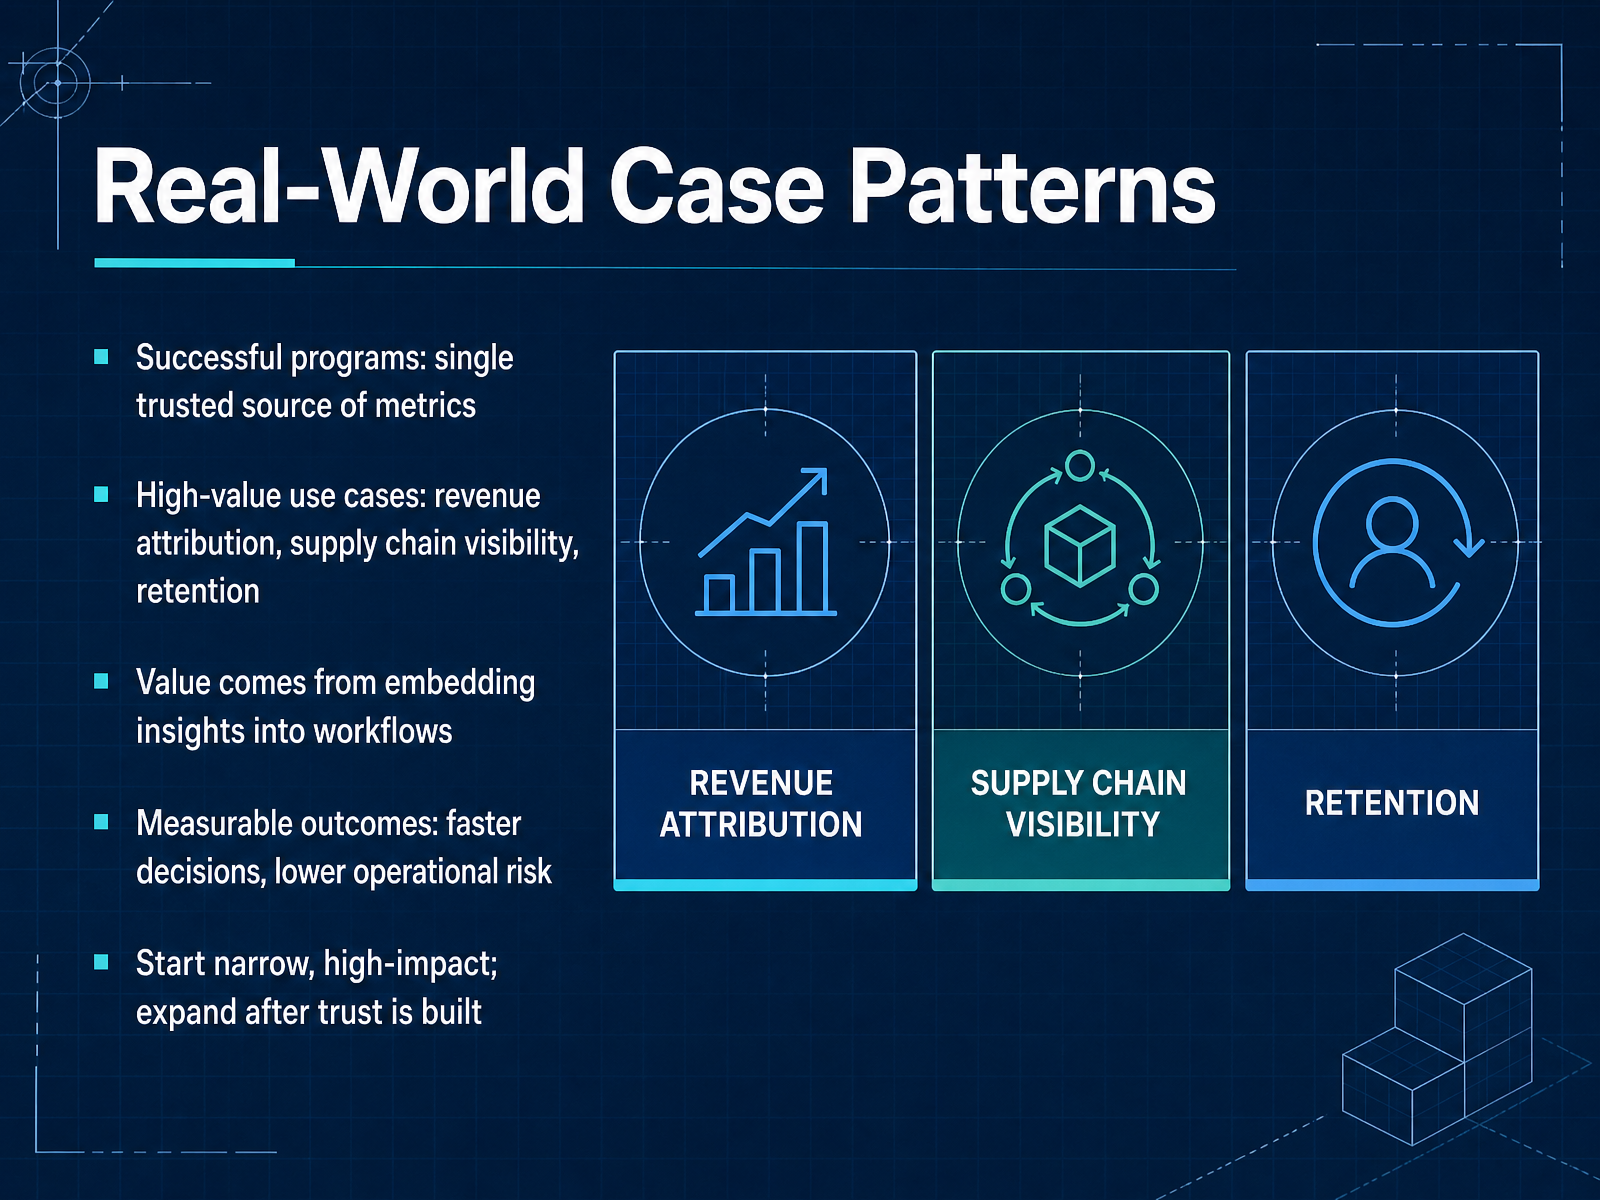
 - 10Real-World Case PatternsLet’s look at some real-world patterns that separate successful analytics programs from the ones that stall. The first pattern is a single trusted source of metrics. Without it, teams argue over numbers instead of acting on them. Take Hellmann Logistics: they unified pipeline visibility and cut out the guesswork entirely. The second pattern is picking high-value use cases. Revenue attribution, supply chain visibility, and retention are consistently where companies see the biggest returns. The third pattern is the one that matters most: value comes from embedding insights into workflows, not from building more dashboards. When analytics lives inside the tools people use daily, decisions get faster and operational risk drops measurably. Syngenta is a great example—they prevented over four thousand production stops by catching data issues before they halted the line. The measurable outcomes are consistent: faster decisions, lower risk, and less manual rework. But here is the practical takeaway. Start narrow. Pick one high-impact problem, prove the value, then expand once trust is built. That discipline is exactly what we’ll explore next as we look at building a data-driven decision culture.
 dataforest.aiconcentrix.comgrowthanalyticsengine.com+22 min
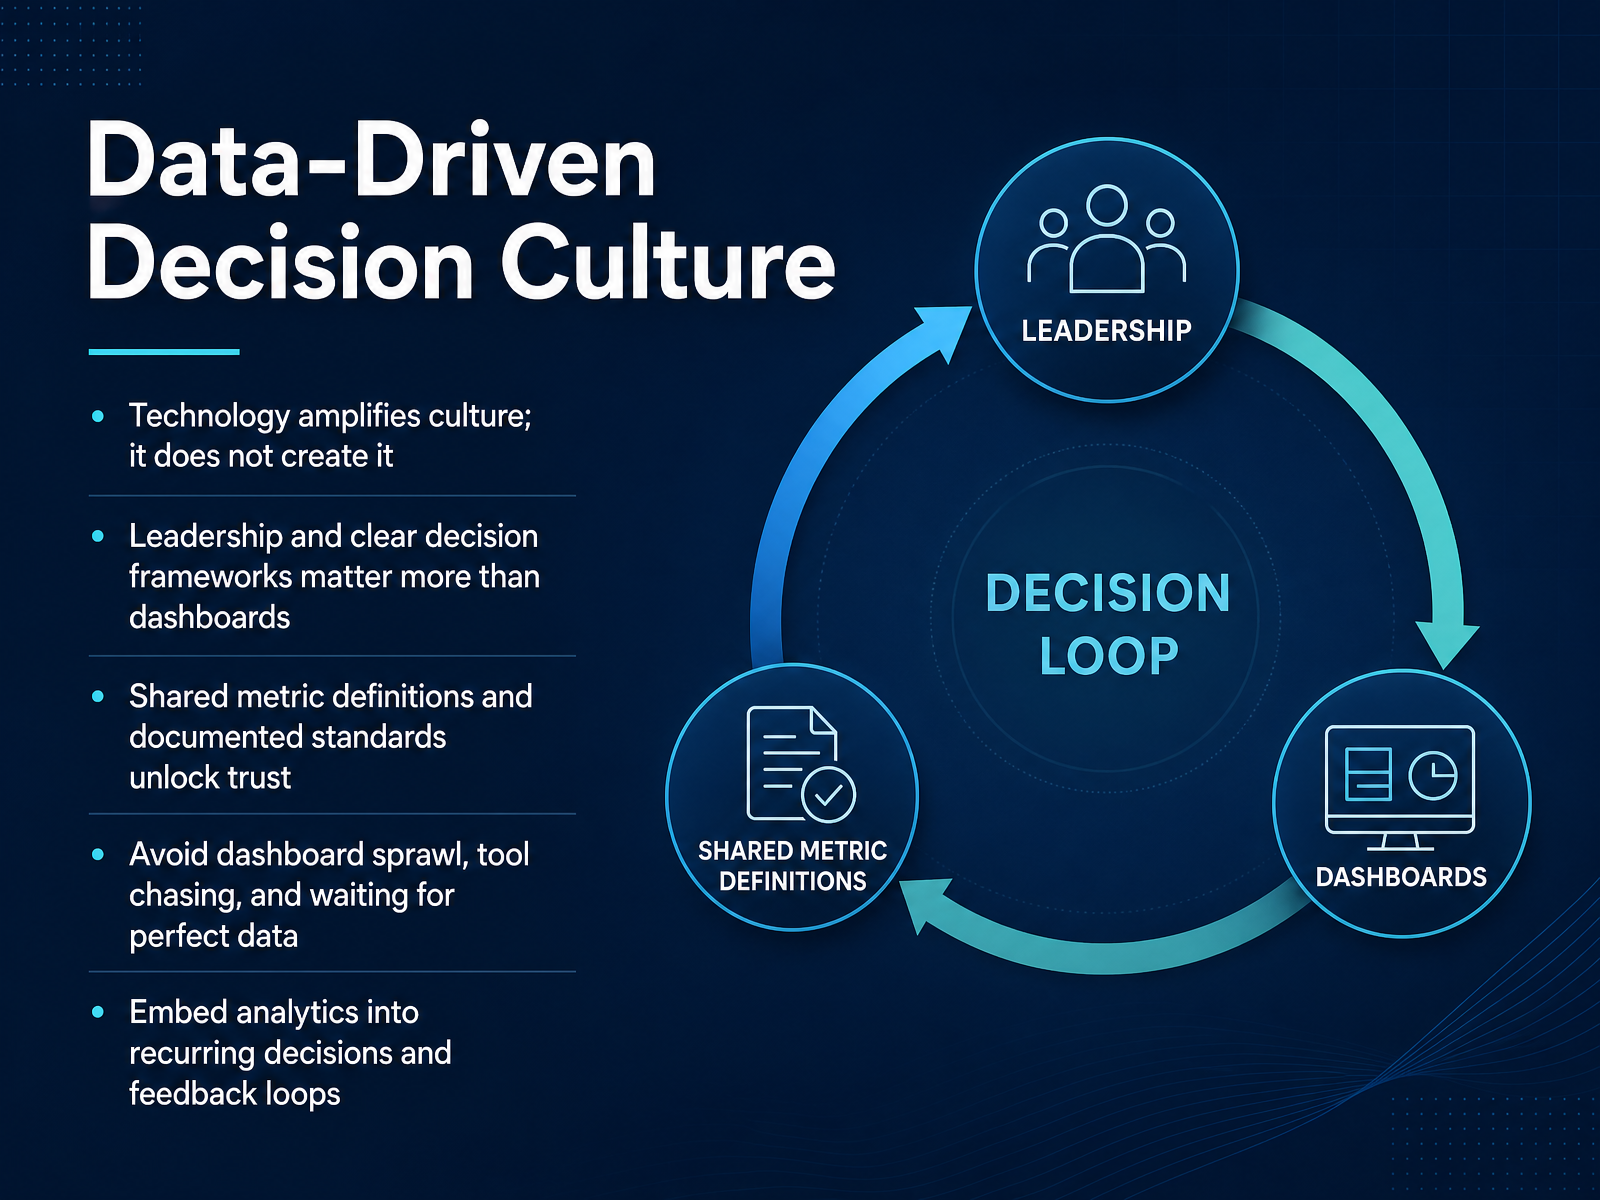
 - 11Data-Driven Decision CultureNow, let's talk about the culture that makes all of this work. Technology amplifies culture; it never creates it. You can buy the best analytics platform on the market, but if your teams don't trust the numbers, it will sit unused. What actually moves the needle is leadership and clear decision frameworks. They matter far more than any dashboard. Start by writing down your shared metric definitions. Document your standards. That is how you unlock trust across teams. It sounds simple, but most organizations skip this step, and the result is executives arguing over five different versions of revenue. Avoid the common traps: don't chase every new tool, don't build dashboard sprawl, and don't wait for perfect data. It will never come. Instead, embed analytics directly into the decisions you make on a recurring basis. Build feedback loops so that insights lead to action, and actions lead to learning. That is the real maturity journey. Coming up next, we will look at how governance and quality actually work in practice.
 dataforest.aiconcentrix.comgrowthanalyticsengine.com+21 min
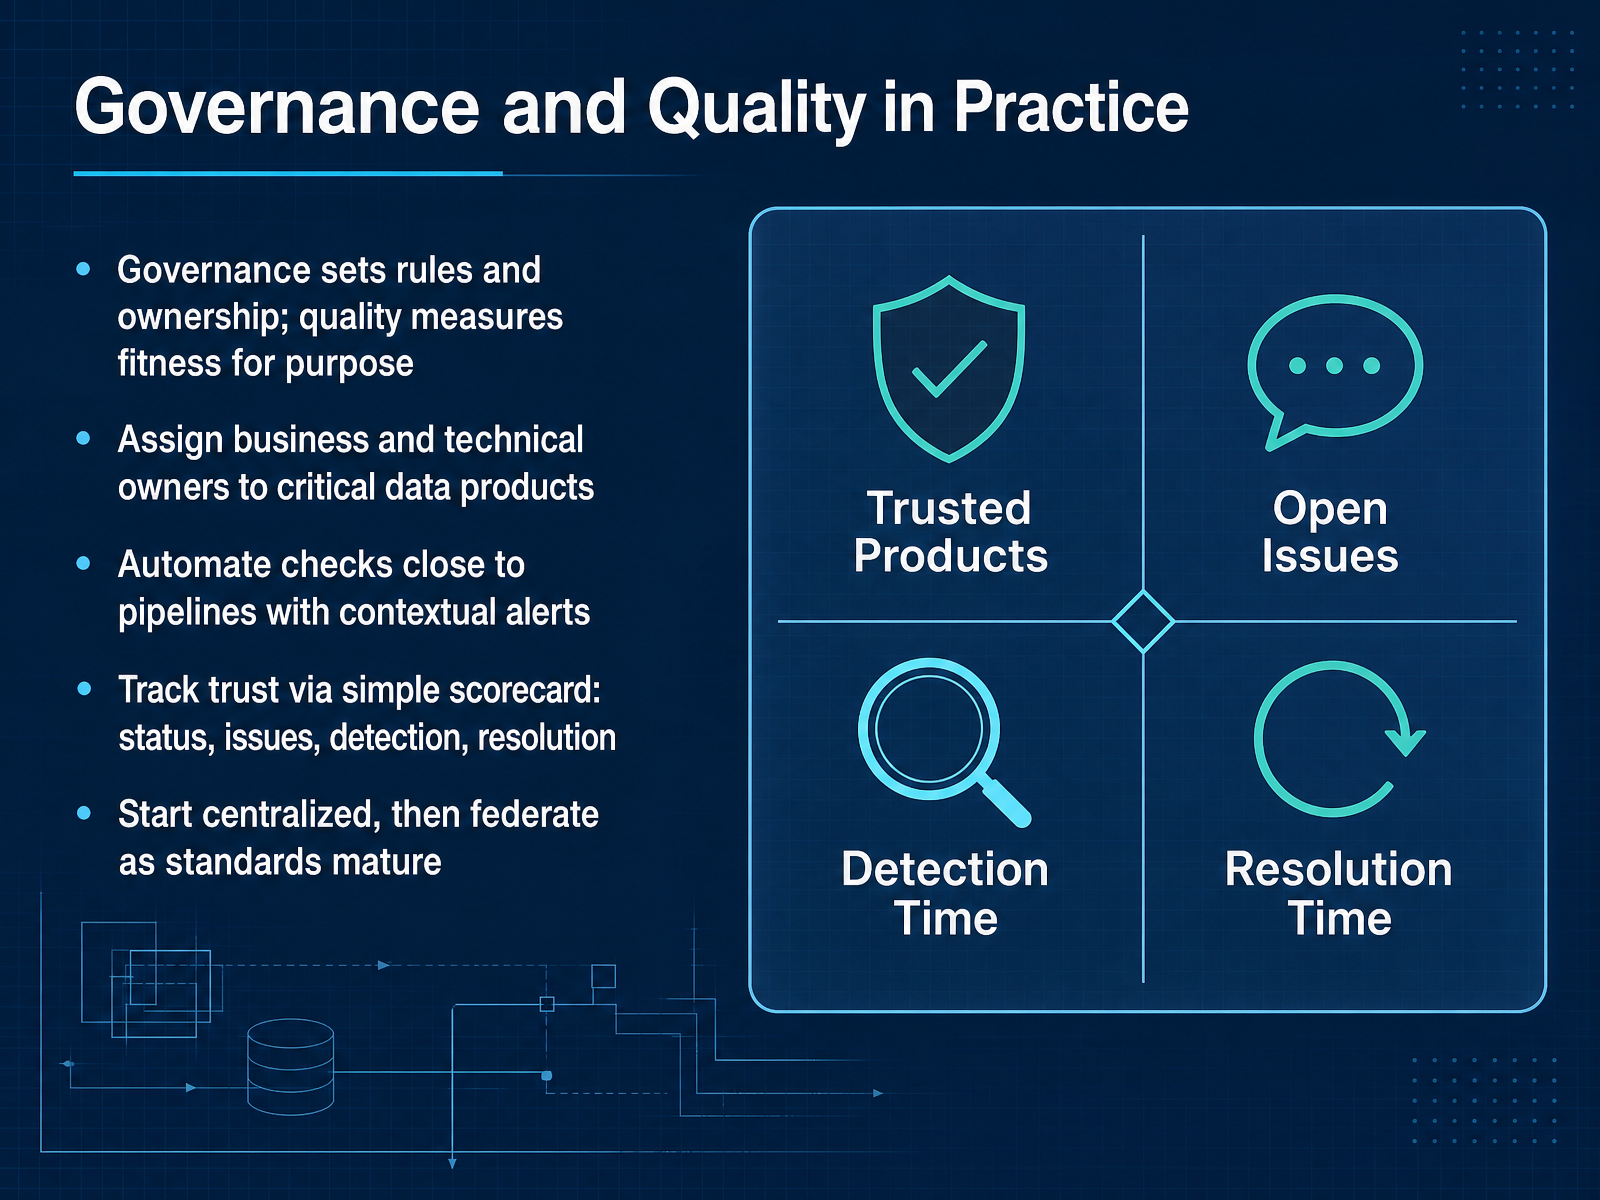
 - 12Governance and Quality in PracticeLet’s look at how governance and quality actually come together in practice. Governance sets the rules and assigns ownership. Quality, on the other hand, measures whether the data is truly fit for its purpose. Start by assigning both business and technical owners to your critical data products. The business owner defines what good looks like. The technical owner builds the checks and fixes the issues. Next, automate those checks as close to the pipeline as possible. Don’t wait for a monthly review to find a problem. Embed validation into your transformation jobs and send contextual alerts to the right team. Then, track trust through a simple scorecard. You want to see status, open issues, detection time, and resolution time at a glance. For example, a green, amber, and red status per report makes it immediately clear which data products are reliable and which need attention. Finally, one crucial sequencing point: start centralized, then federate. Establish global standards first. Once those are mature, let individual domains manage their own rules. If you federate too early, you’ll end up with fragmented governance that’s hard to rein in. This sets the stage for the step-by-step adoption roadmap we’ll cover next.
 prophecy.aidatakrypton.aicdn.standards.iteh.ai+22 min
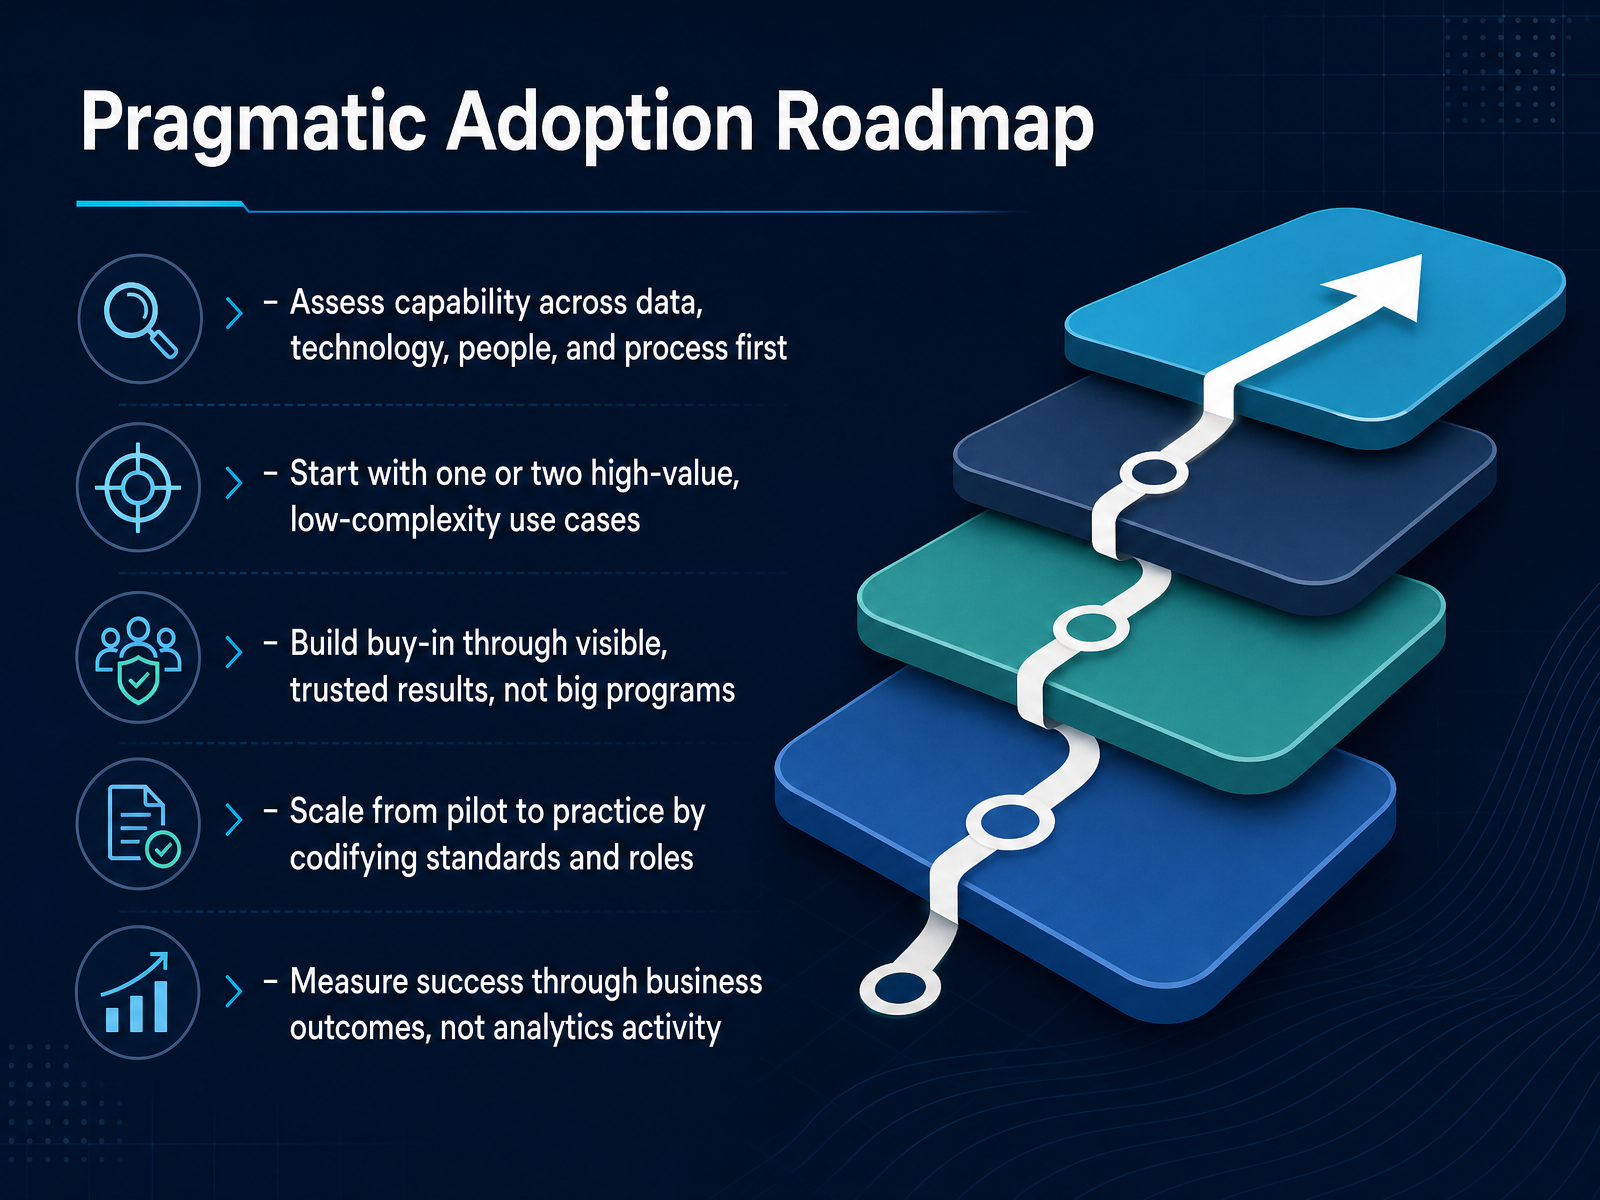
 - 13Pragmatic Adoption RoadmapHere’s how you actually move forward. First, assess capability across data, technology, people, and process. Be honest here—most organizations overestimate their maturity by at least one stage. Then, start small. Pick one or two use cases with high value and low complexity. Prove the framework works before you try to scale it. Build buy-in through visible, trusted results. Big programs create noise; small wins create believers. As you expand, codify the standards and roles from your pilot. This turns a one-off experiment into reliable practice. And finally, measure success through business outcomes, not analytics activity. Track revenue impact, cost savings, or time saved. Don't get trapped by dashboard counts or model deployment numbers. That’s the difference between activity and value. Keep this roadmap in mind as we move to the summary and next steps.
 dataforest.aiconcentrix.comgrowthanalyticsengine.com+22 min
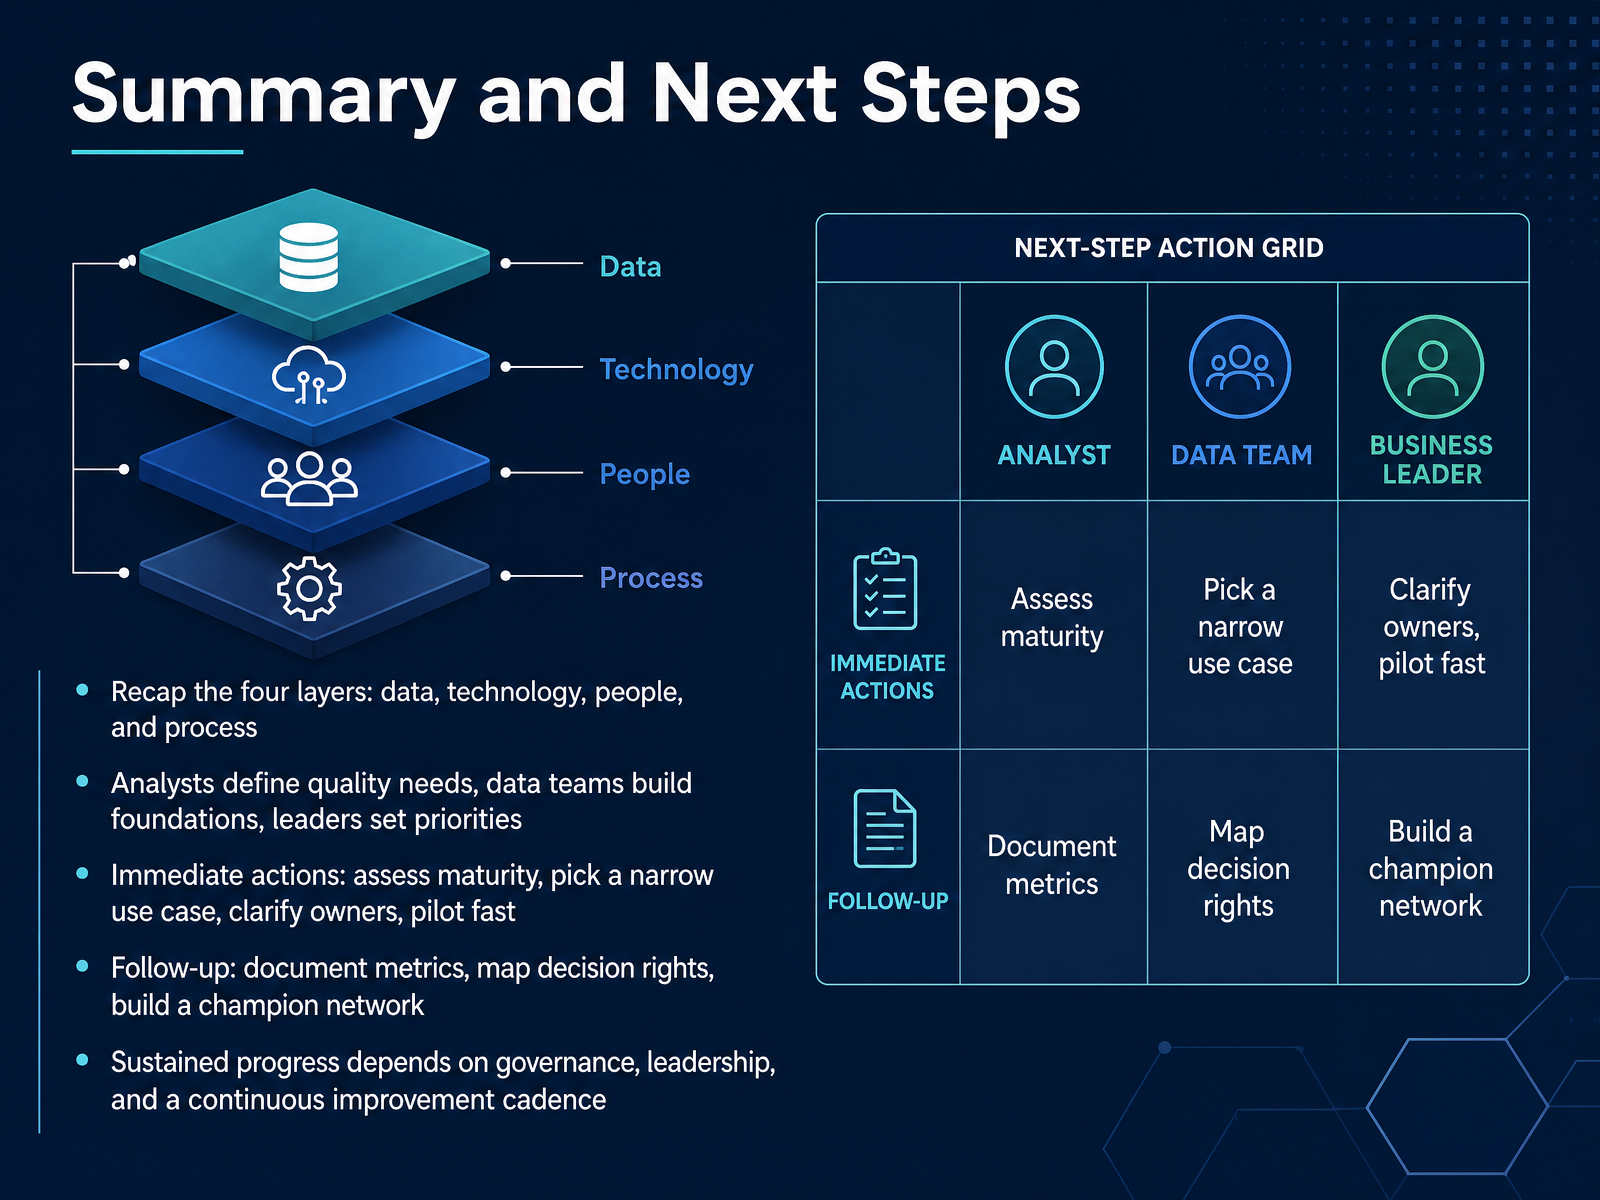
 - 14Summary and Next StepsWe've covered a lot of ground, so let's pull it together. Remember the four layers: data, technology, people, and process. Analysts define what good data looks like. Data teams build the foundation. And leaders set the priorities. Here's your action plan. Start by assessing your current maturity. Then pick one narrow use case. Clarify who owns what, and pilot fast. After that, document your metrics. Map out decision rights. And build a champion network to spread adoption. Sustained progress doesn't happen by accident. It takes governance, active leadership, and a steady rhythm of continuous improvement. That's how you turn analytics from a project into a capability. Thank you for your time and attention. Now go make your first move—start small, learn fast, and keep building.
 dataforest.aiconcentrix.comgrowthanalyticsengine.com+21 min
Take the deck with you
Download this course as a file — free, no sign-up needed.
- PDF handoutEvery slide page, ready to print or share.15 pages · 3.5 MBDownload
- Narrated PowerPointThe deck that presents itself — every slide carries the digital human's narration video.15 pages · 14.6 MBDownload
- PowerPoint slidesThe full deck as a .pptx — open it in PowerPoint, Keynote, or Google Slides.15 pages · 3.5 MBDownload
Free to use in your own training — please keep the PersonWise credit page at the end.
Have your own deck? Turn it into a course
Sources consulted
Web sources consulted while building this course.
- Analytics Maturity Model: 6 Stages, Self-Assessment & Roadmap — dataforest.ai
- The Analytics Catalyst - A Practical Framework for Data & AI Maturity — concentrix.com
- Analytics Maturity Model — 5 Stages Explained (2026) — Growth Analytics Engine — growthanalyticsengine.com
- Analytics Maturity Model: Assess Where Your Company Stands in 2026 | Valiotti Data — valiotti.com
- The development of data analytics maturity assessment framework: DAMAF — doi.org
- Contemporary Business Analytics: An Overview — mdpi.com
- The Design and Implementation of the Business Analytics Framework — repositori.mypolycc.edu.my
- A Five-Layered Business Intelligence Architecture — ibimapublishing.com
- Guiding the integration of analytics in business operations through a maturity framework — ideas.repec.org
- Gartner's Business Analytics Framework / gartner-s-business-analytics-framework.pdf / PDF4PRO — pdf4pro.com
- Building a Data Quality Framework: 2026 Guide — prophecy.ai
- Data Quality Framework Example for Analytics Teams — datakrypton.ai
- ISO/IEC 5259-5:2025 - ISO/IEC 5259-5:2025 — cdn.standards.iteh.ai
- Data Quality Management Guidebook — aisi.go.jp
- Data Quality Management: Framework, Process & Tools — fivetran.com
- Data Analysis Methodology: Choosing the Right Method — skopx.com
- How to Choose Research Methodology: A 3-Step Framework — numerious.com
- https://www.ewadirect.com/proceedings/ace/article/view/2497/pdf — ewadirect.com
- Appendix A — Method Selection Guide – Statistical Analysis for Small and Big Data — quarto.wessa.net
- Data Analysis Methods: A Practical Map for 2026 — infinisynapse.com