Begin
14 pages · ~28 min
Understanding N in Statistics
This training explains the meaning and role of N in statistics for learners who want to interpret sample sizes and population data correctly.
A digital instructor presents all 14 pages. Hold “Ask” at any point and ask out loud — the answer comes from this course. No sign-up needed.
What you’ll learn
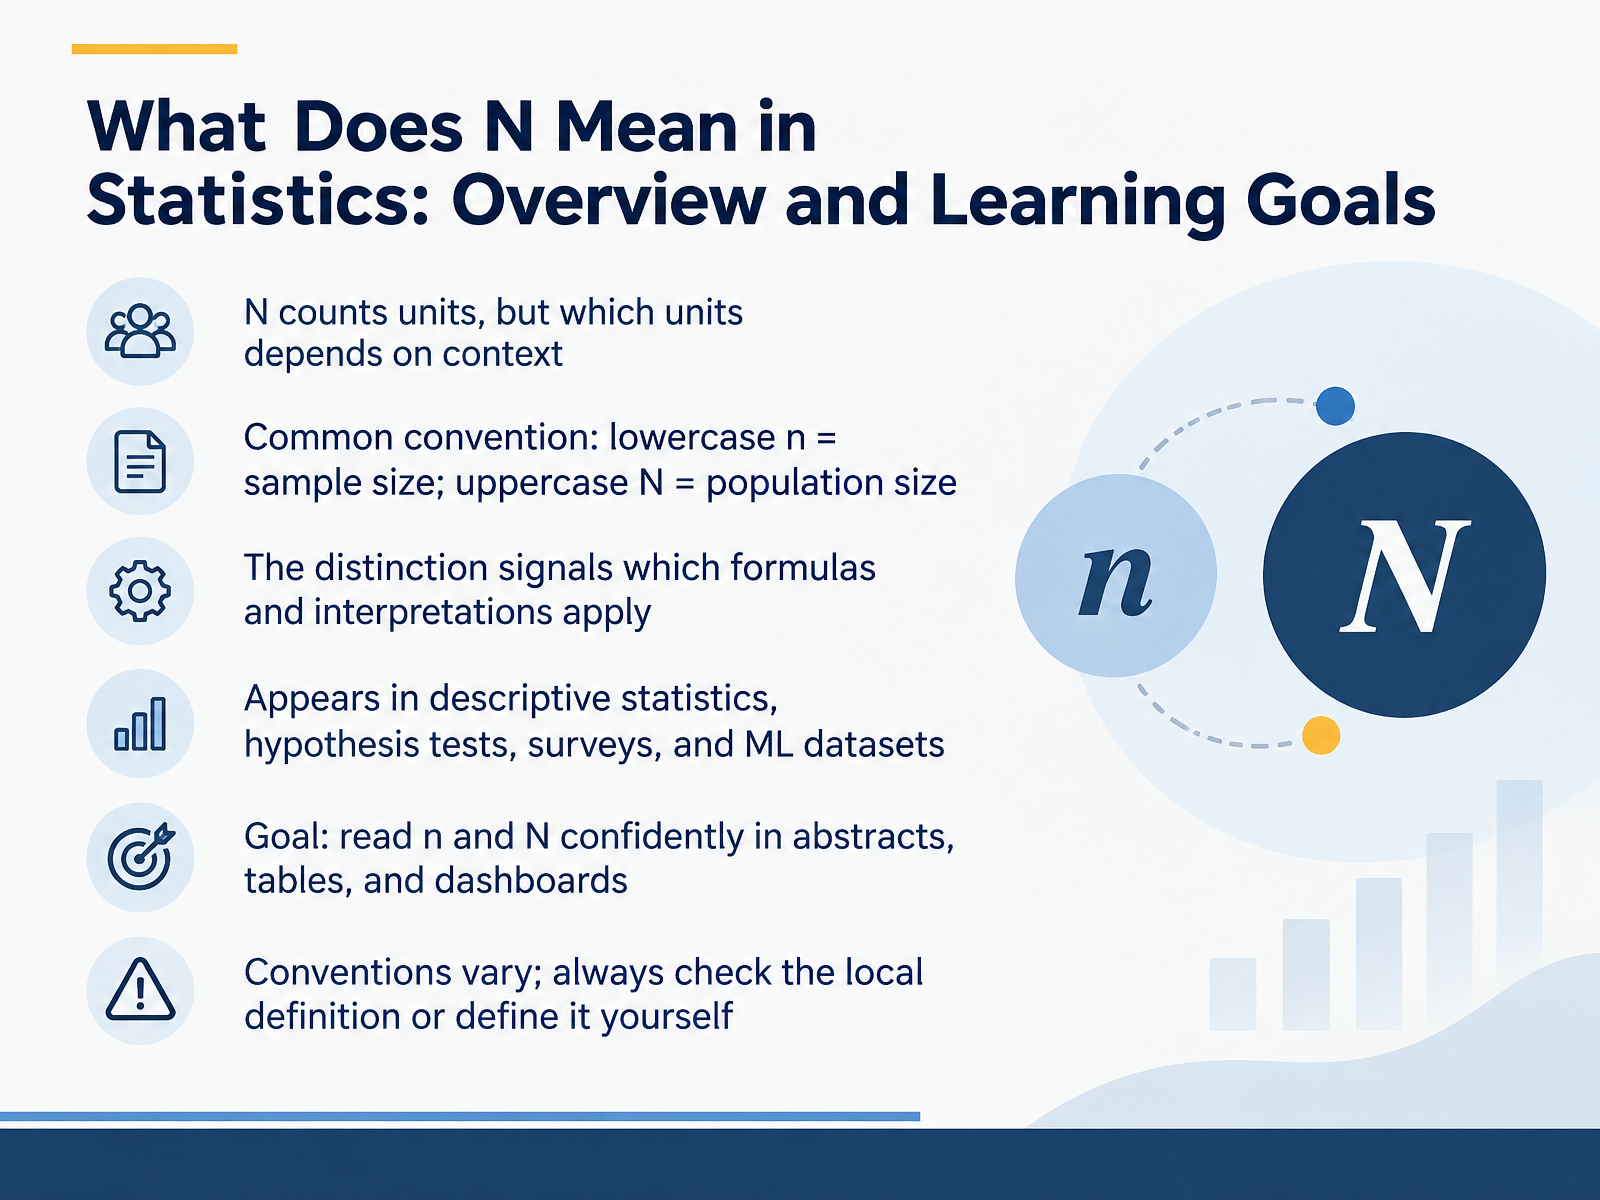
- 01What Does N Mean in Statistics: Overview and Learning GoalsWelcome. In this course, we will answer a question that trips up almost everyone at first: what does N mean in statistics? Here is the short answer. N counts units, but which units depends on context. The common convention is that lowercase n means sample size, and uppercase N means population size. That distinction is not decoration. It signals which formulas apply, and how you should interpret the results. You will see these letters in descriptive statistics, hypothesis tests, survey reports, and machine learning datasets. Our goal is simple. By the end, you should read n and N confidently in abstracts, tables, and dashboards. One caution before we continue. Conventions vary across fields and textbooks. So always check the local definition, or define it yourself. Now let us look at the core convention, lowercase n versus uppercase N.stats.stackexchange.comstatlit.orgdoi.org+21 min
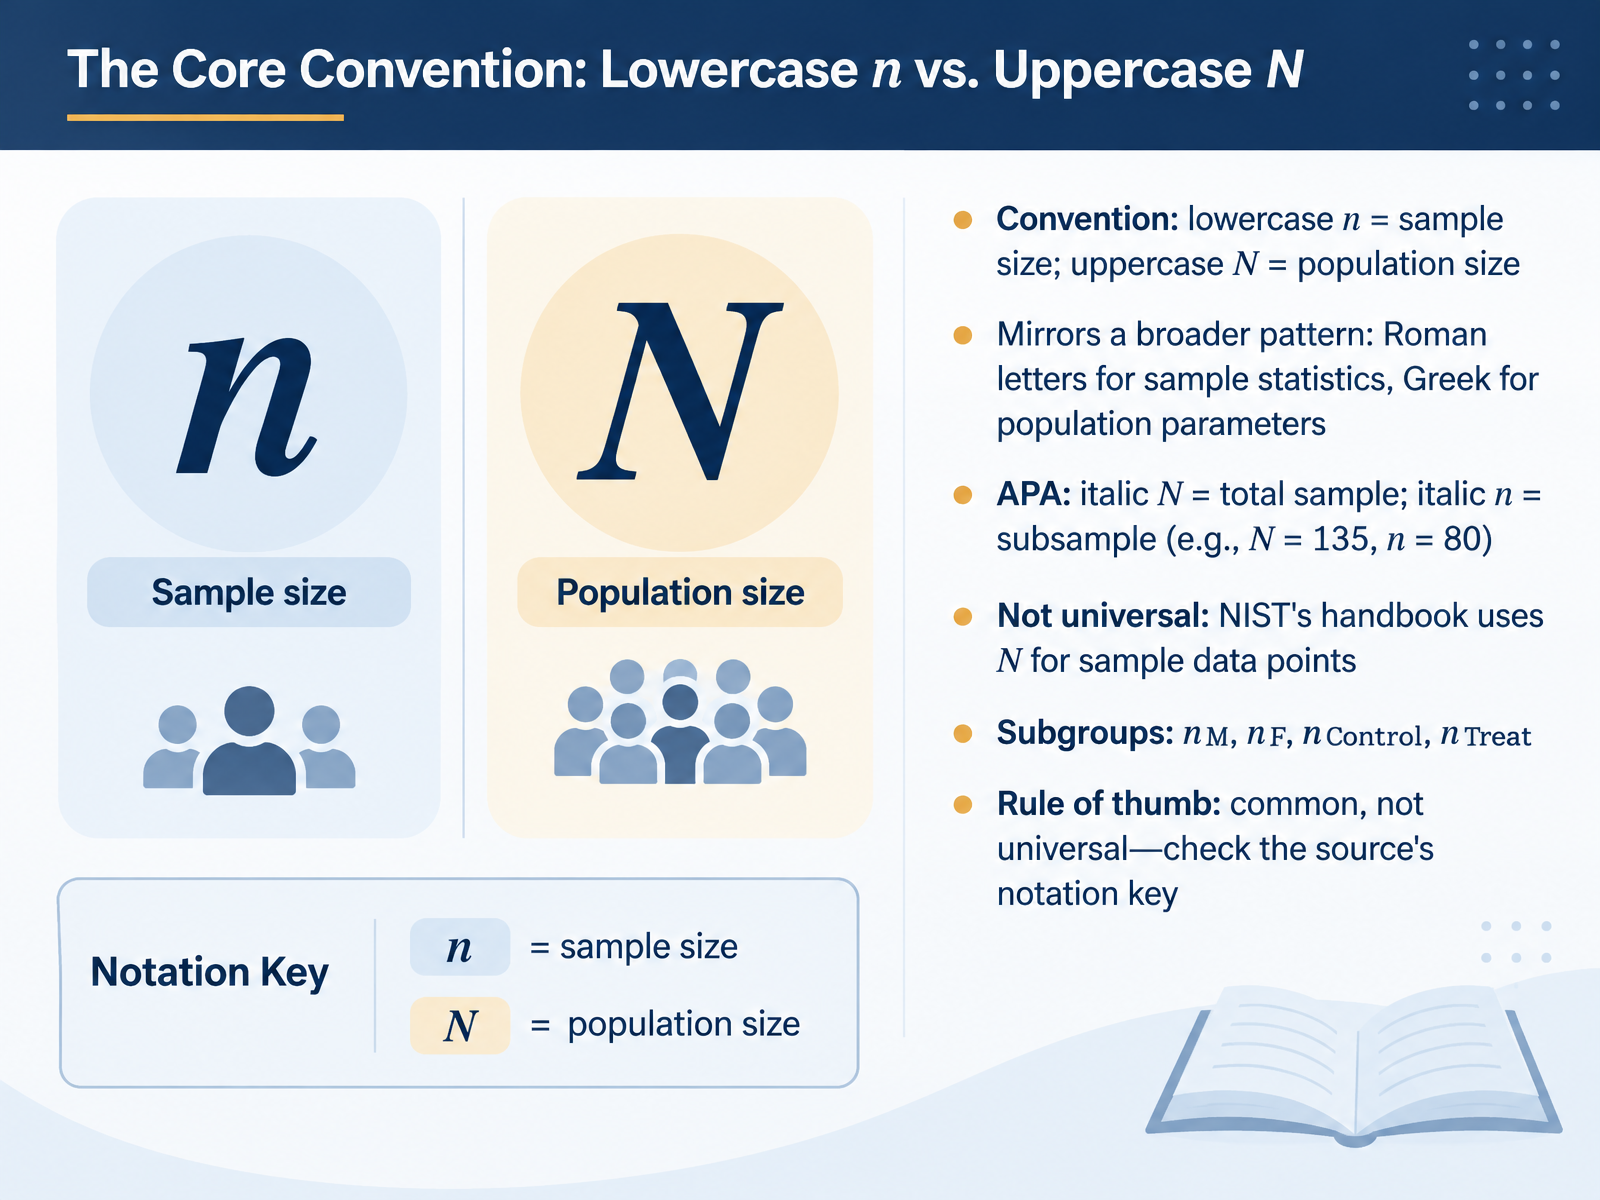
- 02The Core Convention: Lowercase n vs. Uppercase NLet's now look at the core convention. In most statistics sources, a lowercase n means sample size, and an uppercase N means population size. This mirrors a broader pattern you will see again: Roman letters usually stand for sample statistics, while Greek letters stand for population parameters. The American Psychological Association style follows this closely. It uses an italic uppercase N for the total sample, and an italic lowercase n for a subsample. So N equals 135 tells you the whole study had 135 participants. And n equals 80 might tell you how many were in the treatment group. For subgroups, subscripts are common. You might see n subscript M for males, n subscript F for females, or n subscript Control and n subscript Treat. One caution: this rule is common, but it is not universal. The National Institute of Standards and Technology handbook, for example, uses uppercase N for the number of data points in a sample. So always check the source's notation key before you interpret a number. With that foundation set, let's move on to population, sample, and the sampling frame.
 stats.stackexchange.comstatlit.orgdoi.org+22 min
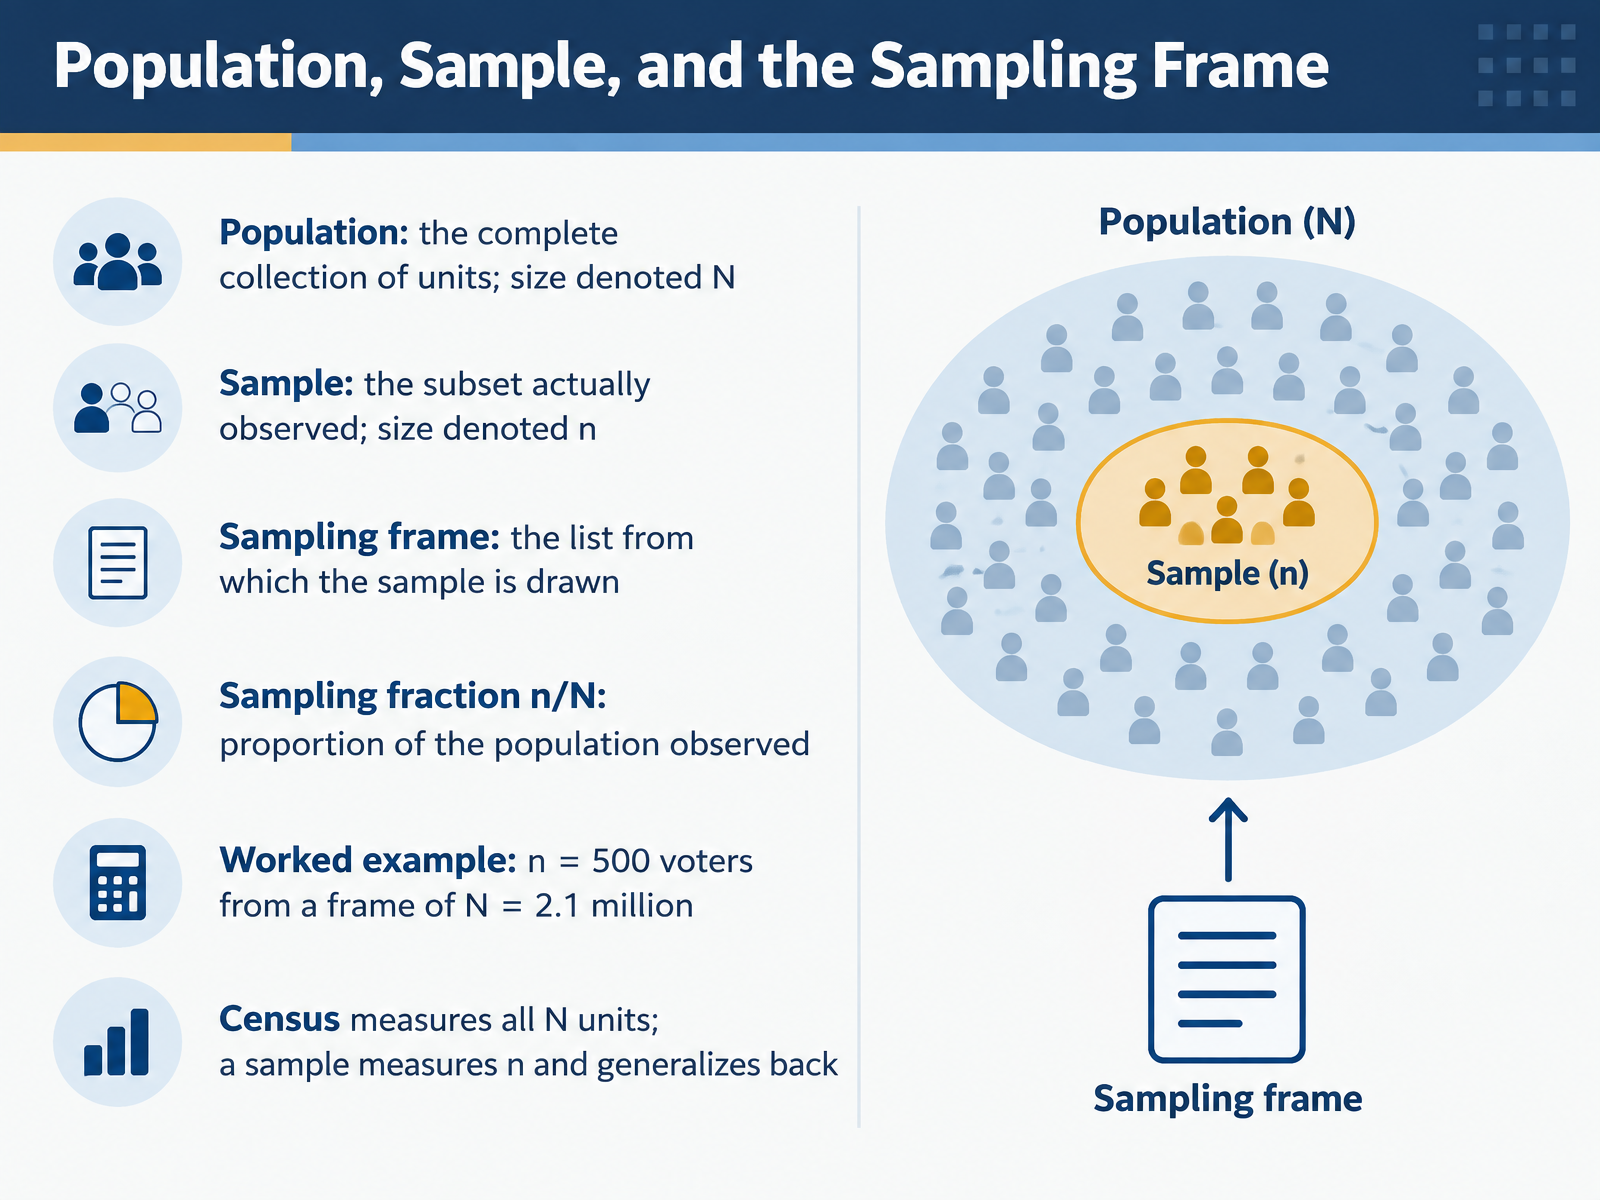
- 03Population, Sample, and the Sampling FrameNow let's connect the notation to real study design. The population is the complete collection of units you care about, and its size is written with a capital N. The sample is the subset you actually observe, and its size is written with a lowercase n. The sampling frame is the list you draw that sample from, so a flawed frame means a flawed sample. The sampling fraction is n divided by N, the proportion of the population you observe. Suppose you poll five hundred voters from a frame of two point one million. Your n is five hundred, your capital N is two point one million, and the sampling fraction is about zero point zero two four percent. A census measures every one of the N units. A sample measures n units and generalizes back to the population. Next, we look at other common meanings of N across contexts.
 faculty.ksu.edu.saimai.fas.harvard.edusfu.ca+22 min
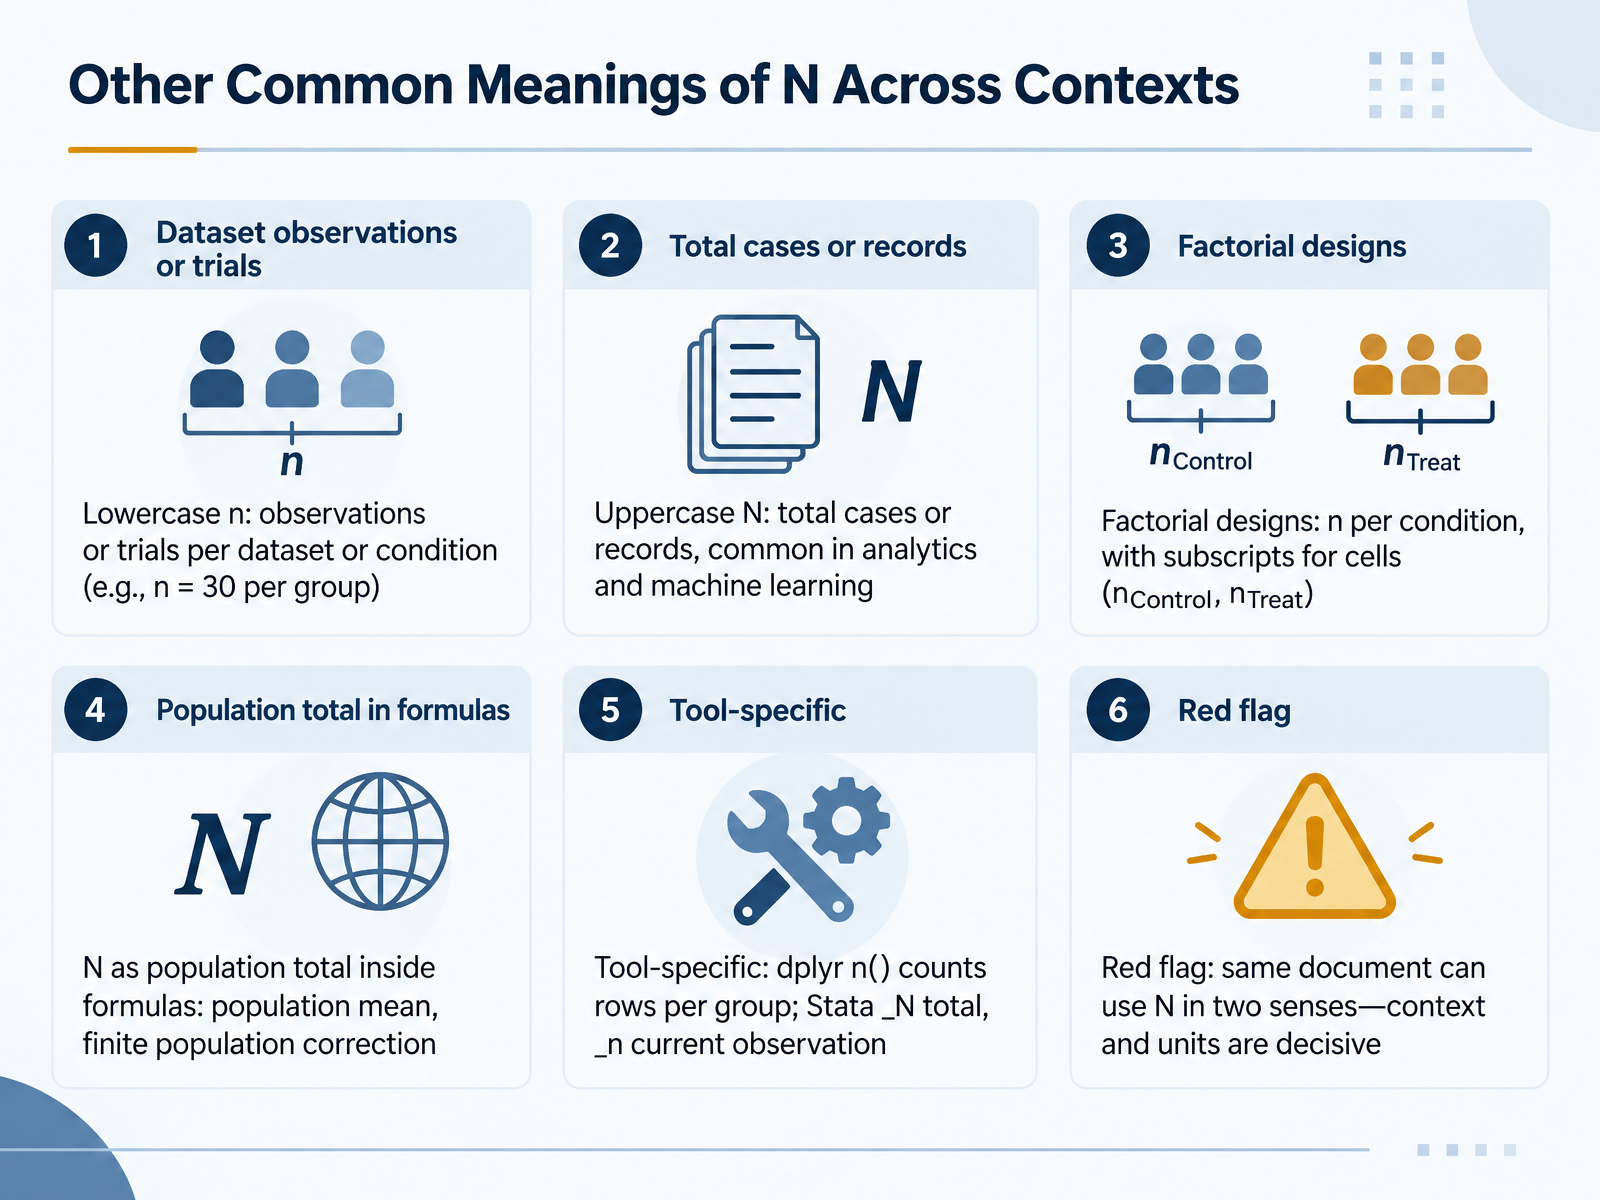
- 04Other Common Meanings of N Across ContextsNow let's look at how N shifts meaning across different contexts. Lowercase n usually refers to observations or trials within one dataset or condition. For example, n equals thirty per group. Uppercase N often means the total number of cases or records, which is common in analytics and machine learning. In factorial designs, you'll see n per condition, with subscripts for cells, like n Control or n Treat. In formulas, capital N can also mean the population total, as in the population mean or the finite population correction. And tools have their own conventions. In dplyr, n parentheses counts rows per group. In Stata, underscore capital N gives the total number of observations, while underscore lowercase n gives the current observation number. Here's the red flag. The same document can use N in two senses, so always check the context and units before you interpret it. Next, we'll explore N in descriptive statistics and formulas.
 datawithr.comtstats-project.orgmichael-franke.github.io+21 min
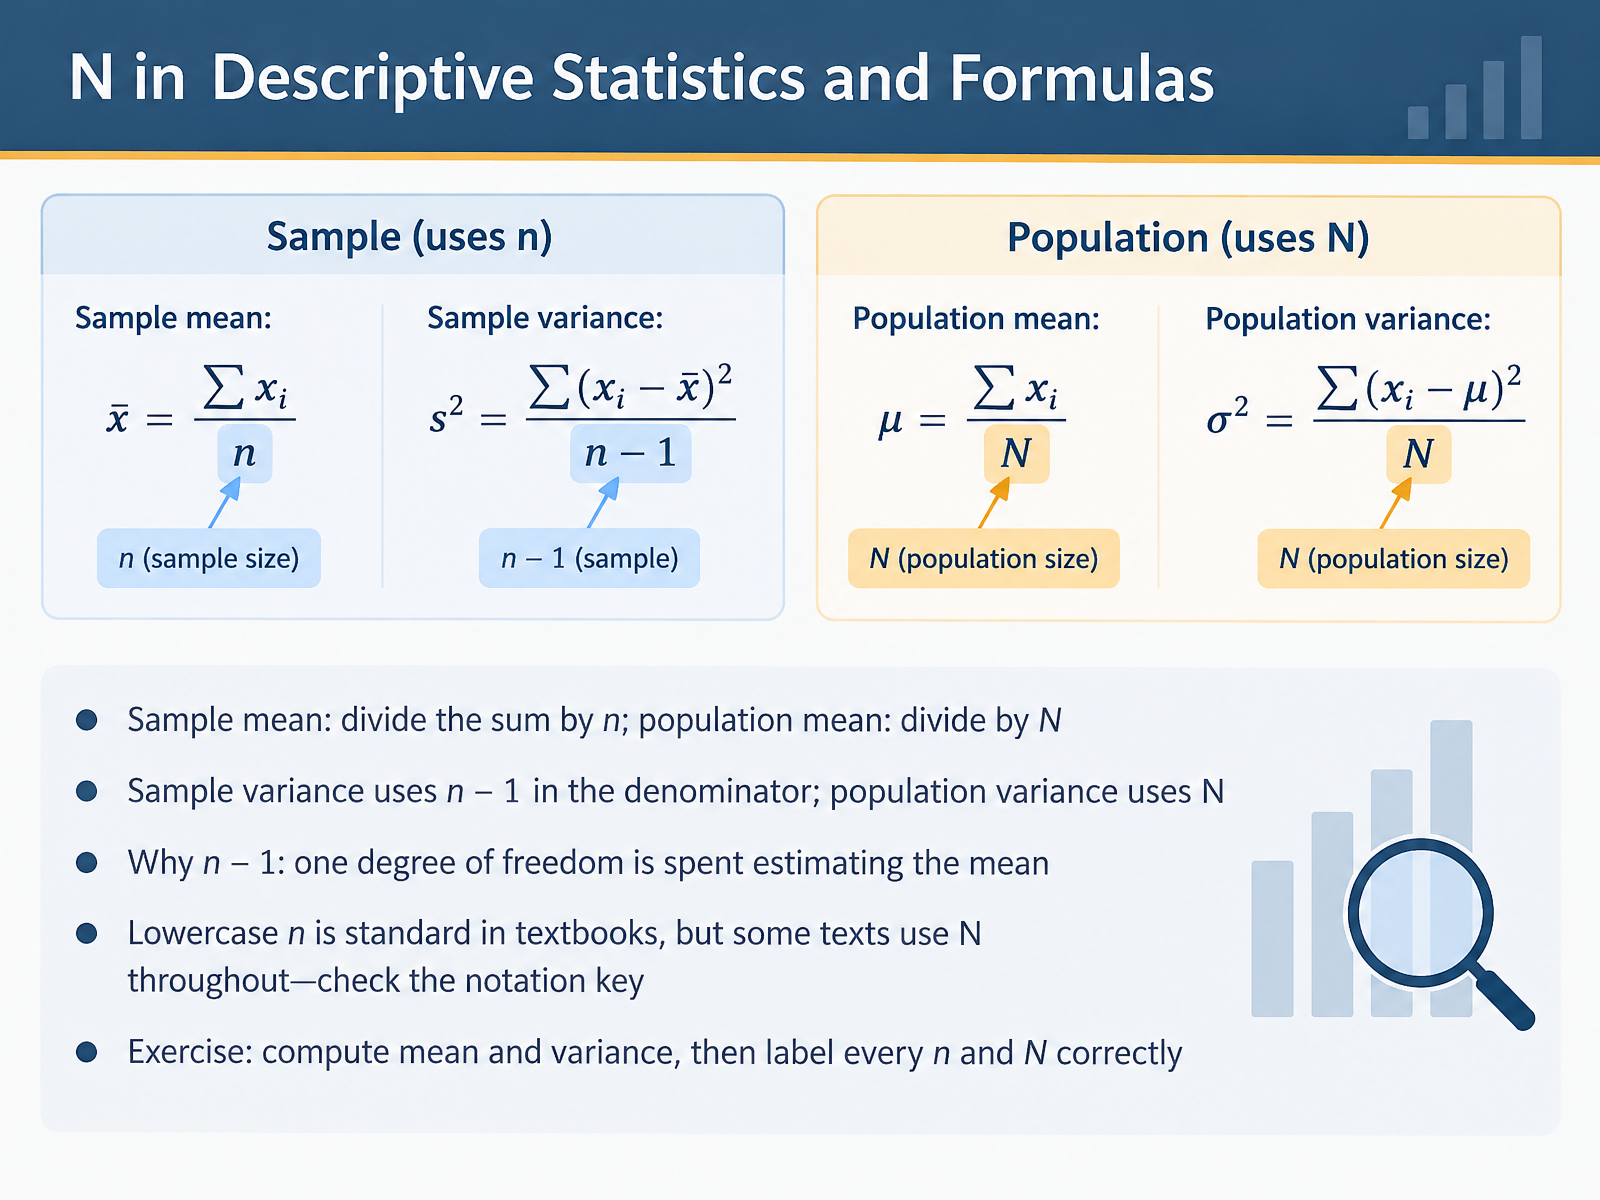
- 05N in Descriptive Statistics and FormulasNow let's see how n and capital N show up in actual formulas. For a sample mean, you add up the values and divide by lowercase n, the sample size. For a population mean, you divide by capital N, the population size. Variance follows the same pattern. Sample variance uses n minus one in the denominator. Population variance uses capital N. Why n minus one? Because computing the sample mean uses up one degree of freedom, one piece of information, so you divide by n minus one to keep the estimate unbiased. And remember, some textbooks use capital N throughout. Always check the notation key. Here's your exercise: compute a mean and a variance, then label every n and N correctly. Next, we look at how n drives precision, through standard error and confidence intervals.
 stats.stackexchange.comstatlit.orgdoi.org+21 min
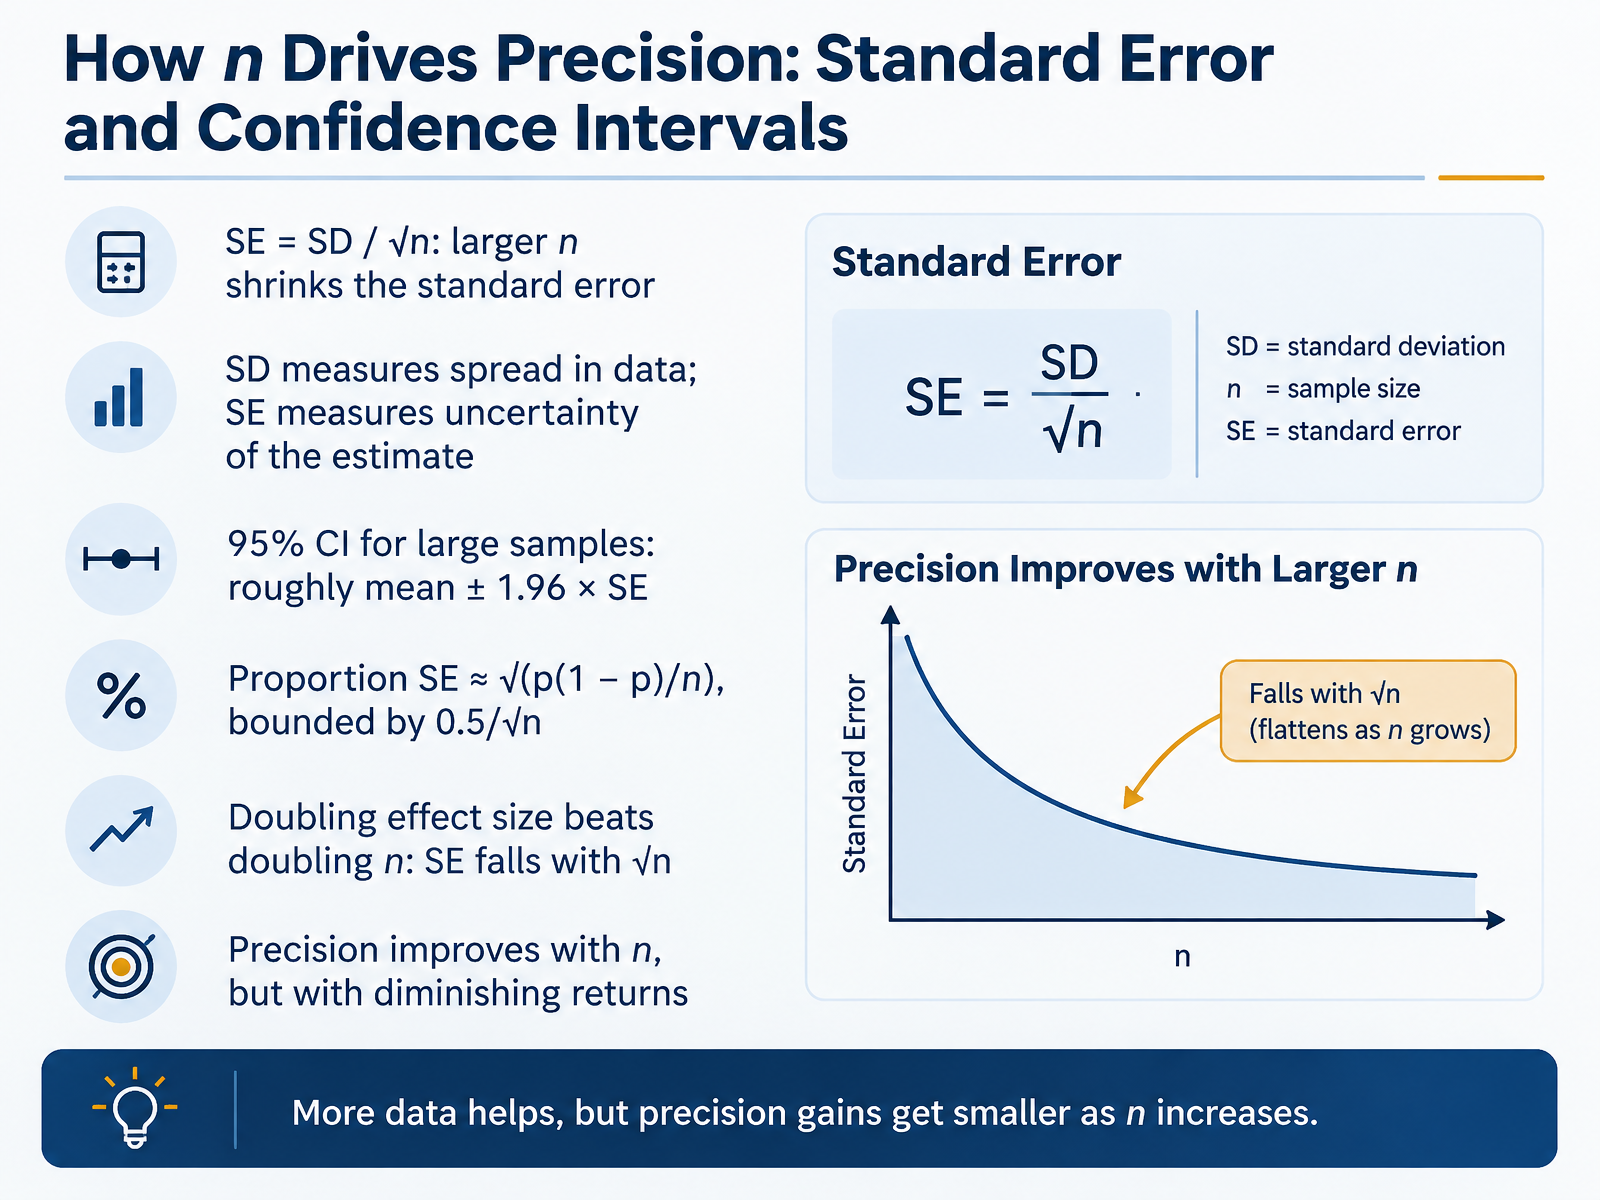
- 06How n Drives Precision: Standard Error and Confidence IntervalsNow let's look at how n drives precision. The standard error equals the standard deviation divided by the square root of n. So a larger n shrinks the standard error. Keep the two ideas separate. The standard deviation measures spread in your data. The standard error measures uncertainty in your estimate. For a large sample, a ninety-five percent confidence interval is roughly the mean plus or minus one point nine six times the standard error. For a proportion, the standard error is approximately the square root of p times one minus p, divided by n. It is bounded by zero point five divided by the square root of n. Here is a practical point. If you can, doubling the effect size beats doubling n, because the standard error falls with the square root of n. So precision improves with n, but with diminishing returns. Next, we turn to N in hypothesis testing and power analysis.
 bmj.comncbi.nlm.nih.govstatmodeling.stat.columbia.edu+22 min
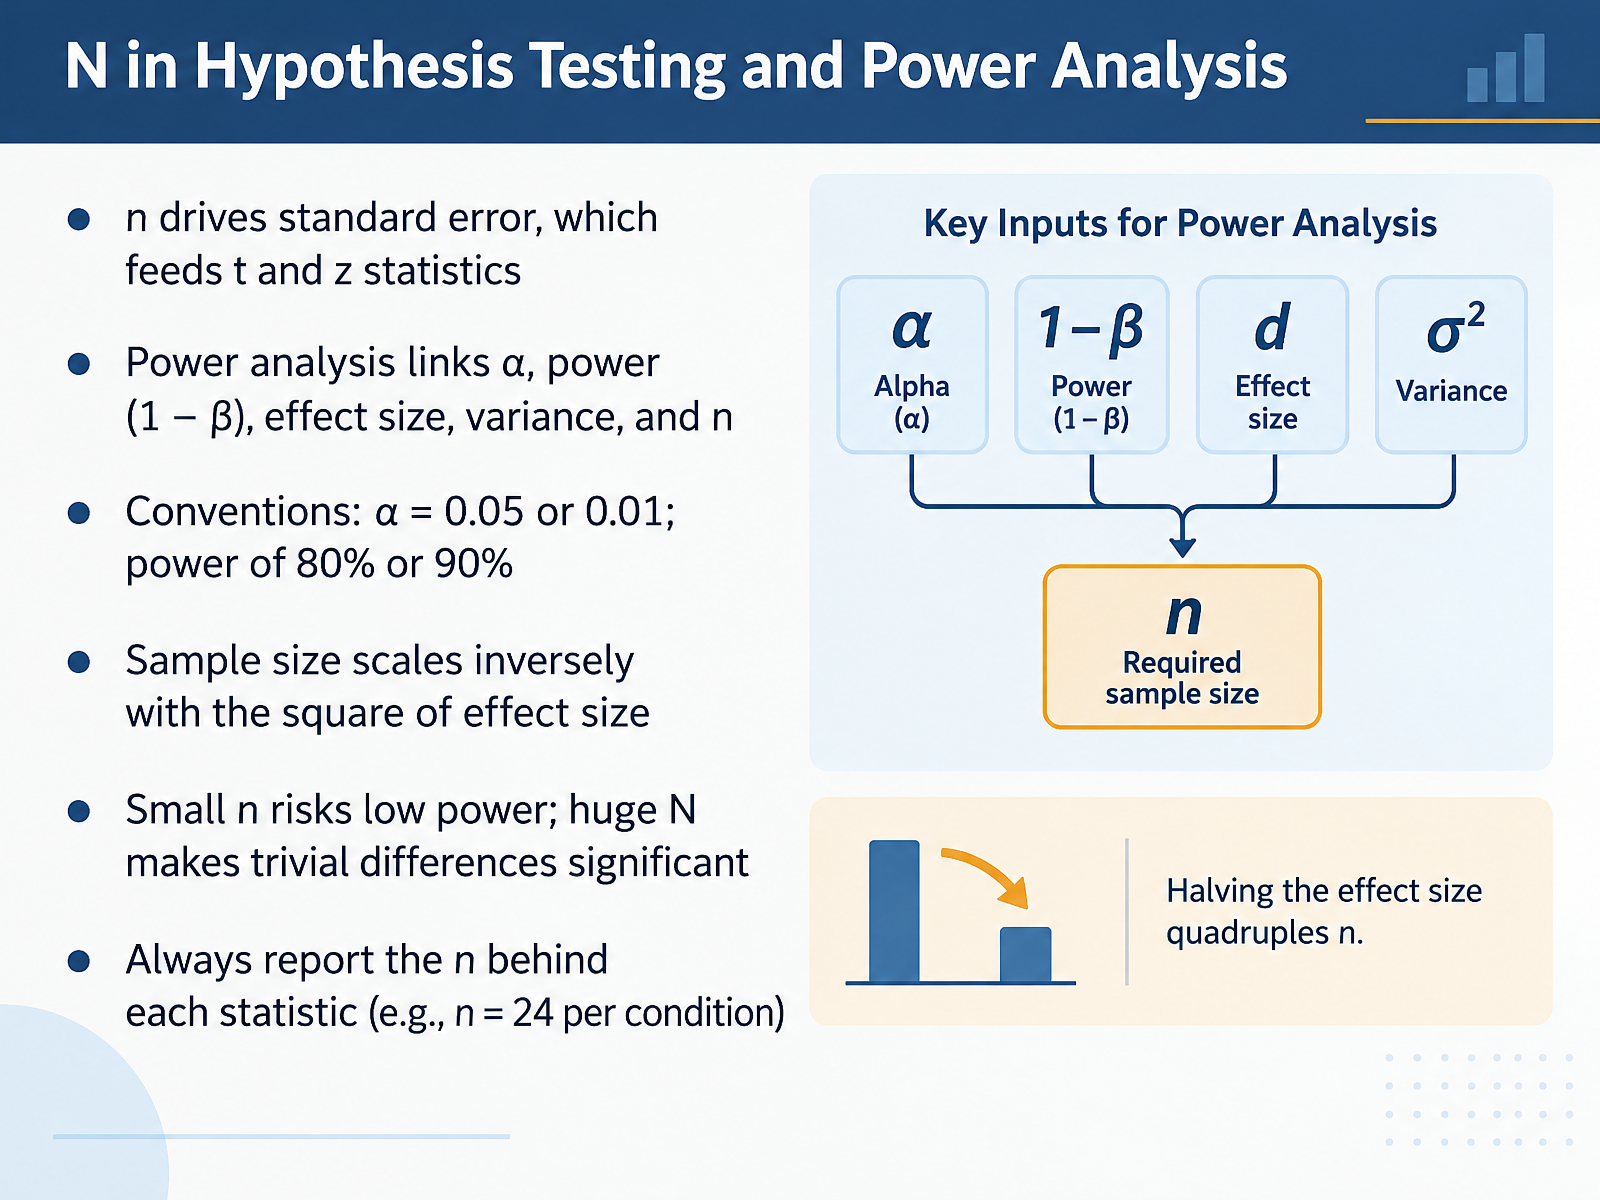
- 07N in Hypothesis Testing and Power AnalysisNow let's connect n to hypothesis testing and power. Sample size drives the standard error, and the standard error feeds your t and z statistics. A larger n shrinks the standard error, so real differences stand out more clearly. Power analysis ties five things together: alpha, power, effect size, variance, and n. Common conventions are an alpha of zero point zero five or zero point zero one, and power of eighty or ninety percent. Here is a rule worth remembering. Sample size scales inversely with the square of the effect size. So if you halve the effect you want to detect, you need roughly four times the sample. Small n risks low power, meaning you may miss a real effect. Huge N makes even trivial differences significant, so practical meaning matters. Finally, always report the n behind each statistic, for example n equals twenty four per condition. Next, we look at effective N, covering missing data, weighting, and clustering.
 bmj.comncbi.nlm.nih.govstatmodeling.stat.columbia.edu+22 min
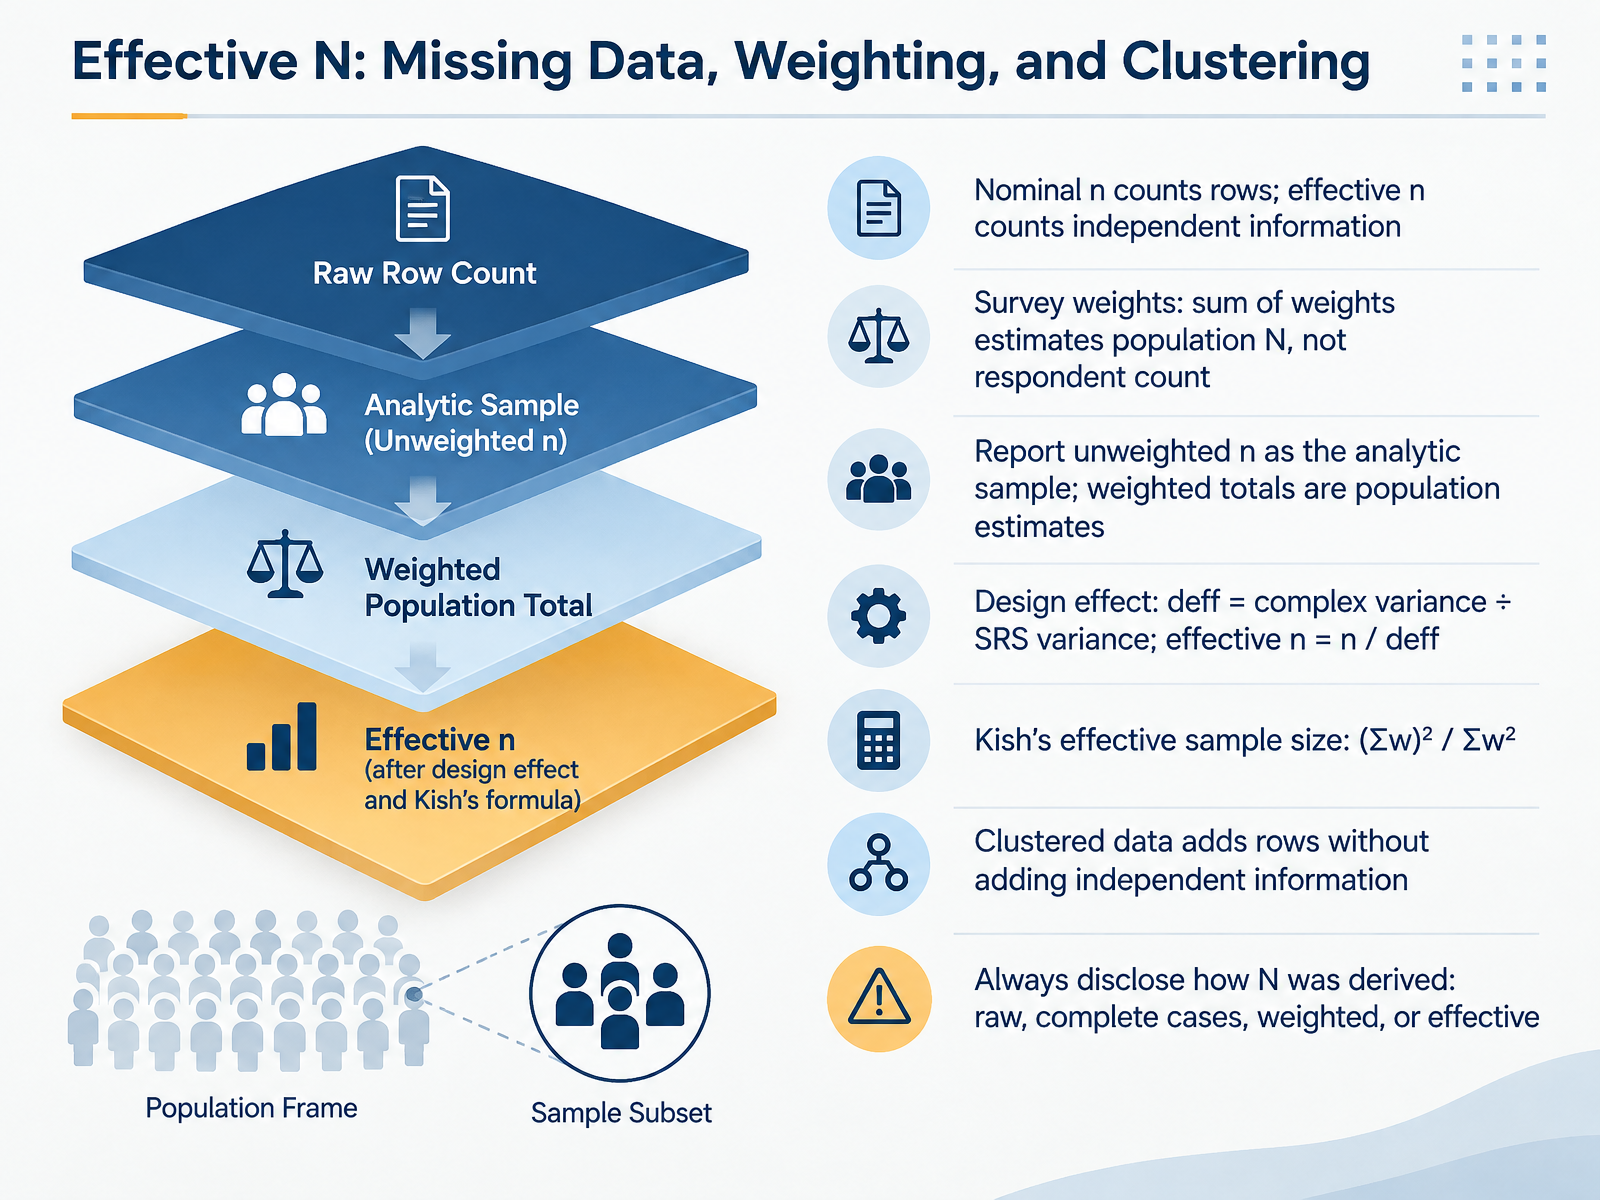
- 08Effective N: Missing Data, Weighting, and ClusteringNow let's look at effective N. Nominal n simply counts rows in your dataset. Effective n counts the independent information those rows actually carry, and those two numbers can be very different. With survey weights, the sum of the weights estimates the population total, not your respondent count. So report the unweighted n as your analytic sample, and treat weighted totals as population estimates. One common measure is the design effect: complex variance divided by simple random sample variance. Effective n is then n divided by that design effect. Kish's effective sample size is the sum of the weights, squared, divided by the sum of the squared weights. And remember that clustered data adds rows without adding independent information. Always disclose how your N was derived: raw rows, complete cases, weighted, or effective. Next, we turn to notation across fields: statistics, data science, and AI.
 faculty.ksu.edu.saimai.fas.harvard.edusfu.ca+22 min
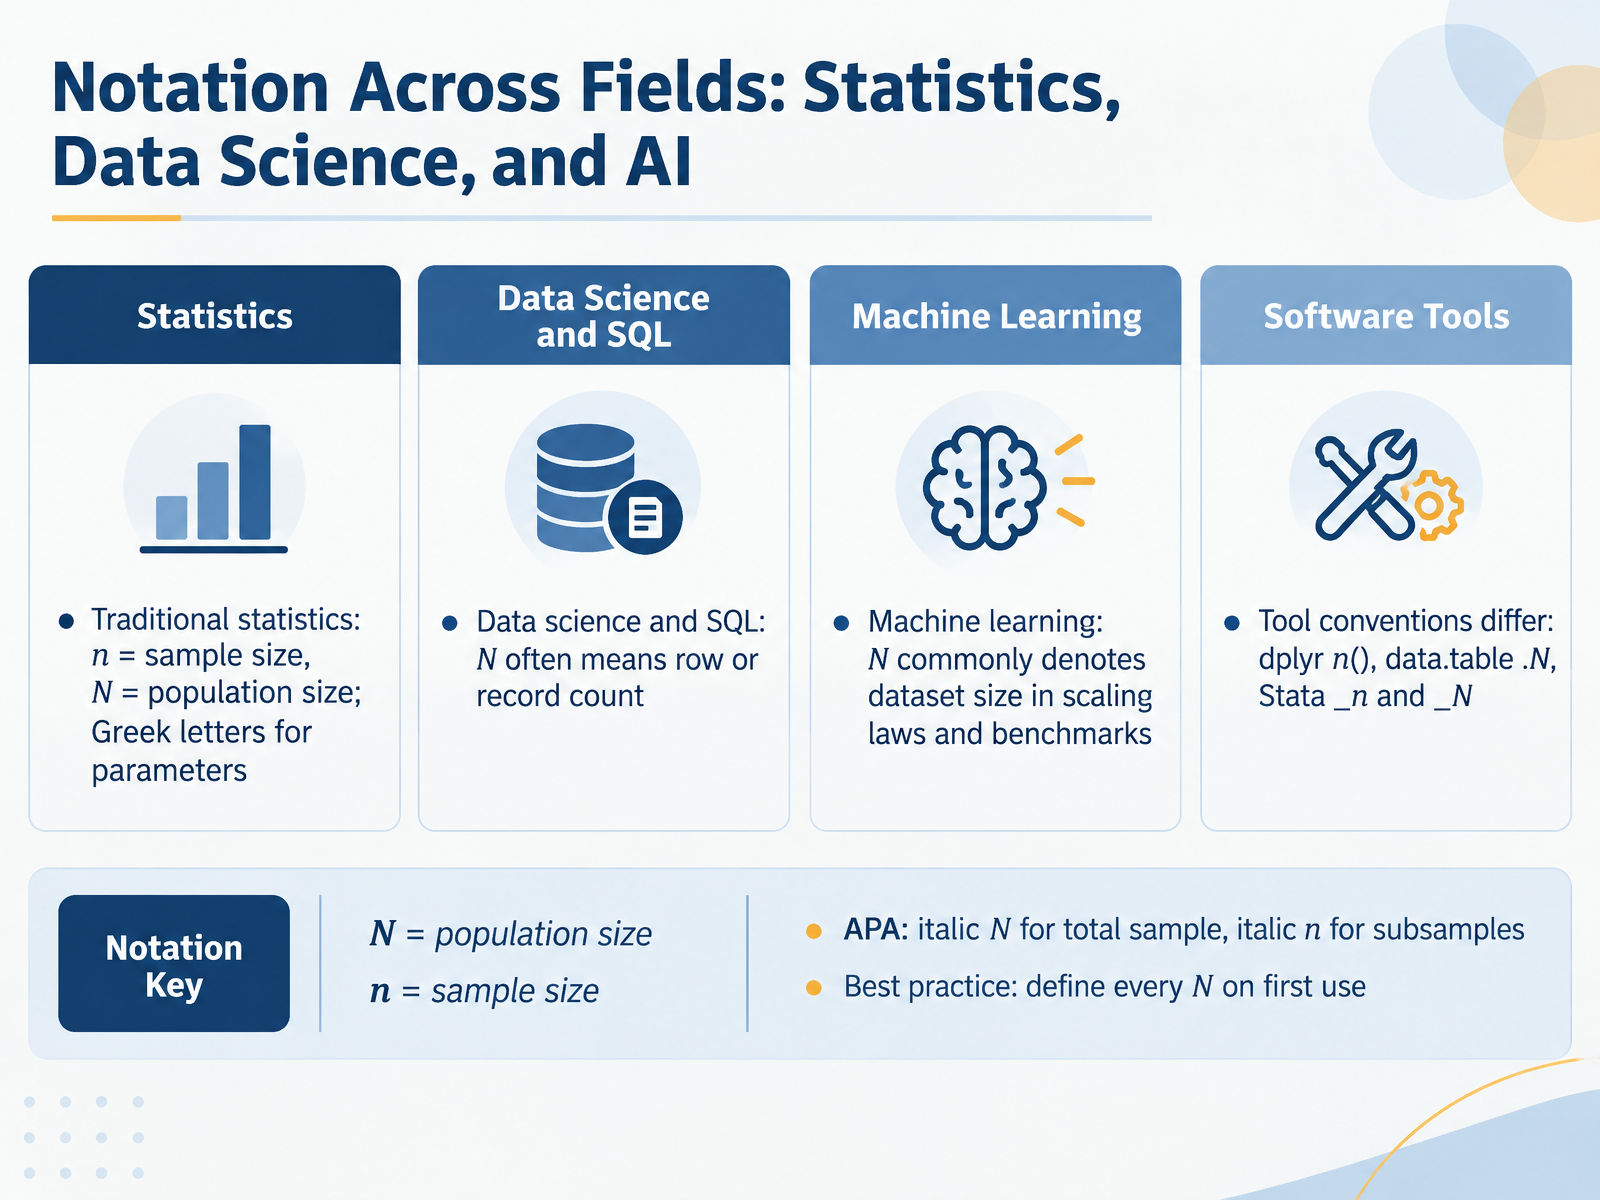
- 09Notation Across Fields: Statistics, Data Science, and AILet's talk about notation across fields. In traditional statistics, lowercase n means sample size, and uppercase N means population size. Greek letters, like mu, denote population parameters. In data science and SQL, N often just means a row or record count. In machine learning, N commonly denotes dataset size, especially in scaling laws and benchmarks. Tool conventions differ too. In dplyr, n() counts rows in a group. In data.table, dot N does the same. In Stata, underscore n is the current observation number, while underscore N is the total number of observations. If you follow APA style, use an italic uppercase N for the total sample, and an italic lowercase n for a subsample, such as one treatment group. The best practice is simple. Define every N on first use. That single habit prevents most confusion. Next, we will look at common mistakes and a review checklist.
 stats.stackexchange.comstatlit.orgdoi.org+22 min
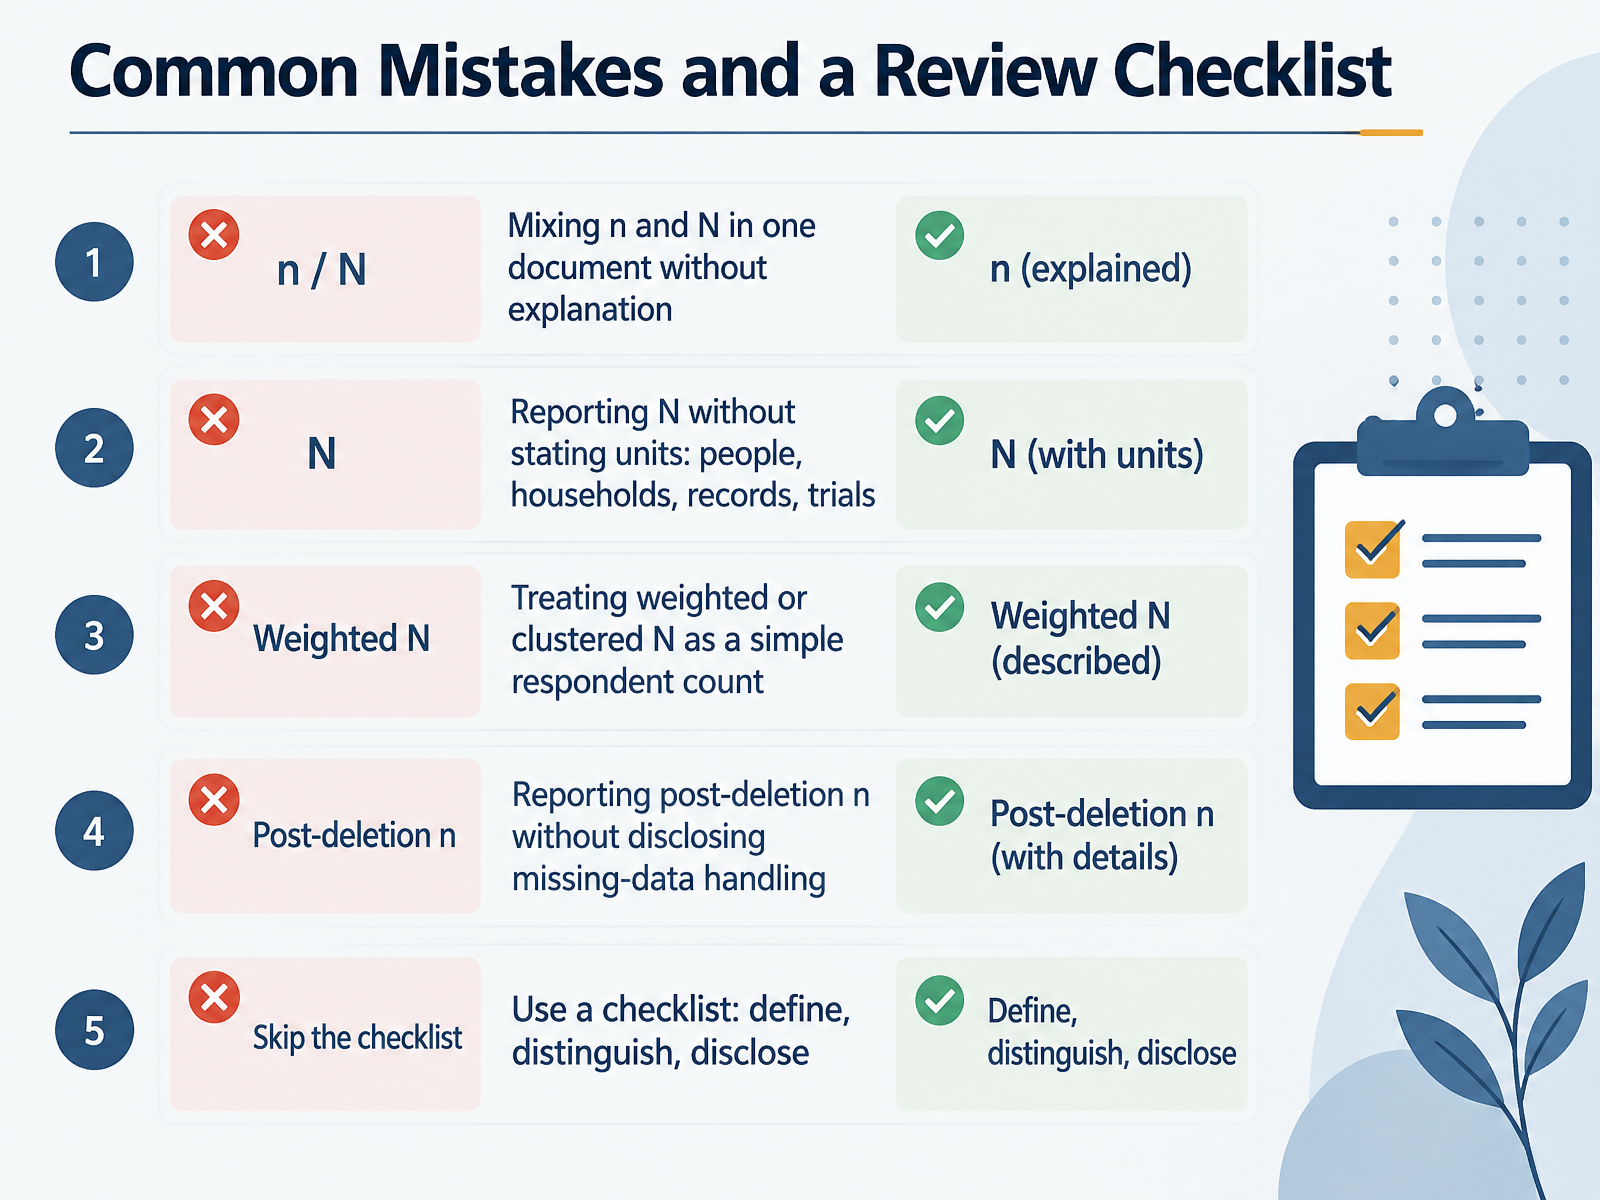
- 10Common Mistakes and a Review ChecklistNow let's look at common mistakes, and give you a checklist you can use every time. First, mixing lowercase n and uppercase N in one document without explanation. Pick a convention, state it once, and stick to it. Second, reporting N without stating the unit. Is it people, households, records, or trials? Your reader cannot tell, so always name it. Third, treating a weighted or clustered N as a simple respondent count. With survey data, the unweighted n is the analytic sample, and the weighted figure is a population estimate, not a count of respondents. Also remember that clustering and unequal weights can reduce the effective sample size, so the precision can be lower than the raw n suggests. Fourth, reporting the n after deleting missing cases without saying how you handled missingness. If you dropped or imputed cases, disclose it. Here is your checklist: define your terms, distinguish n from N, disclose your units and your missing-data handling, then review. That habit catches most errors before they reach your reader. Reading N Correctly in Real Documents is where we go next.
 stats.stackexchange.comstatlit.orgdoi.org+22 min
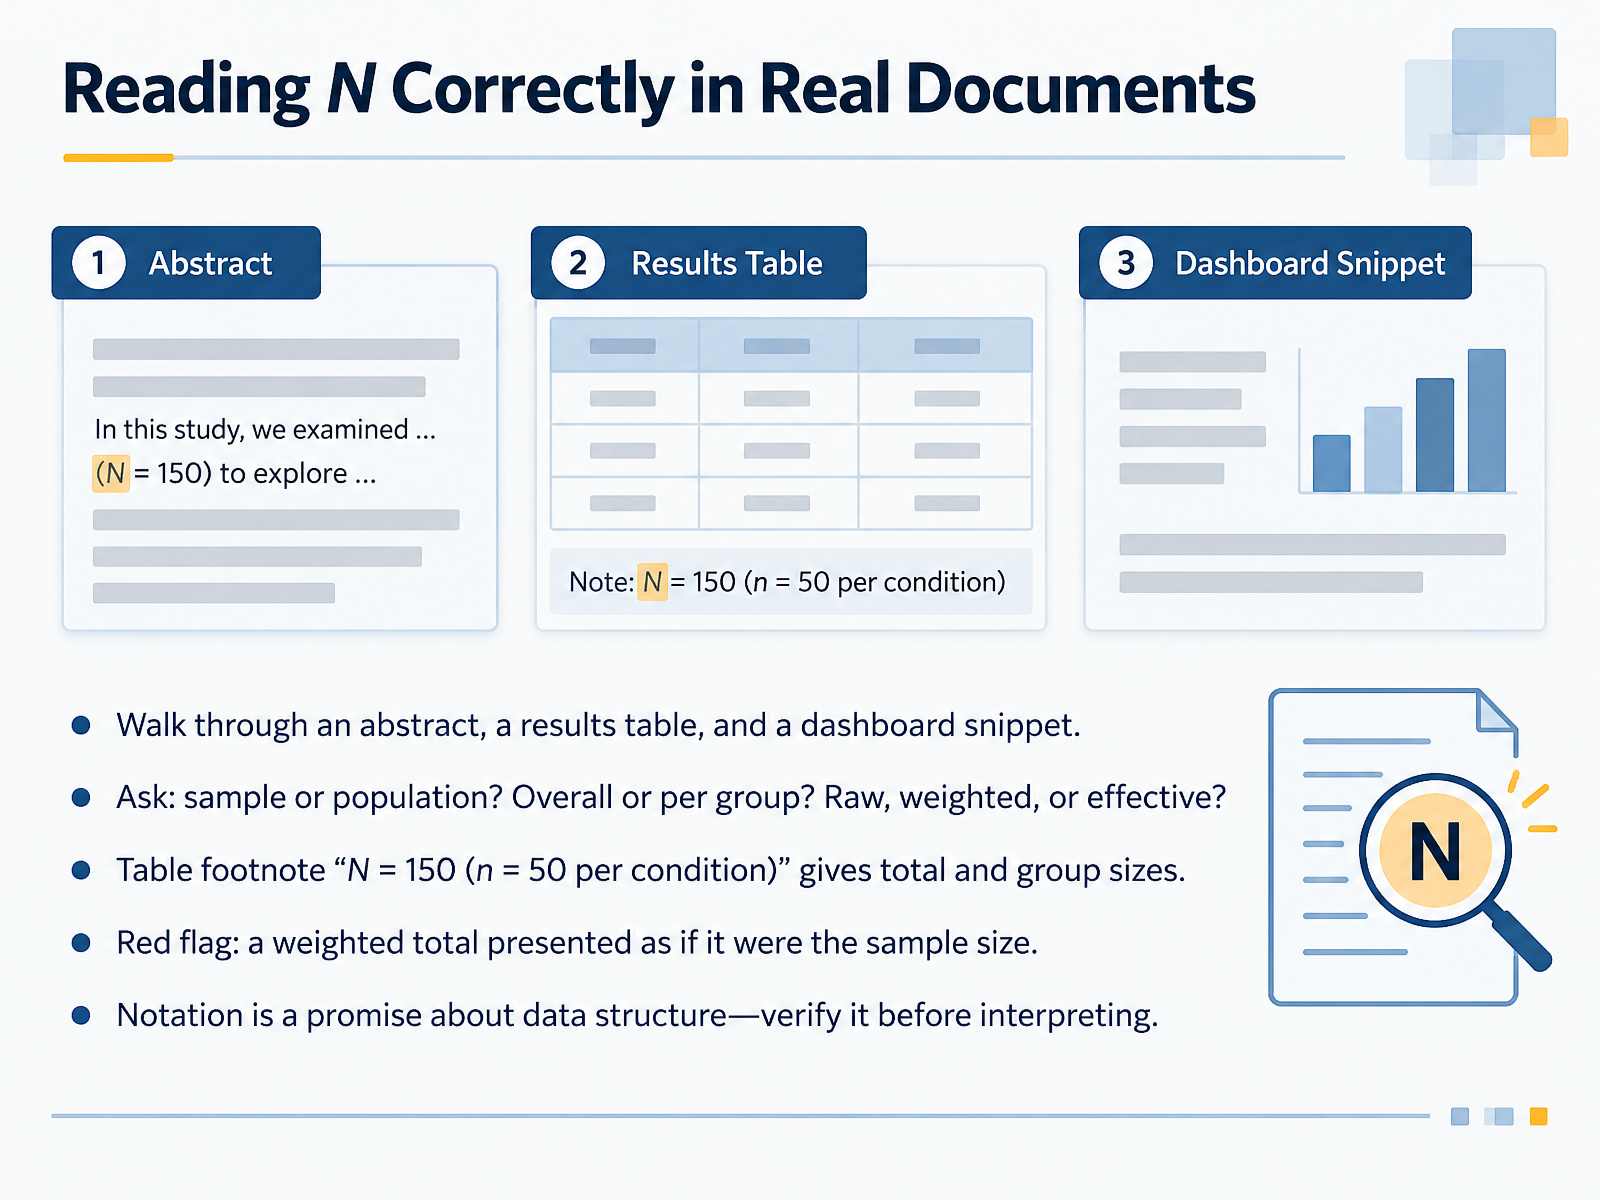
- 11Reading N Correctly in Real DocumentsLet's put this into practice with real documents. Imagine you open a paper and see an abstract, a results table, and a dashboard snippet. For each one, ask three quick questions. Is this a sample or a population? Is the number overall, or per group? And is it raw, weighted, or effective? Take a table footnote that reads N equals 150, with n equals 50 per condition. That tells you the total sample is 150, and each group has 50. Now watch for a red flag. A weighted total is sometimes presented as if it were the sample size. It is not. A weighted figure is a population estimate. So treat notation as a promise about data structure, and verify it before you interpret anything. Next, we'll write N into your own reports.
 stats.stackexchange.comstatlit.orgdoi.org+21 min
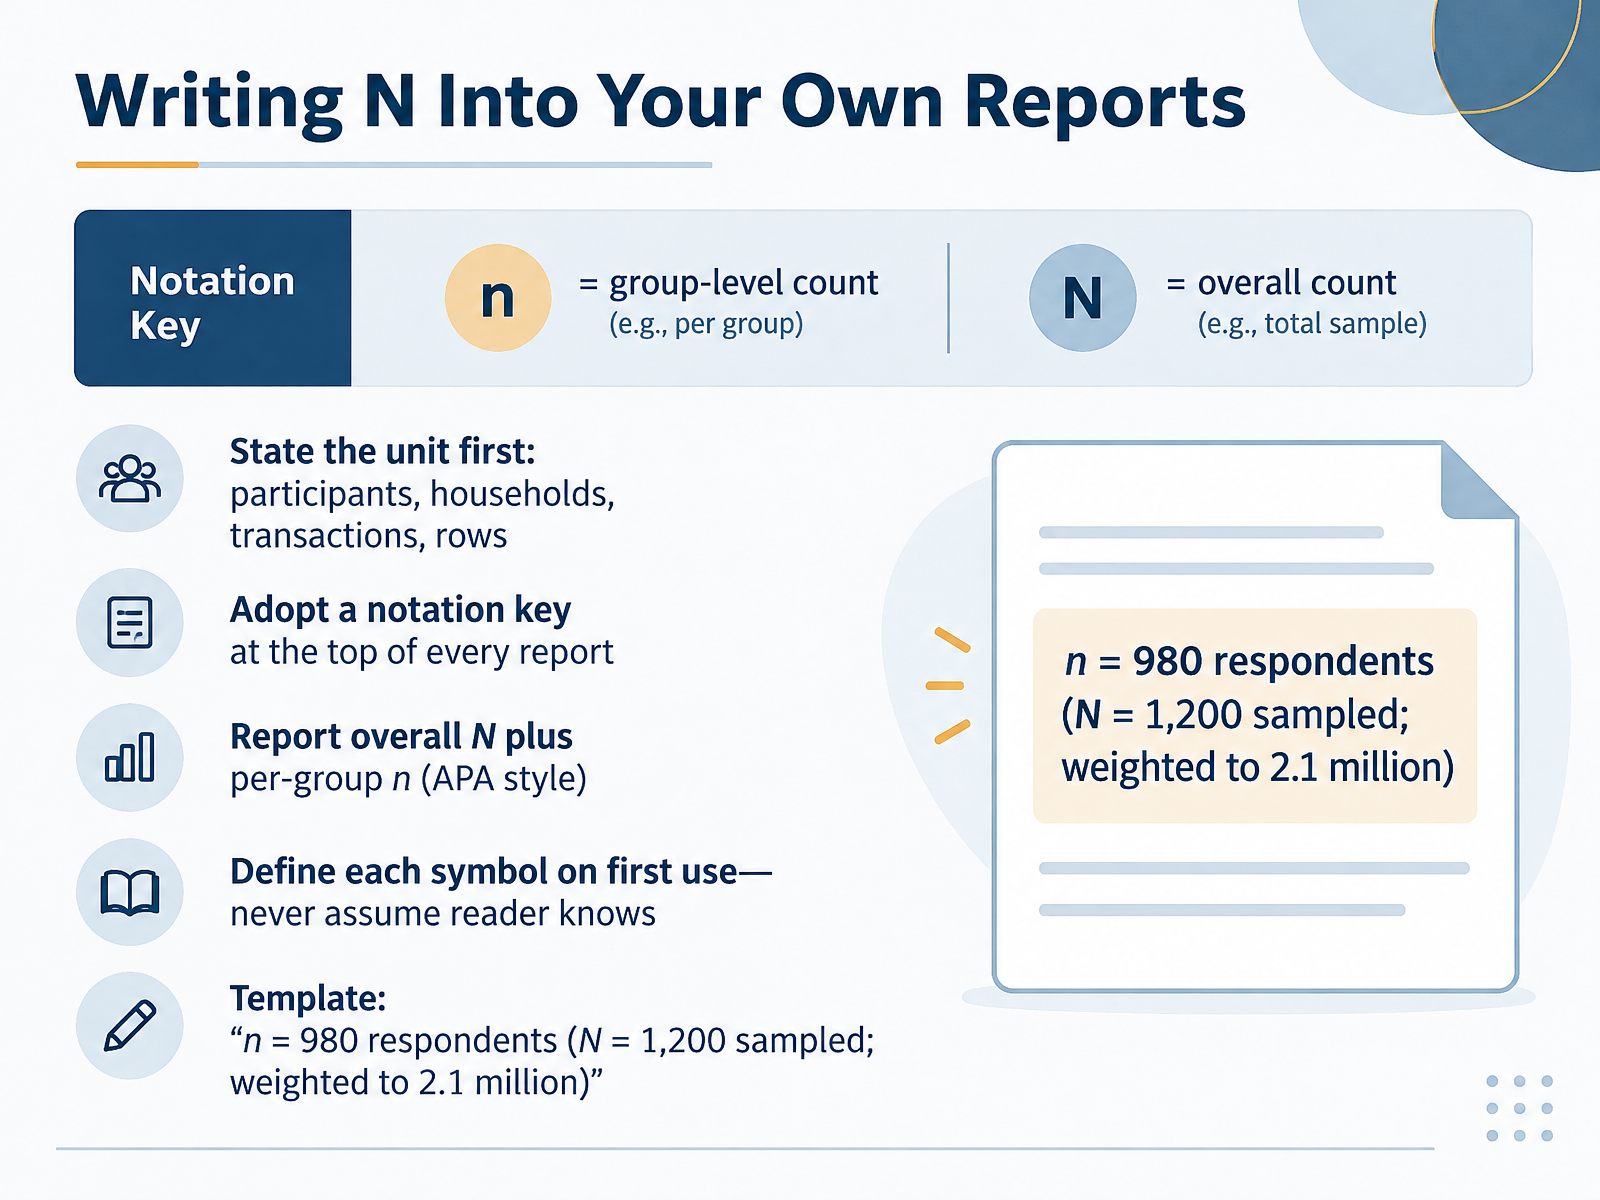
- 12Writing N Into Your Own ReportsNow that you understand the notation, let's put it to work in your own reports. Start by stating the unit first. Is n counting participants, households, transactions, or rows in a dataset? Say so explicitly. Next, adopt a notation key at the top of every report. Define each symbol on first use, and never assume your reader knows it. In APA style, you report the overall capital N and then the lowercase n for each group. For example, imagine a survey that sampled twelve hundred people and received nine hundred eighty responses. After weighting, those responses represent two point one million people. A clean sentence reads: n equals nine hundred eighty respondents, where capital N equals twelve hundred sampled, weighted to two point one million. Notice how the weights change the population estimate, not the sample size. Keep the unweighted n as your analytic sample. That one habit makes your reports clear, credible, and easy to review. Next, we'll look at a practice scenario with mismatched Ns.
 faculty.ksu.edu.saimai.fas.harvard.edusfu.ca+22 min
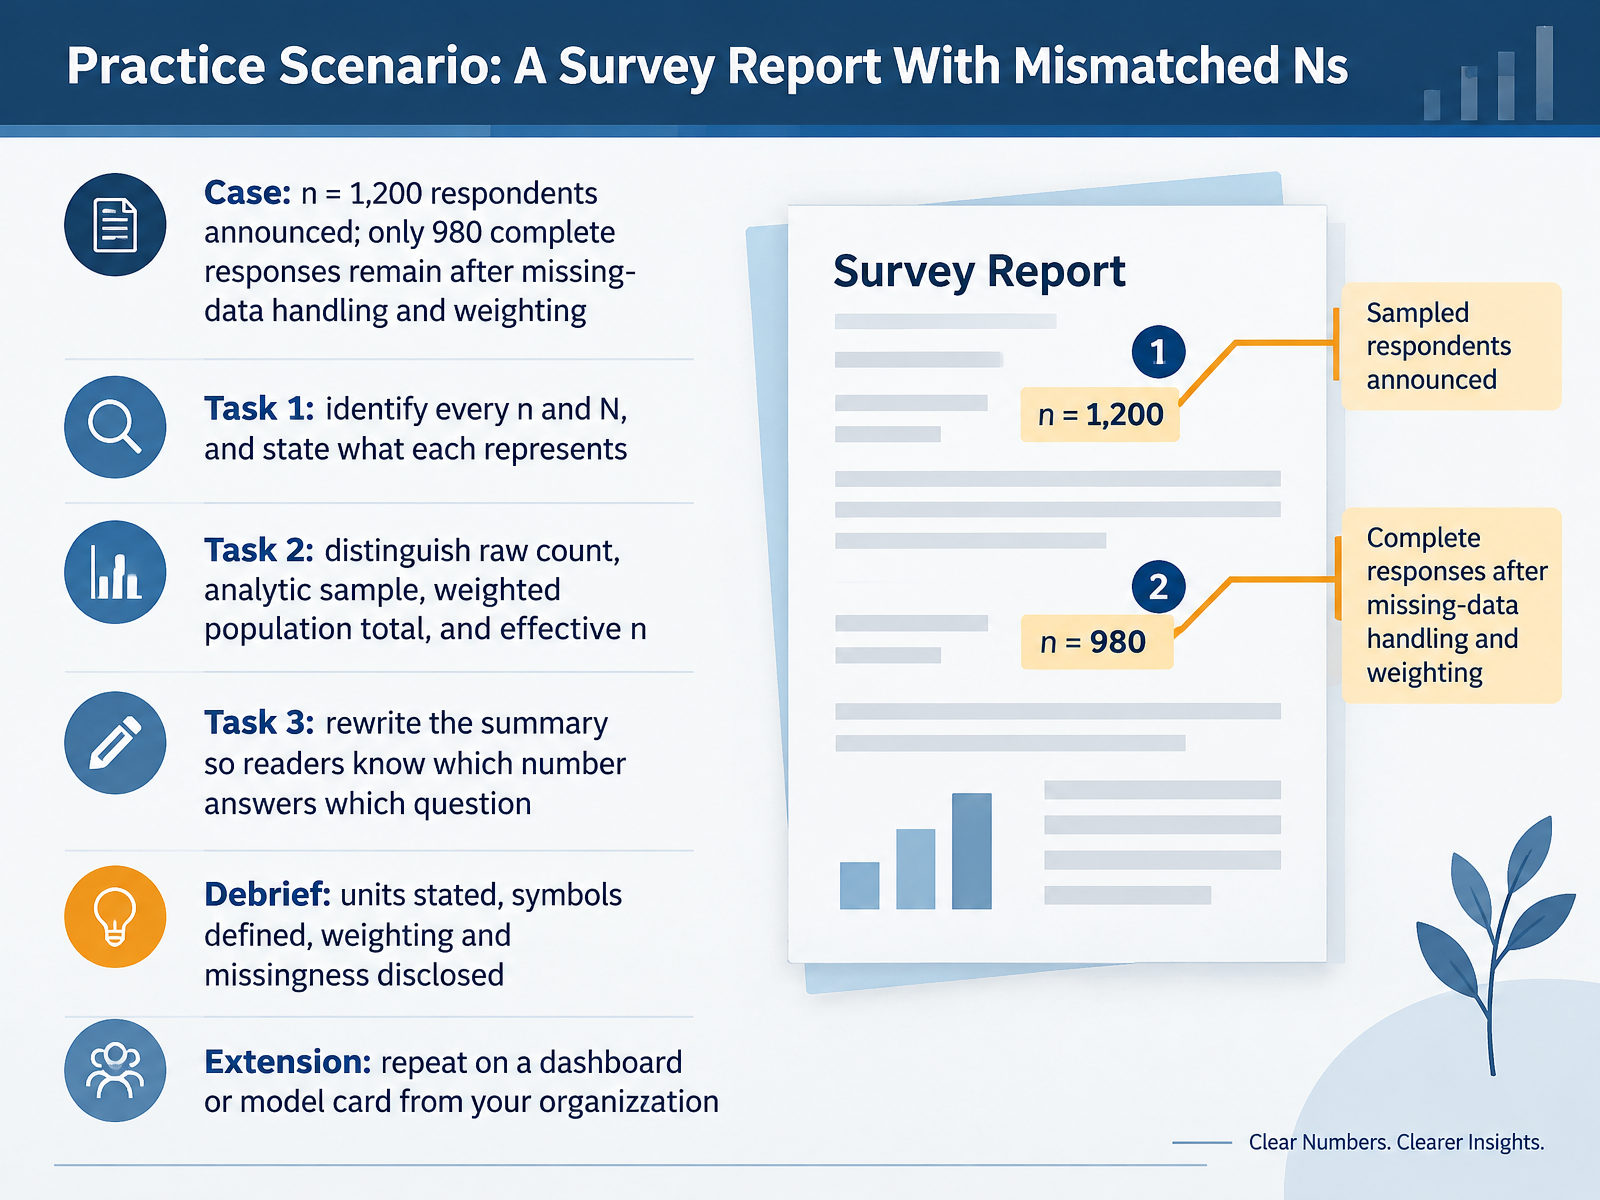
- 13Practice Scenario: A Survey Report With Mismatched NsLet's put this into practice with a survey scenario. A report announces n equals one thousand two hundred respondents. But after missing-data handling and weighting, only nine hundred eighty complete responses remain. First, identify every n and N, and state what each one represents. Second, separate four distinct ideas: the raw count, the analytic sample, the weighted population total, and the effective n. The analytic sample is your unweighted nine hundred eighty. The weighted total estimates how many people in the population those responses represent, so it is not a sample size. The effective n uses the design effect or Kish's formula, and it tells you how many independent observations your precision is actually worth. Third, rewrite the summary so readers know which number answers which question. In the debrief, state the units, define each symbol, and disclose how weighting and missingness were handled. For extension, repeat this audit on a dashboard or model card from your organization. Moving on, let's pull the key takeaways and action items together.
 faculty.ksu.edu.saimai.fas.harvard.edusfu.ca+22 min
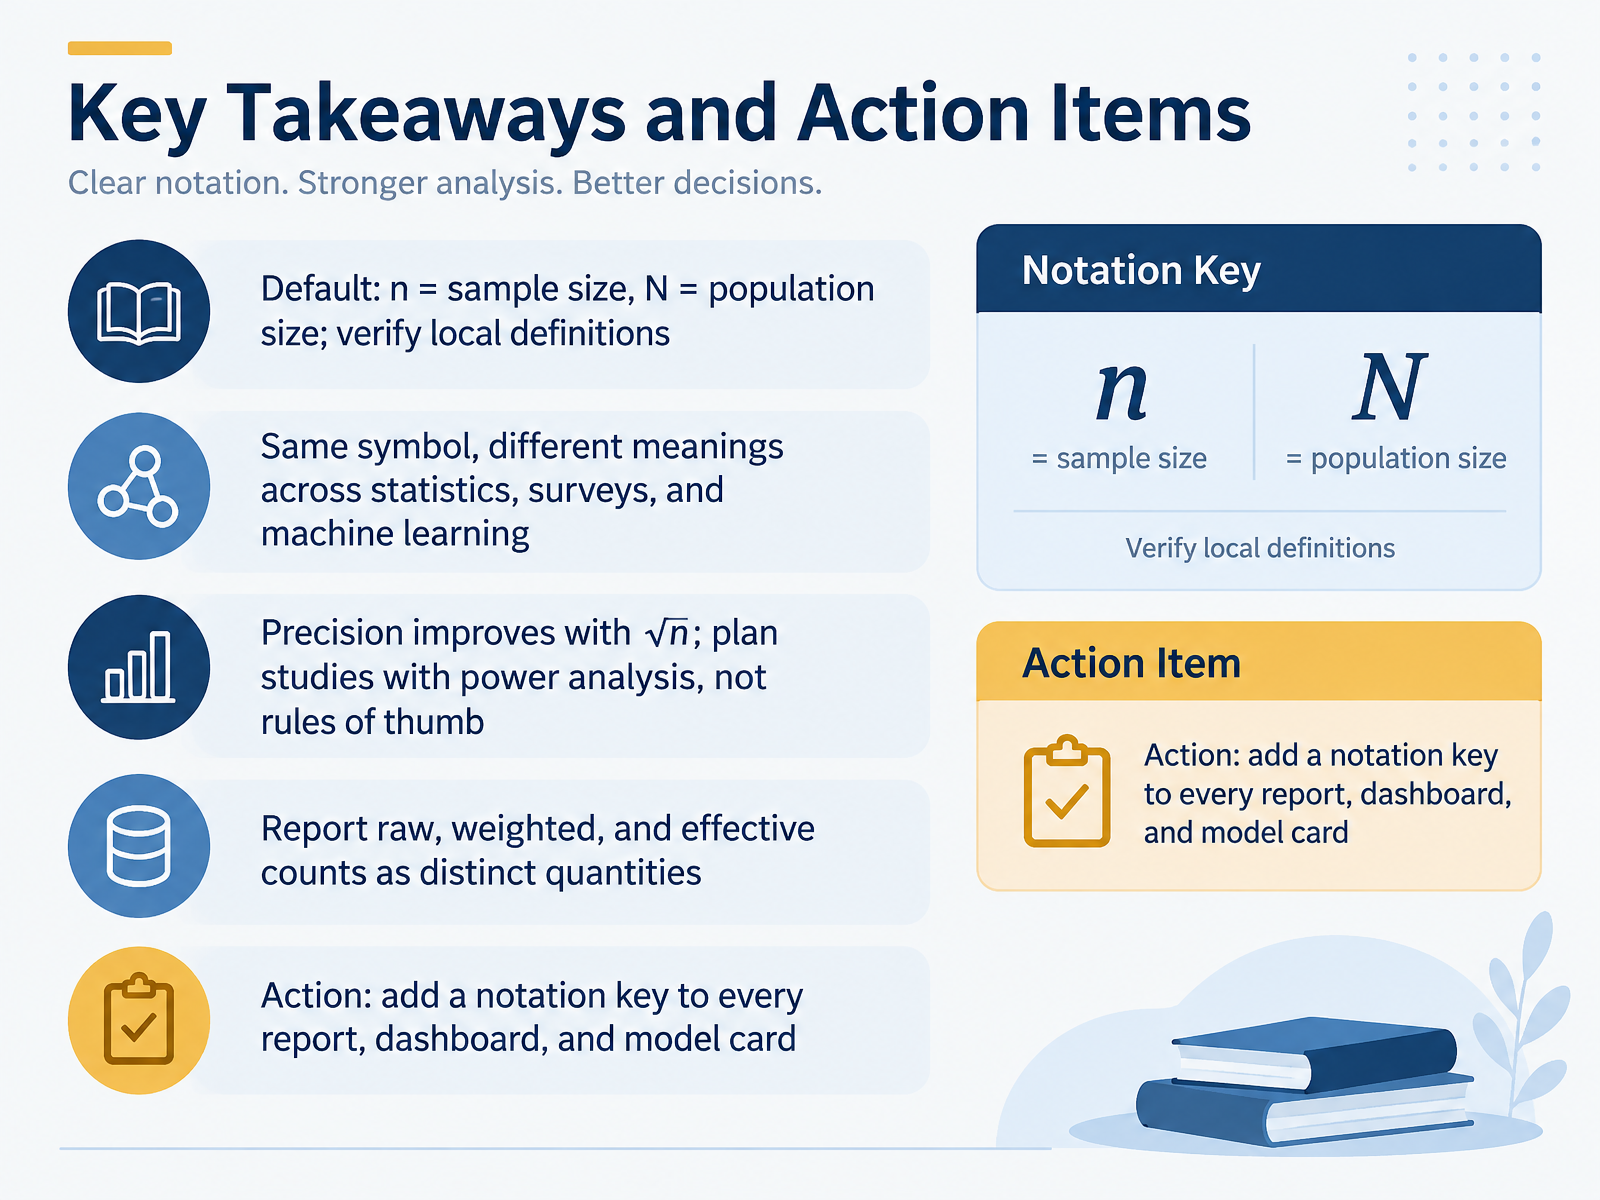
- 14Key Takeaways and Action ItemsLet's lock in the key takeaways. By default, lowercase n means sample size, and uppercase N means population size. But notation varies, so always verify how a source defines it. Remember that the same symbol can carry different meanings across statistics, surveys, and machine learning. Precision improves with the square root of n, so doubling your sample does not double your precision. Plan studies with a power analysis, not rules of thumb. And when you report, show raw, weighted, and effective counts as distinct quantities. Here is your action item. Add a short notation key to every report, dashboard, and model card you produce. That one habit prevents a lot of confusion. Thank you for working through this course with me. You now have a precise, practical grasp of n, so go use it with confidence.
 bmj.comncbi.nlm.nih.govstatmodeling.stat.columbia.edu+21 min
Take the deck with you
Download this course as a file — free, no sign-up needed.
- PDF handoutEvery slide page, ready to print or share.15 pages · 3.3 MBDownload
- Narrated PowerPointThe deck that presents itself — every slide carries the digital human's narration video.15 pages · 12.5 MBDownload
- PowerPoint slidesThe full deck as a .pptx — open it in PowerPoint, Keynote, or Google Slides.15 pages · 3.2 MBDownload
Free to use in your own training — please keep the PersonWise credit page at the end.
Have your own deck? Turn it into a course
Sources consulted
Web sources consulted while building this course.
- Sample notation: When to use capital $N$ vs lowercase $n$? — stats.stackexchange.com
- N (or n) vs. N - 1(or n - 1) re-visited — statlit.org
- Appendix A: Reviewing the Statistics behind the Research — doi.org
- Symbols used in this book — study.sagepub.com
- Notation in probability and statistics — en.wikipedia.org
- Elements of Survey Sampling — faculty.ksu.edu.sa
- Survey Sampling — imai.fas.harvard.edu
- Design Information for Survey Procedures — sfu.ca
- Chapter 10 Sample designs and replicate weights | Exploring Complex Survey Data Analysis Using R — tidy-survey-r.github.io
- 15 Observational : descriptive – Research Design in the Social Sciences — book.declaredesign.org
- 13 Grouping and summarizing data – Introduction to Data Analysis with R — datawithr.com
- T Function Reference - n — tstats-project.org
- 5.1 Counts and proportions | An Introduction to Data Analysis — michael-franke.github.io
- What does n=n( ) mean in R? — stackoverflow.com
- Counting from _n to _N — stats.oarc.ucla.edu
- Standard deviations and standard errors — bmj.com
- Statistical primer: sample size and power calculations—why, when and how? † — ncbi.nlm.nih.gov
- Design and sample size decisions — statmodeling.stat.columbia.edu
- Sample Size, Precision and Power Calculations: A Unified Approach — doi.org
- 4.1.3 - Impact of Sample Size | STAT 200 — online.stat.psu.edu