Begin
14 pages · ~28 min
Business Analytics and Information Systems
This training introduces business analytics and information systems, helping learners understand their concepts, purpose, and practical examples.
A digital instructor presents all 14 pages. Hold “Ask” at any point and ask out loud — the answer comes from this course. No sign-up needed.
What you’ll learn
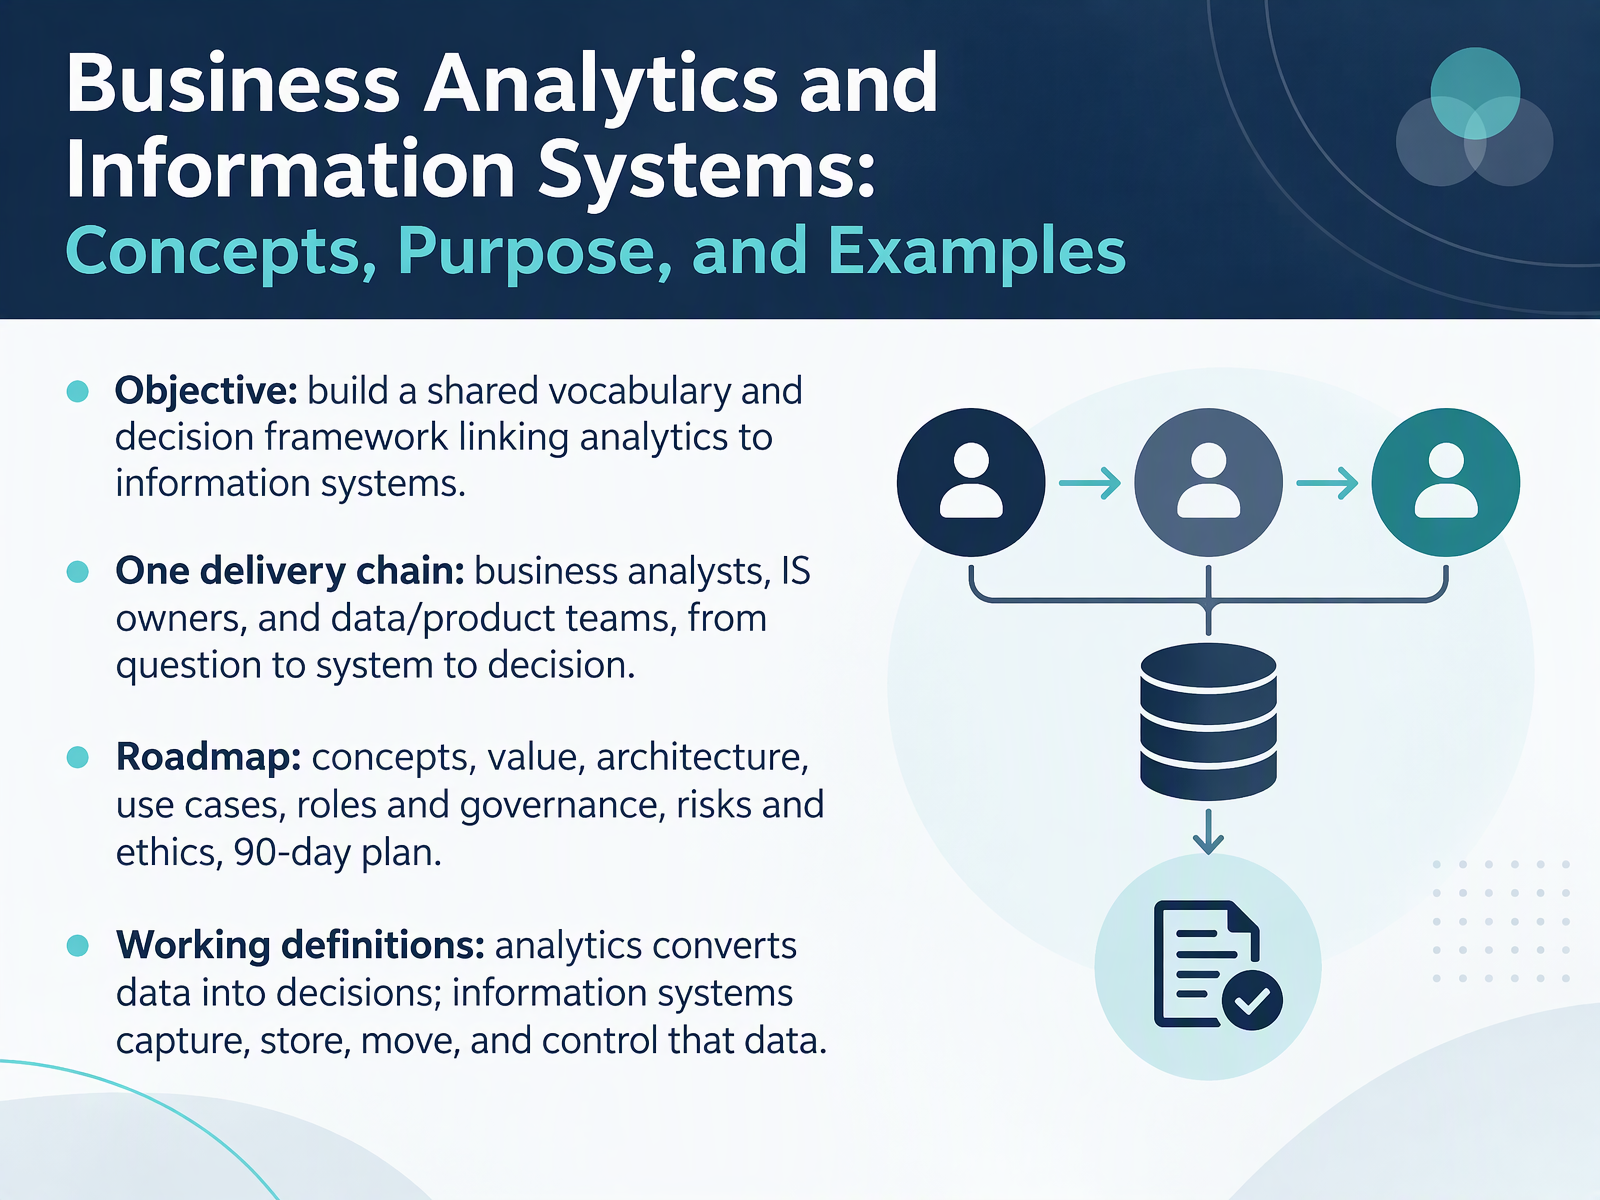
- 01Business Analytics and Information Systems: Concepts, Purpose, and ExamplesWelcome. I am glad you are here. In the next ninety minutes, we build a shared vocabulary and a simple decision framework that connects business analytics to information systems. Most teams already have both. What they often lack is a common language between the analysts, the information systems owners, and the data and product teams. Think of a retail planning group that debates a demand forecast for weeks because the analyst and the system owner use different definitions of an active customer. Our working definitions are short. Analytics converts data into decisions. Information systems capture, store, move, and control that data. Our roadmap covers concepts, value, architecture, use cases, roles and governance, risks and ethics, and a ninety day plan. Your next step is to treat these definitions as the starting point for the framework we build together, and to review the roadmap with your team before we move on. Let us begin with why analytics and information systems belong together.online.uc.edubusinesssystemstoday.comlink.springer.com+21 min
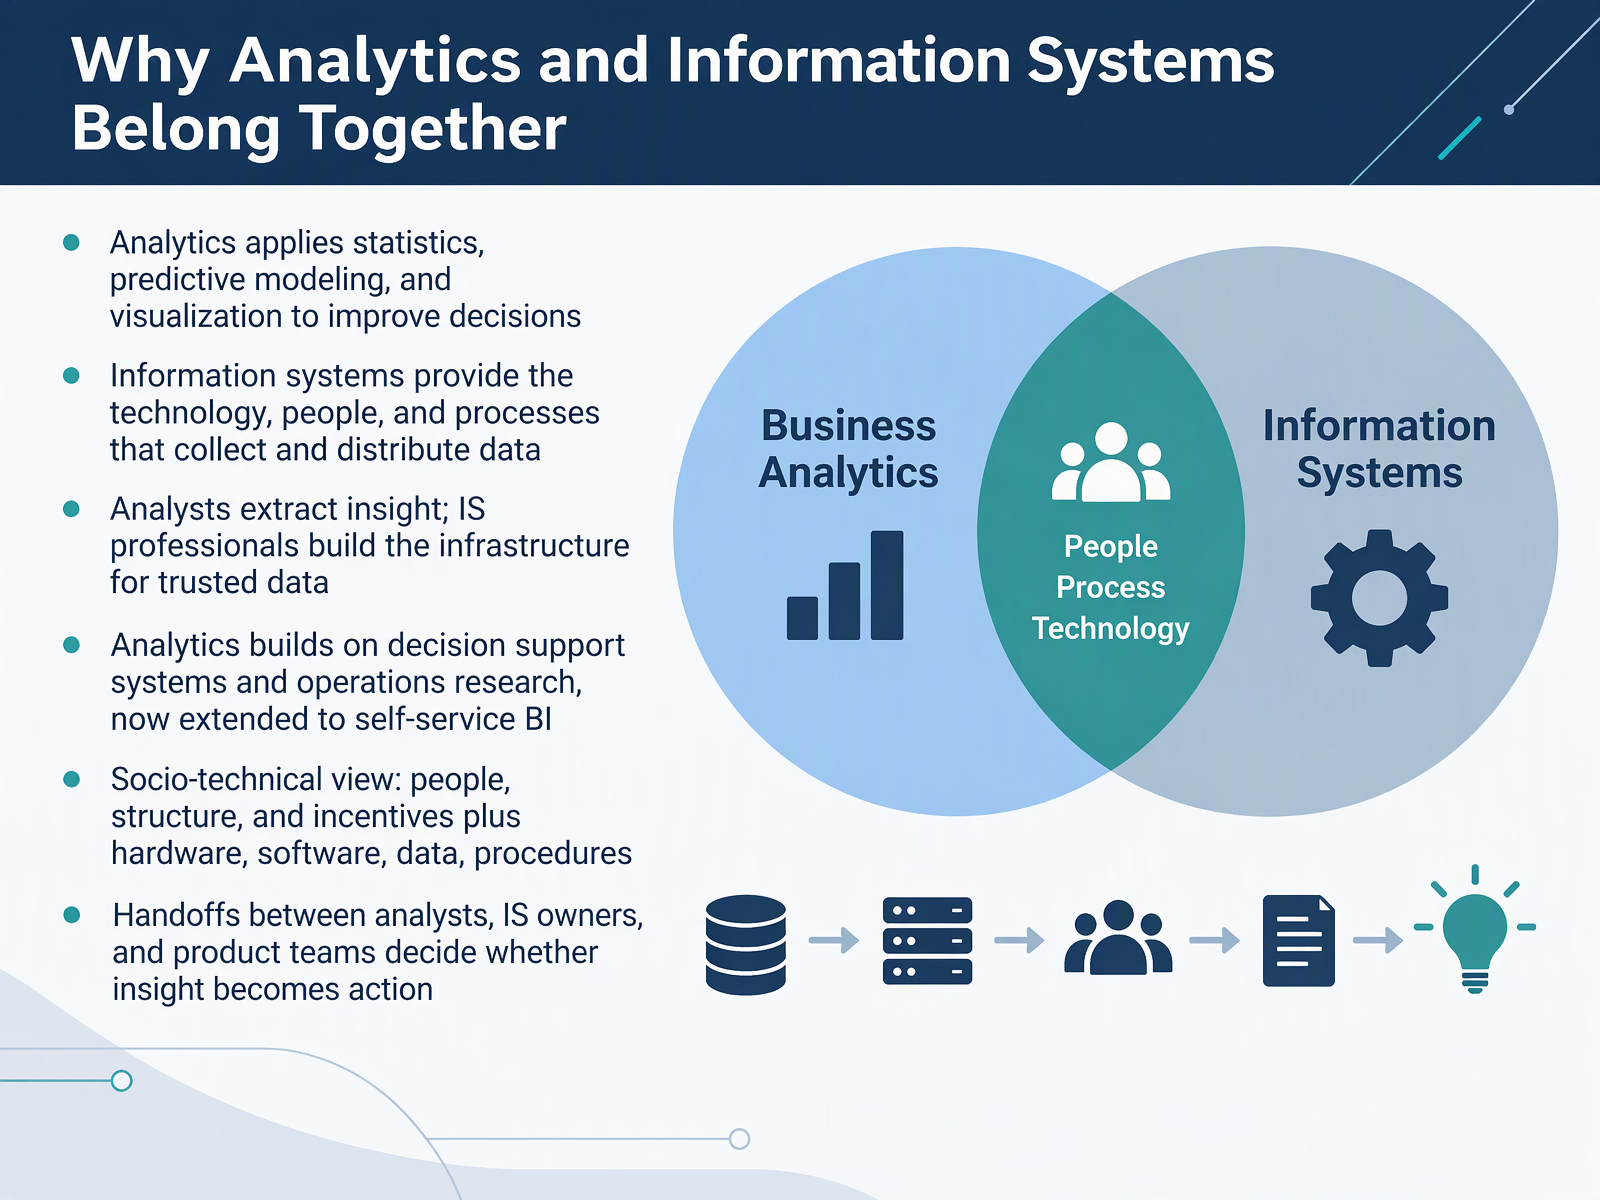
- 02Why Analytics and Information Systems Belong TogetherLet's look at why analytics and information systems belong together. Analytics applies statistics, predictive modeling, and visualization to improve decisions. Information systems provide the technology, people, and processes that collect and distribute data. Put simply, analysts extract insight, while information systems professionals build the infrastructure for trusted data. Analytics builds on decision support systems and operations research, and in most cases it now extends to self-service business intelligence. A socio-technical view matters here: people, structure, and incentives sit alongside hardware, software, data, and procedures. One example: an analyst spots a churn pattern, but the information systems owner must confirm the customer data is accurate before anyone acts. Those handoffs between analysts, information systems owners, and product teams decide whether insight becomes action. Take a moment to map your own handoffs and name who confirms data quality before a decision. Next, we turn to the case for investment: purpose and business value.
 online.uc.edubusinesssystemstoday.comlink.springer.com+22 min
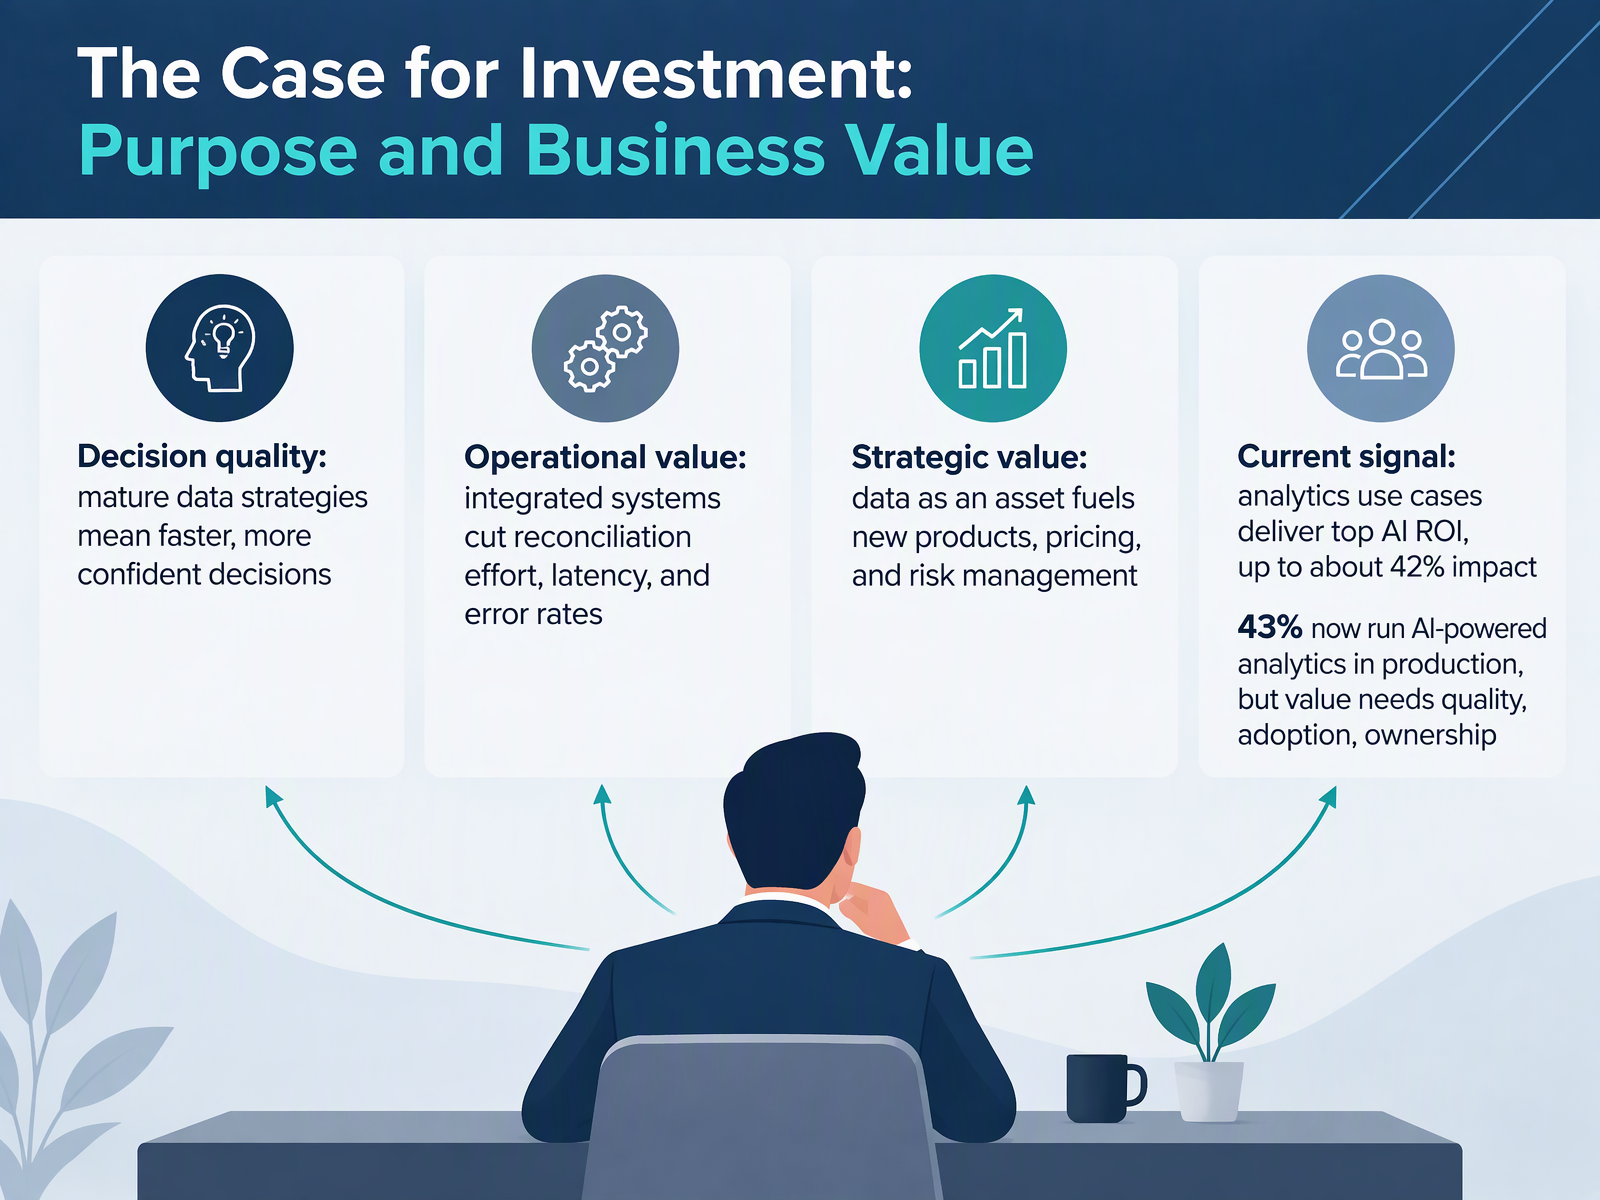
- 03The Case for Investment: Purpose and Business ValueLet's turn to why this investment matters, and where the business value actually shows up. The first payoff is decision quality. Organizations with mature data strategies typically report faster, more confident decisions. For example, a category manager can approve a pricing change the same day instead of waiting a week for reconciled reports. The second is operational value. Integrated systems cut reconciliation effort, latency, and error rates. In practice, a monthly close that needed several days of manual matching can finish in hours. The third is strategic value. Treating data as an asset fuels new products, pricing, and risk management. A bank, for instance, can price a new lending product using its own behavioral data rather than guesswork. There is also a current signal worth noting. Analytics use cases deliver the highest return on AI investment, with business impact up to about forty two percent. And forty three percent of organizations now run AI-powered analytics in production. But value does not follow automatically. It depends on data quality, adoption, and clear ownership. So as a next step, identify one decision that is currently slow or disputed, and trace the data quality and ownership behind it. That gives us a concrete starting point. Next, we will look at core concepts, starting with analytics types, data platforms, and information systems building blocks.
 gartner.comstrategy.comsapinsider.org+22 min
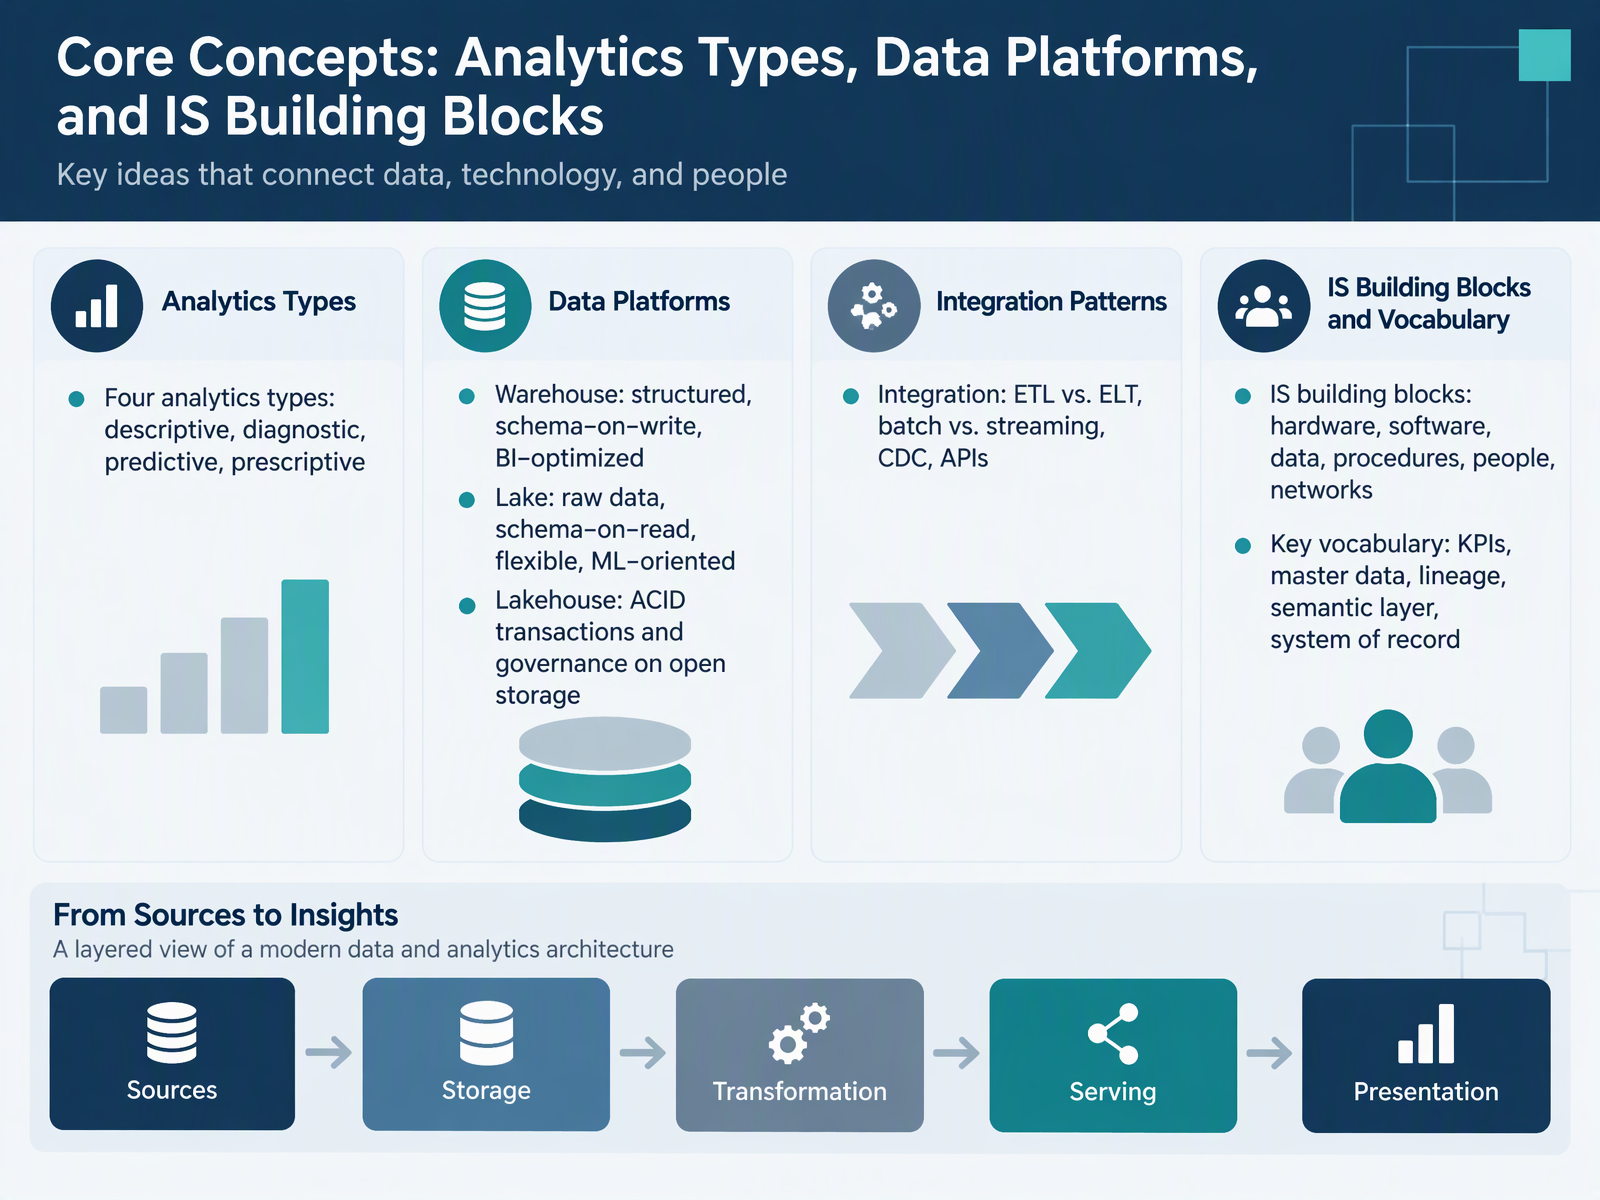
- 04Core Concepts: Analytics Types, Data Platforms, and IS Building BlocksLet us break down the core concepts. Analytics comes in four types: descriptive, which reports what happened; diagnostic, which explains why; predictive, which forecasts what will happen; and prescriptive, which recommends what to do. For example, a dashboard showing last quarter's returns is descriptive, while a model recommending reorder quantities is prescriptive. On the platform side, a data warehouse holds structured data with schema-on-write and is optimized for business intelligence. A data lake keeps raw data with schema-on-read, which suits machine learning. A lakehouse adds ACID transactions and governance, that is atomicity, consistency, isolation, and durability, on open storage. Integration covers ETL versus ELT, extract, transform, load and extract, load, transform, plus batch versus streaming, change data capture, and APIs. Information system building blocks are hardware, software, data, procedures, people, and networks. Keep this vocabulary close: KPIs, master data, lineage, semantic layer, and system of record. Your next step is to map which analytics type and platform each of your current use cases actually needs. From Data to Decisions: The Analytics Workflow.
 ibm.comazure.microsoft.comdoi.org+22 min
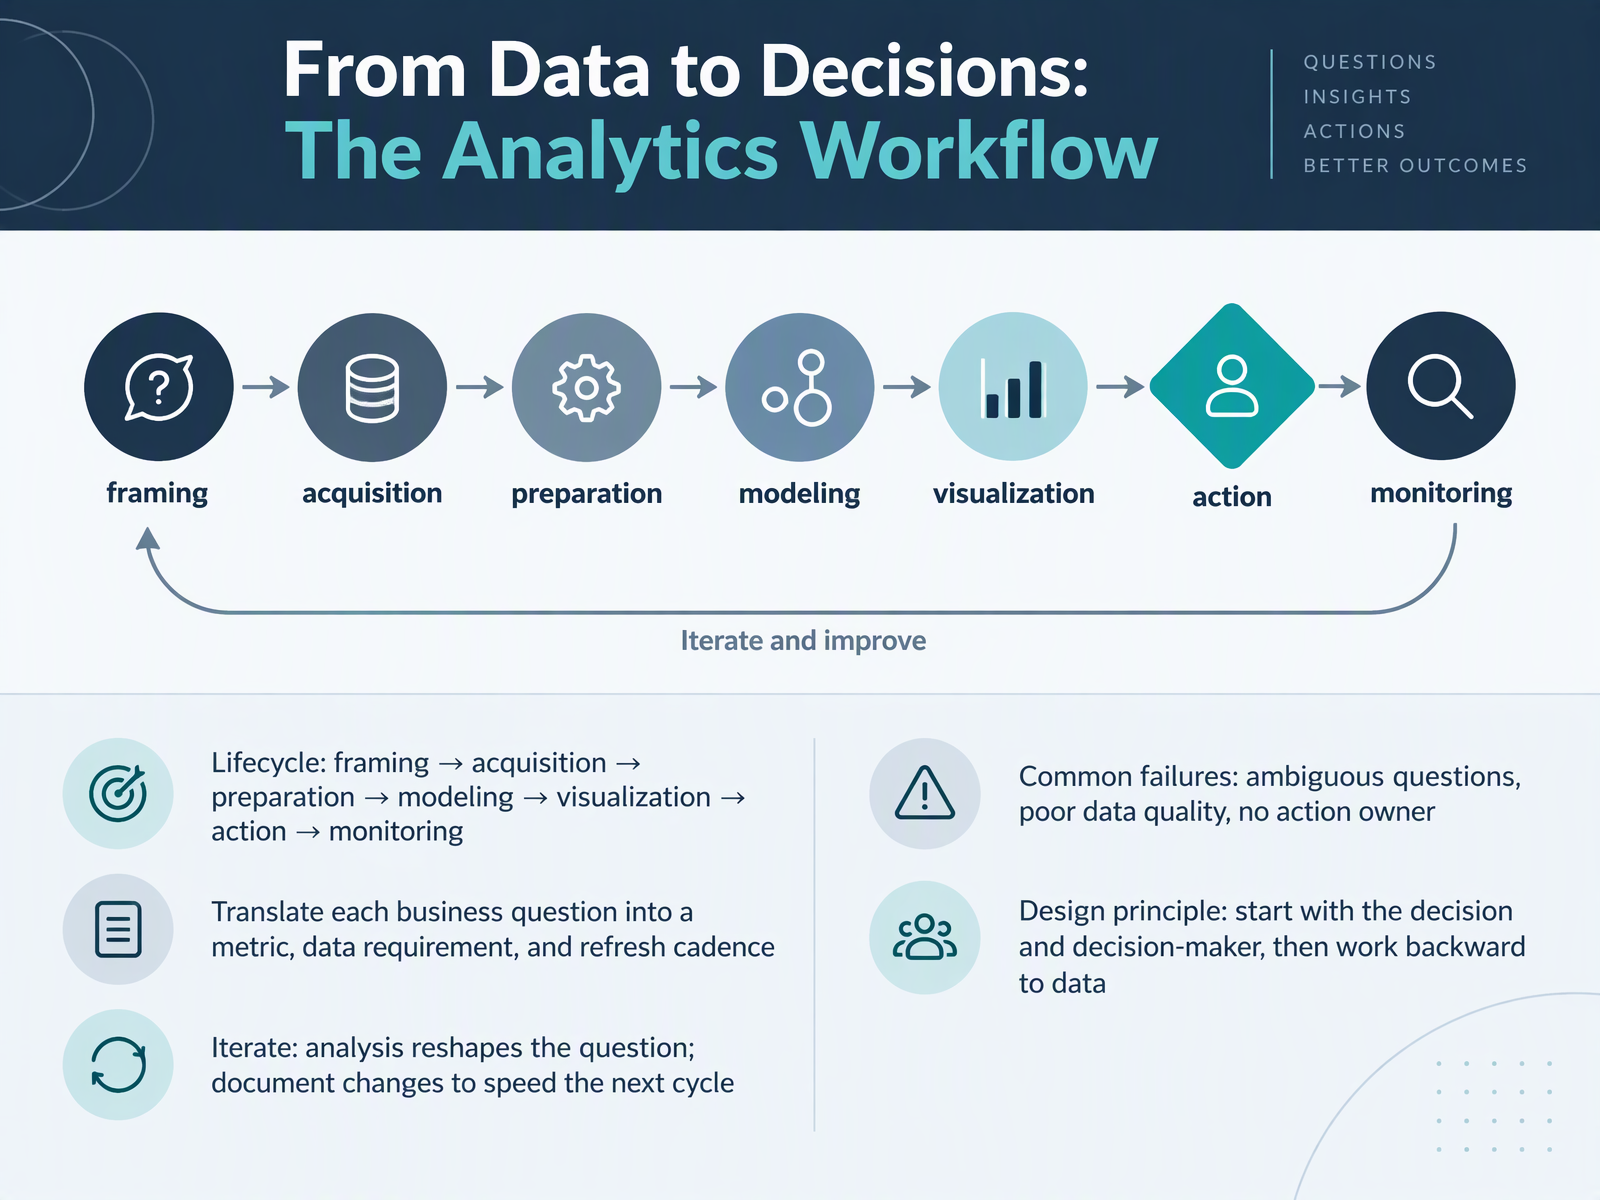
- 05From Data to Decisions: The Analytics WorkflowLet's walk through the analytics workflow, from data to decisions. The lifecycle runs from framing, through acquisition, preparation, modeling, visualization, and action, to monitoring. Each business question should translate into three things: a metric, a data requirement, and a refresh cadence. For example, a sales director asking which deals are at risk needs a win-rate metric, pipeline data, and a daily refresh. Expect to iterate. Analysis often reshapes the original question, so document changes to speed the next cycle. Watch for three common failures: ambiguous questions, poor data quality, and no clear action owner. The design principle that prevents them is simple. Start with the decision and the decision-maker, then work backward to the data. Use that principle to frame your next analytics request. Next, we look at Information Systems Architecture and Data Flow.
 online.uc.edubusinesssystemstoday.comlink.springer.com+21 min
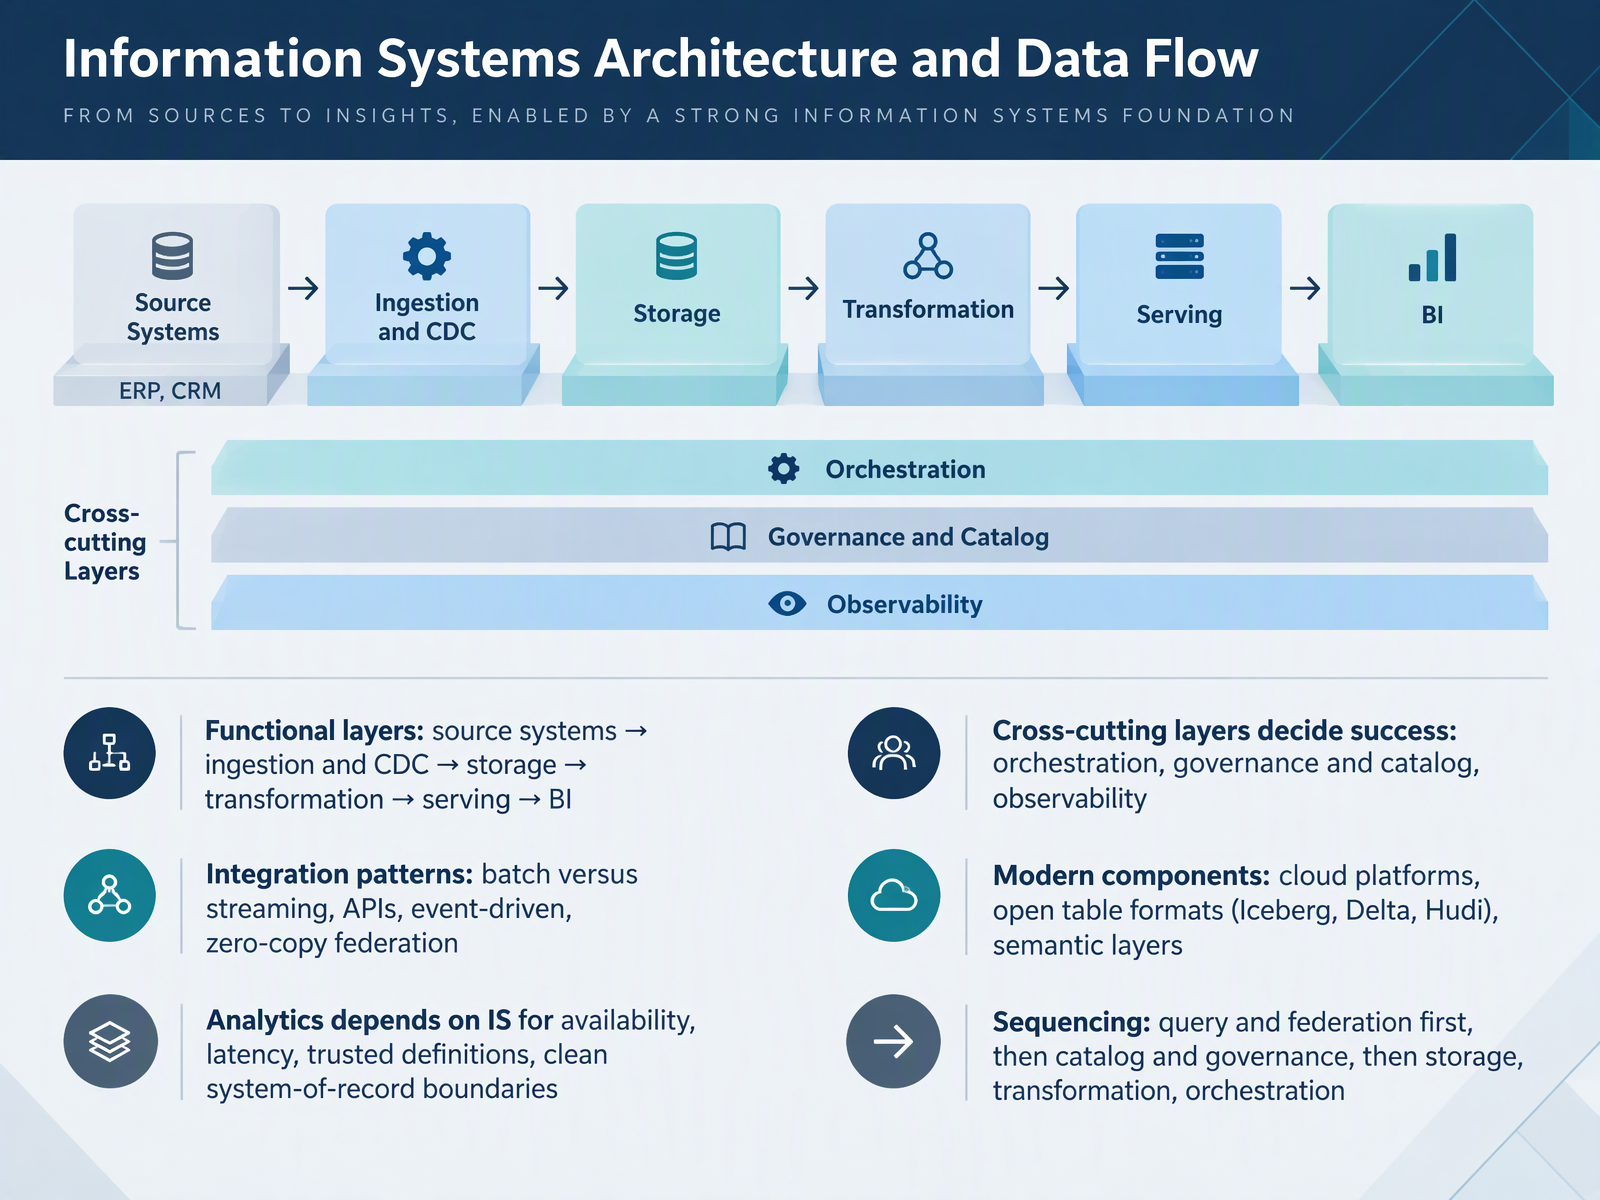
- 06Information Systems Architecture and Data FlowLet's look at how information systems architecture actually moves data. Picture functional layers in sequence: source systems flow into ingestion with change data capture, then storage, transformation, serving, and finally business intelligence. For example, a customer record moves from a CRM system into your warehouse and surfaces on a sales dashboard. Three cross-cutting layers decide whether this succeeds: orchestration, governance with a catalog, and observability. Integration patterns range from batch and streaming to APIs, event-driven flows, and zero-copy federation. Modern components typically include cloud platforms, open table formats such as Iceberg, Delta, and Hudi, and a semantic layer that defines metrics once. Analytics depends on the information system for availability, latency, trusted definitions, and clean system-of-record boundaries. On sequencing, start with query and federation, then add catalog and governance, then storage, transformation, and orchestration. Next, we'll examine use cases across business functions.
 gartner.combigdataboutique.comdocs.databricks.com+22 min
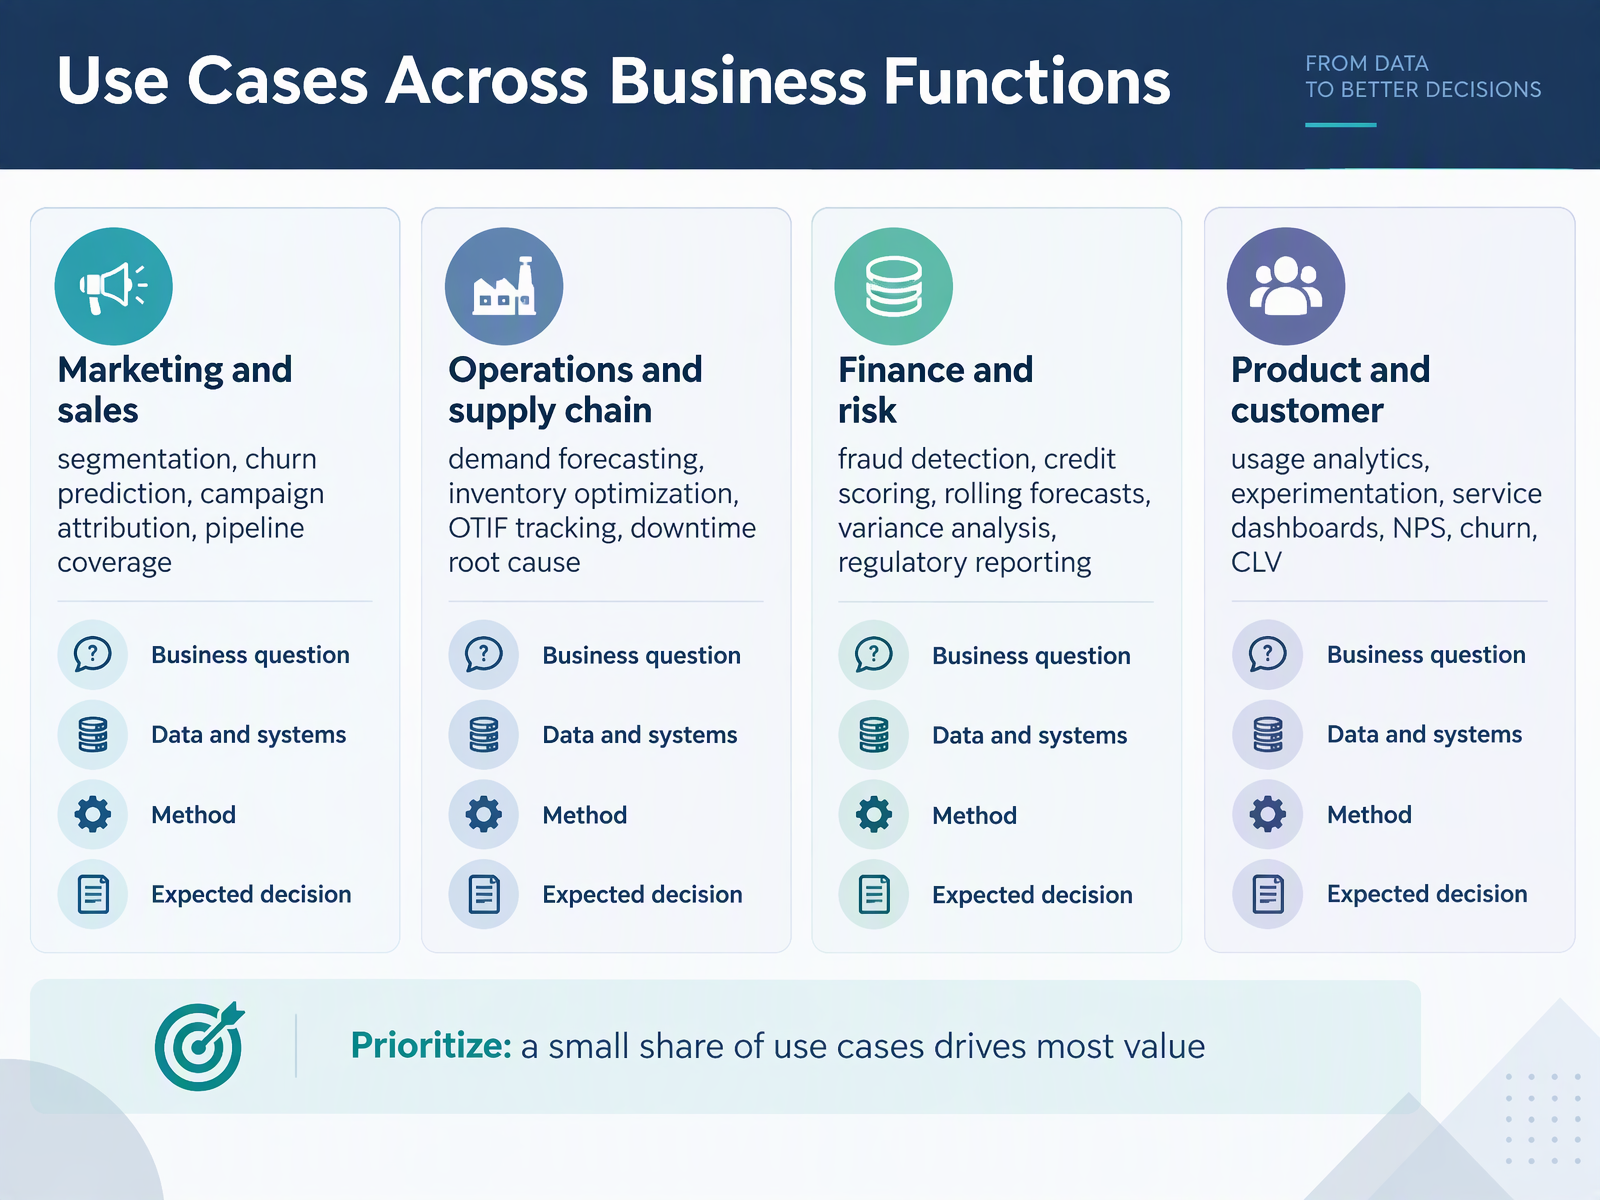
- 07Use Cases Across Business FunctionsLet's move on to use cases across business functions. The same analytics capability takes a different shape in each function, because the decisions are different. In marketing and sales, the questions are segmentation, churn prediction, campaign attribution, and pipeline coverage. For example, a coverage ratio below three times remaining quota gives sales leaders an early warning while there is still time to act. In operations and supply chain, you typically see demand forecasting, inventory optimization, on-time in-full tracking, and downtime root cause. A plant manager, for instance, uses downtime data to schedule maintenance before a line stops. In finance and risk, the work covers fraud detection, credit scoring, rolling forecasts, variance analysis, and regulatory reporting. A controller uses variance analysis to trigger a reforecast, not just to explain the month. In product and customer, it is usage analytics, experimentation, service dashboards, net promoter score, churn, and customer lifetime value. A product team, for example, runs an experiment to decide whether to ship a feature. For each use case, name the business question, the data and systems involved, the method, and the expected decision. Then prioritize: in most cases, a small share of use cases drives most of the value. So pick a short list tied to clear decisions. Next, we look at tools, data quality, and the current analytics landscape.
 gartner.comstrategy.comsapinsider.org+22 min
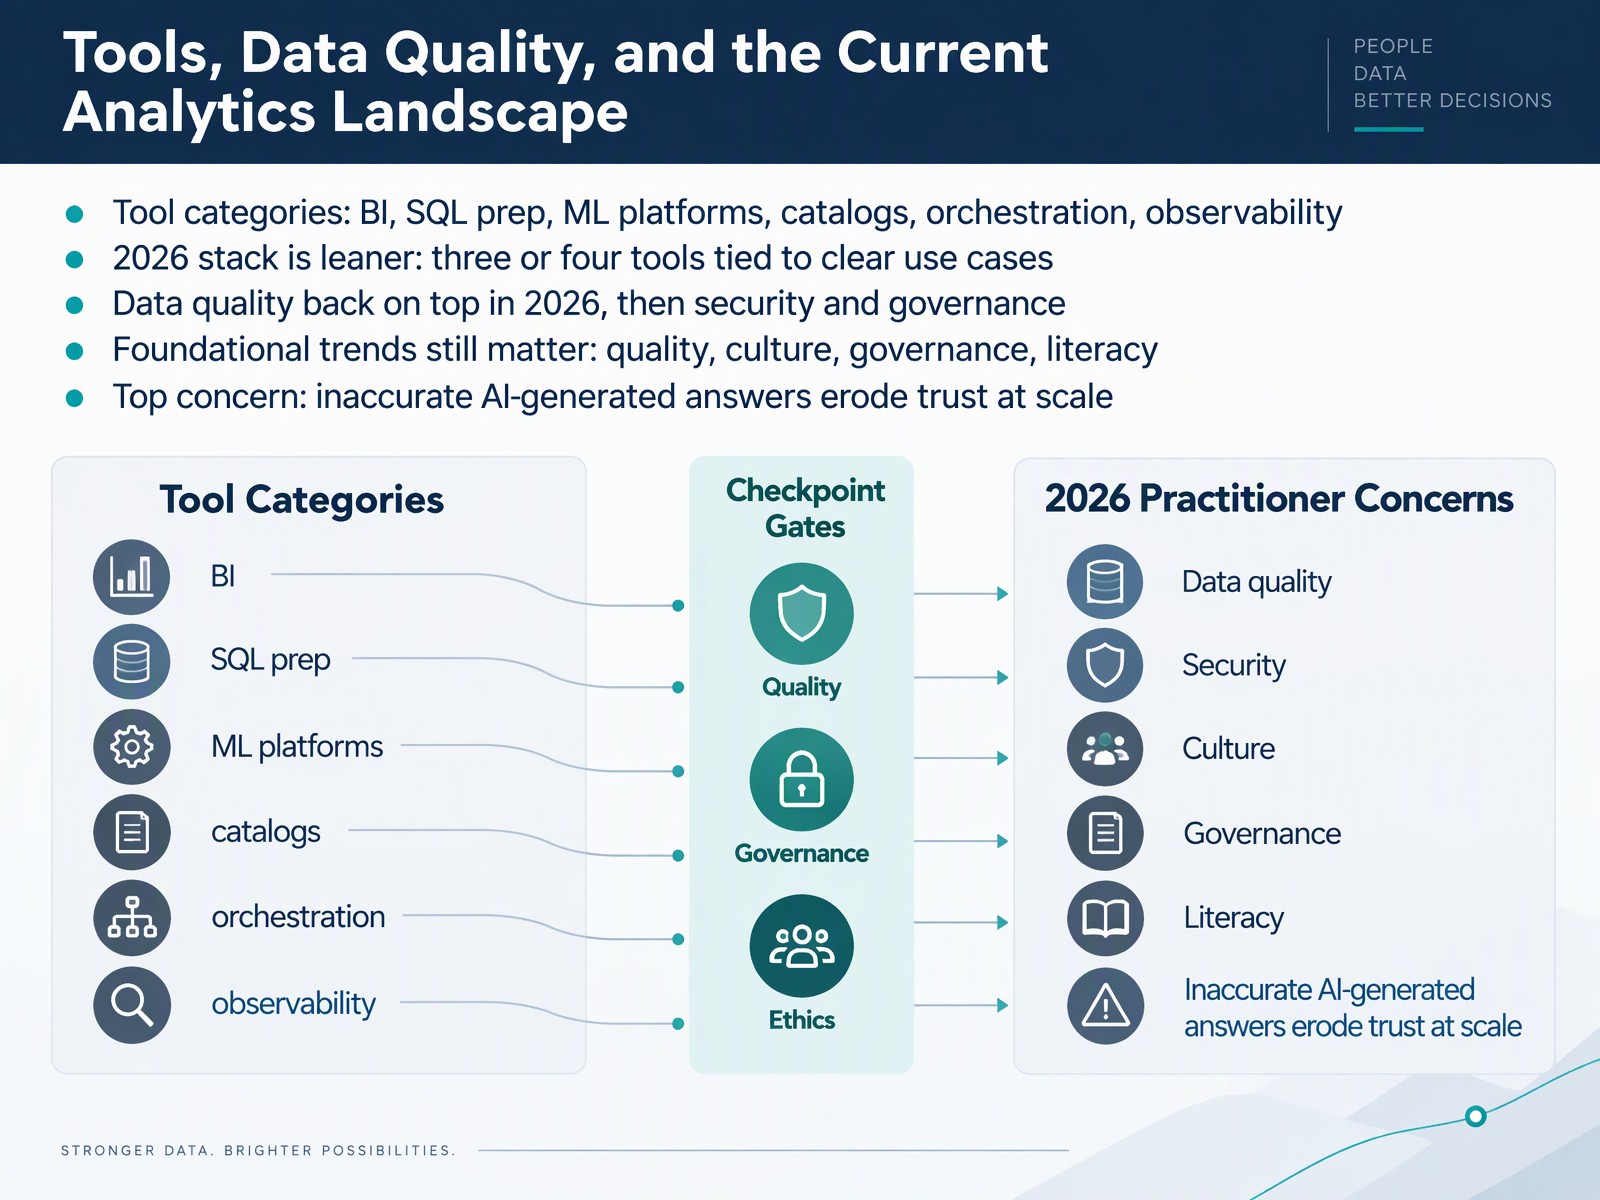
- 08Tools, Data Quality, and the Current Analytics LandscapeNow let's look at the tools and the data quality picture behind them. The tool categories are familiar: business intelligence for reporting, SQL preparation for modeling, machine learning platforms, data catalogs, orchestration, and observability. A practical point here is that the 2026 stack is leaner than it was. In most cases, three or four tools tied to clear use cases beat nine tools with overlapping roles. A common example is one warehouse, one transformation tool, and one BI layer, with observability added only when pipelines run at scale.
On priorities, data quality reclaimed the top spot in 2026, with security and governance close behind. The foundational trends still matter: quality, culture, governance, and literacy. And the top concern is trust. Inaccurate or inconsistent AI-generated answers erode confidence at scale, so teams spend real time on quality assurance before anyone acts on an answer.
Your next step is simple: audit your tool count against use cases, and confirm where data quality checks actually gate your outputs. That leads naturally into roles, responsibilities, and ways of working.
 gartner.comstrategy.comsapinsider.org+22 min
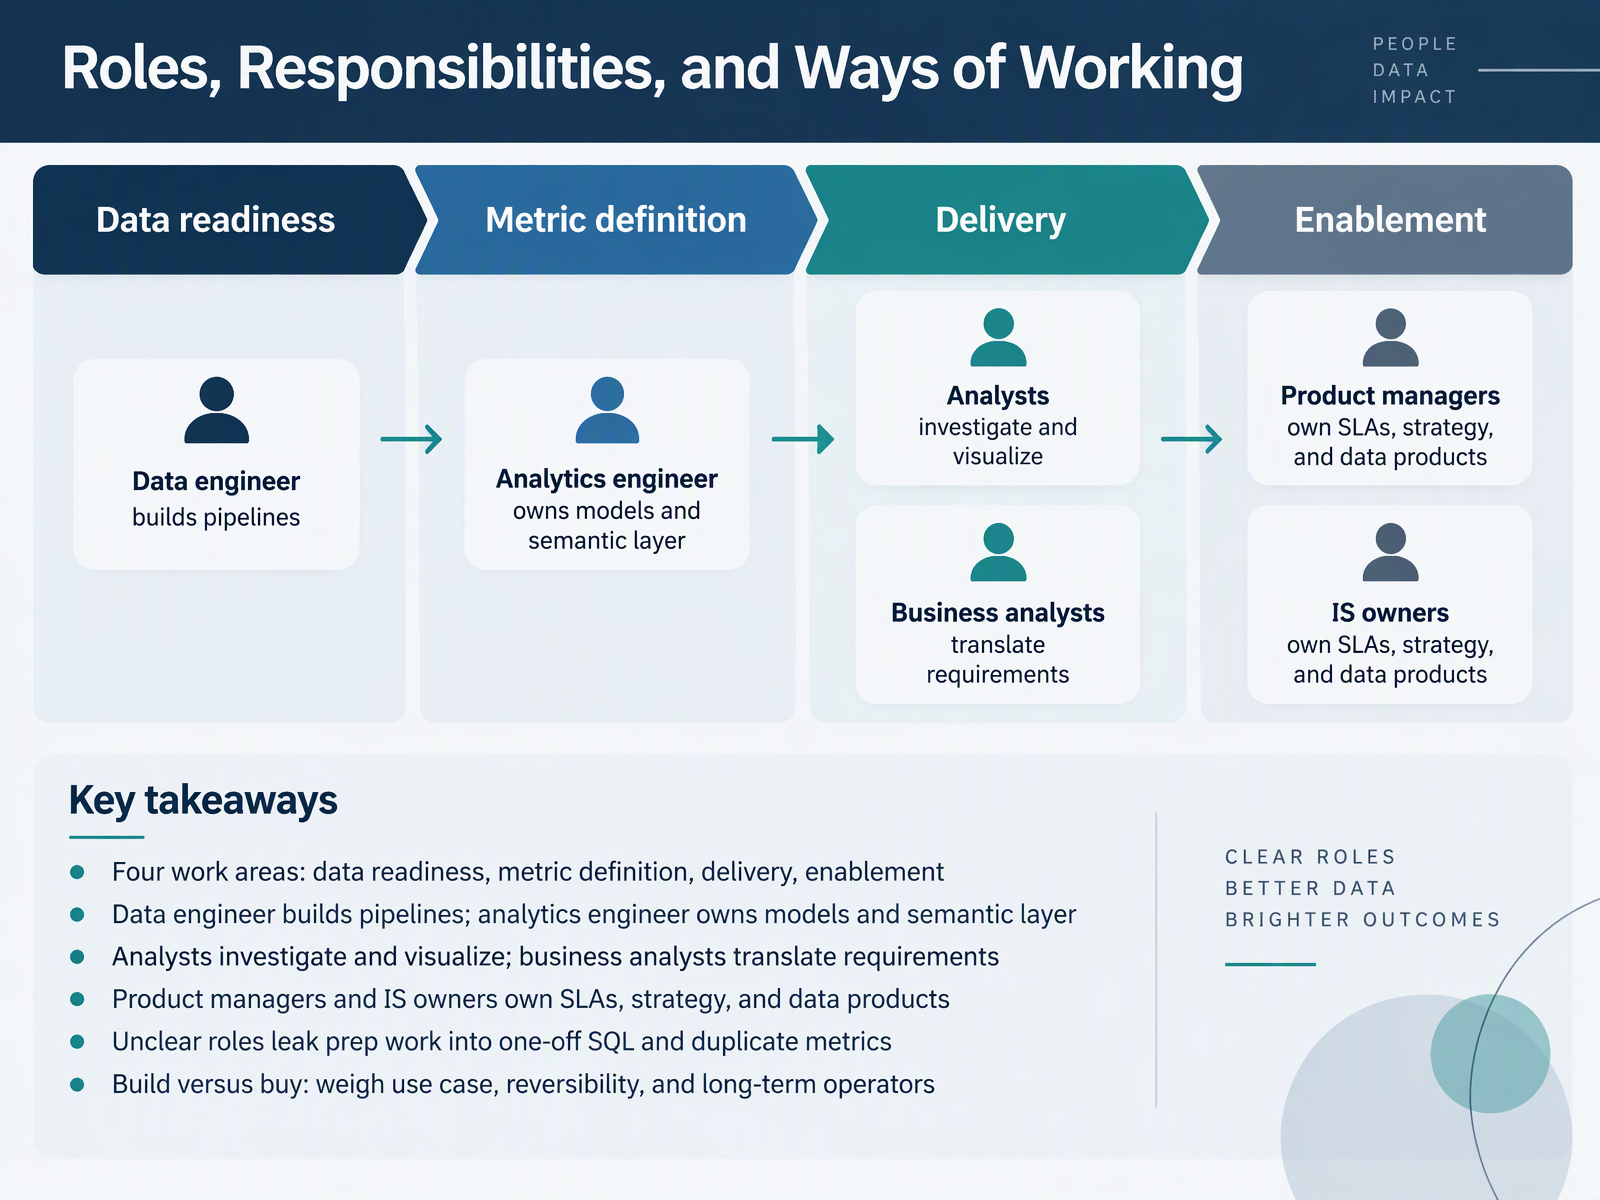
- 09Roles, Responsibilities, and Ways of WorkingWith the concepts in place, let's look at how teams divide the work. Most analytics work falls into four areas: data readiness, metric definition, delivery, and enablement. Data engineers build pipelines, and analytics engineers own the models and the semantic layer, so a metric like net revenue is defined once and reused. Analysts investigate and visualize, while business analysts translate requirements between the business and the team. Product managers and information systems owners own service level agreements, strategy, and data products. When roles stay unclear, preparation work leaks into one-off SQL and duplicate metrics, and a simple revenue question turns into a reconciliation exercise. For build versus buy decisions, weigh the use case, how reversible the choice is, and who will operate the tool long term. Your next step is to assign an explicit owner to each of the four work areas. That ownership also sets up the next topic: governance, security, and data quality.
 2 min
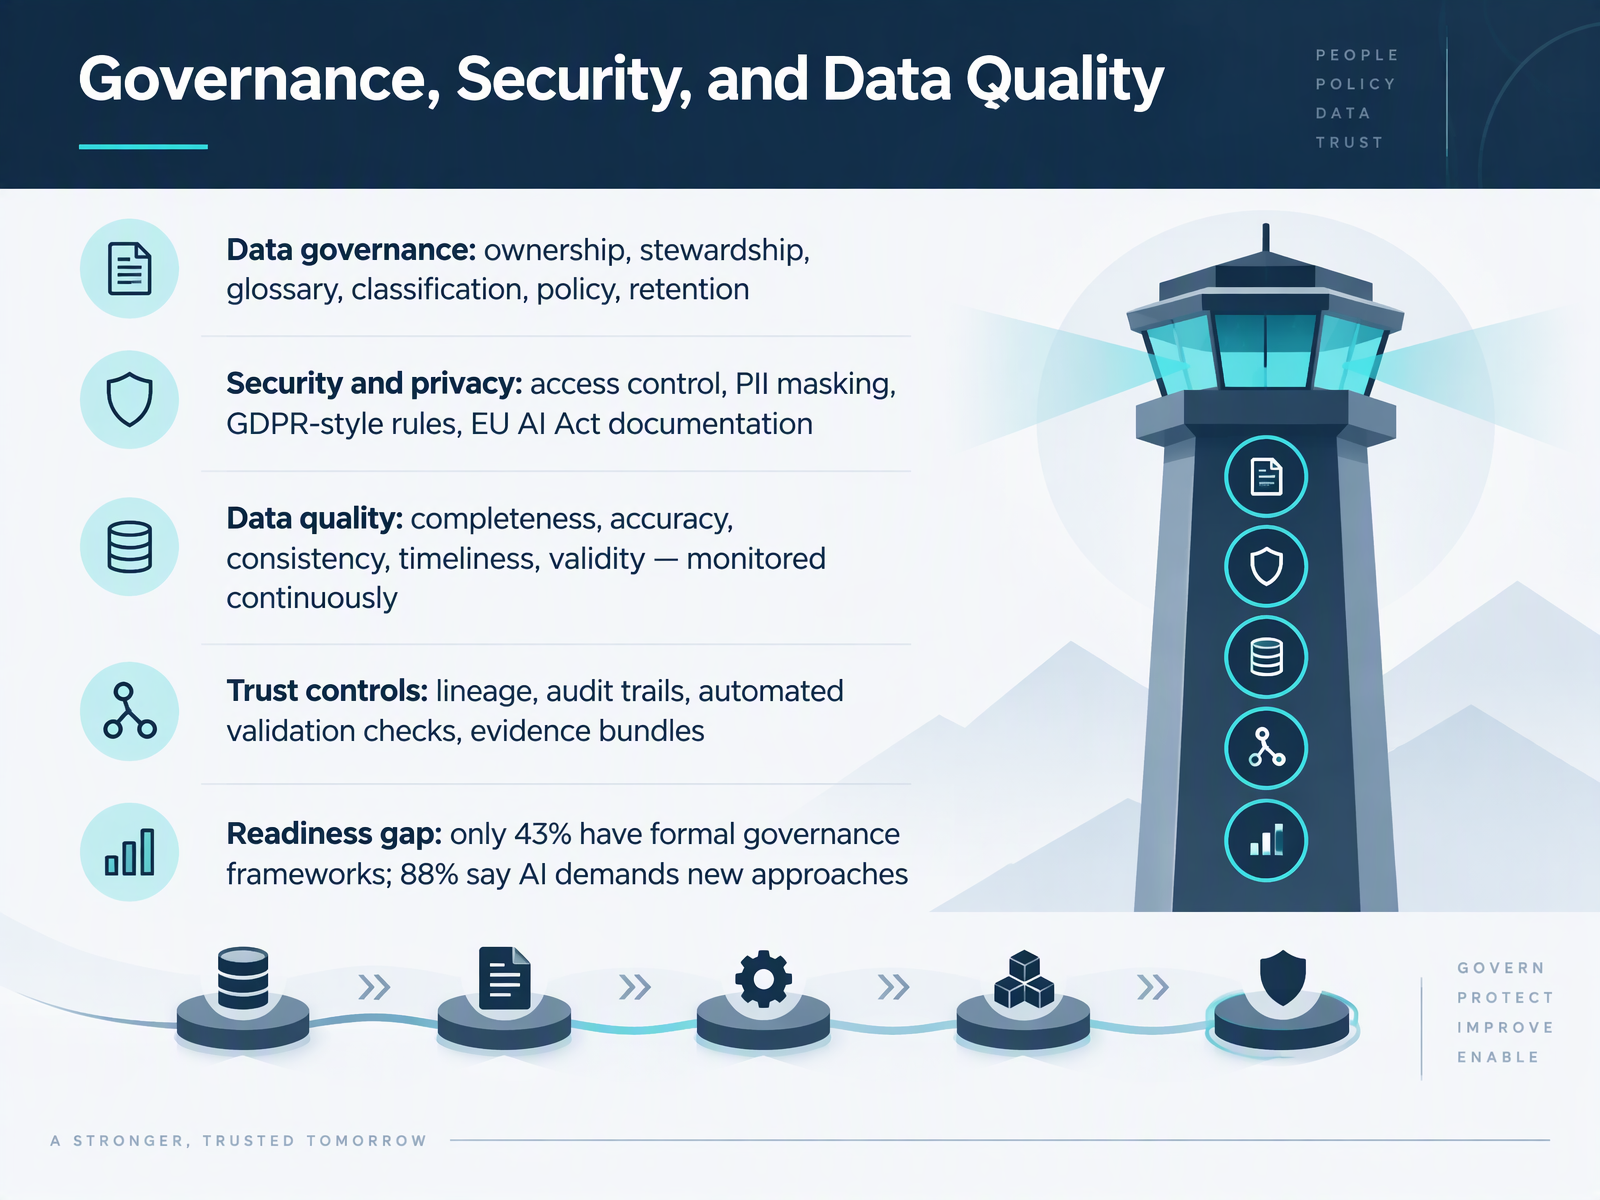
- 10Governance, Security, and Data QualityLet's turn to how we keep analytics trustworthy. Data governance defines ownership and stewardship, a shared business glossary, classification, policy, and retention. For example, one team owns the customer record and approves every change. Security and privacy add access control, masking of personally identifiable information, GDPR-style rules, and documentation for the EU AI Act. Data quality covers completeness, accuracy, consistency, timeliness, and validity, monitored continuously rather than audited once a year. Trust controls make it verifiable: lineage, audit trails, automated validation checks, and evidence bundles you can hand to an auditor. Now the readiness gap. Only forty-three percent of analytics leaders have formal governance frameworks, and eighty-eight percent say AI demands entirely new approaches. So treat governance as a product. Pick one critical data domain and assign an accountable owner this quarter. That leads us into risks, pitfalls, and ethical considerations.
 gartner.comstrategy.comsapinsider.org+22 min
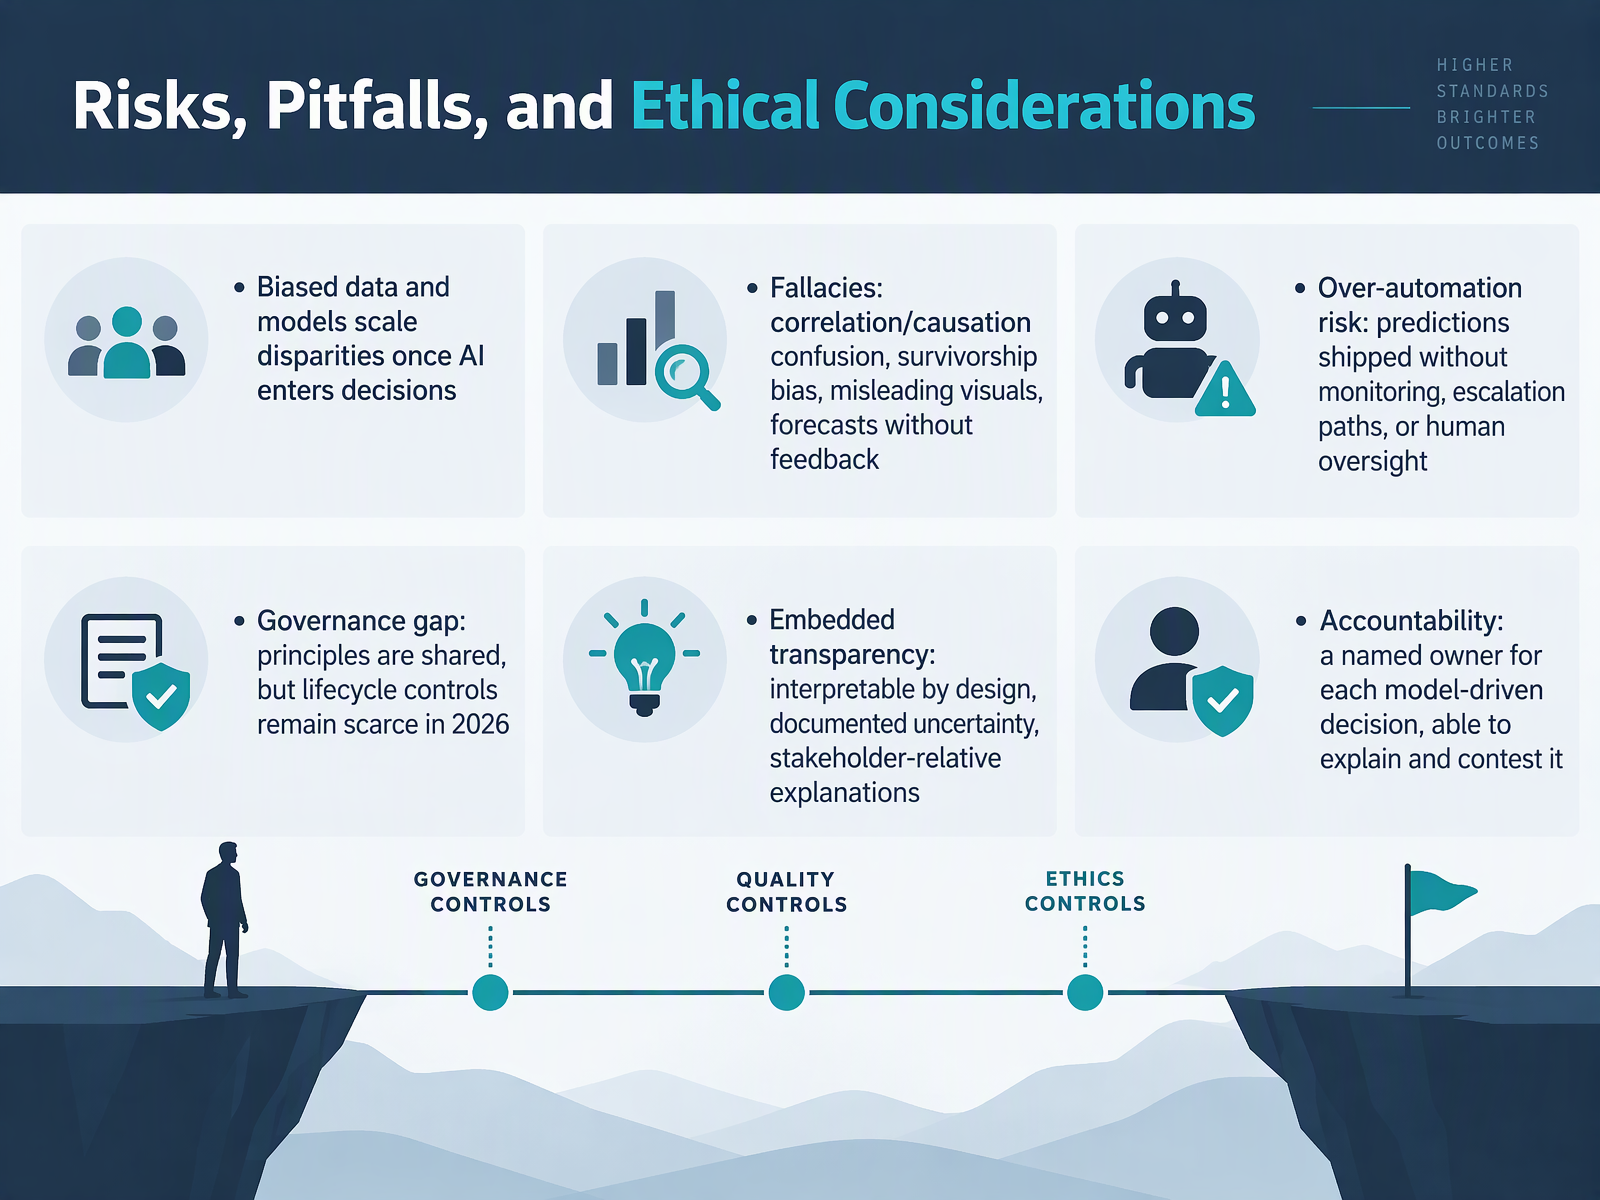
- 11Risks, Pitfalls, and Ethical ConsiderationsLet's turn to the risks and ethical considerations that come with analytics and AI. Biased data produces biased models, and once those models enter decisions, disparities scale rather than shrink. In most cases the cause is upstream, for example a hiring model trained on a decade of skewed promotion records. Watch for classic fallacies too. Correlation mistaken for causation, survivorship bias, misleading visuals, and forecasts with no feedback loop all erode trust. Over-automation is another trap: predictions shipped without monitoring, escalation paths, or human oversight. And a governance gap persists. Principles are widely shared, but lifecycle controls remain scarce. The practical answer is embedded transparency: interpretable by design, documented uncertainty, and explanations tailored to each stakeholder. Pair that with accountability, meaning a named owner for every model-driven decision, someone who can explain it and contest it. The decision for you: assign owners and review controls on your highest-stakes models this quarter. Next, we look at common failure patterns and how to avoid them.
 1 min
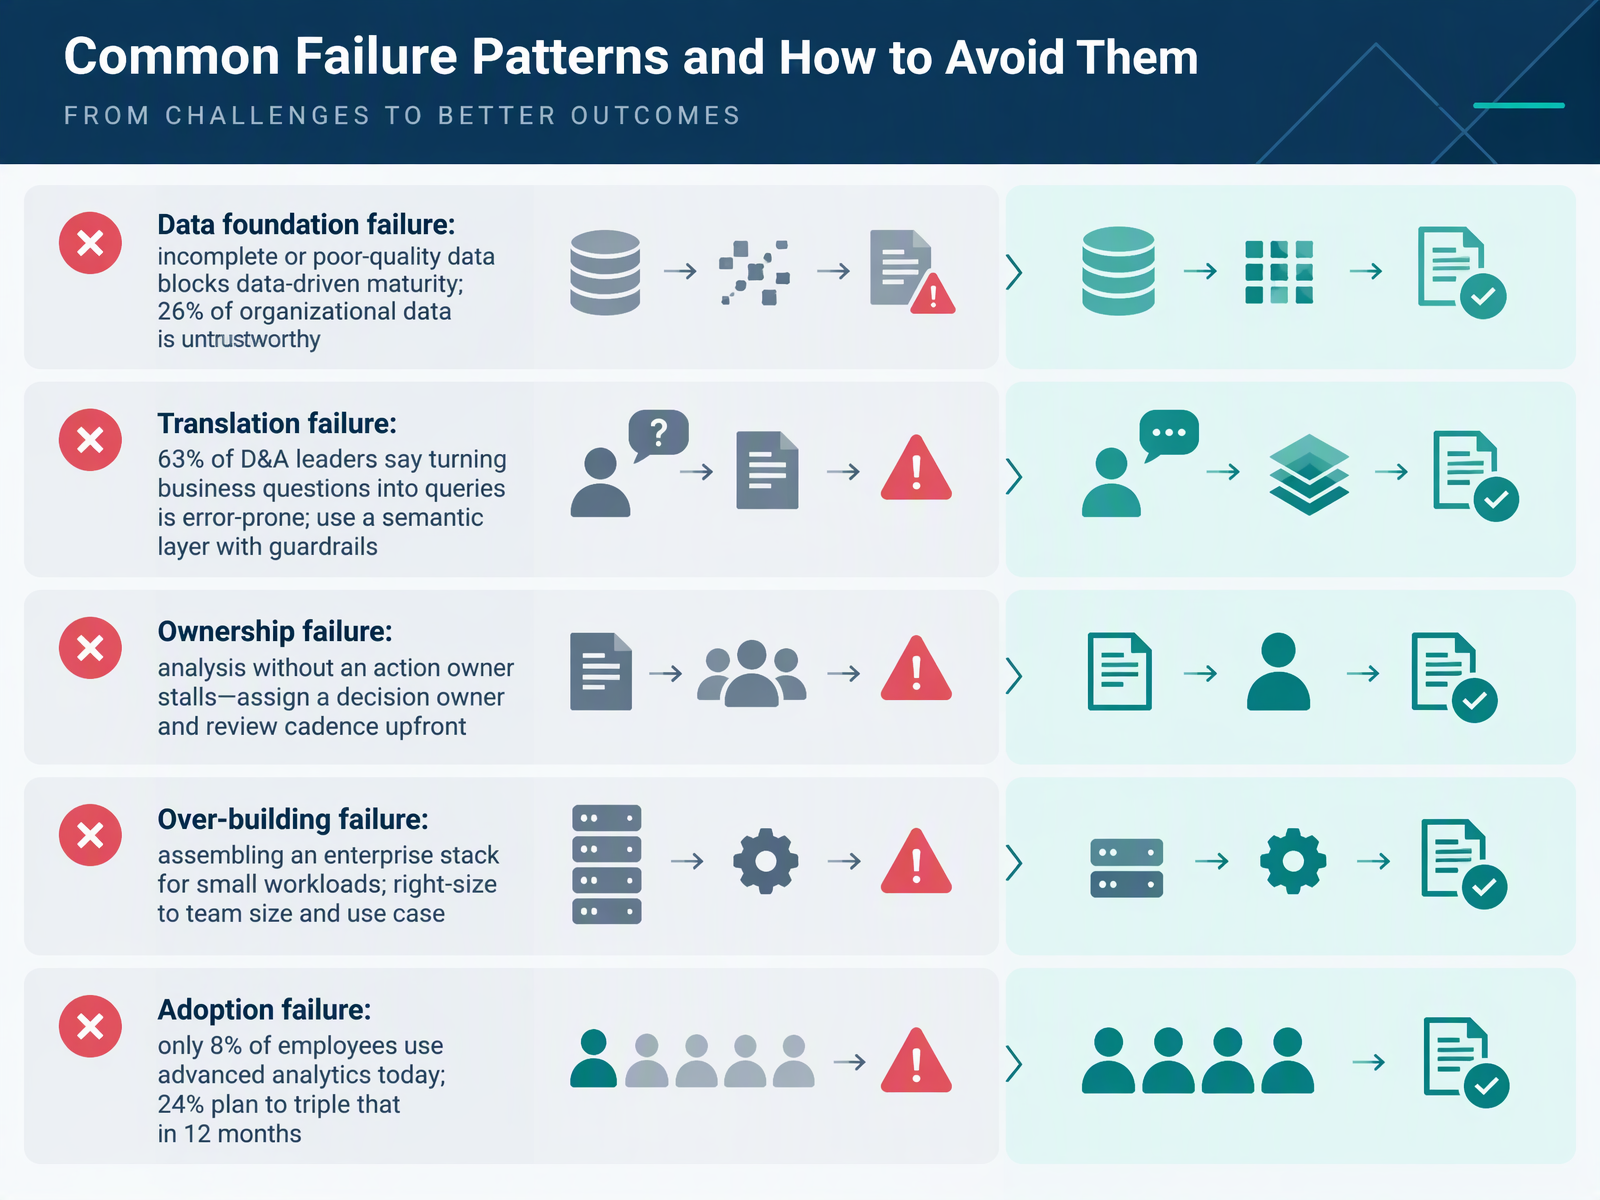
- 12Common Failure Patterns and How to Avoid ThemLet's look at the failure patterns we see most often, so you can recognize them early. First, data foundation failure. Incomplete or poor-quality data blocks maturity, and data and analytics leaders estimate about twenty-six percent of organizational data is untrustworthy. For example, a revenue dashboard nobody trusts because the source records are half-populated. Second, translation failure. Sixty-three percent of leaders say turning business questions into technical queries is prone to error. A semantic layer with guardrails fixes this, because metrics are defined once. Third, ownership failure. Analysis without an action owner stalls. Assign a decision owner and a review cadence before the work starts. Fourth, over-building. Assembling an enterprise stack for a small workload is common. Right-size to team size and use case. Fifth, adoption failure. Only eight percent of employees use advanced analytics today, though twenty-four percent of organizations plan to triple that within twelve months. So how do you turn these lessons into practice? Here is a ninety-day action plan you can apply in your own organization.
 gartner.comstrategy.comsapinsider.org+22 min
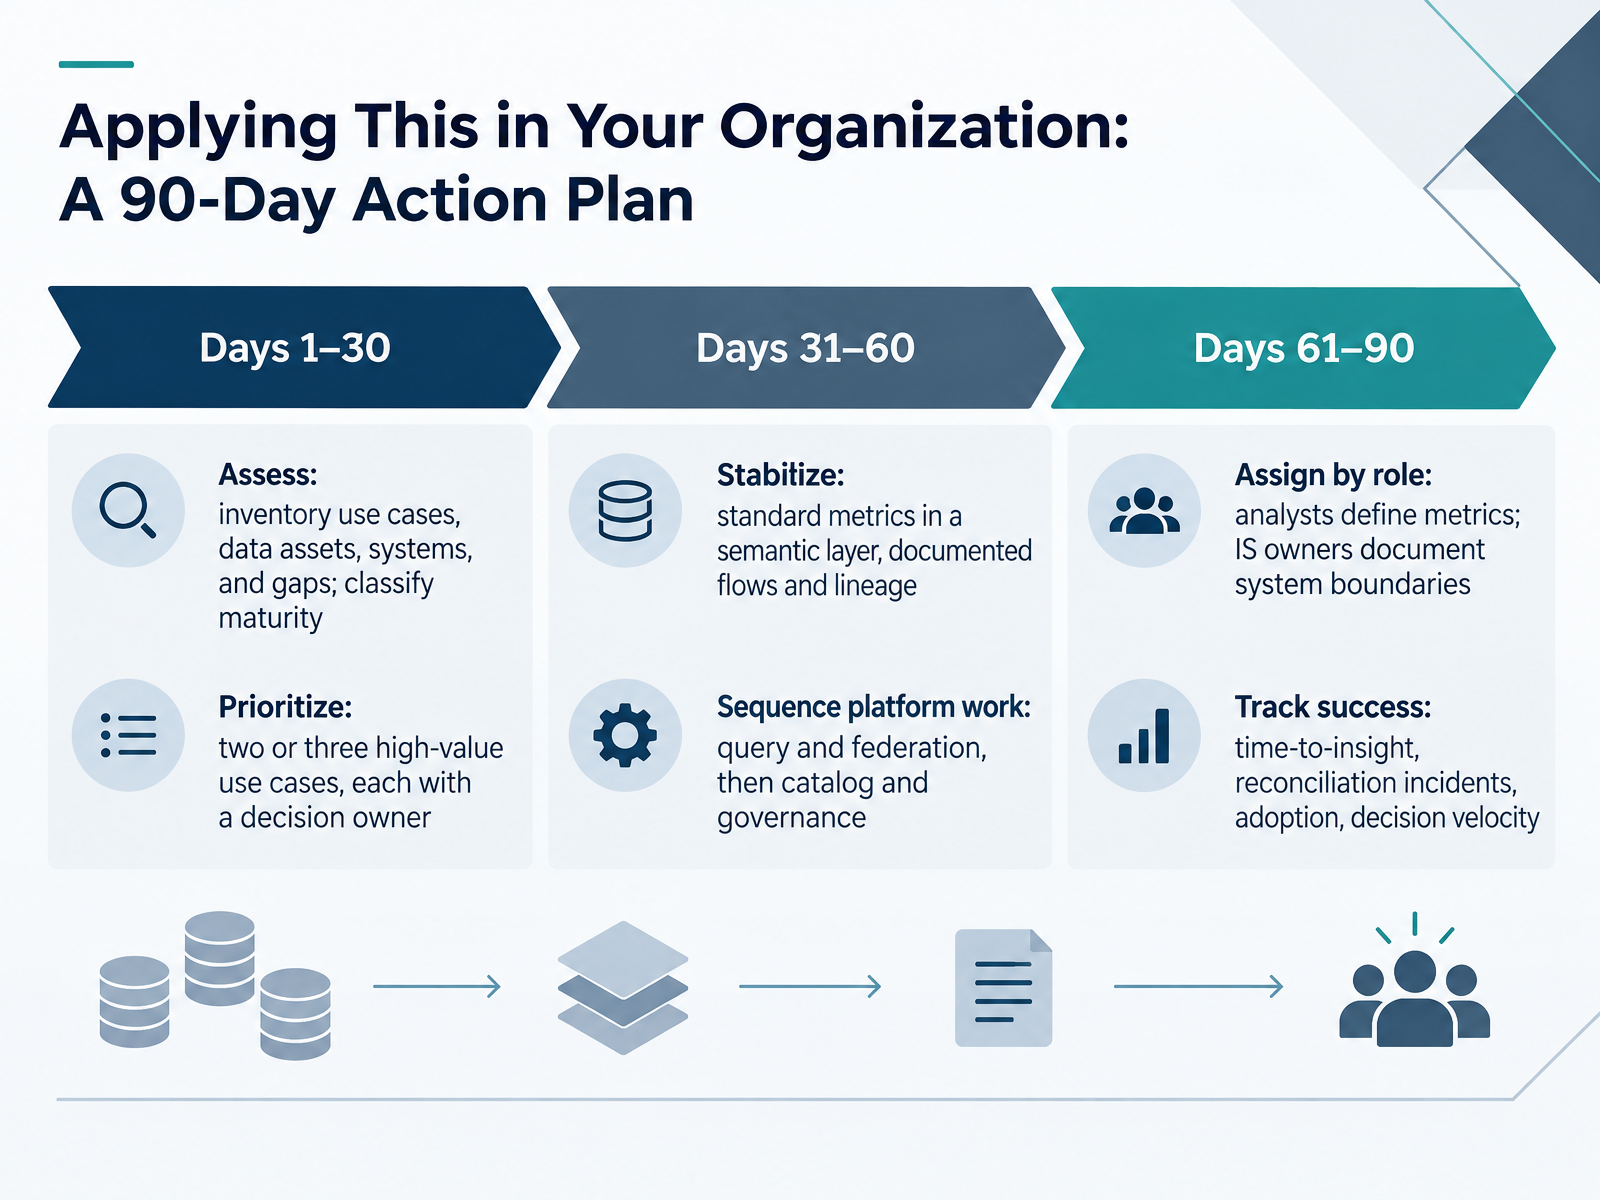
- 13Applying This in Your Organization: A 90-Day Action PlanSo how do you put all of this into practice? Here is a ninety-day action plan. Start by assessing. Inventory your use cases, data assets, systems, and gaps, and classify where your maturity actually sits. For example, list every recurring report and note which ones nobody uses. Next, prioritize two or three high-value use cases, and give each one a named decision owner. Then stabilize. Agree standard metrics in a semantic layer and document the flows and lineage behind them, so finance and product stop reconciling revenue twice. Sequence platform work deliberately: query and federation first, then catalog and governance. Assign by role. Analysts define the metrics, and information systems owners document system boundaries. Finally, track success with four measures: time to insight, reconciliation incidents, adoption, and decision velocity. The decision for you now is simple: who chairs the assessment, and which two use cases go on the list. Let's pull this together with the key takeaways and discussion.
 ibm.comazure.microsoft.comdoi.org+22 min
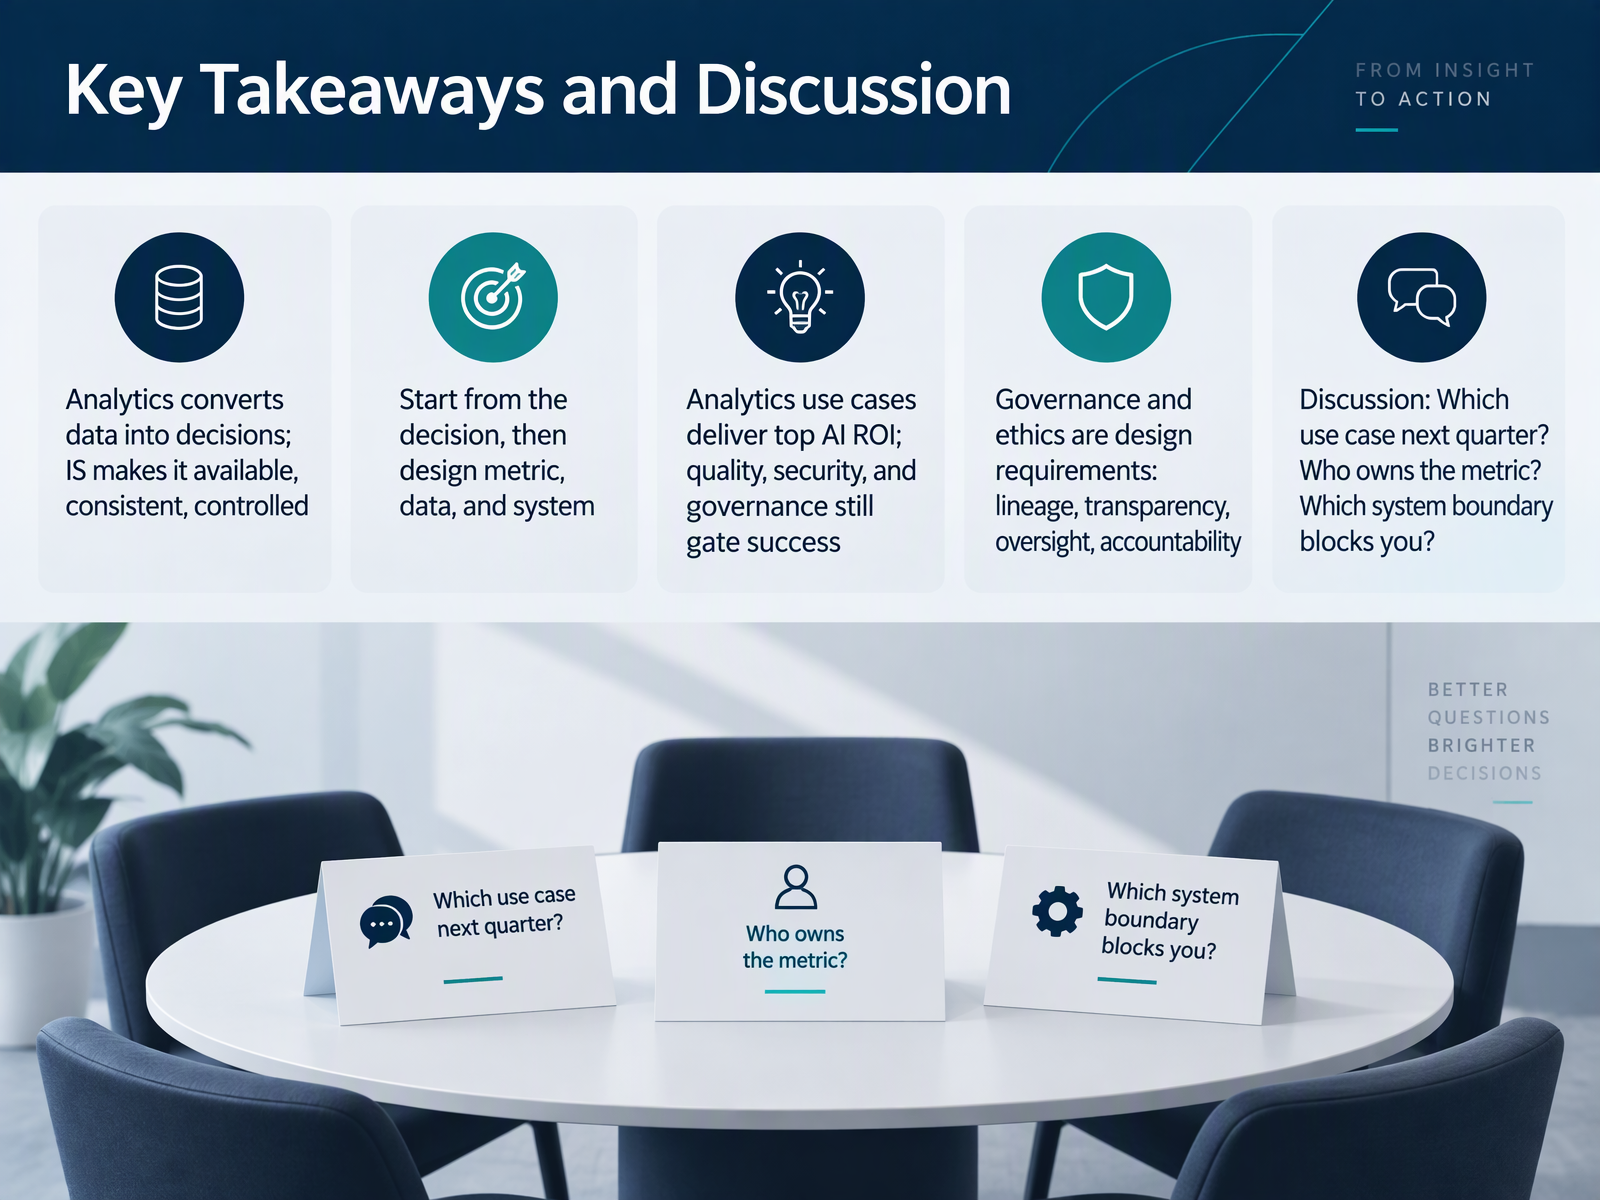
- 14Key Takeaways and DiscussionLet's bring this together. Analytics converts data into decisions, while information systems make that data available, consistent, and controlled. So start from the decision, then design the metric, the data, and the system behind it. In most cases, analytics use cases deliver the highest return on AI investment, but quality, security, and governance still determine whether they succeed. Treat governance and ethics as design requirements, not add-ons: lineage, transparency, oversight, and accountability. Before you close, take these three questions into your next planning session. Which use case will you pursue next quarter? Who owns the metric? And which system boundary is blocking you today? Thank you for working through this material with me. Pick one concrete next step, bring it to your team, and keep building on the fundamentals. You are well positioned to do it.
 gartner.comstrategy.comsapinsider.org+21 min
Take the deck with you
Download this course as a file — free, no sign-up needed.
- PDF handoutEvery slide page, ready to print or share.15 pages · 3.1 MBDownload
- Narrated PowerPointThe deck that presents itself — every slide carries the digital human's narration video.15 pages · 15.0 MBDownload
- PowerPoint slidesThe full deck as a .pptx — open it in PowerPoint, Keynote, or Google Slides.15 pages · 3.0 MBDownload
Free to use in your own training — please keep the PersonWise credit page at the end.
Have your own deck? Turn it into a course
Sources consulted
Web sources consulted while building this course.
- Business Analytics vs. Information Systems: What’s the Difference? — online.uc.edu
- Exploring What is the Difference Between Business Analytics and Information Systems — businesssystemstoday.com
- Prescriptive analytics systems revised: a systematic literature review from an information systems perspective | Information Systems and e-Business Management | Springer Nature Link — link.springer.com
- Reconciling business intelligence, analytics and decision support systems: More data, deeper insight — sciencedirect.com
- Information systems | IEEE Technology Navigator — technav.ieee.org
- CDAO Agenda Survey 2026: Analytics Use Cases Deliver the Highest ROI on AI — gartner.com
- The State of AI+BI Analytics Global 2025 Report — strategy.com
- Enterprise Data and Analytics in the Era of AI — sapinsider.org
- Salesforce Reveals Data and Analytics Trends for 2026 - Salesforce — salesforce.com
- Data, BI and Analytics Trend Monitor 2026 — pages.barc.de
- Data Warehouses vs. Data Lakes vs. Data Lakehouses | IBM — ibm.com
- What is a Data Lake? Data Lake vs. Warehouse | Microsoft Azure — azure.microsoft.com
- COMPARISON OF DATA STORAGE TECHNOLOGIES: DATA LAKE, DATA WAREHOUSE (DWH), AND DATA LAKEHOUSE — doi.org
- Data Warehouse vs. Data Lake vs. Data Lakehouse: Key Differences & How to Choose | KNIME — knime.com
- What is a data lakehouse? | Databricks on AWS — docs.databricks.com
- Technical Toolkit: Data Management Reference Architecture — gartner.com
- What Belongs in a Modern Data Platform in 2026: A Reference Architecture for Engineers — bigdataboutique.com
- Databricks reference architectures (download) | Databricks on AWS — docs.databricks.com
- Modern Data Platform Architecture | Yukon Labs — yukon.az
- The modern data stack, end to end | BASH Consultants — bash-365.com