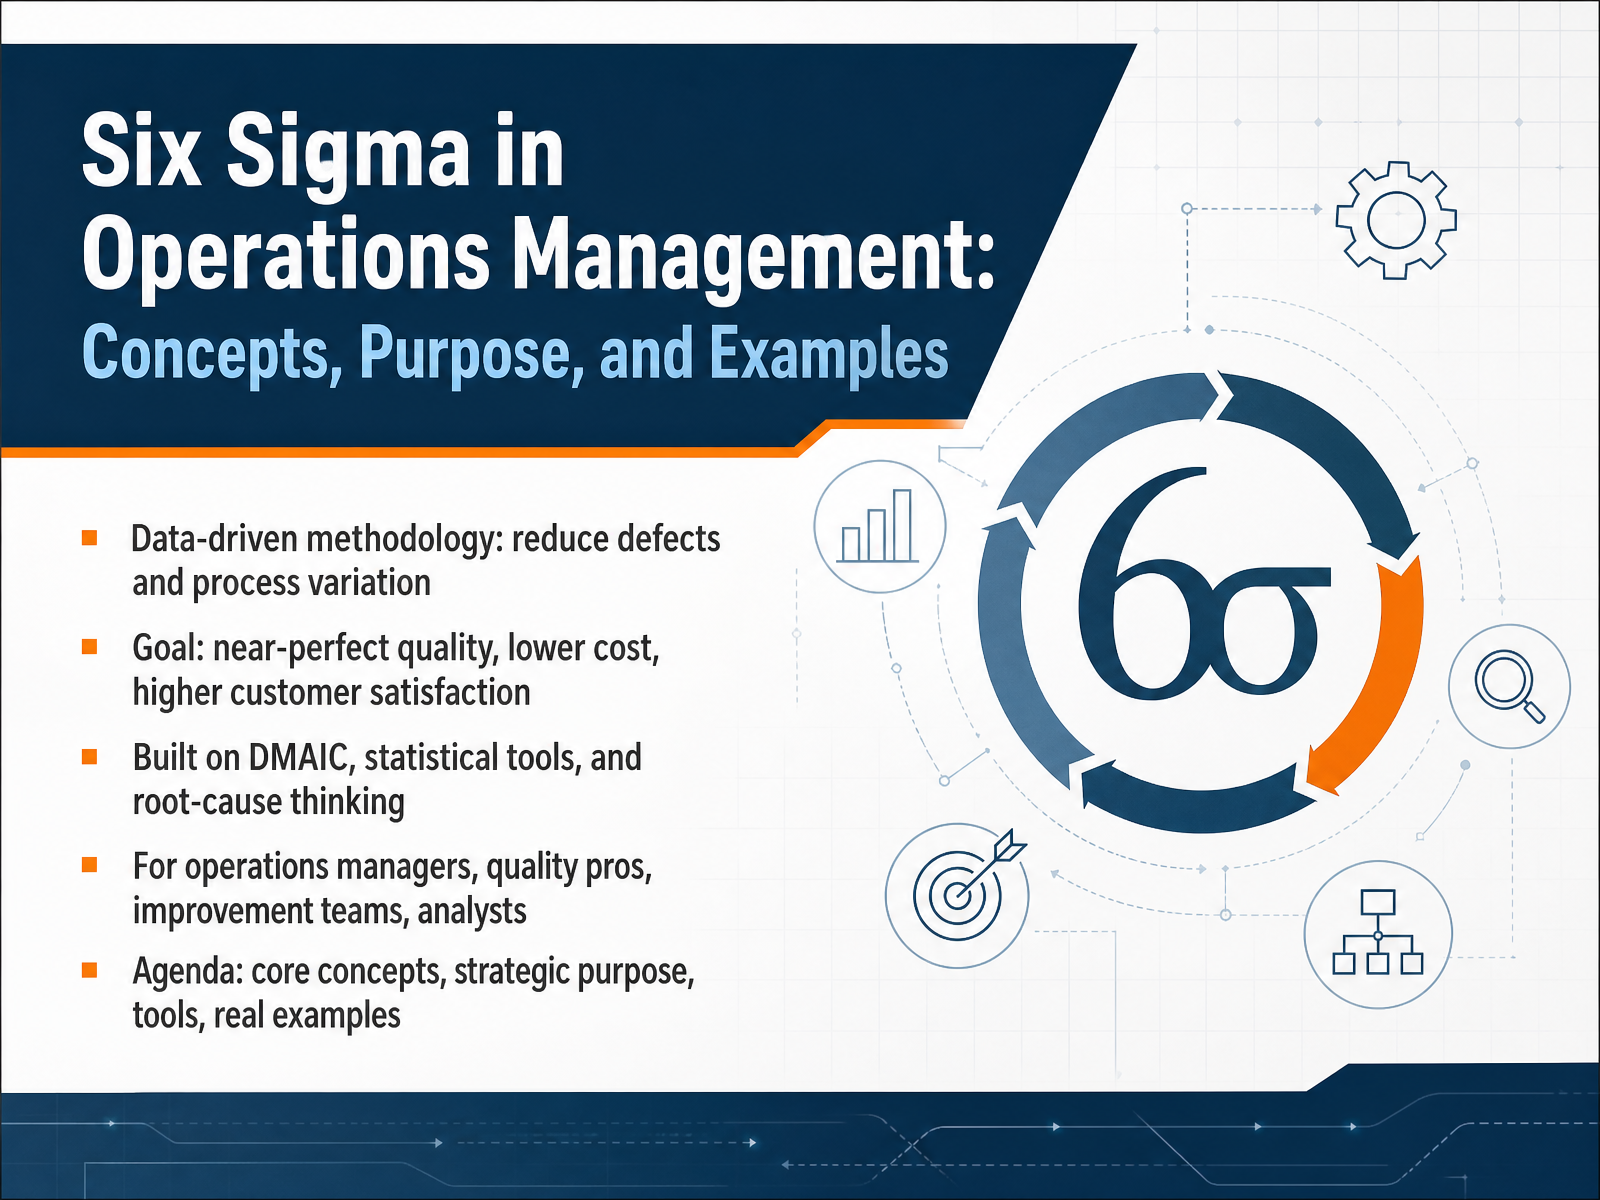
Six Sigma in Operations Management
Begin
14 pages · ~28 min
Six Sigma in Operations Management
This Six Sigma course teaches operations professionals the core concepts and purpose of Six Sigma, with practical examples for improving process quality and efficiency.
What you’ll learn
- 01Six Sigma in Operations Management: Concepts, Purpose, and ExamplesWelcome. In this course, we'll look at Six Sigma in operations management, focusing on concepts, purpose, and real examples you can use.
If you own a process, you already know the problem. Defects, rework, and variation quietly drain capacity and margin, even when the average looks acceptable. Six Sigma is a data-driven method for reducing that variation and the defects it causes, with a goal of near-perfect quality, lower cost, and higher customer satisfaction.
The method rests on DMAIC, a structured five-phase cycle, supported by statistical tools and root-cause thinking. It's built for operations managers, quality professionals, improvement teams, and analysts.
Across the next slides, we'll cover core concepts, strategic purpose, tools, and real examples. As we go, connect each idea to your own process data and improvement goals.
Let's begin with the background and evolution.knowledgehut.comasq.orgonlinelibrary.wiley.com+21 min
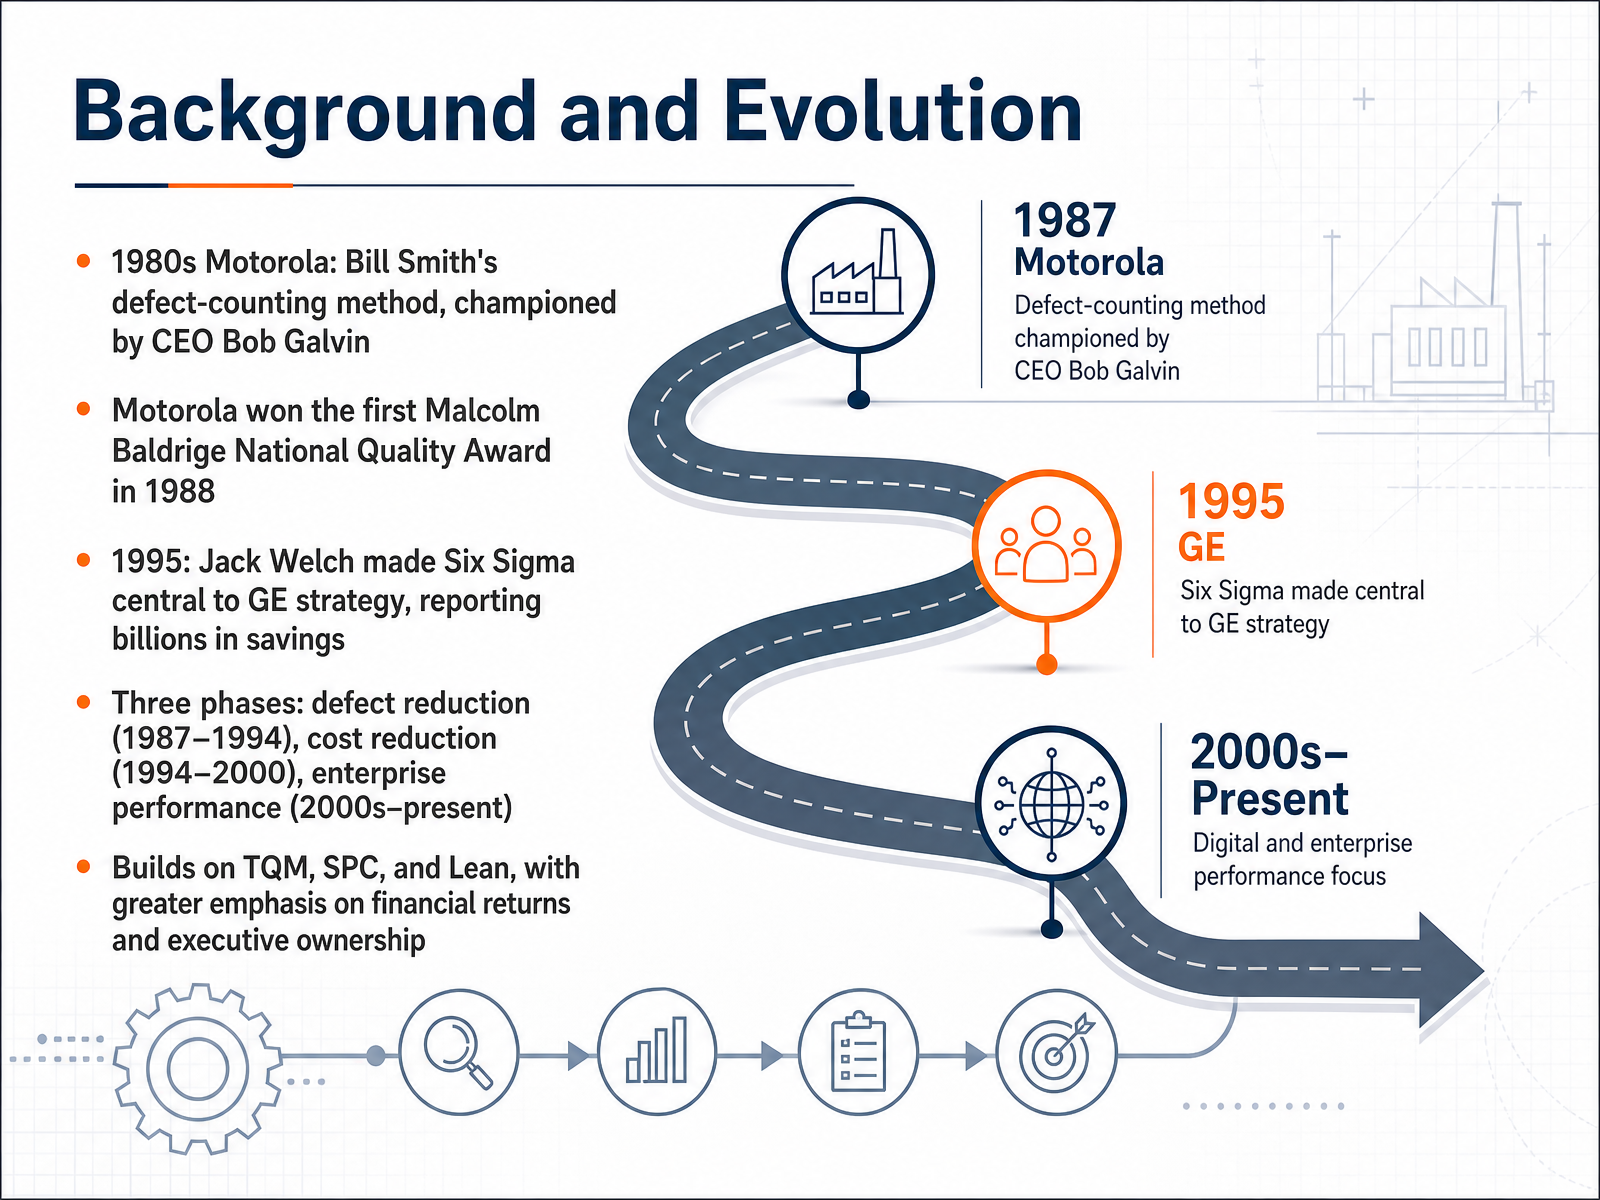
- 02Background and EvolutionLet's look at where Six Sigma came from, because the history explains why it works the way it does. In the mid nineteen eighties, Motorola was losing market share to Japanese competitors with far lower defect rates. A senior engineer, Bill Smith, argued that final product testing was missing the real problem: variation earlier in the process. He proposed counting defects per million opportunities, and CEO Bob Galvin made it a company goal. Motorola won the first Malcolm Baldrige National Quality Award in nineteen eighty eight. Then in nineteen ninety five, Jack Welch made Six Sigma central to General Electric's strategy. GE reported billions in savings, and adoption spread fast. The evolution moved through three phases: defect reduction, then cost reduction, then enterprise performance across the whole business. Six Sigma builds on total quality management, statistical process control, and Lean, but it adds something important: executive ownership and a hard link to financial returns. So as we go deeper, keep asking how this applies to your own process data and improvement goals. Next, we'll walk through the core methodology, DMAIC and DFSS.
 doi.orgweb.tecnico.ulisboa.ptweb.ist.utl.pt+22 min
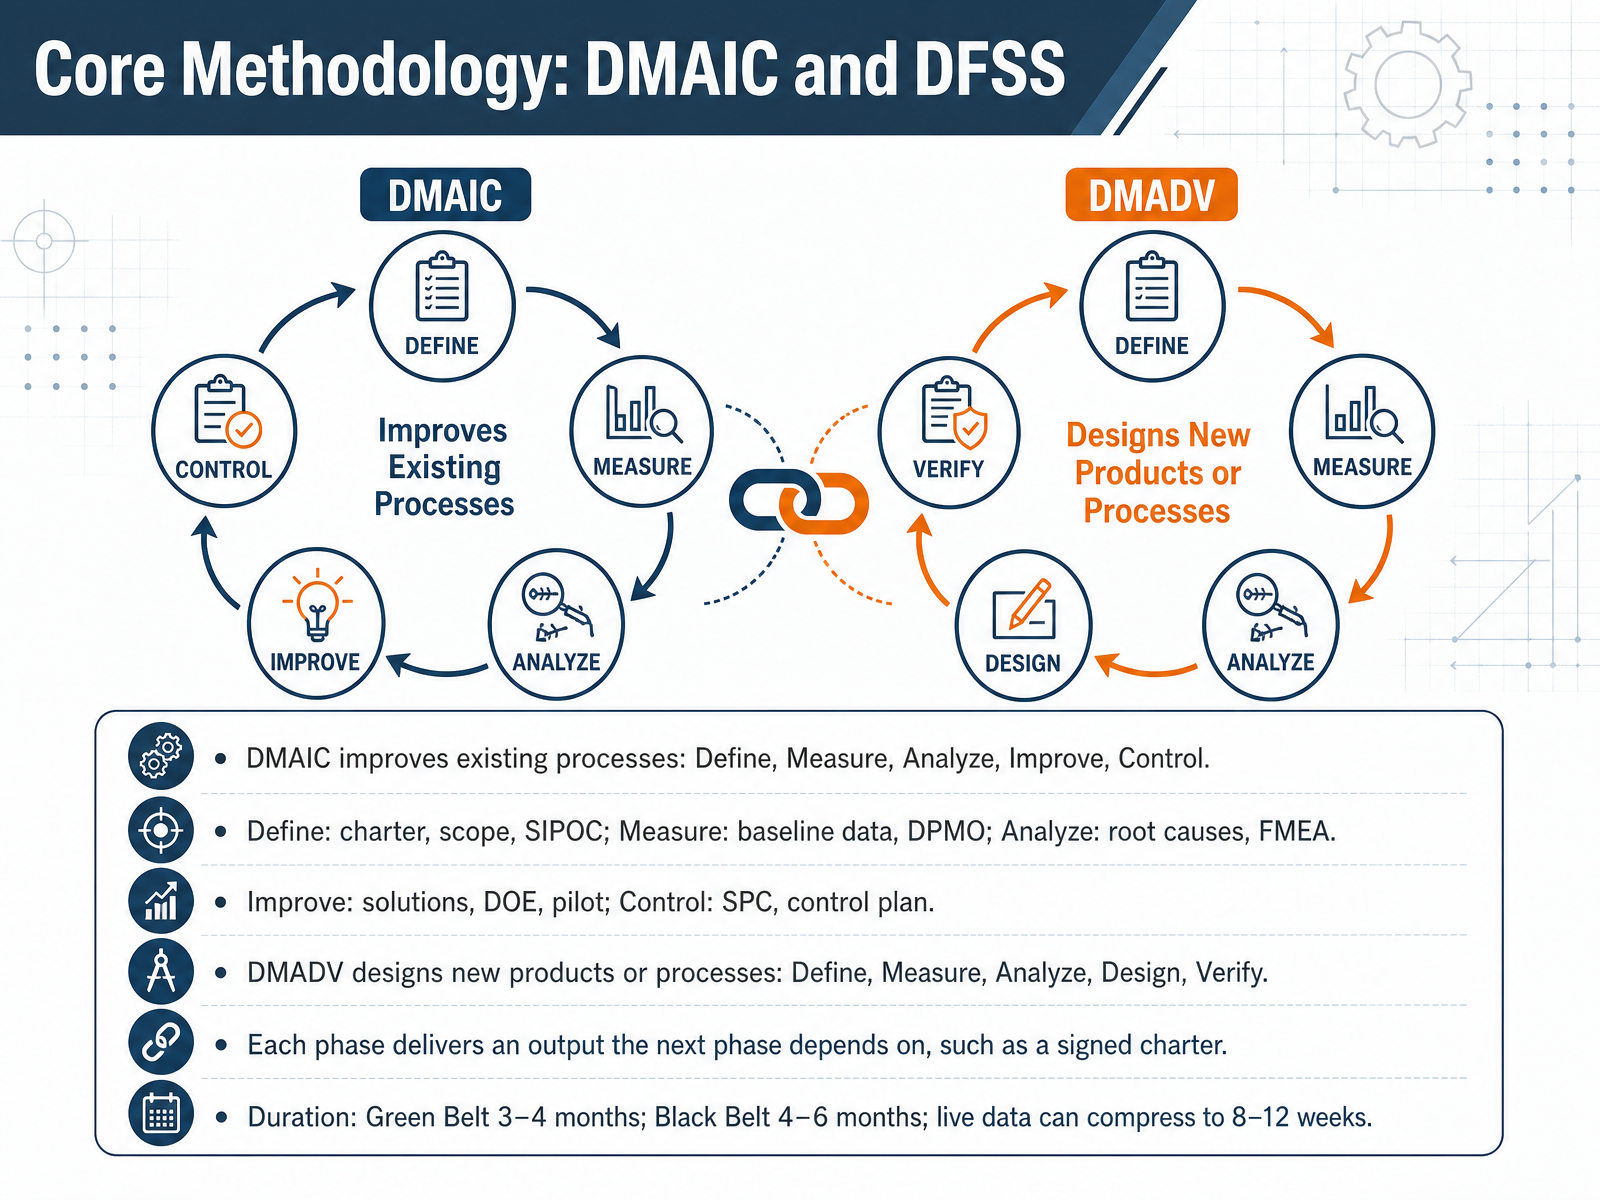
 - 03Core Methodology: DMAIC and DFSSLet's move from purpose to method. Six Sigma gives you two disciplined toolkits. DMAIC improves a process you already run. Define sets the charter, scope, and SIPOC. Measure locks in baseline data, including DPMO. Analyze finds root causes using tools like FMEA. Improve tests solutions through Design of Experiments and a pilot. Control holds the gain with Statistical Process Control and a control plan. Notice the dependency chain. Each phase delivers something the next one needs, such as a signed charter or a validated baseline. When you are creating something new, you use DFSS. Its most common form is DMADV: Define, Measure, Analyze, Design, and Verify. Keep the timelines realistic. A Green Belt project typically runs three to four months. A Black Belt project runs four to six months. With live process data, teams often compress that to eight to twelve weeks. So ask yourself, which framework fits your current problem? Next, we will quantify the results. Let's look at Key Metrics: DPMO, Sigma Level, and Process Capability.
 asq.orgisixsigma.comisixsigma.com+22 min
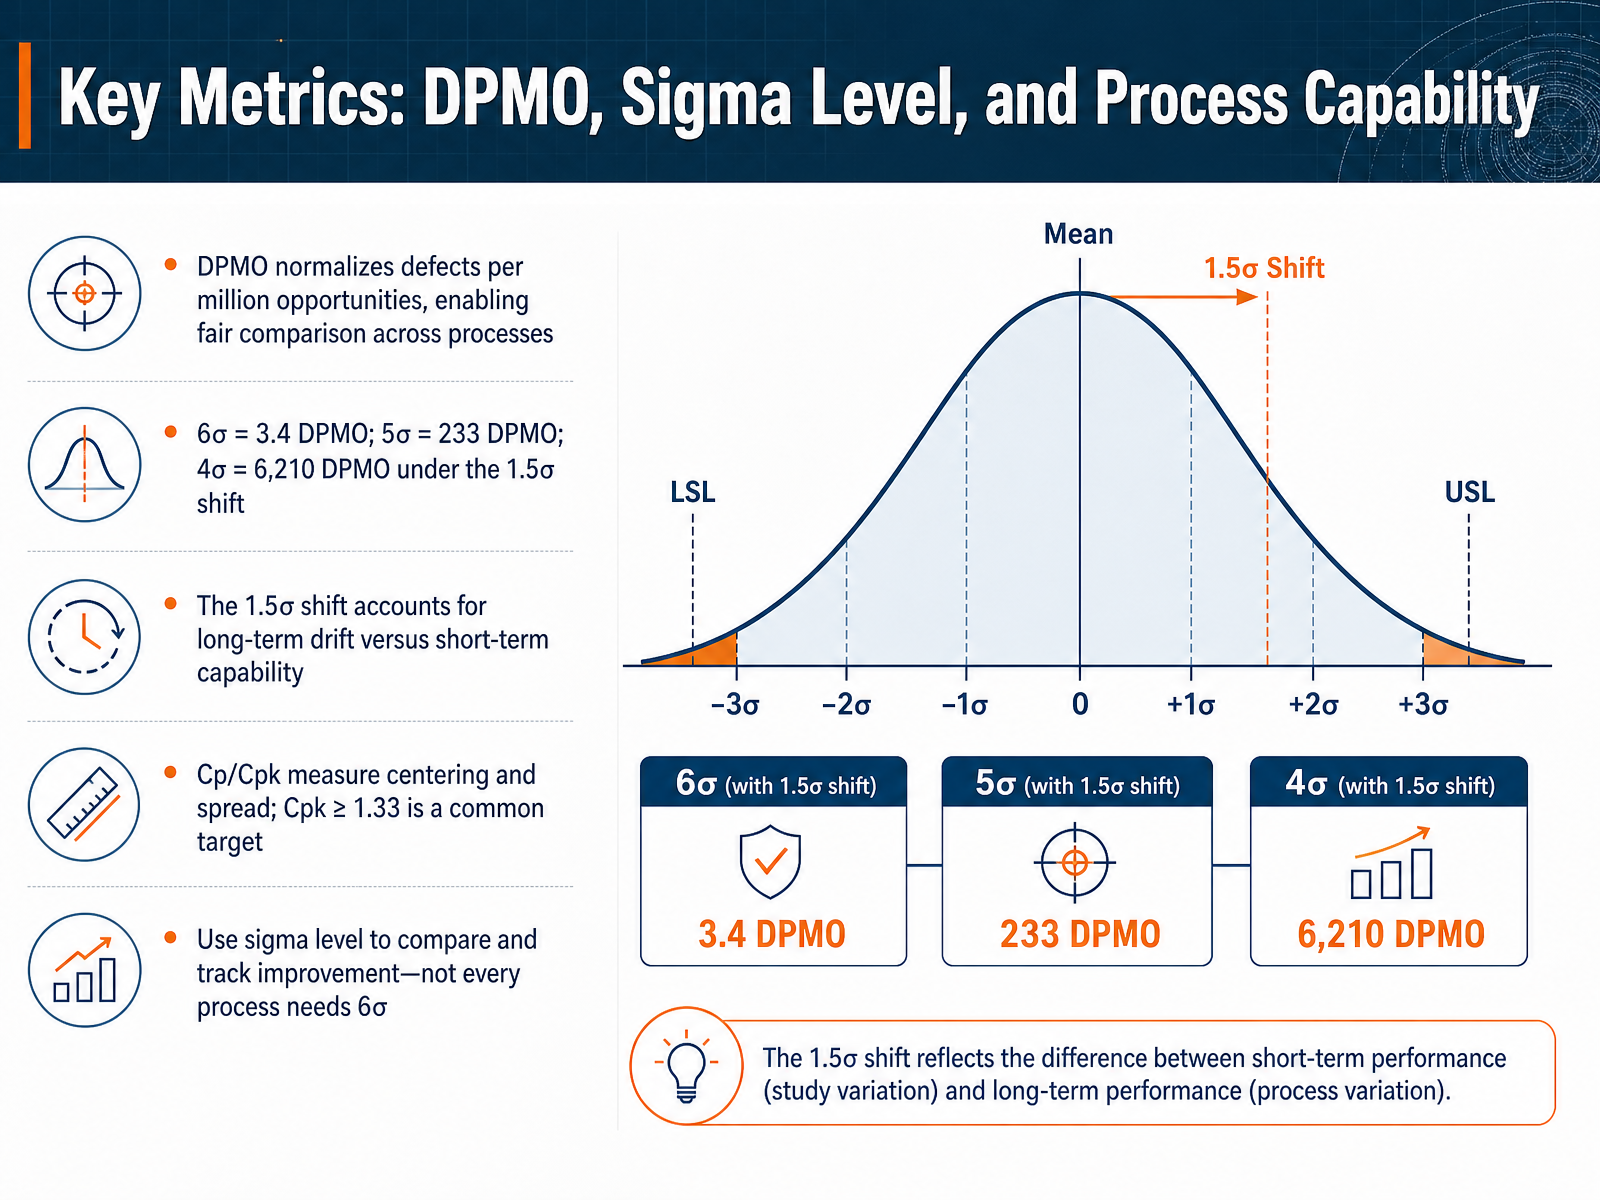
 - 04Key Metrics: DPMO, Sigma Level, and Process CapabilityLet's look at the numbers you will actually report. Defects per million opportunities, or D P M O, normalizes defects against the number of chances to fail. That makes comparison fair across processes. Under the conventional one point five sigma shift, six sigma equals three point four D P M O. Five sigma equals two hundred thirty-three. Four sigma equals six thousand two hundred ten. That shift accounts for long-term drift you see in real operations, not just short-term capability. Then we have process capability. Capability index C p measures spread against specifications. C p k also reflects centering, and a common minimum target is one point three three. Use sigma level to compare and track improvement. Not every process needs six sigma. As you review your own dashboard, ask which of these metrics best reflects customer requirements. Coming up next, Lean versus Six Sigma, complementary operational tools.
 knowledgehut.comasq.orgonlinelibrary.wiley.com+21 min
 - 05Lean vs. Six Sigma: Complementary Operational ToolsNow let's separate the two toolkits, because they solve different problems. Lean removes waste and speeds flow. Think value stream maps, kanban, five S, standard work. Six Sigma reduces defects and variation, using control charts, capability studies, and designed experiments. Here is the practical distinction. Lean attacks time problems. Six Sigma attacks variation problems. In your operation, a process can be fast and wrong, or right and slow, and most processes are a mix of both. That is why Lean Six Sigma combines the two. It is one of the reasons the distinction between them has blurred over the years, since improvement work usually requires both. One more contrast worth noting. Lean tools are largely visual, so they engage the floor quickly. Six Sigma leans on data and statistics, which makes the gains measurable and defensible. A quick example. In a cell, Lean would cut the travel and waiting time between steps. Six Sigma would then tighten the process spread, so the output consistently meets specification. One improves speed and flow. The other improves consistency and capability. Ask yourself which problem dominates in your own process data right now, delays or defects. That tells you where to start. Next, we look at the business case behind all of this in Strategic Purpose and Business Value.
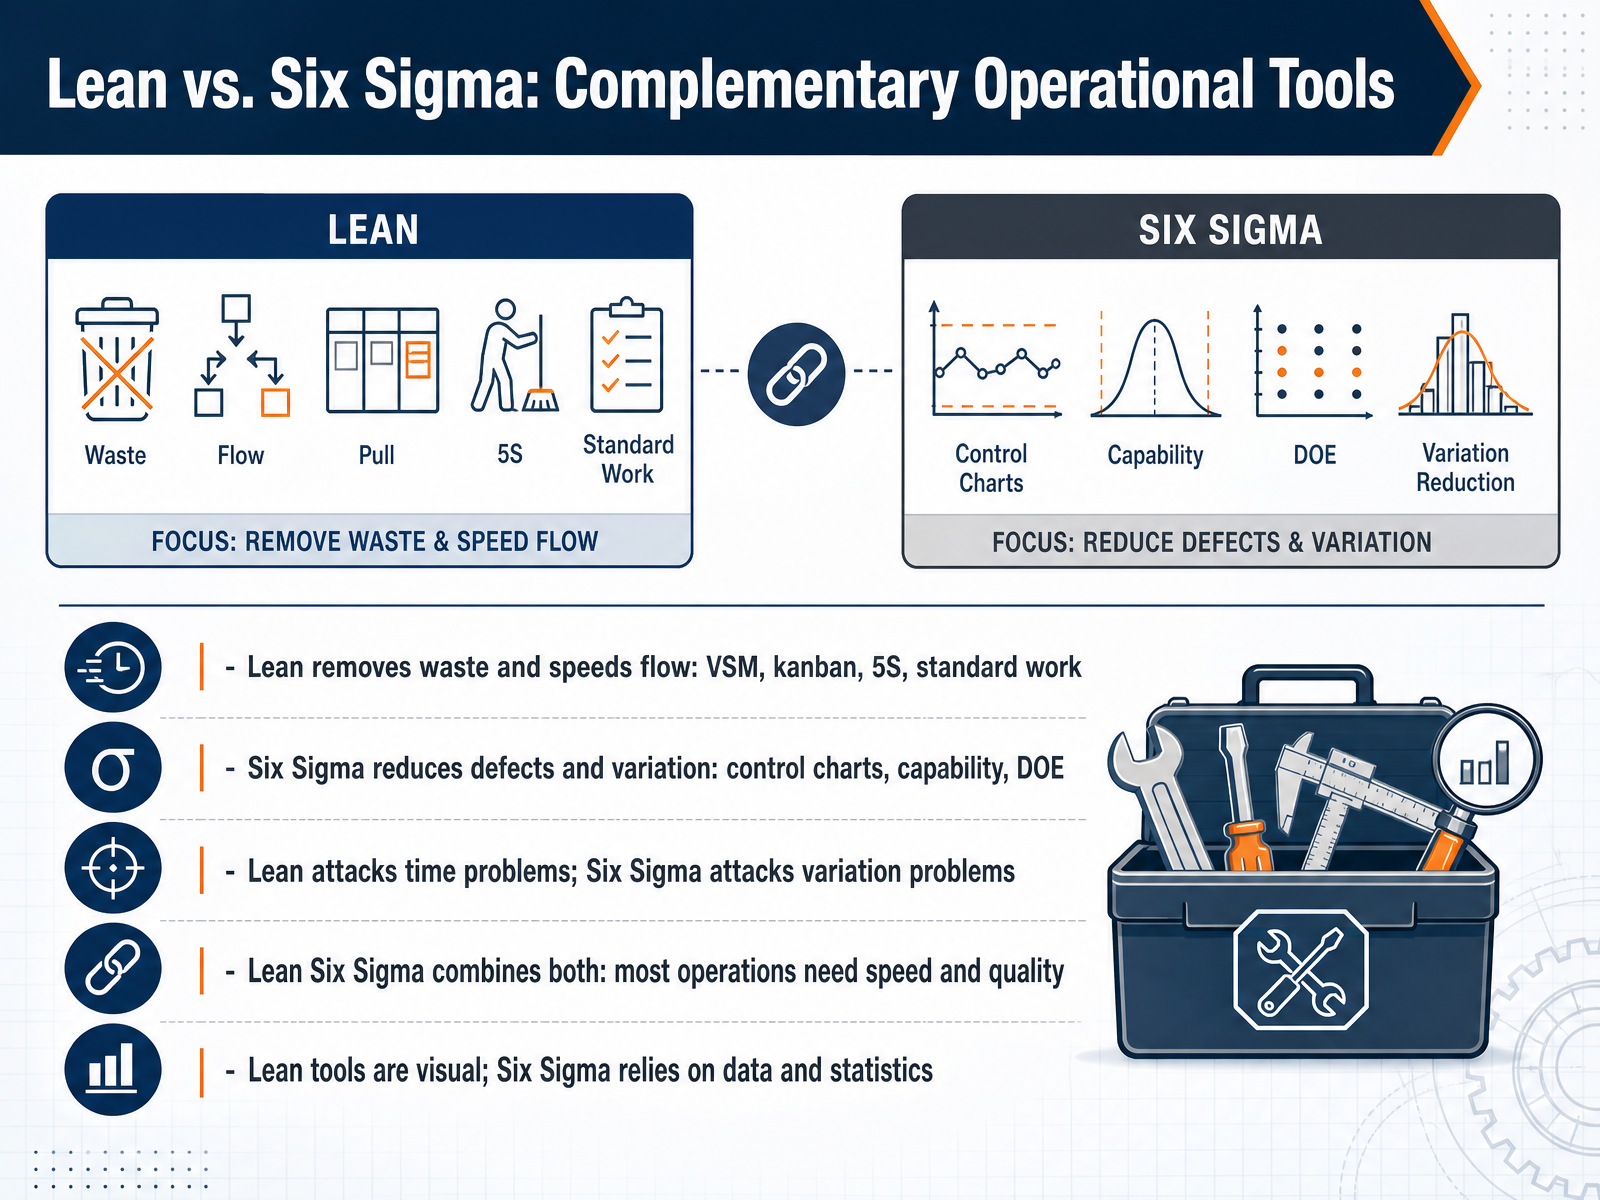 knowledgehut.comasq.orgonlinelibrary.wiley.com+22 min
 - 06Strategic Purpose and Business ValueLet's turn to the strategic purpose and business value of Six Sigma. The payoff shows up in three places: lower rework, a lower cost of poor quality, and shorter cycle times. Motorola, where this method began, reports more than sixteen billion dollars in cumulative savings. General Electric captured twelve billion dollars in five years. And research from the American Society for Quality found average savings of one point seven percent of revenue, with more than two dollars returned for every dollar invested. Two cautions. First, gains take time, often more than a year before they are measurable. Second, balance operational, financial, and customer metrics, not just return on investment. So ask yourself, what would one point seven percent of your revenue mean? Next, we look at Operational Roles and Governance.
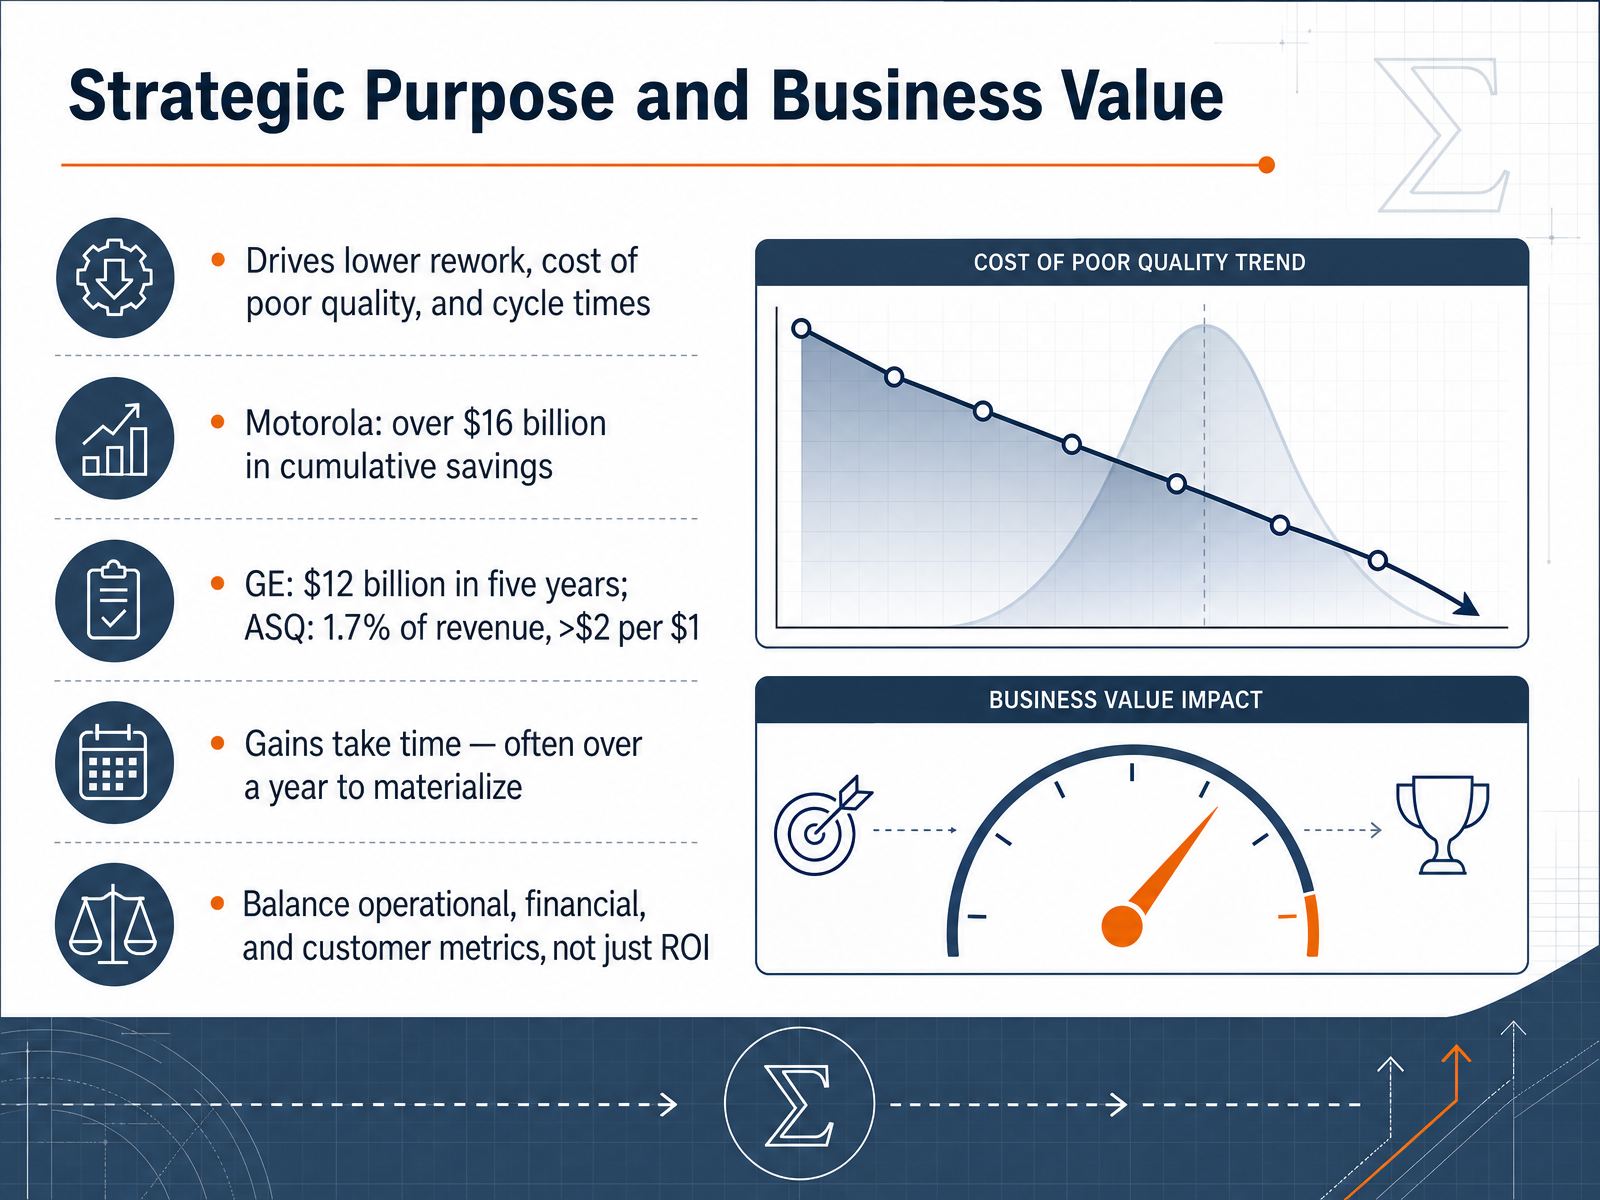 asq.orgonlinelibrary.wiley.comisixsigma.com+21 min
 - 07Operational Roles and GovernanceNow let's talk about operational roles and governance. Because Six Sigma is a team discipline, not an individual one. The belt hierarchy runs from Champion, through Master Black Belt, Black Belt, and Green Belt, down to Yellow Belt. The Champion is your strategic sponsor. They select projects, remove roadblocks, and are not a certified Belt. Black Belts lead DMAIC full time. Green Belts split their time, roughly twenty to fifty percent. Governance holds this together: steering committees, tollgate reviews, charters, and RACI matrices. In practice, three failures stall projects most often. A missing process owner. Vague authority. And overloaded Green Belts. Expect your Champion to invest two to three hours a month, and a sponsor about two hours a week. The takeaway: define roles and decision rights before the first tollgate. Next, we move into Key Operational Tools and Techniques.
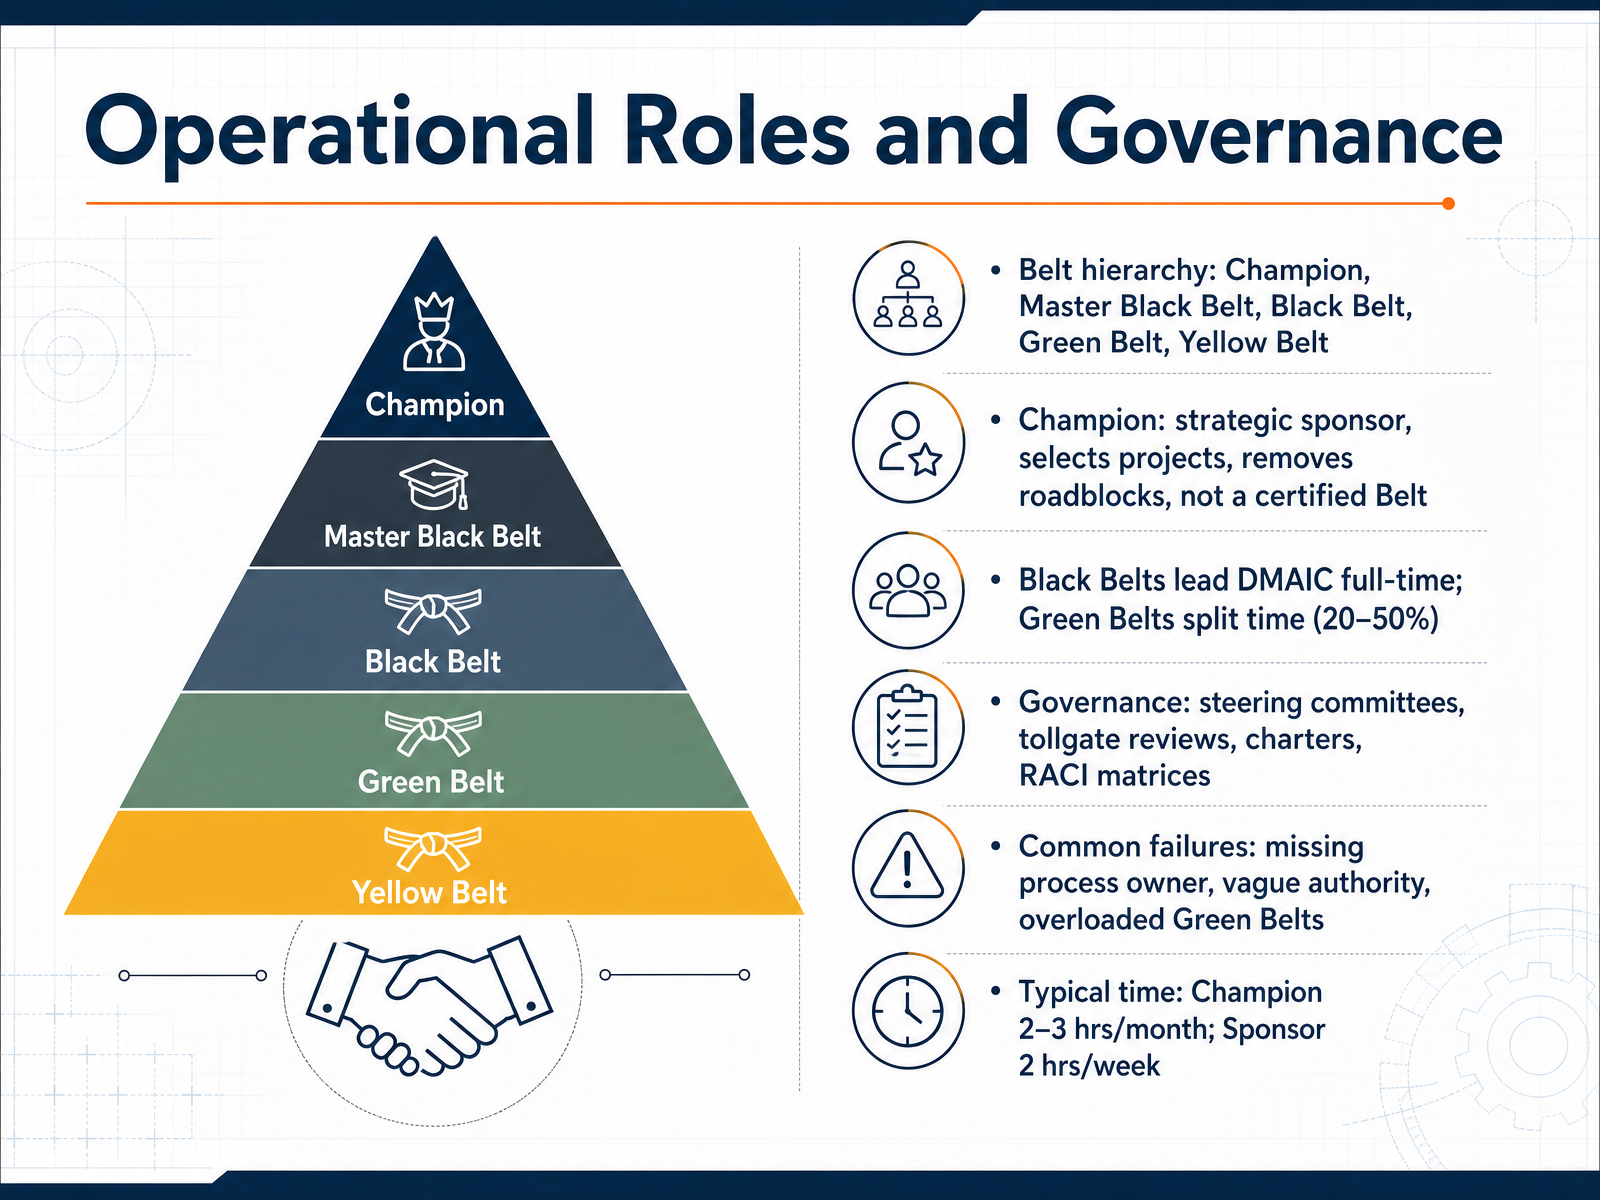 2 min
2 min - 08Key Operational Tools and TechniquesLet's talk about the tools you will actually use, and how to choose them. The governing principle is simple. Pick the tool by the D M A I C phase and by the question you are trying to answer. In Define, you establish the customer requirement and draw the boundary. Voice of the Customer, the C T Q tree, the project charter, and SIPOC do that work. In Measure, you build a defensible baseline. Process mapping, check sheets, Gage R and R, histograms, and D P M O. Note the order. If the gage contributes more than thirty percent of observed variation, fix the measurement system before you chart anything. In Analyze, you separate the vital few from the trivial many. Pareto ranks the defects, fishbone sweeps the causes, five Whys drives to the root, and F M E A with its risk priority number handles risk before it becomes a failure. In Improve, D O E tests several settings at once, poka-yoke error-proofs the step, and kaizen events or pilots validate the fix. In Control, S P C charts, control plans, standard operating procedures, and reaction plans hold the gain. Same discipline every time. Which tool answers your question right now? Next, we'll walk through a defect reduction project end to end.
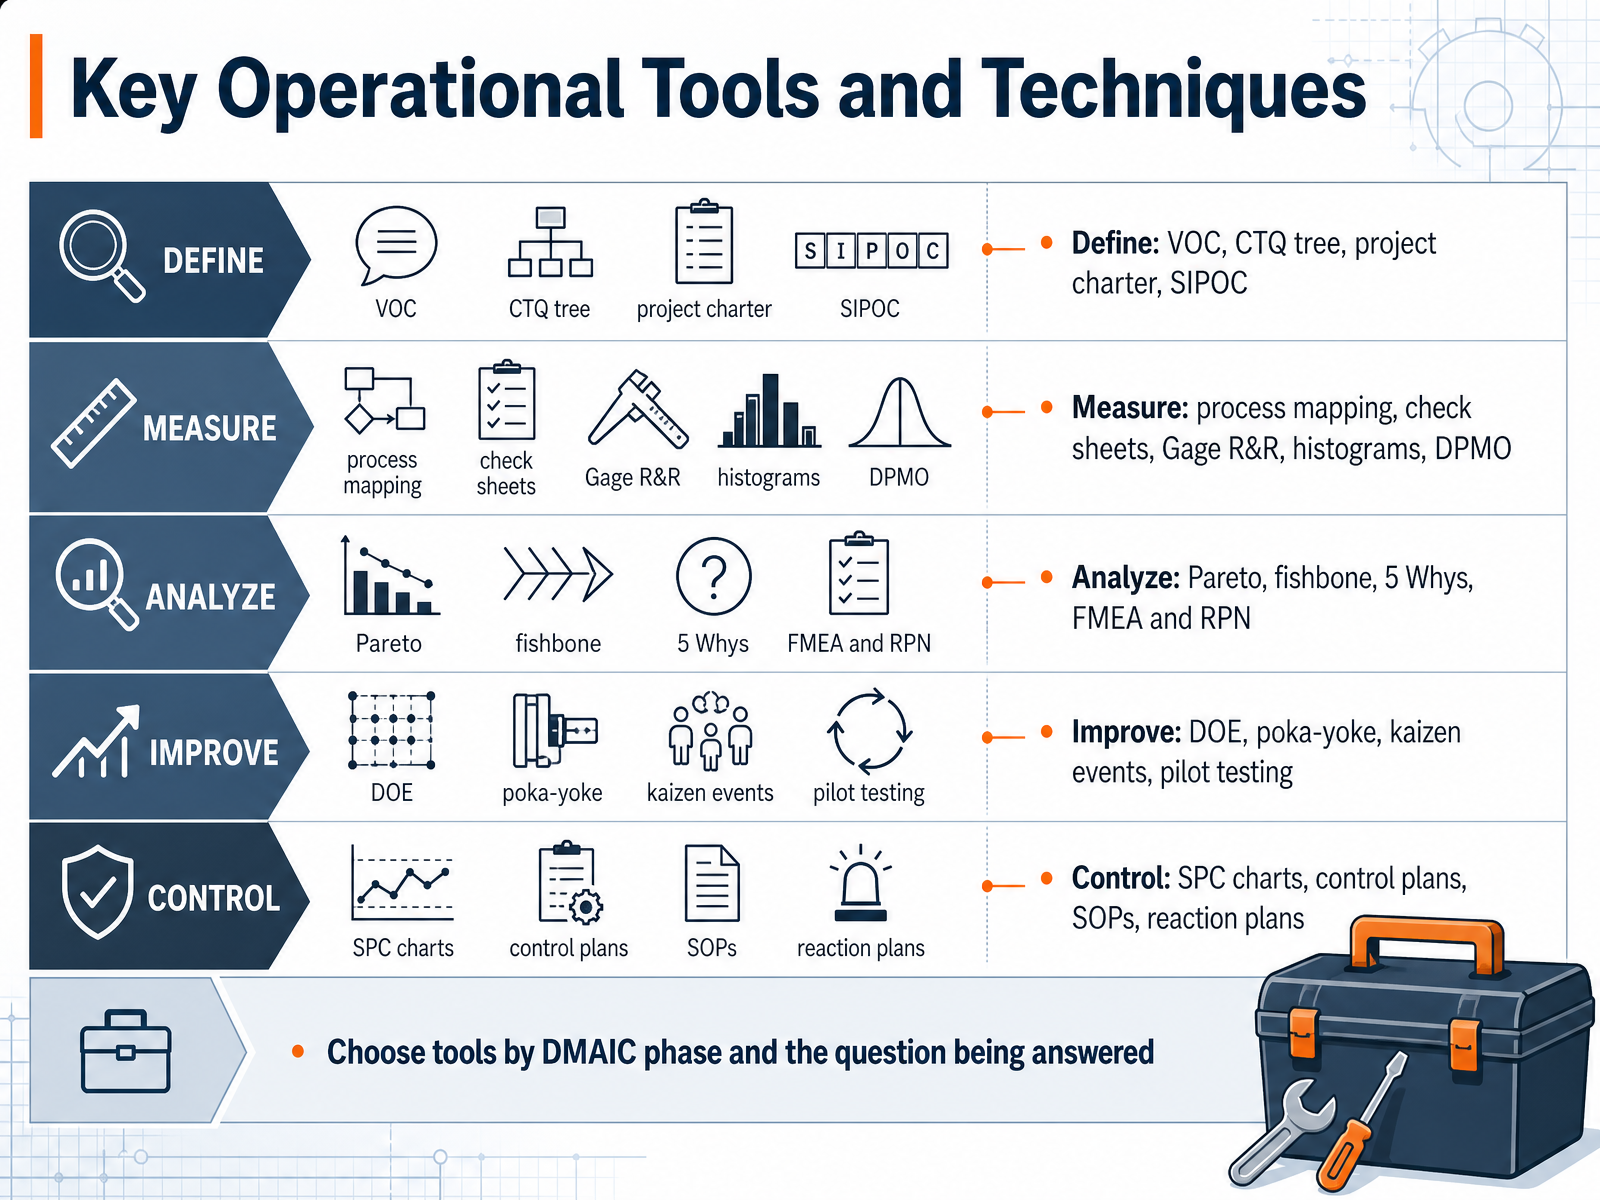 2 min
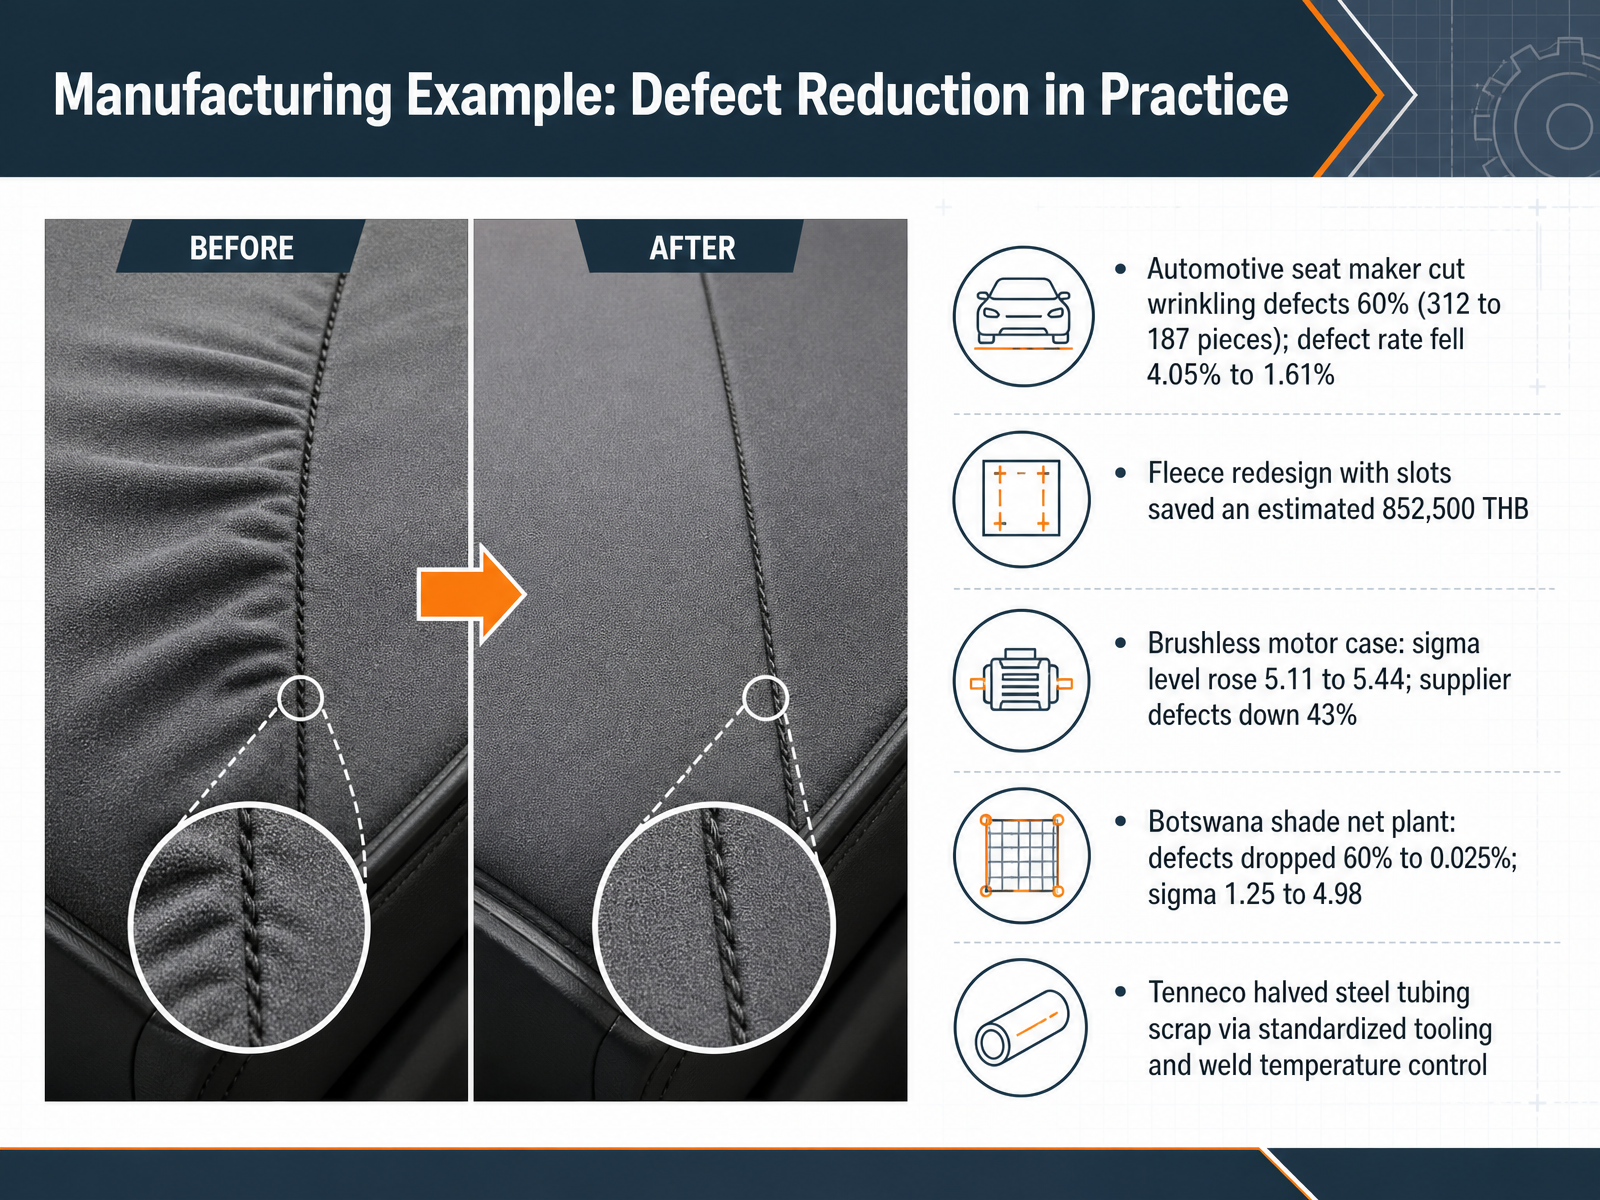
2 min - 09Manufacturing Example: Defect Reduction in PracticeLet's move from method to results. Here is what defect reduction looks like in real plants. An automotive seat maker attacked rear cushion wrinkling. The root cause was excessive tension in the listing fleece, especially on curved sections. They redesigned the fleece with rectangular slots, and wrinkling defects dropped sixty percent, from three hundred twelve pieces to one hundred eighty-seven. The defect rate fell from about four percent to one point six one percent. Estimated savings: eight hundred fifty-two thousand five hundred Thai baht. Notice what changed. Design, not inspection. In a brushless motor case, sigma level rose from five point one one to five point four four, and supplier defects fell about forty-three percent. A Botswana shade net plant used design of experiments on thread tensile strength. Defects dropped from sixty percent to two hundredths of one percent, and sigma moved from one point two five to four point nine eight. Tenneco halved steel tubing scrap through standardized tooling and weld temperature control. The pattern is consistent. Measure the defect, find the dominant variable, control it, and hold the gain. Now ask the same question about your own line: which single variable, if controlled, would move your defect rate most? Next, we shift from the factory floor to service and transactional work: Service and Transactional Example: Reducing Resolution Time.
 2 min
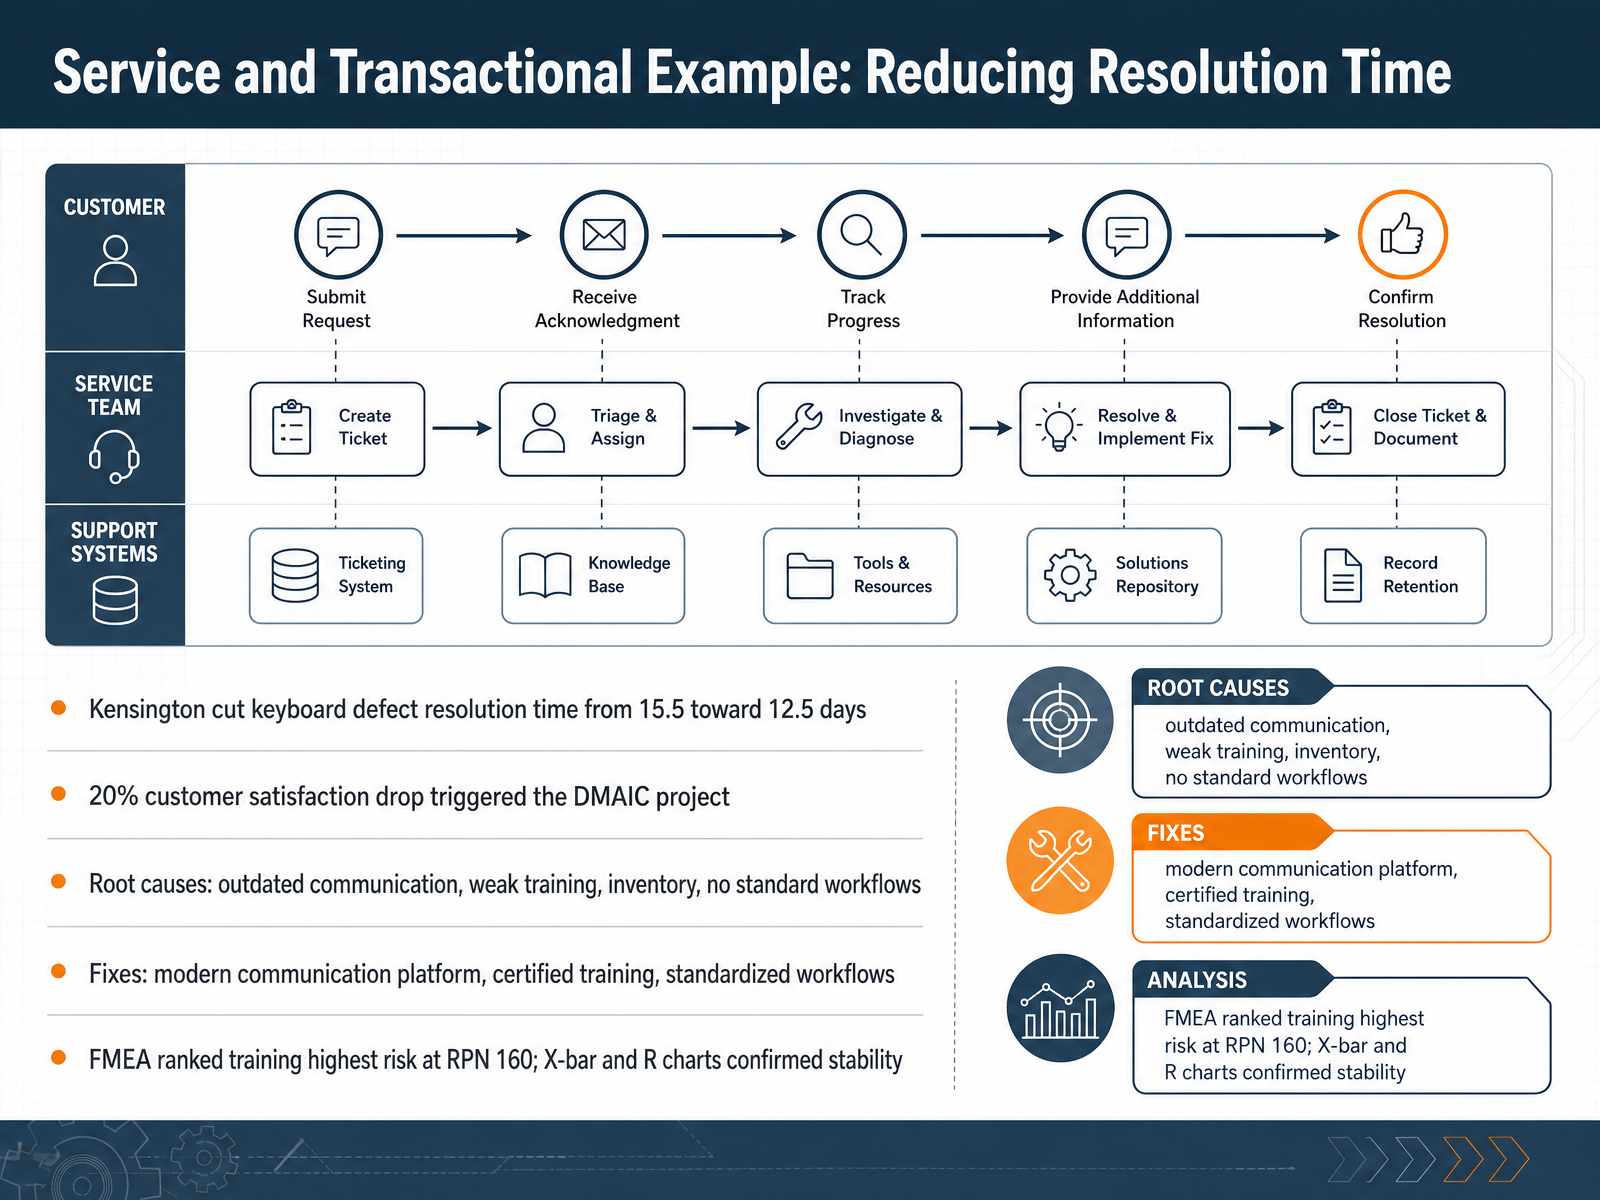
2 min - 10Service and Transactional Example: Reducing Resolution TimeNow let's look at how this plays out in a service and transactional process. Kensington, a manufacturer of wireless handheld keyboards, was resolving key malfunction defects in an average of fifteen and a half days. The target was twelve and a half days. That gap contributed to a twenty percent drop in customer satisfaction. A DMAIC project was launched to close it. Root cause analysis pointed to outdated communication methods, insufficient employee training, weak inventory management, and no standardized workflows. The team deployed a modern communication platform to reduce handoffs, introduced certified training programs to build skills, and established standard workflows. FMEA ranked the training gap as the highest risk area with a risk priority number of one hundred sixty, which made it the first priority. Control phase X bar and R charts confirmed the process was stable after the changes. The lesson here is that the biggest gains often come from process discipline, not new equipment. Ask yourself, what is your resolution time or cycle time, and how much variation is costing you? Next, we move into implementation considerations.
 2 min
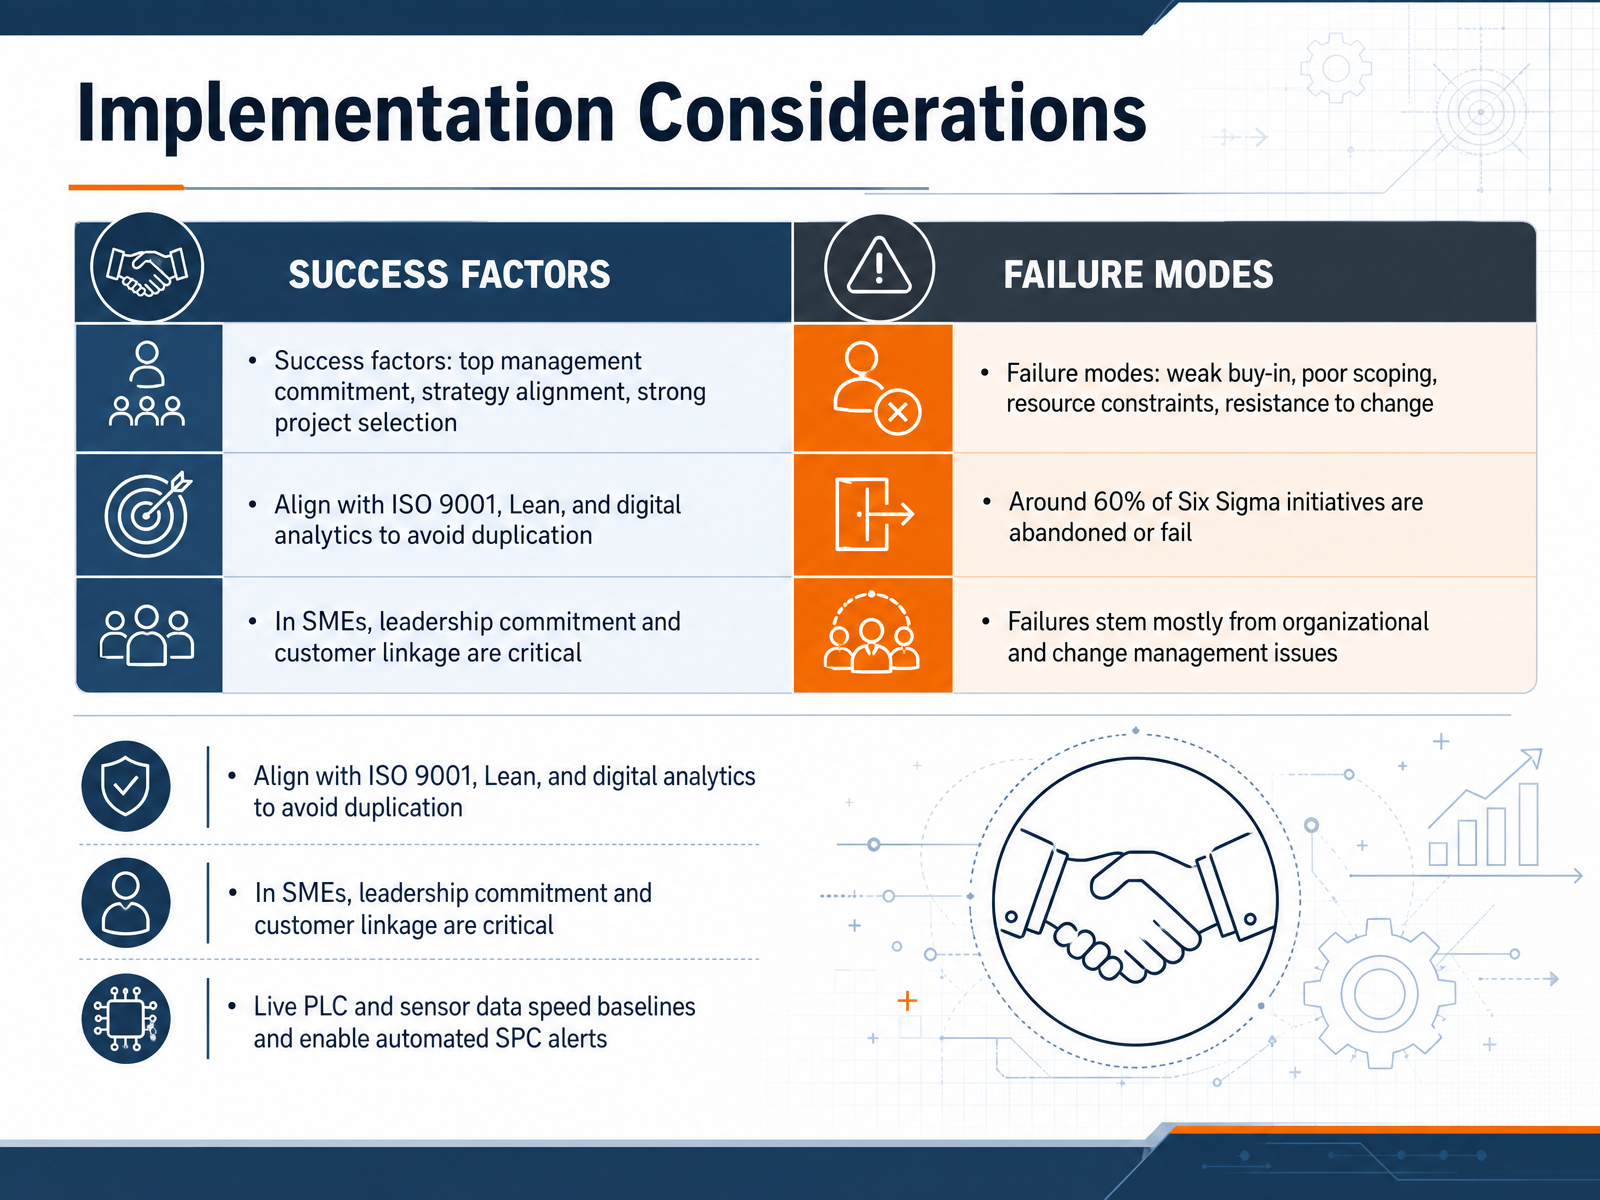
2 min - 11Implementation ConsiderationsLet's talk about what actually determines whether Six Sigma succeeds or fails in your operation. Around sixty percent of initiatives are abandoned, and the evidence shows most failures are organizational, not statistical. Top management commitment, alignment to strategy, and disciplined project selection drive success. The common failure modes are weak buy-in, poor scoping, resource constraints, and resistance to change. So select projects tied to customer requirements and measurable defect reduction. Then align Six Sigma with ISO 9001, Lean, and your digital analytics to avoid duplicated effort. In smaller enterprises, leadership commitment and a clear customer linkage matter even more. And if you have live PLC and sensor data, use it to establish baselines faster and trigger automated S P C alerts. Think about your own portfolio, your data, and your improvement goals. Next, we move to Measuring and Sustaining Results.
 1 min
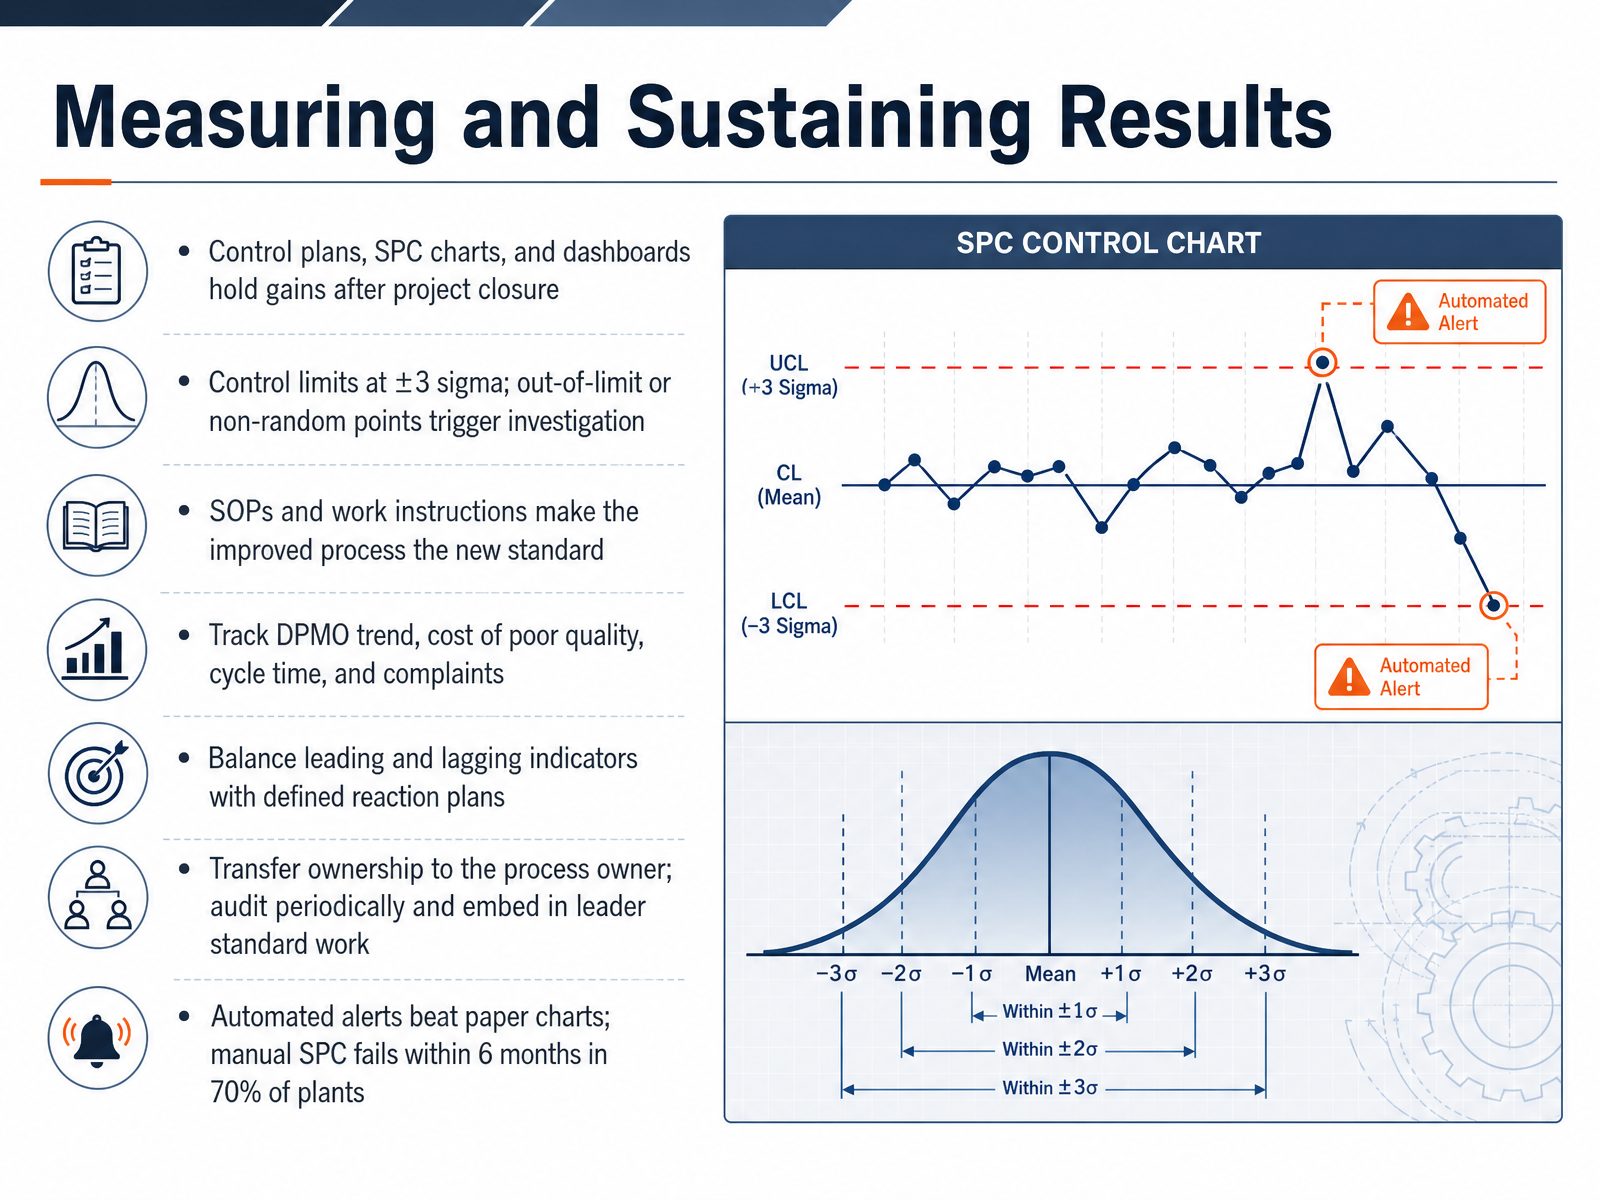
1 min - 12Measuring and Sustaining ResultsSo, how do you actually hold the gains after the project closes? That is where control plans, SPC charts, and dashboards come in. Control limits sit at plus or minus three sigma. If a point falls outside the limits, or shows a non-random pattern, you investigate. Don't wait for the next review cycle. Standard operating procedures and work instructions turn the improved process into the new standard, so new hires run it the same way your best operators do. Then track the vital few: defects per million opportunities, cost of poor quality, cycle time, and complaints. Balance leading and lagging indicators, and define reaction plans in advance. Who gets called? What happens to the product? Transfer ownership to the process owner, audit periodically, and embed those checks in leader standard work. One practical note: automated alerts beat paper charts. Manual SPC fails within six months in roughly seventy percent of plants. Before we move on, ask yourself which single metric would give you the earliest warning of drift in your process. Next, let's look at practical strategies and next steps.
 2 min
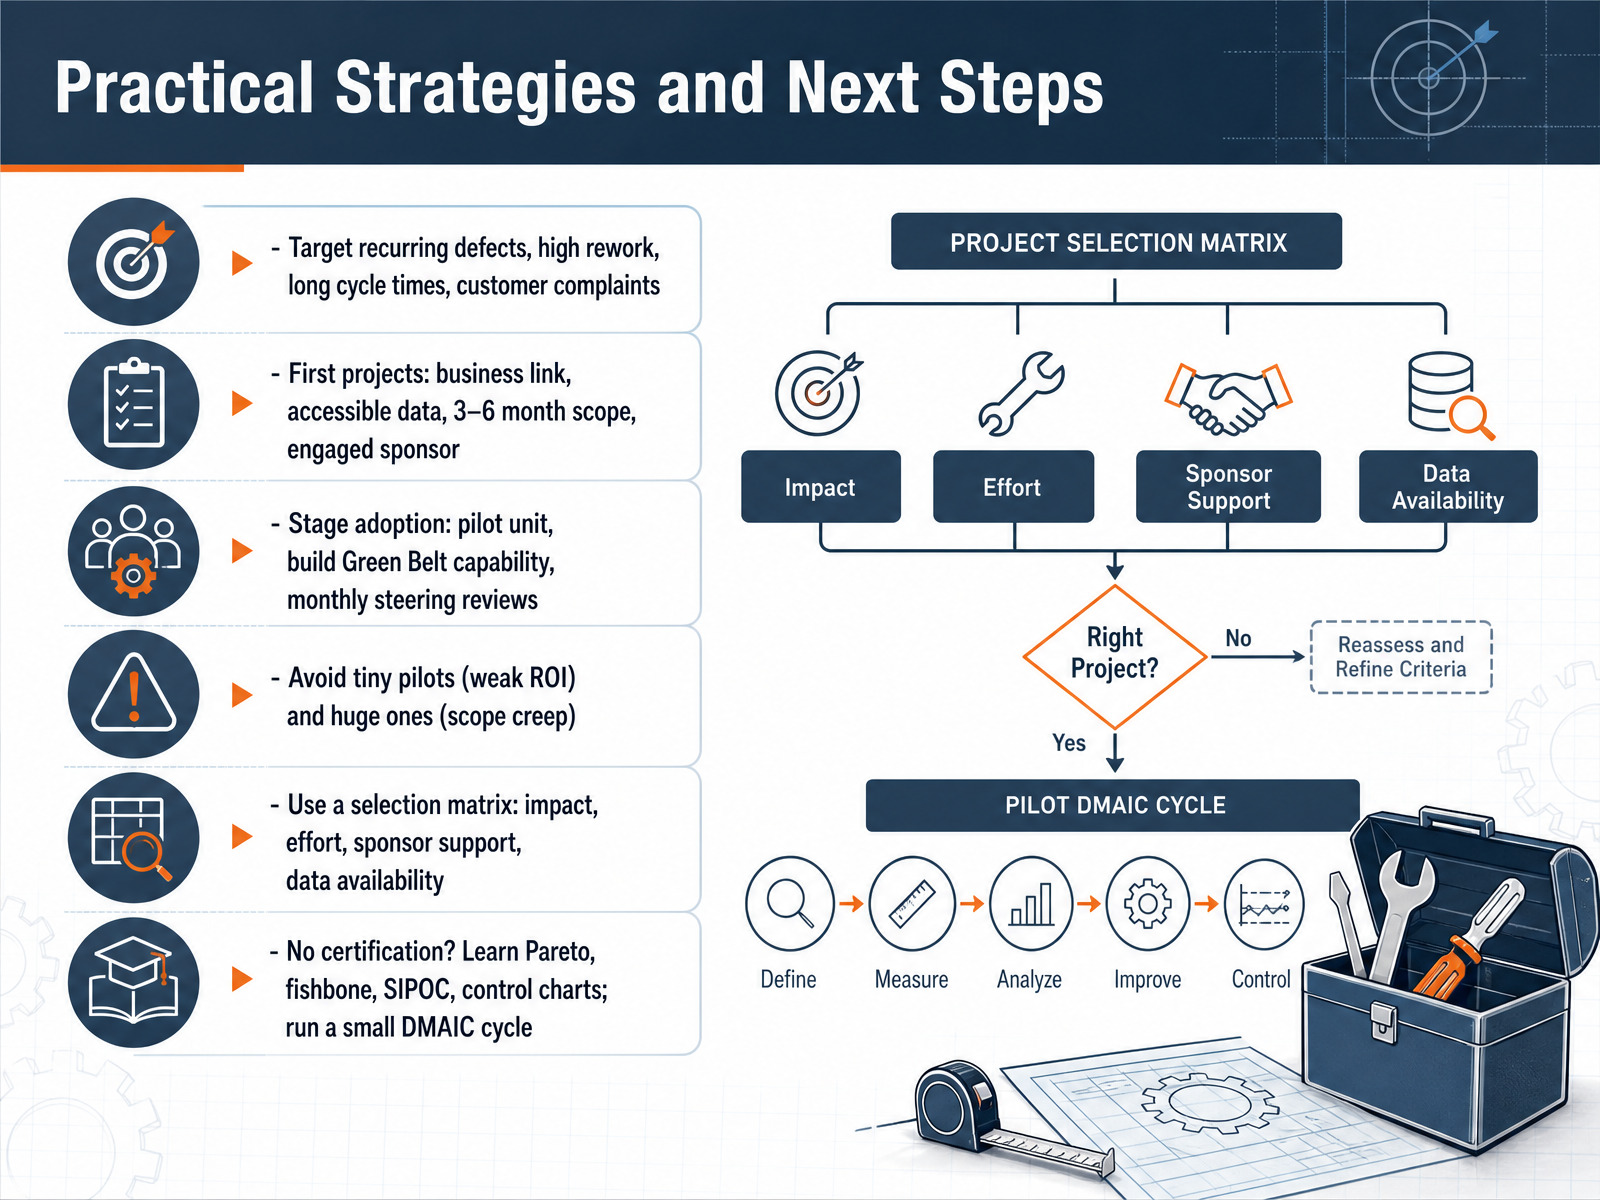
2 min - 13Practical Strategies and Next StepsNow let's turn strategy into action. Target the pain that repeats: recurring defects, high rework, long cycle times, and customer complaints. Your first projects should link to a business goal, use accessible data, finish in three to six months, and have an engaged sponsor. Then stage adoption. Start with a pilot unit, build Green Belt capability, and hold monthly steering reviews to protect momentum. Avoid two traps: pilots so tiny the return is weak, and pilots so huge the scope creeps. Use a selection matrix scoring impact, effort, sponsor support, and data availability. If certification is not on the table yet, learn Pareto charts, fishbone diagrams, SIPOC, and control charts, then run a small DMAIC cycle on one process. Pick your next project, and you will learn by improving. Next, Key Takeaways and Action Plan.
 2 min
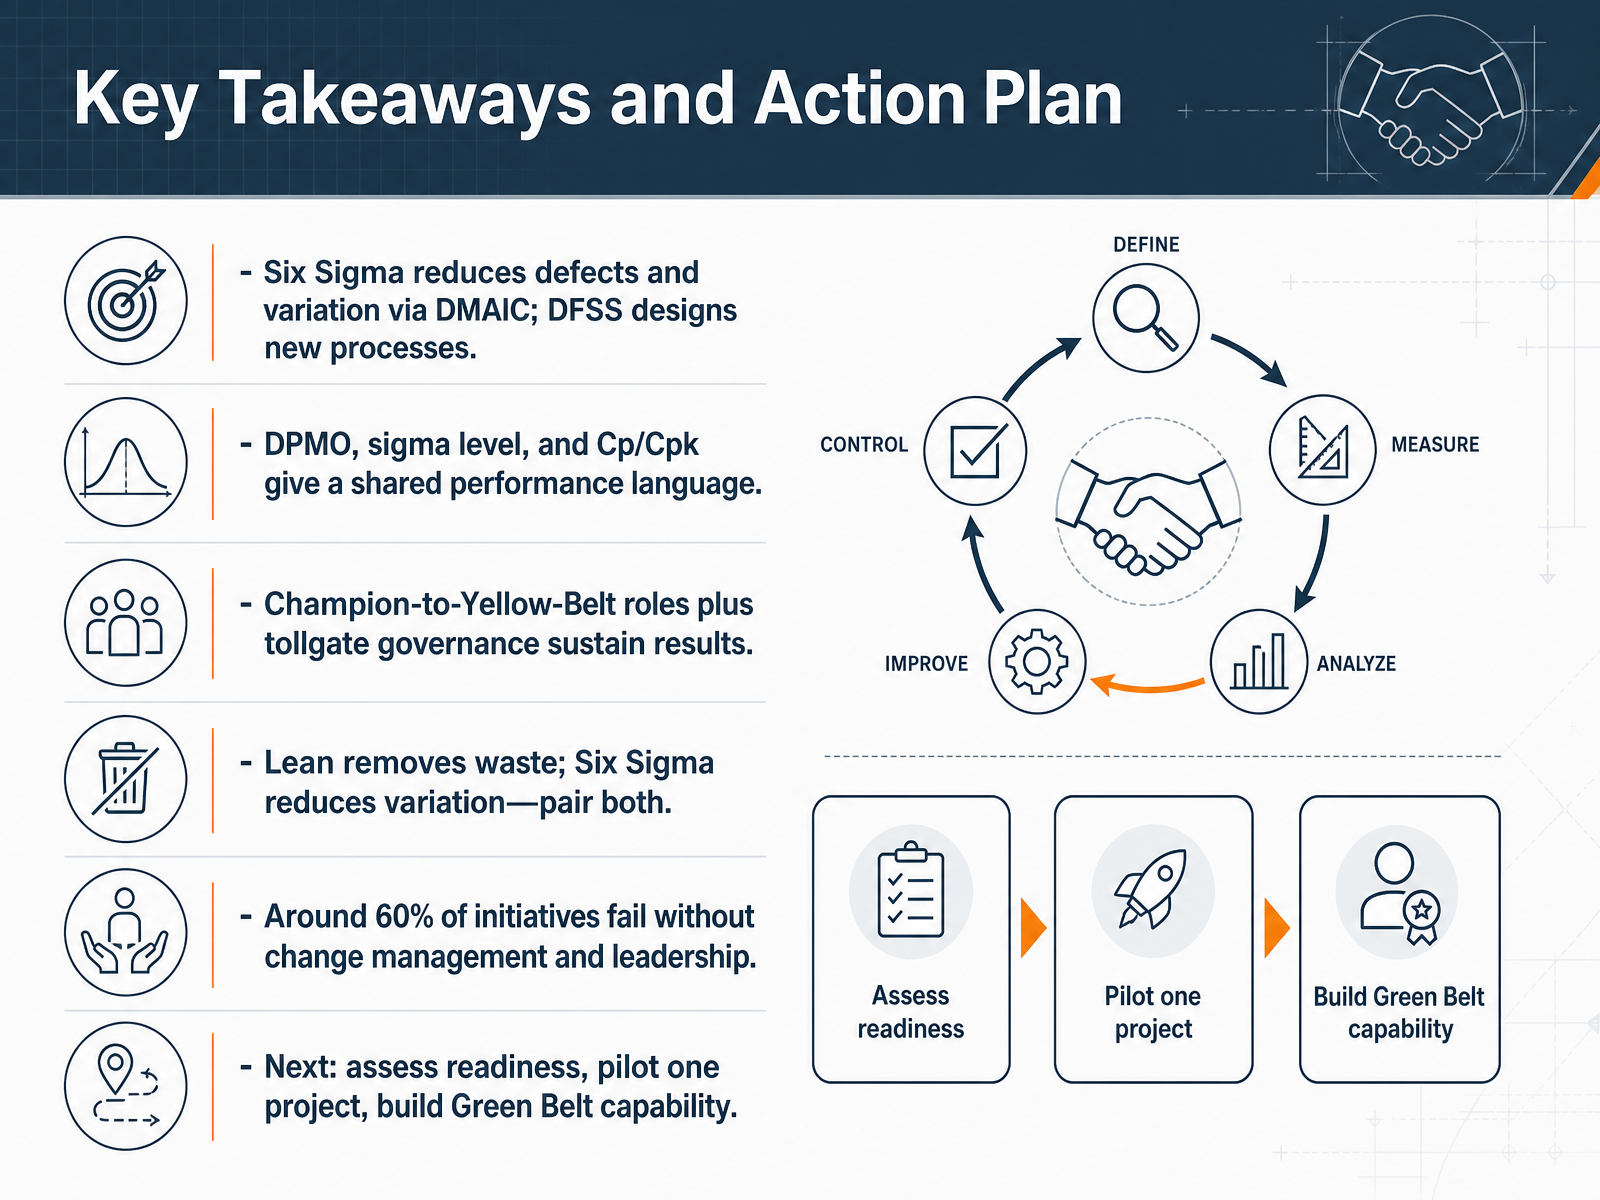
2 min - 14Key Takeaways and Action PlanLet's bring this together. Six Sigma reduces defects and variation through DMAIC, while Design for Six Sigma designs new processes to meet requirements from the start. Metrics like DPMO, sigma level, and Cp and Cpk give your teams one shared performance language. Champion-to-Yellow-Belt roles plus tollgate governance are what sustain the results. Remember, Lean removes waste and Six Sigma reduces variation, so pair both. Be realistic: around sixty percent of initiatives fail without change management and visible leadership. For context, research shows effective programs returned more than two dollars in direct savings for every dollar invested. So, what next? Assess your readiness, pilot one project, and build Green Belt capability. Thank you for working through this course. Now take these ideas and connect them to your own process data and improvement goals. You are ready to lead this work.
 asq.orgonlinelibrary.wiley.comisixsigma.com+21 min
Take the deck with you
Download this course as a file — free, no sign-up needed.
- PDF handoutEvery slide page, ready to print or share.15 pages · 4.0 MBDownload
- Narrated PowerPointThe deck that presents itself — every slide carries the digital human's narration video.15 pages · 14.8 MBDownload
- PowerPoint slidesThe full deck as a .pptx — open it in PowerPoint, Keynote, or Google Slides.15 pages · 3.9 MBDownload
Free to use in your own training — please keep the PersonWise credit page at the end.
Have your own deck? Turn it into a course
Sources consulted
Web sources consulted while building this course.
- Six Sigma in Operations Management: Benefits & Tools — knowledgehut.com
- Six Sigma Definition - What is Lean Six Sigma? | ASQ — asq.org
- Six Sigma: Definition and underlying theory ⋆ — onlinelibrary.wiley.com
- Lean Six Sigma in Operations Management: The Ultimate ... — 6sigma.us
- What Is Six Sigma? Concept, Steps, Examples, and ... — investopedia.com
- An Overview of the Origins and Development of the Six Sigma Management Theory — doi.org
- Quality (history) — web.tecnico.ulisboa.pt
- Motorola’s Second Generation — web.ist.utl.pt
- Six Sigma - Wikipedia — en.m.wikipedia.org
- 1. Six Sigma Project Selection at Motorola - This is a presentation for 30 - 45 minutes. - 2. Living in a Perfect World? Cooperation of Managers and Black Belts - This is a workshop for 90 minutes. - — qualidadeeoimecc.wordpress.com
- DMAIC Process: Define, Measure, Analyze, Improve, Control | ASQ — asq.org
- Design For Six Sigma (DFSS) Versus DMAIC — isixsigma.com
- Six Sigma DMAIC Quick Reference — isixsigma.com
- Six Sigma DMAIC Explained — umbrex.com
- Summary of ISO 13053-1:2011 - DMAIC — msicertified.com
- Costs and Savings of Six Sigma Programs: An Empirical Study | ASQ — asq.org
- The effects of Six Sigma on corporate performance: An empirical investigation — onlinelibrary.wiley.com
- Measuring the ROI of Six Sigma: A Practical Guide - isixsigma.com — isixsigma.com
- Six Sigma adoption: Operating performance impacts and contextual drivers of success — dialnet.unirioja.es
- Six Sigma, stock returns and operating performance — emerald.com