Begin
14 pages · ~28 min
Data Visualization Roadmap
This training helps data professionals and analysts build a strategic data visualization roadmap, covering key tools, techniques, and best practices for effective visual communication.
A digital instructor presents all 14 pages. Hold “Ask” at any point and ask out loud — the answer comes from this course. No sign-up needed.
What you’ll learn
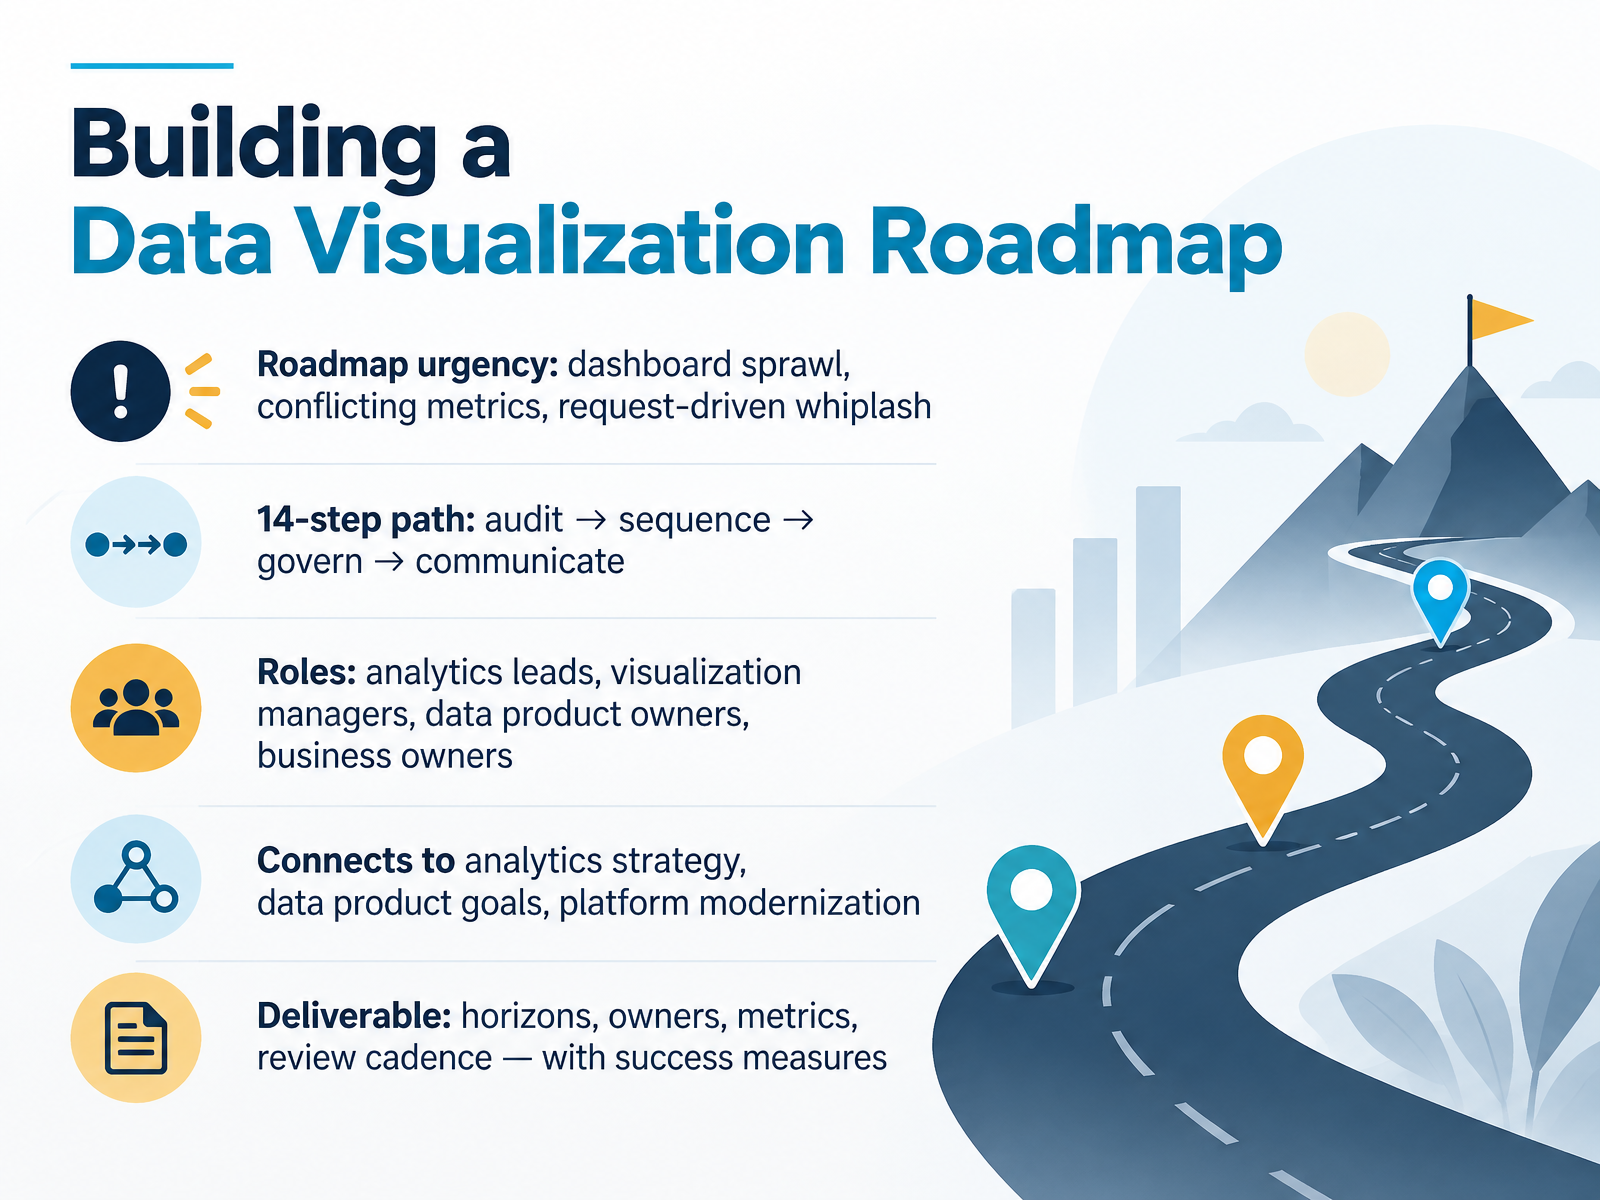
- 01Building a Data Visualization RoadmapWelcome. Over the next fourteen steps, we are going to build a data visualization roadmap you can actually defend. Not a wish list. A sequenced plan with horizons, owners, and success measures.
Why now? Because most of us are living with dashboard sprawl, conflicting metrics, and request-driven whiplash. Every new ask becomes a new dashboard, and nobody retires anything. Sound familiar?
The path here is audit, sequence, govern, communicate. Four phases, fourteen steps. This is a team sport: analytics leads, visualization managers, data product owners, and business owners all carry a piece. And the roadmap should connect upward to your analytics strategy, your data product goals, and platform modernization work already in flight.
The deliverable is concrete. You will leave with time horizons, named owners, a small set of success metrics, and a review cadence.
One caution. A roadmap built in a silo gets ignored, so bring stakeholders in early. Let's start with why our portfolios drift, and what that drift actually costs us.johal.indupple.comcomputertechreviews.com+22 min
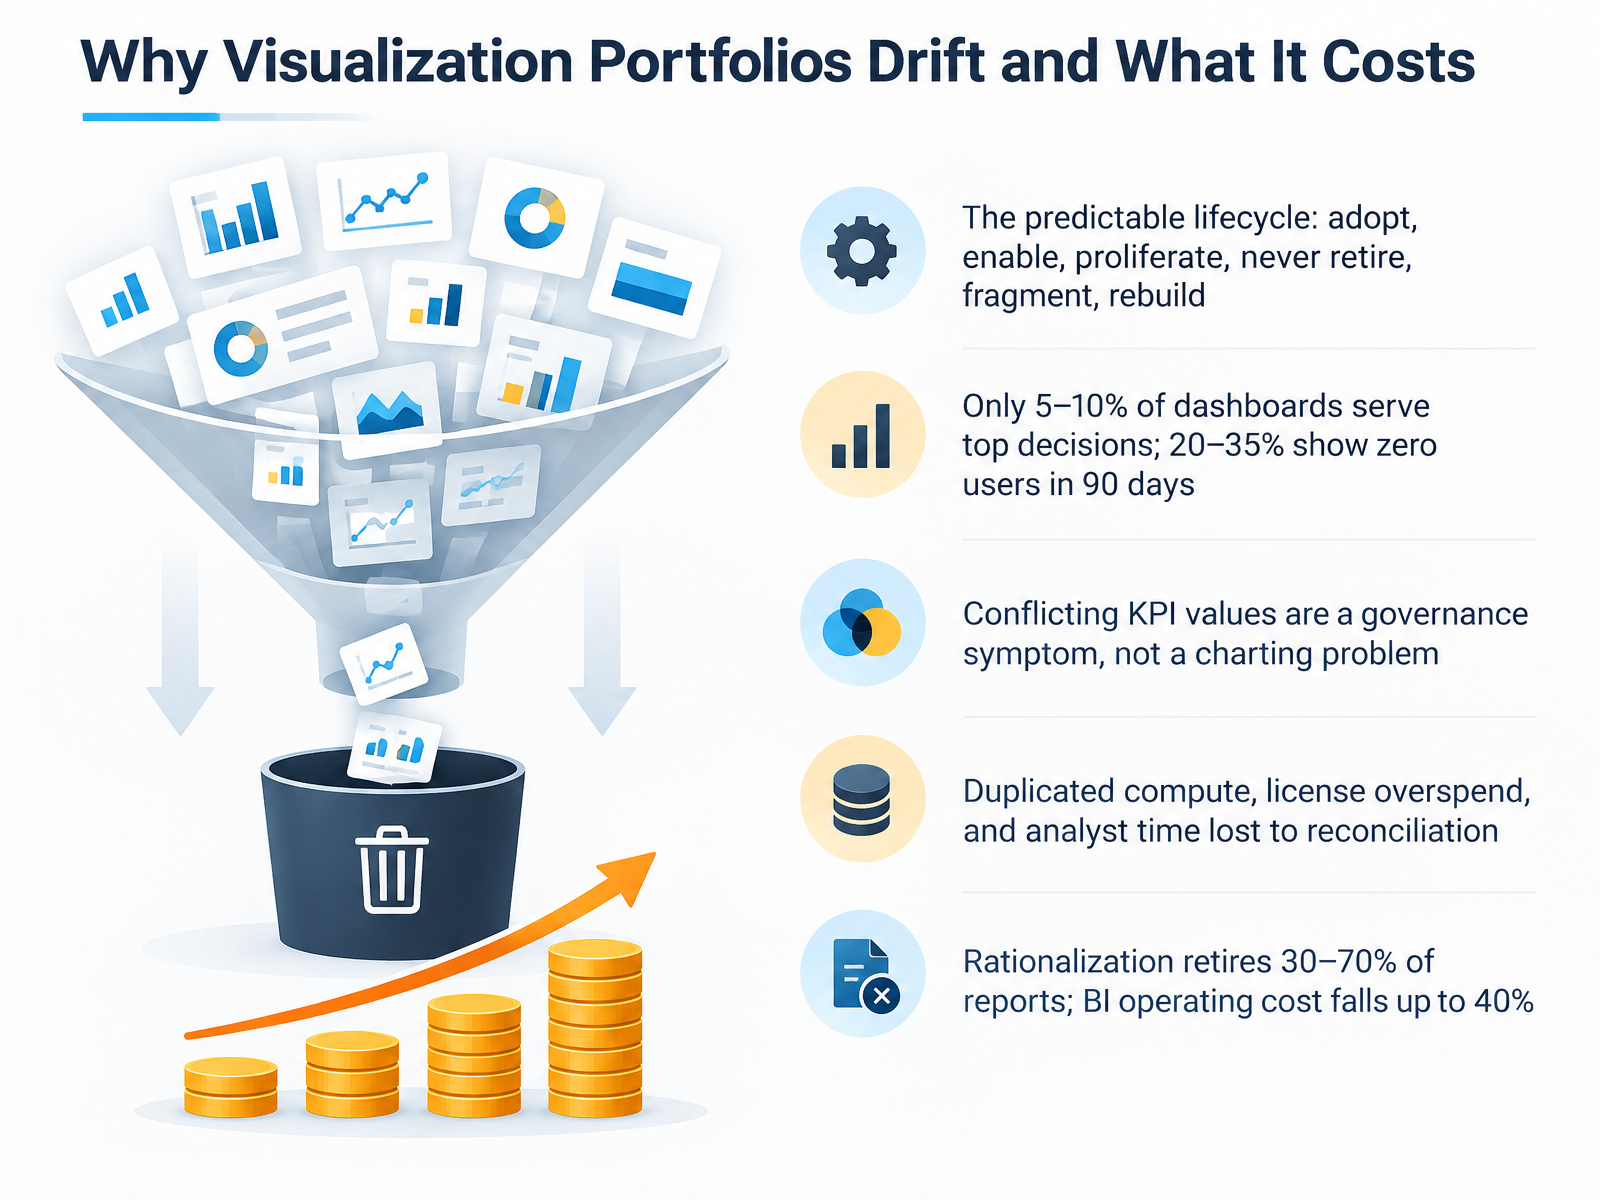
- 02Why Visualization Portfolios Drift and What It CostsLet's talk about why visualization portfolios drift, and what that drift actually costs. There's a predictable lifecycle here. A platform gets adopted, analysts are enabled, dashboards proliferate, nobody is allowed to retire anything, usage fragments, a second platform gets bought to fix it, and the cycle repeats. By the time anyone counts, you're running three platforms and four hundred dashboards, and no one can say which metric is authoritative. The usage data is sobering. Only five to ten percent of dashboards serve your top decisions. Twenty to thirty-five percent show zero users in ninety days. And when two dashboards disagree on revenue, that's a governance symptom, not a charting problem. The cost shows up as duplicated compute, license overspend, and analyst hours lost to reconciliation. The good news: rationalization typically retires thirty to seventy percent of reports, and BI operating cost falls by up to forty percent. Next, we'll look at target audience, roles, and decision rights.
 techtarget.comdatabuzzltd.combasedash.com+22 min
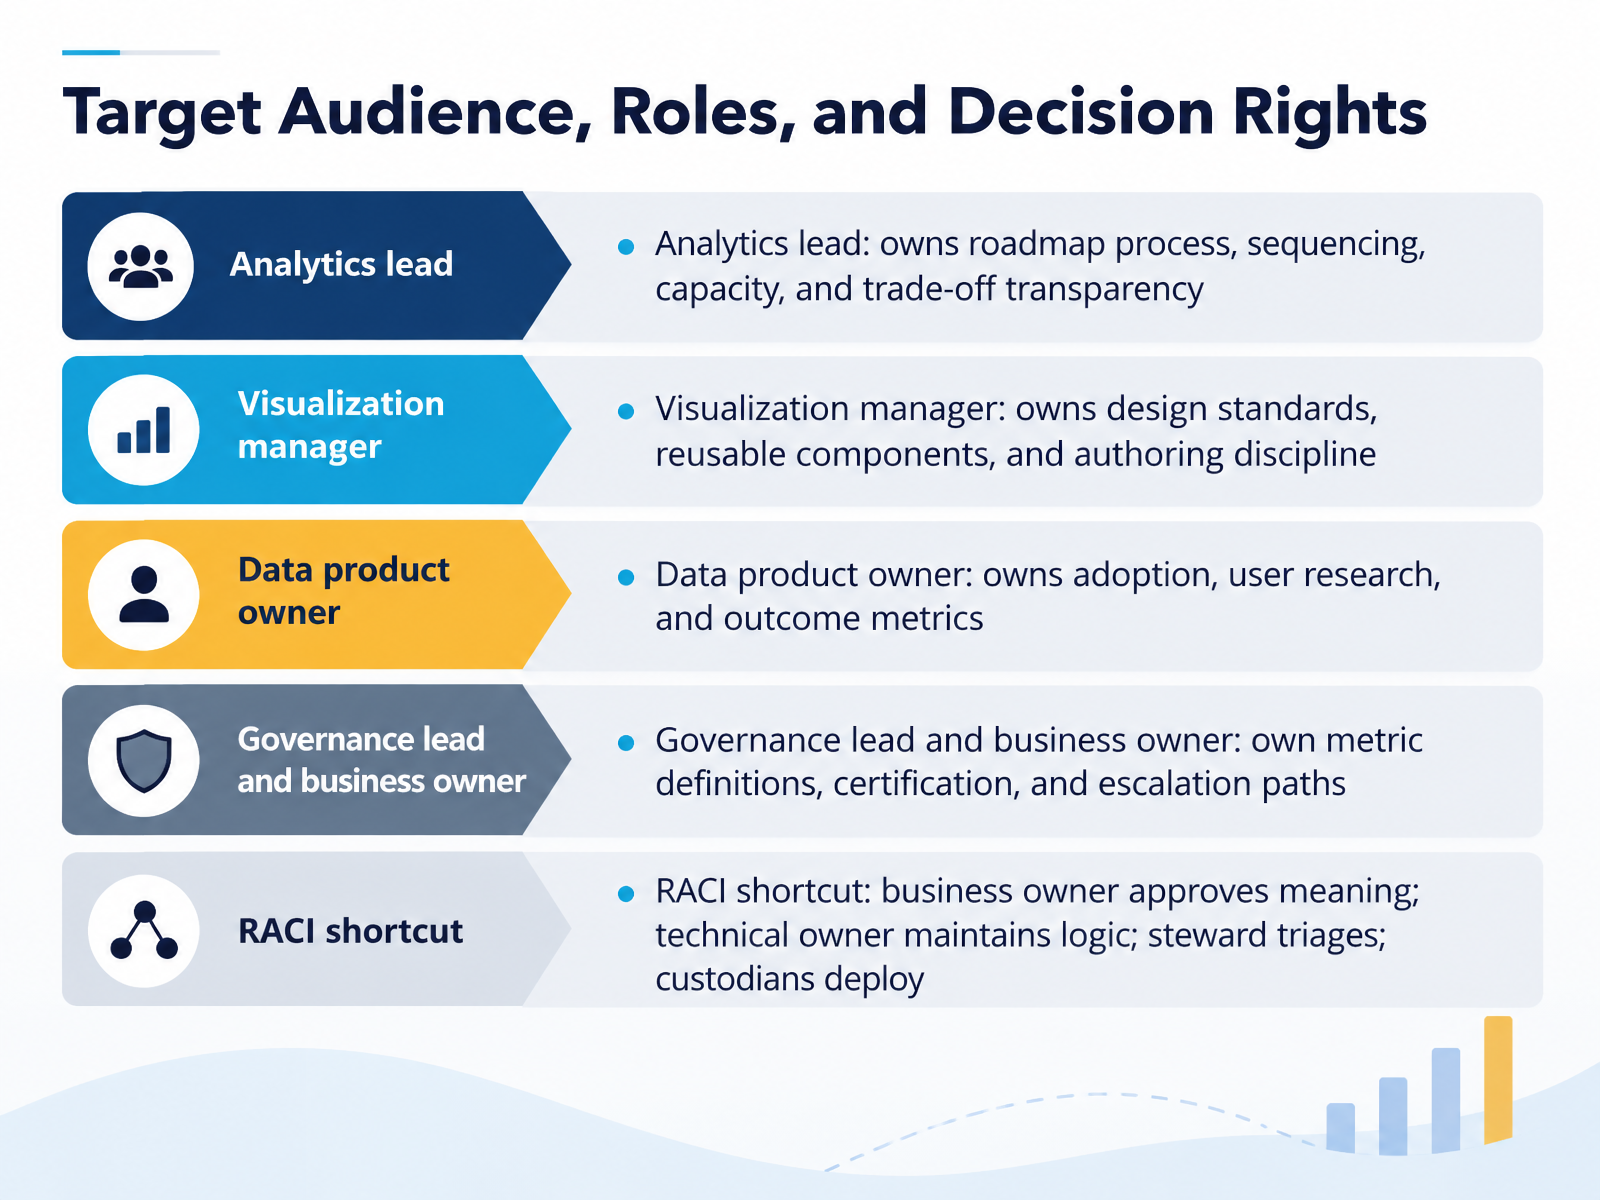
- 03Target Audience, Roles, and Decision RightsLet's talk about who owns what. This slide is your decision rights map, and it matters because shared ownership usually means no ownership. The analytics lead owns the roadmap process, sequencing, capacity, and trade-off transparency. The visualization manager owns design standards, reusable components, and authoring discipline. The data product owner owns adoption, user research, and outcome metrics. And governance leads and business owners own metric definitions, certification, and escalation paths. Here's a shortcut worth remembering. Business owner approves meaning. Technical owner maintains logic. Steward triages. Custodians deploy. No tool is accountable for semantics. That belongs to a named person. Pick one disputed metric family, like revenue, and write the RACI on a single page. Then walk one conflict case with a timeout. Next, we look at your portfolio inventory, what you have and who uses it.
 coldstartdata.comcoldstartdata.comforrester.com+21 min
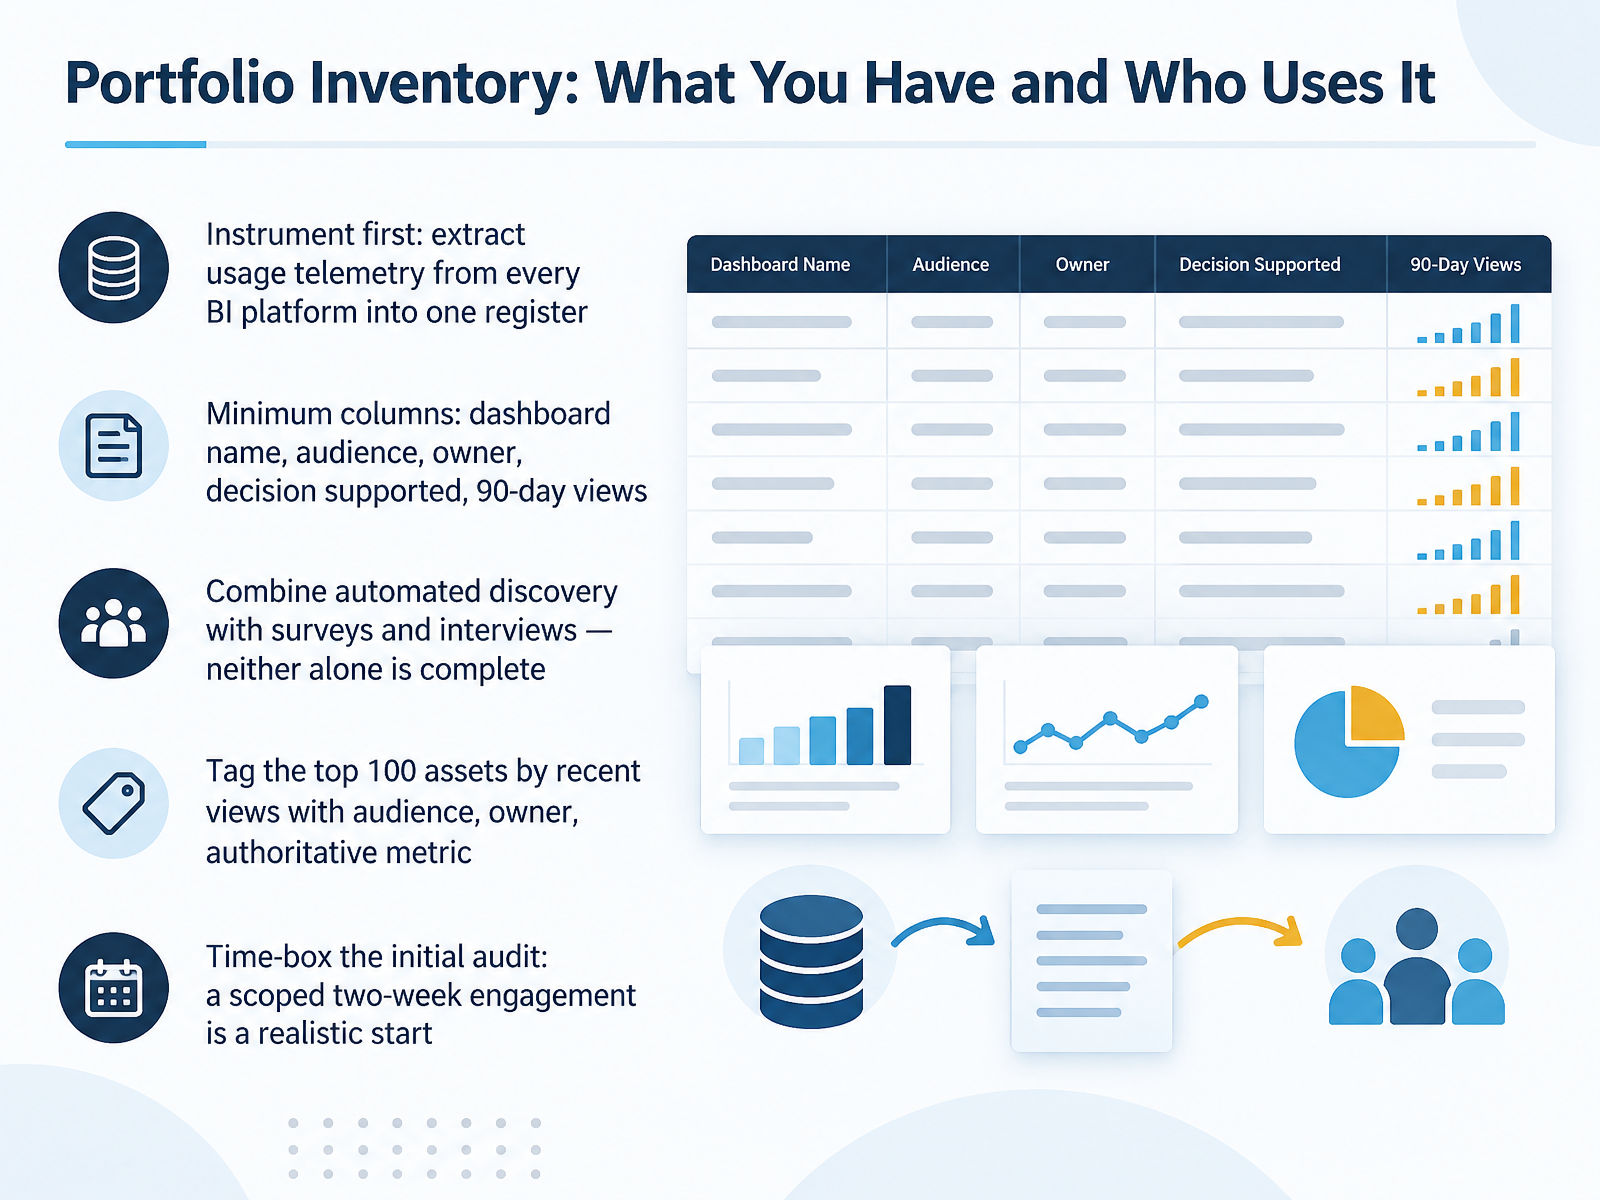
- 04Portfolio Inventory: What You Have and Who Uses ItNow let's look at the foundation of any roadmap: portfolio inventory. You cannot prioritize what you have not counted. So start by instrumenting. Extract usage telemetry from every BI platform in scope into one register. Every modern platform emits it. Almost nobody uses it.
Your minimum columns: dashboard name, audience, owner, decision supported, and views over the last ninety days. That last column is where the surprises live. Most estates find that twenty to thirty-five percent of dashboards had zero users in ninety days.
Combine automated discovery with surveys and interviews. Neither alone is complete. Telemetry shows what is opened. Surveys surface the dashboard that is opened twice a year but gates a regulatory filing. Then tag the top one hundred assets by recent views with audience, owner, and authoritative metric. That short list is where your real decisions concentrate.
One caution: do not judge by usage alone. A low-traffic dashboard can still be decision-critical.
Time-box the initial audit. A scoped two-week engagement is a realistic start, and it produces a prioritized list rather than a perfect one.
Scoring and Classifying the Estate
 techtarget.comdatabuzzltd.combasedash.com+22 min
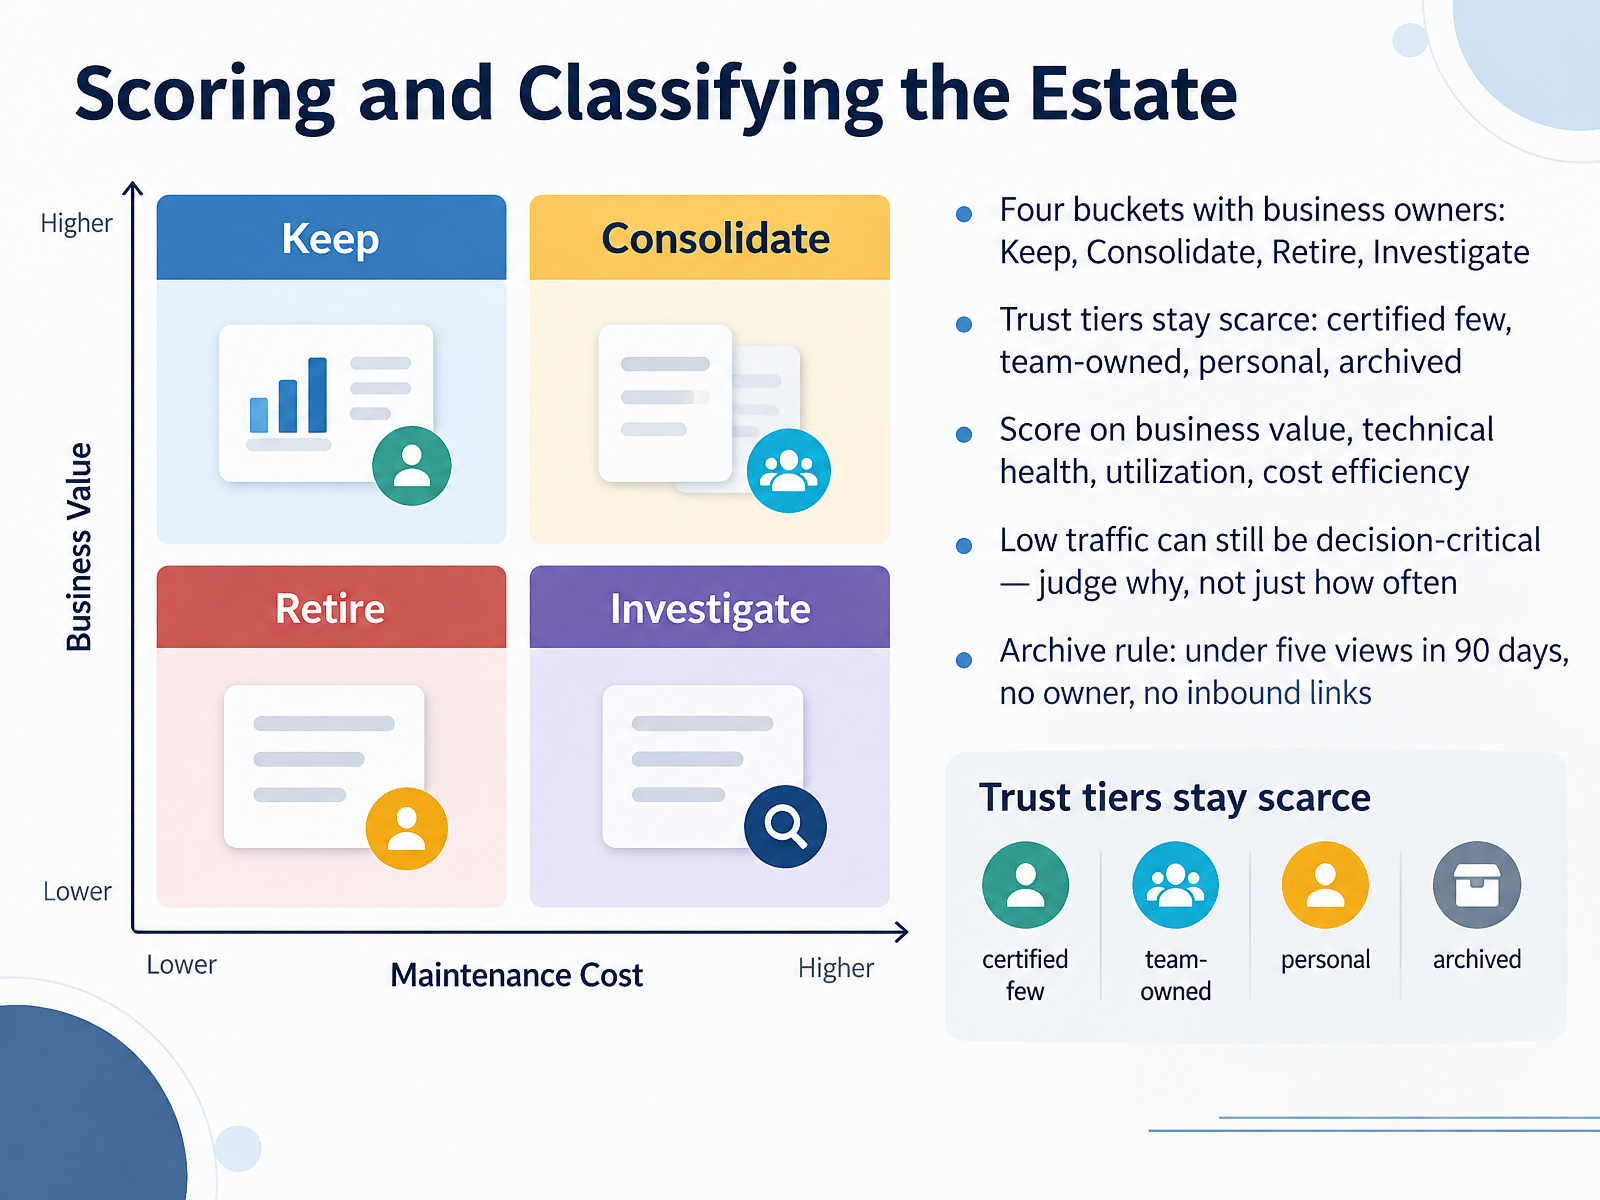
- 05Scoring and Classifying the EstateSo let's talk about scoring and classifying the estate. Once your inventory is complete, every dashboard lands in one of four buckets, and each bucket needs a named business owner: Keep, Consolidate, Retire, or Investigate. Think of the Keep bucket as the set you would rebuild on a semantic layer. Retire is usually larger than stakeholders expect. Consolidate means several versions of one thing, so pick a winner. Investigate is for the contested cases, and it should be small enough to handle one by one. Separately, trust tiers stay scarce. Certified dashboards are a handful of tier one assets. Then team owned, then personal, then archived. If you certify thirty dashboards, none of them stand out. Score on four dimensions: business value, technical health, utilization, and cost efficiency. Now, a caution. Low traffic does not automatically mean low value. A regulatory view might be opened twice a quarter and still be decision critical. Ask why it is used, not just how often. For the archive rule: fewer than five views in ninety days, no named owner, and no inbound links from docs, Slack, or other dashboards. Archive first, delete later, so anyone can restore within ninety days. Next, we will look at prioritization frameworks adapted to visualization work.
 techtarget.comdatabuzzltd.combasedash.com+22 min
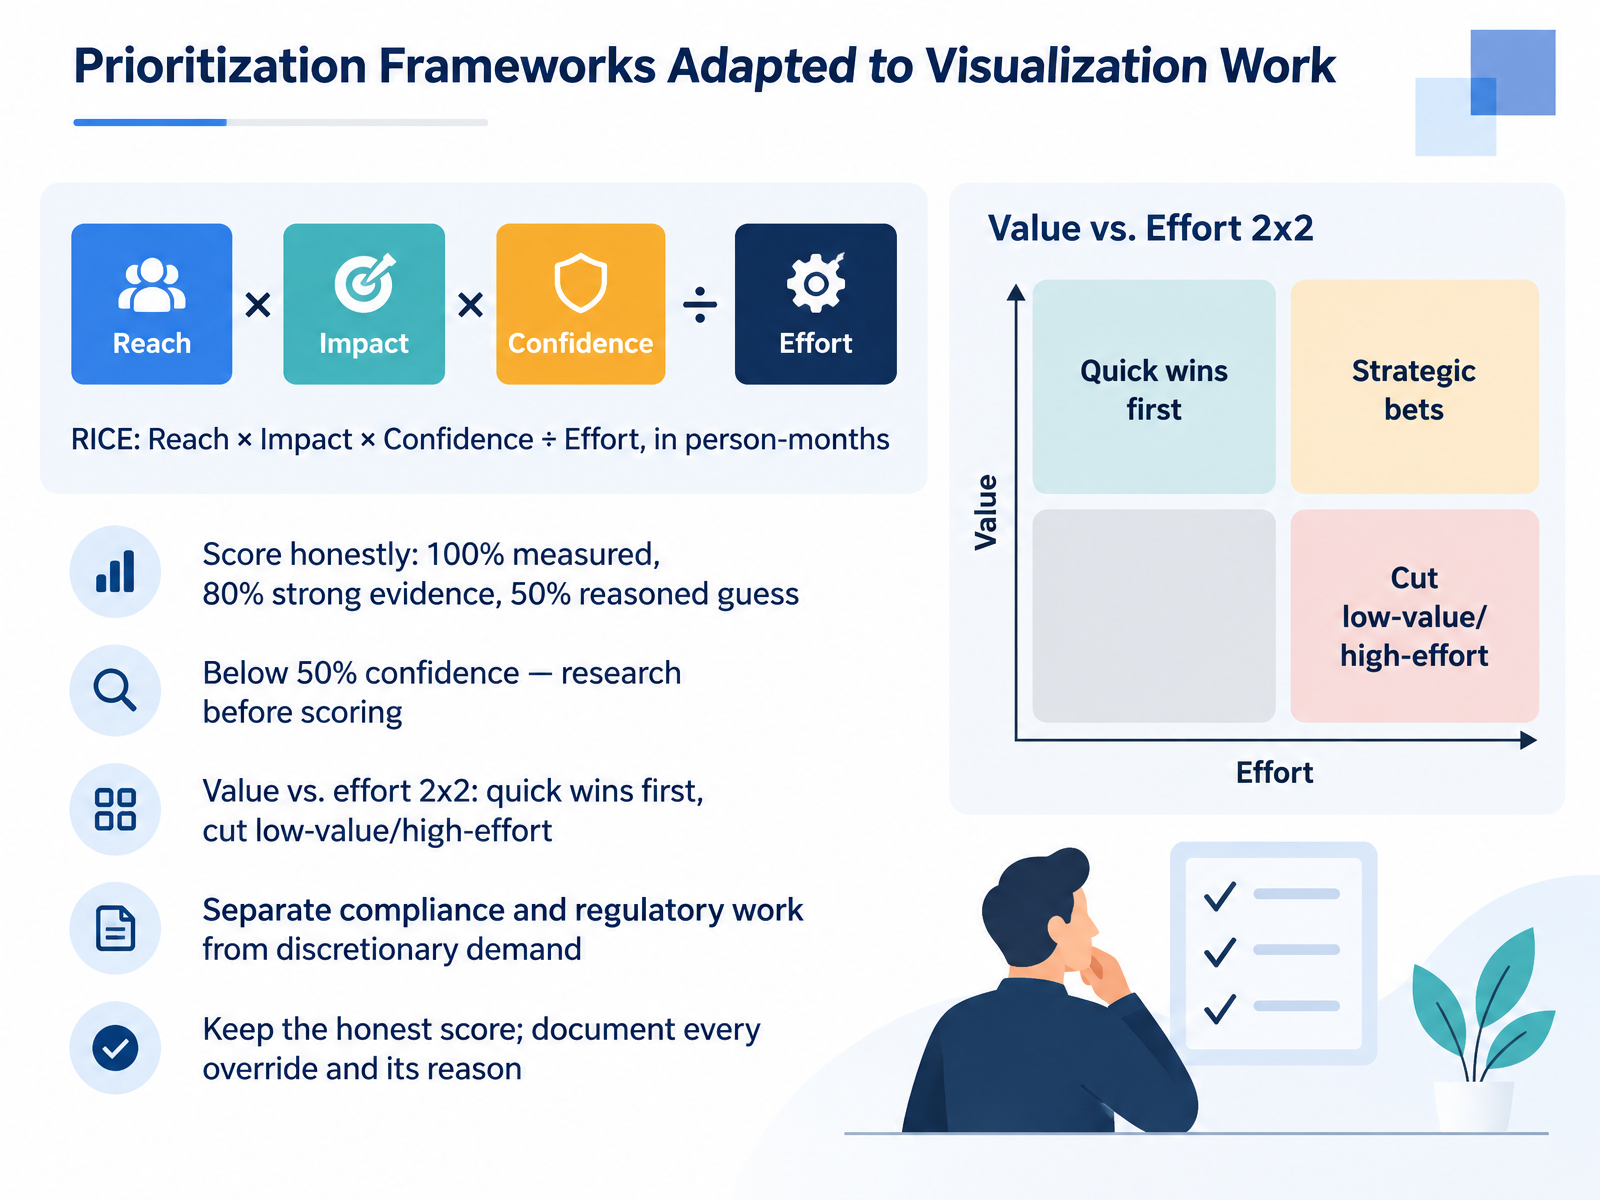
- 06Prioritization Frameworks Adapted to Visualization WorkLet's talk about how to actually choose. RICE gives you a shared language: Reach times Impact times Confidence, divided by Effort, measured in person-months. Reach is how many people a change touches this quarter. Impact is how much it moves the goal per person. Confidence is an evidence discount, so score honestly: one hundred percent when measured, eighty percent for strong evidence, fifty percent for a reasoned guess. Below fifty percent, don't polish the spreadsheet. Go research first. When you need a fast visual, plot value against effort. Quick wins first, cut the low-value, high-effort work. One more discipline that matters here: separate compliance and regulatory work from discretionary demand. A security requirement doesn't need to outrank an onboarding experiment on reach to deserve capacity. And when you override the ranking, keep the honest score and document the reason. That protects trust and makes the trade-off visible. Next, let's look at design standards and the reusable component layer.
 intercom.comtempo.iofinchpulse.com+22 min
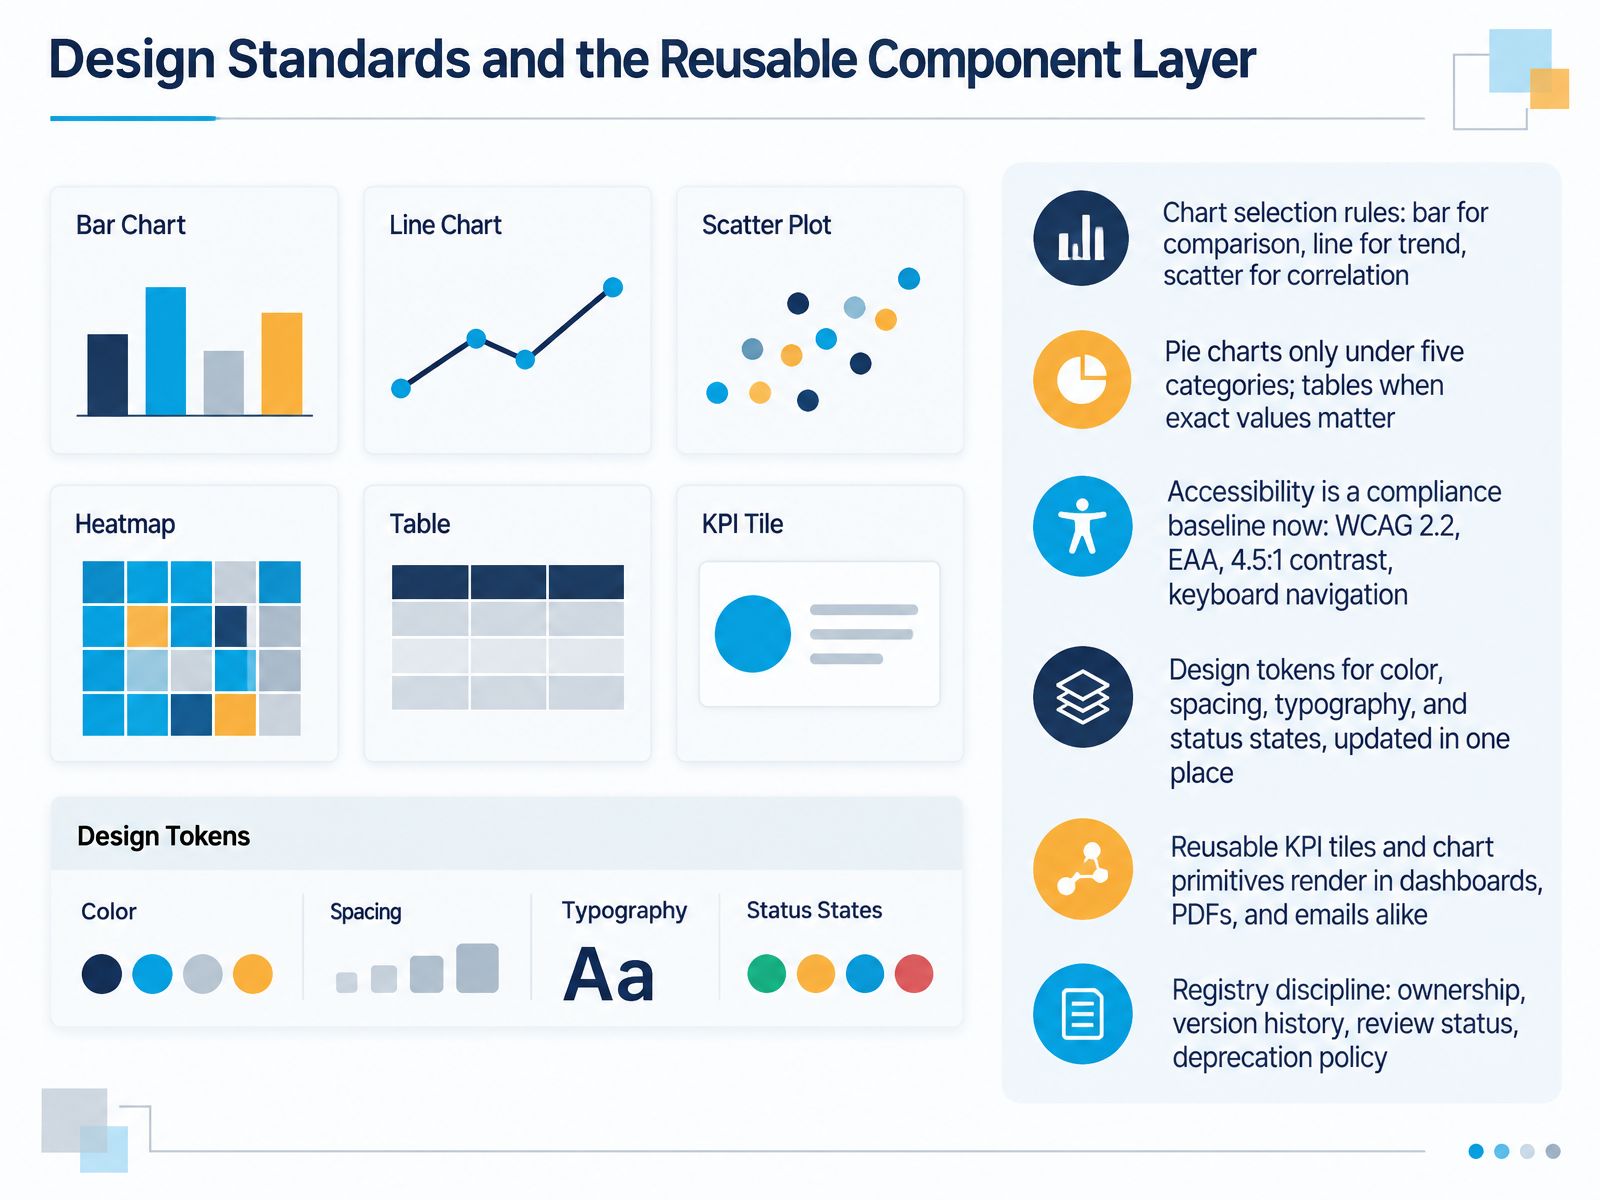
- 07Design Standards and the Reusable Component LayerLet's talk about the component layer, because standards only scale when they live in code we can reuse. Start with chart selection rules. Bar for comparison, line for trend, scatter for correlation. Pie charts only under five categories, and tables when exact values matter. Accessibility is no longer a nice-to-have. WCAG 2.2, the European Accessibility Act, four point five to one contrast, and keyboard navigation are the compliance baseline. Next, design tokens. Color, spacing, typography, and status states defined once and updated in one place. Chart primitives and KPI tiles then render consistently in dashboards, PDFs, and email digests. But reuse needs a registry with ownership, version history, review status, and a deprecation policy. Otherwise your library becomes tribal knowledge. Quick check: could your team name the owner of each shared component today? That registry is what makes the next dependency work: the semantic layer.
 johal.indupple.comcomputertechreviews.com+21 min
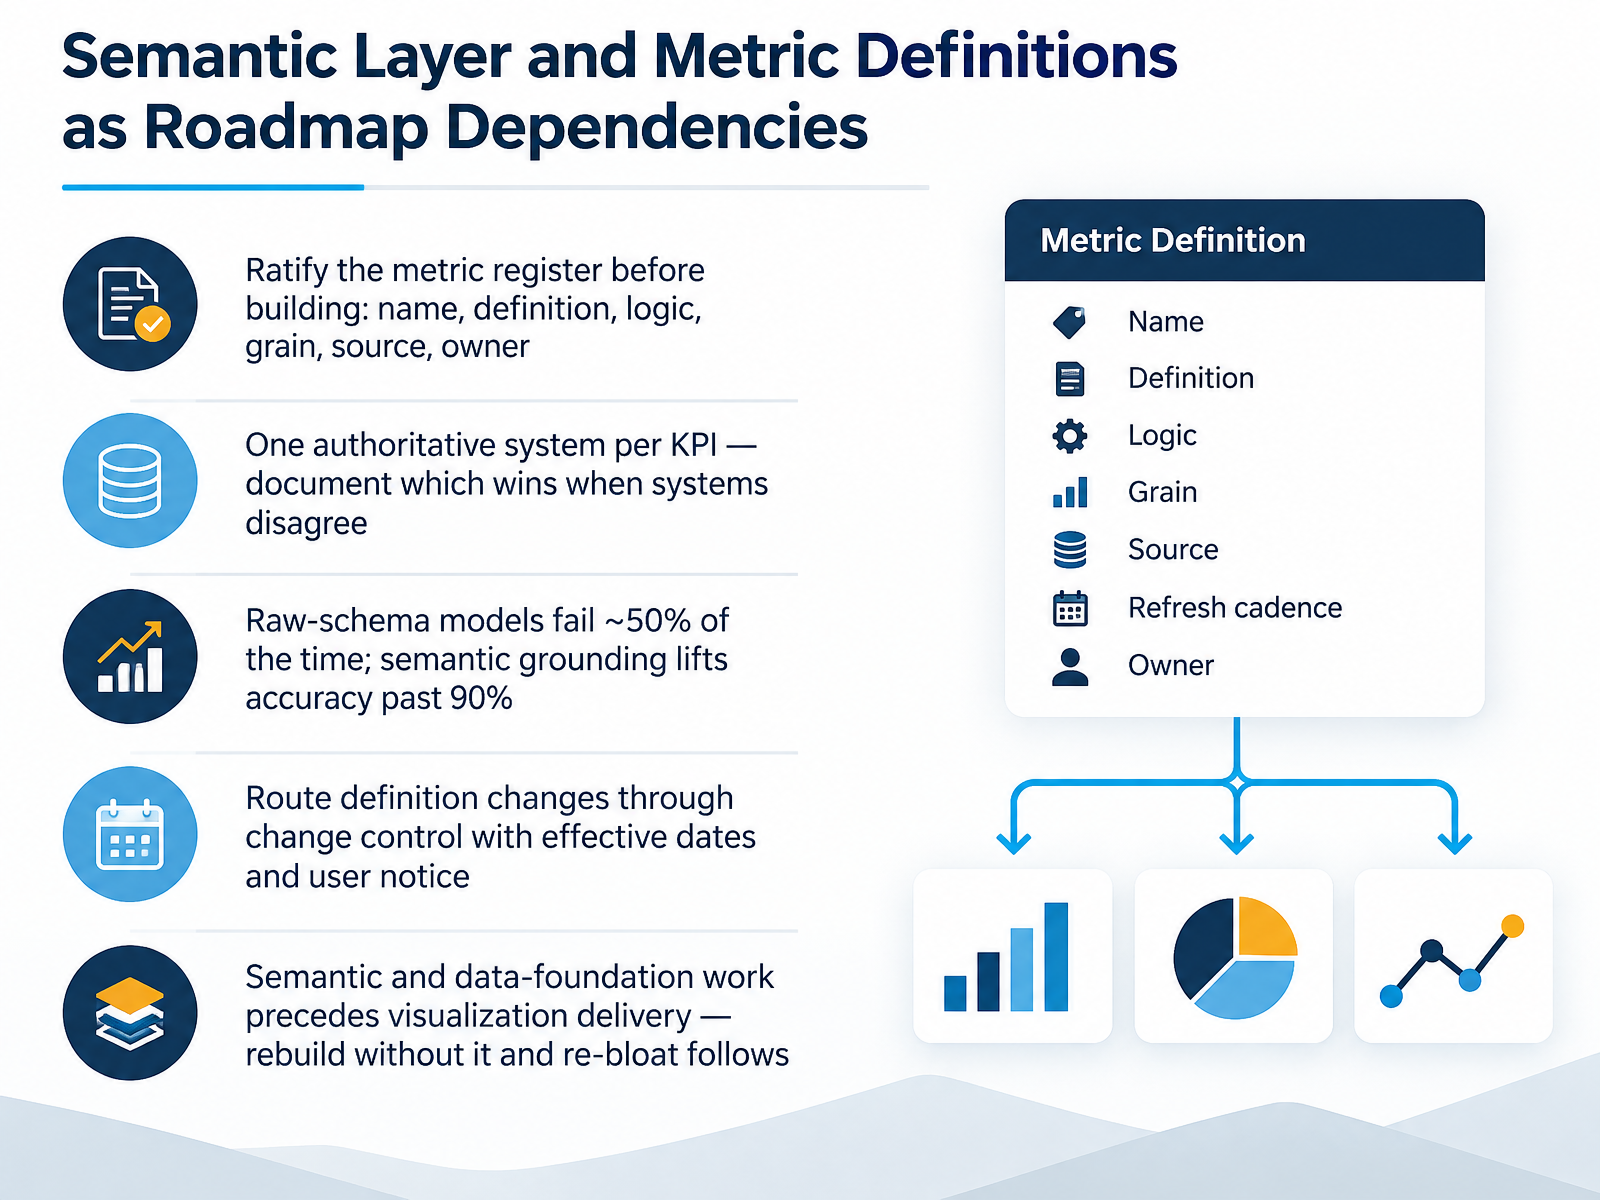
- 08Semantic Layer and Metric Definitions as Roadmap DependenciesLet's talk about the dependency that decides whether your roadmap holds: the semantic layer and your metric definitions. Before anyone builds a dashboard, ratify the metric register. Name, definition, logic, grain, source, owner. Next, pick one authoritative system per K P I, and document which source wins when systems disagree. This matters more than ever. A general-purpose model querying raw schemas fails roughly half the time. Grounded in a governed semantic layer, accuracy lifts past ninety percent. So route definition changes through change control, with effective dates and user notice. And here's the sequencing rule: semantic and data-foundation work comes before visualization delivery. Rebuild without it, and the re-bloat follows. Your takeaway? Definitions first, dashboards second. Now, let's look at Horizon Planning and Delivery Sequencing.
 coldstartdata.comcoldstartdata.comforrester.com+21 min
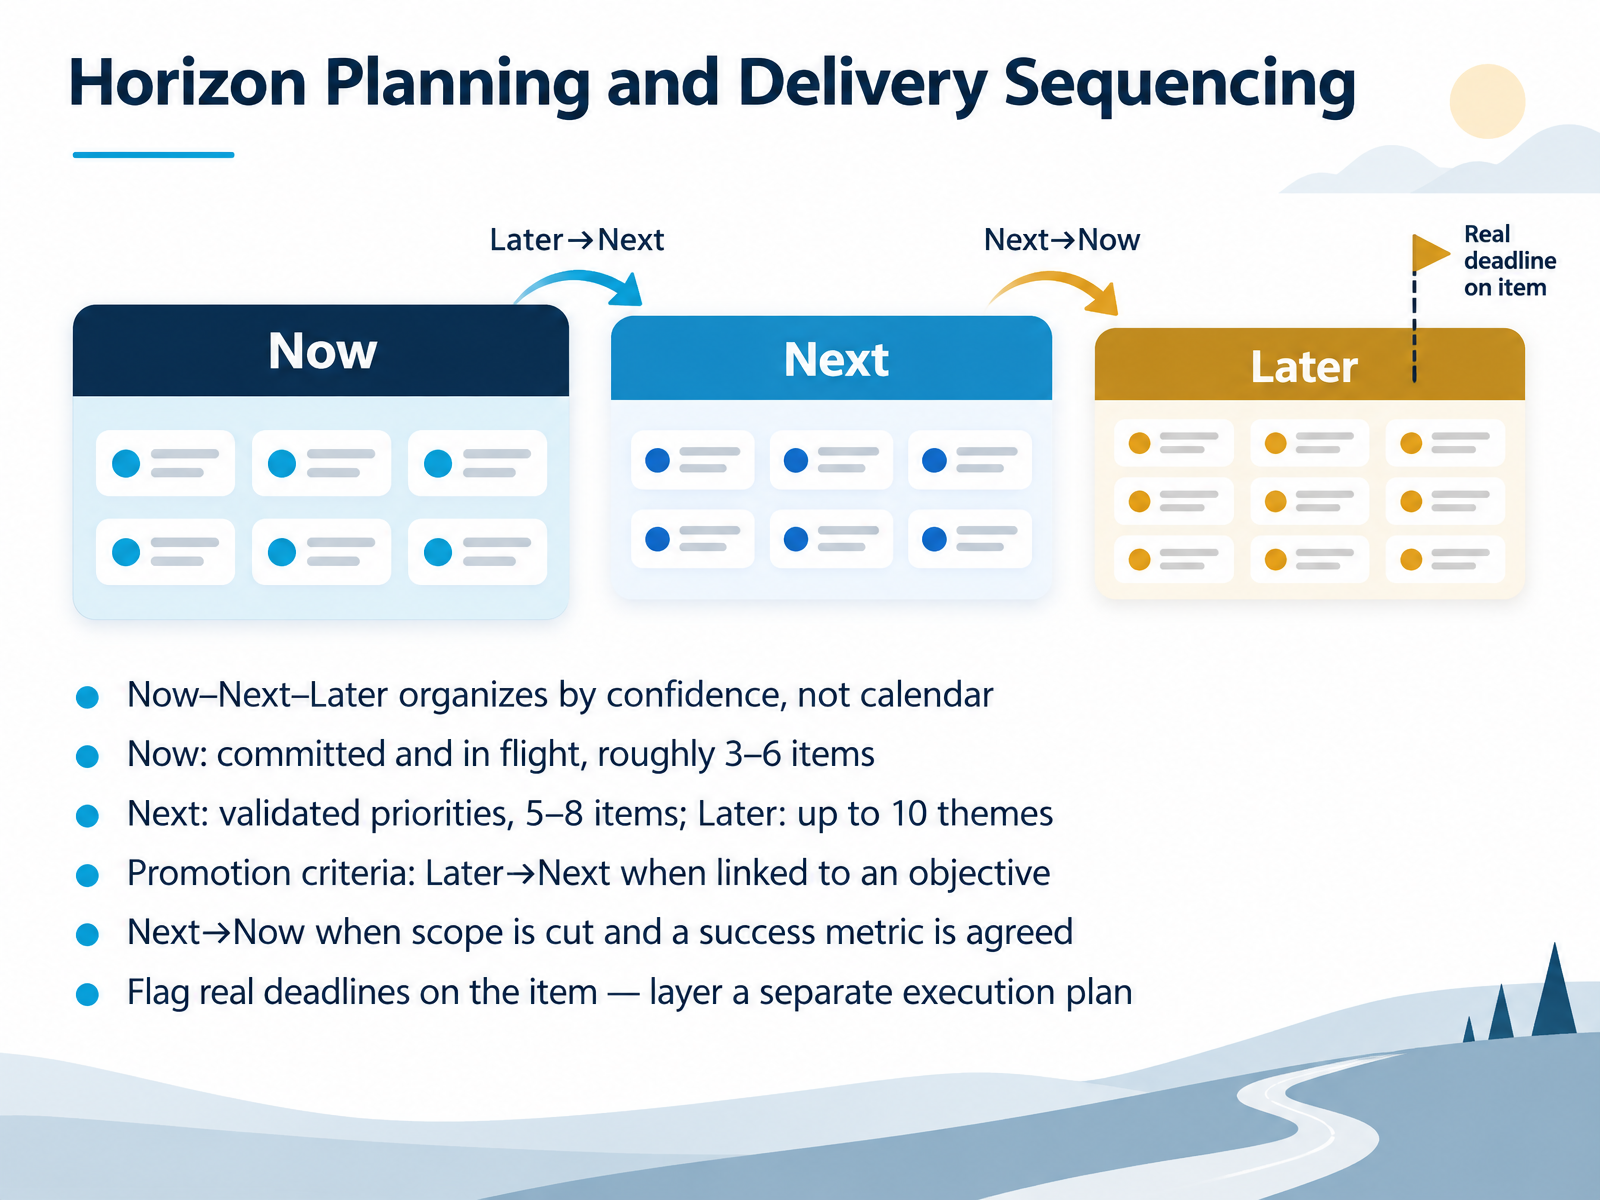
- 09Horizon Planning and Delivery SequencingLet's talk about horizon planning and delivery sequencing. Now, Next, and Later organizes by confidence, not calendar. That distinction matters, because it changes what stakeholders are actually debating. Now holds committed work in flight, roughly three to six items. Next holds validated priorities, five to eight items. Later holds up to ten themes, deliberately fuzzy. Promotion is gated. Later moves to Next when a theme links to a live objective. Next moves to Now when scope is cut to a shippable slice and a success metric is agreed. And real deadlines? Flag them on the item itself, then layer a separate execution plan for the detail. Keep Now small. If everything is Now, nothing is. By prioritizing confidence over dates, teams protect credibility and keep the conversation on outcomes. Next, we look at the technology and platform decisions that shape the roadmap.
 1 min
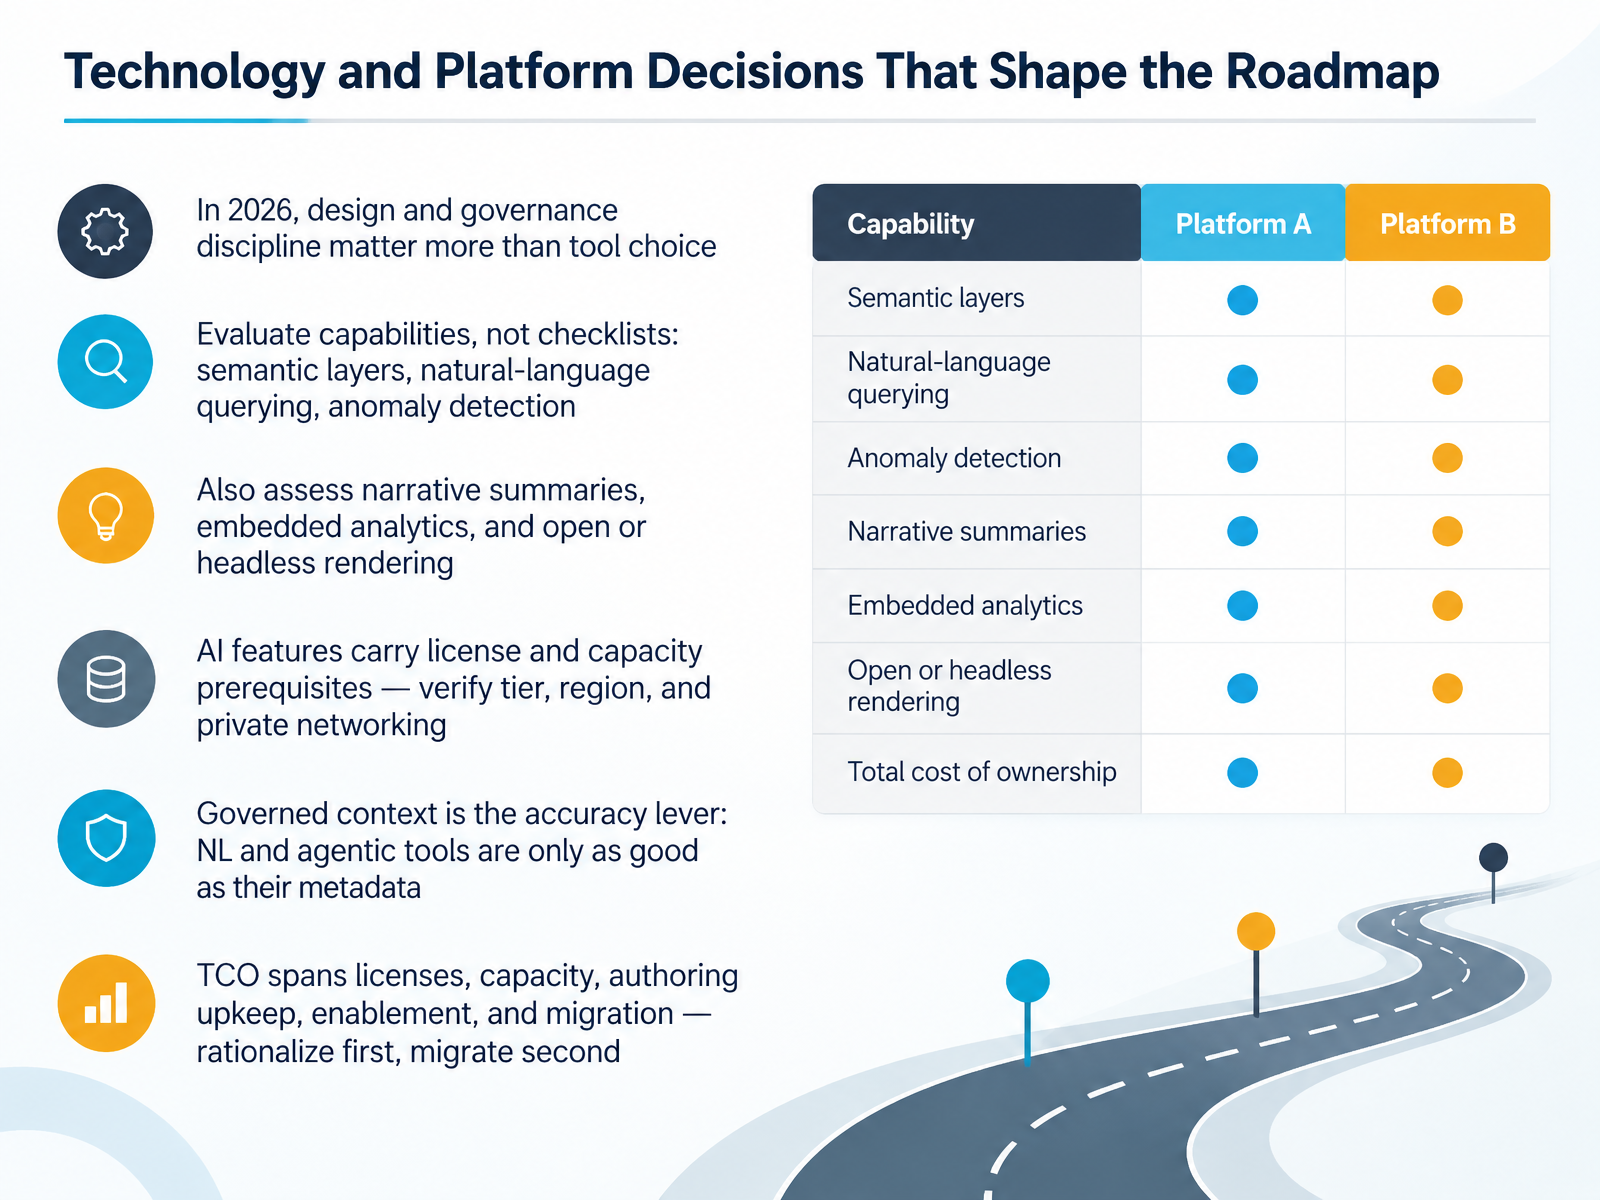
- 10Technology and Platform Decisions That Shape the RoadmapNow let's talk about technology and platform decisions, because these choices shape what your roadmap can actually deliver. Here is the headline for twenty twenty-six. Design and governance discipline matter more than tool choice. Most bad dashboards come from the wrong chart, the wrong metric definitions, or too many questions on one screen, not from the platform itself. So evaluate capabilities, not checklists. Ask hard questions about semantic layers, natural language querying, and anomaly detection. Then look at narrative summaries, embedded analytics, and open or headless rendering. And a practical warning. AI features carry license and capacity prerequisites. Before you commit, verify the tier, the region, and private networking support. One platform's Copilot may require premium capacity and simply not work under Private Link. Remember that governed context is your real accuracy lever. Natural language and agentic tools are only as good as the metadata behind them. Grounded on a governed semantic layer, accuracy climbs well past ninety percent. Against raw tables, it can fail half the time. Finally, total cost of ownership spans licenses, capacity, authoring upkeep, enablement, and migration. So rationalize first, migrate second. Next, we move into adoption, enablement, and change management.
 johal.indupple.comcomputertechreviews.com+22 min
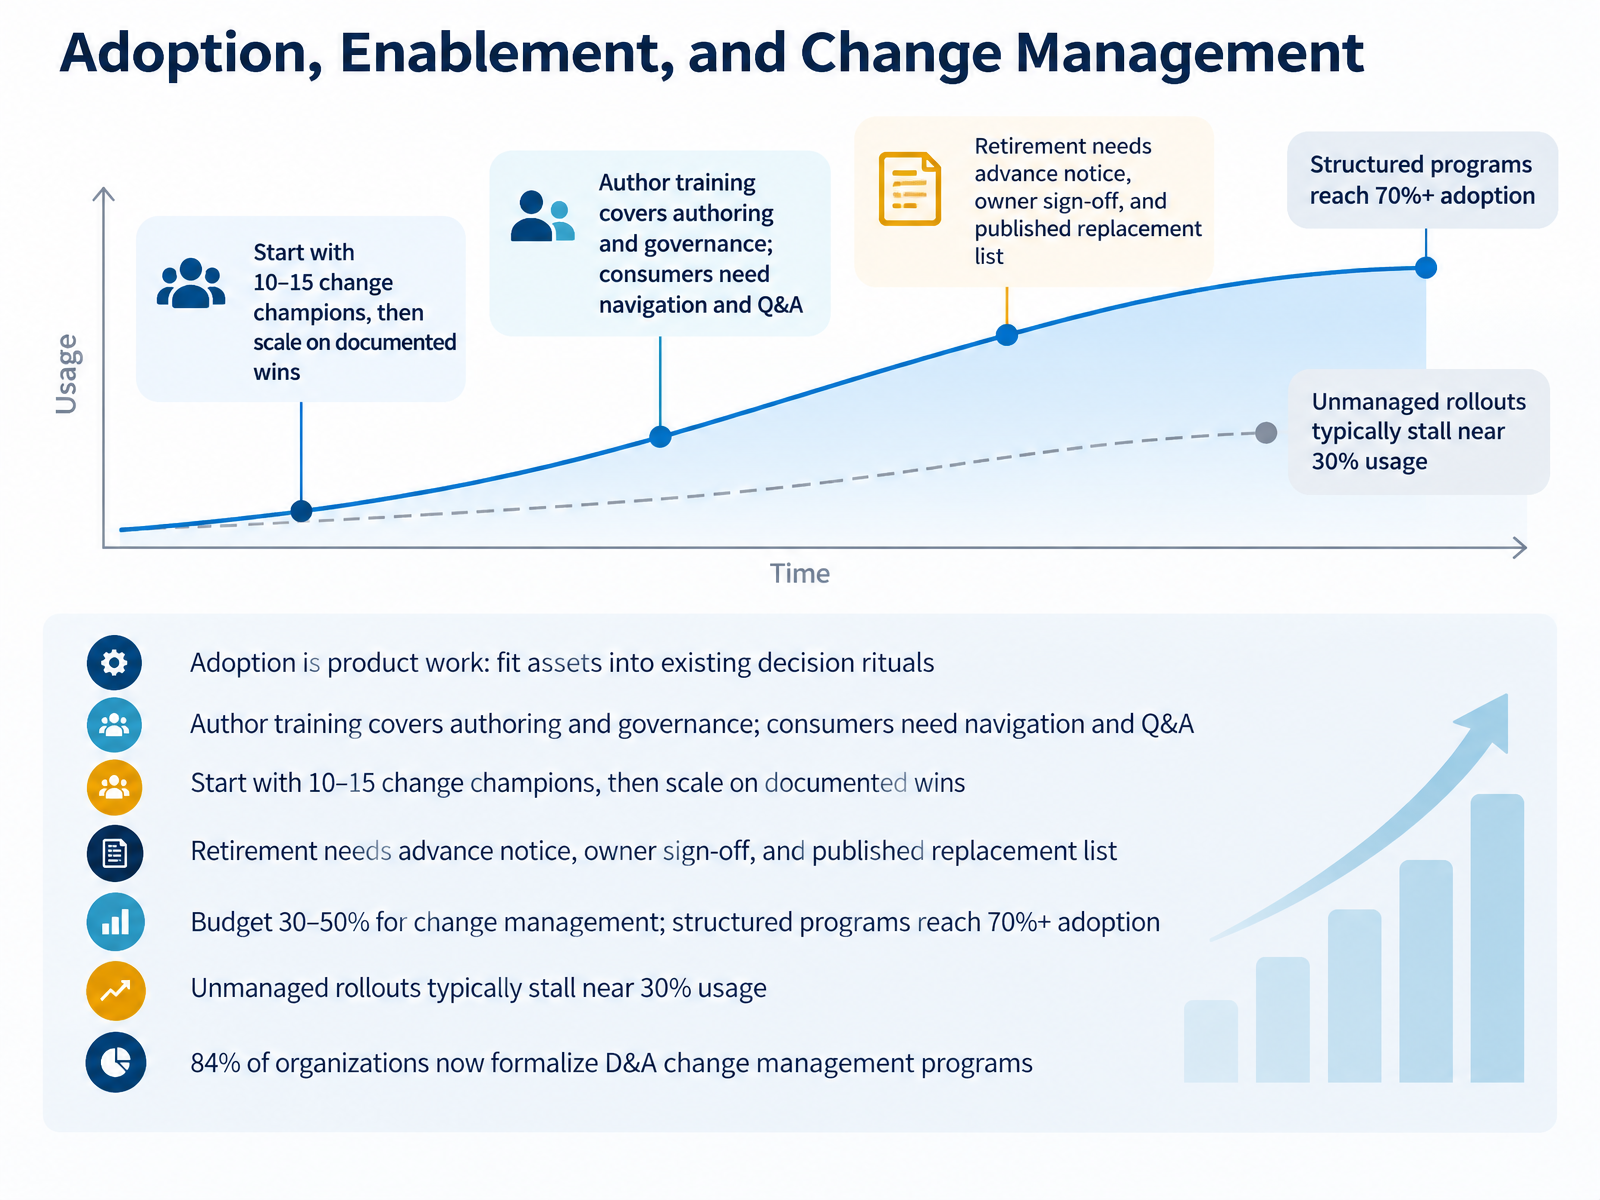
- 11Adoption, Enablement, and Change ManagementLet's talk about adoption, enablement, and change management. Here's the core idea: adoption is product work, not a launch announcement. Fit your assets into existing decision rituals, not the other way around. Training is not one thing. Authors need authoring and governance. Consumers need navigation and Q and A, the kind where they practice finding answers, not just watch a demo. Start with ten to fifteen change champions across business units, then scale on documented wins. Retirement matters too. Give advance notice, get owner sign off, and publish the replacement list. Budget thirty to fifty percent for change management. Structured programs reach seventy percent plus adoption. Unmanaged rollouts stall near thirty percent. And eighty four percent of organizations now formalize data and analytics change management. So ask yourself: who owns adoption on your roadmap? Next, we move into governance, ownership, and the operating model.
 2 min
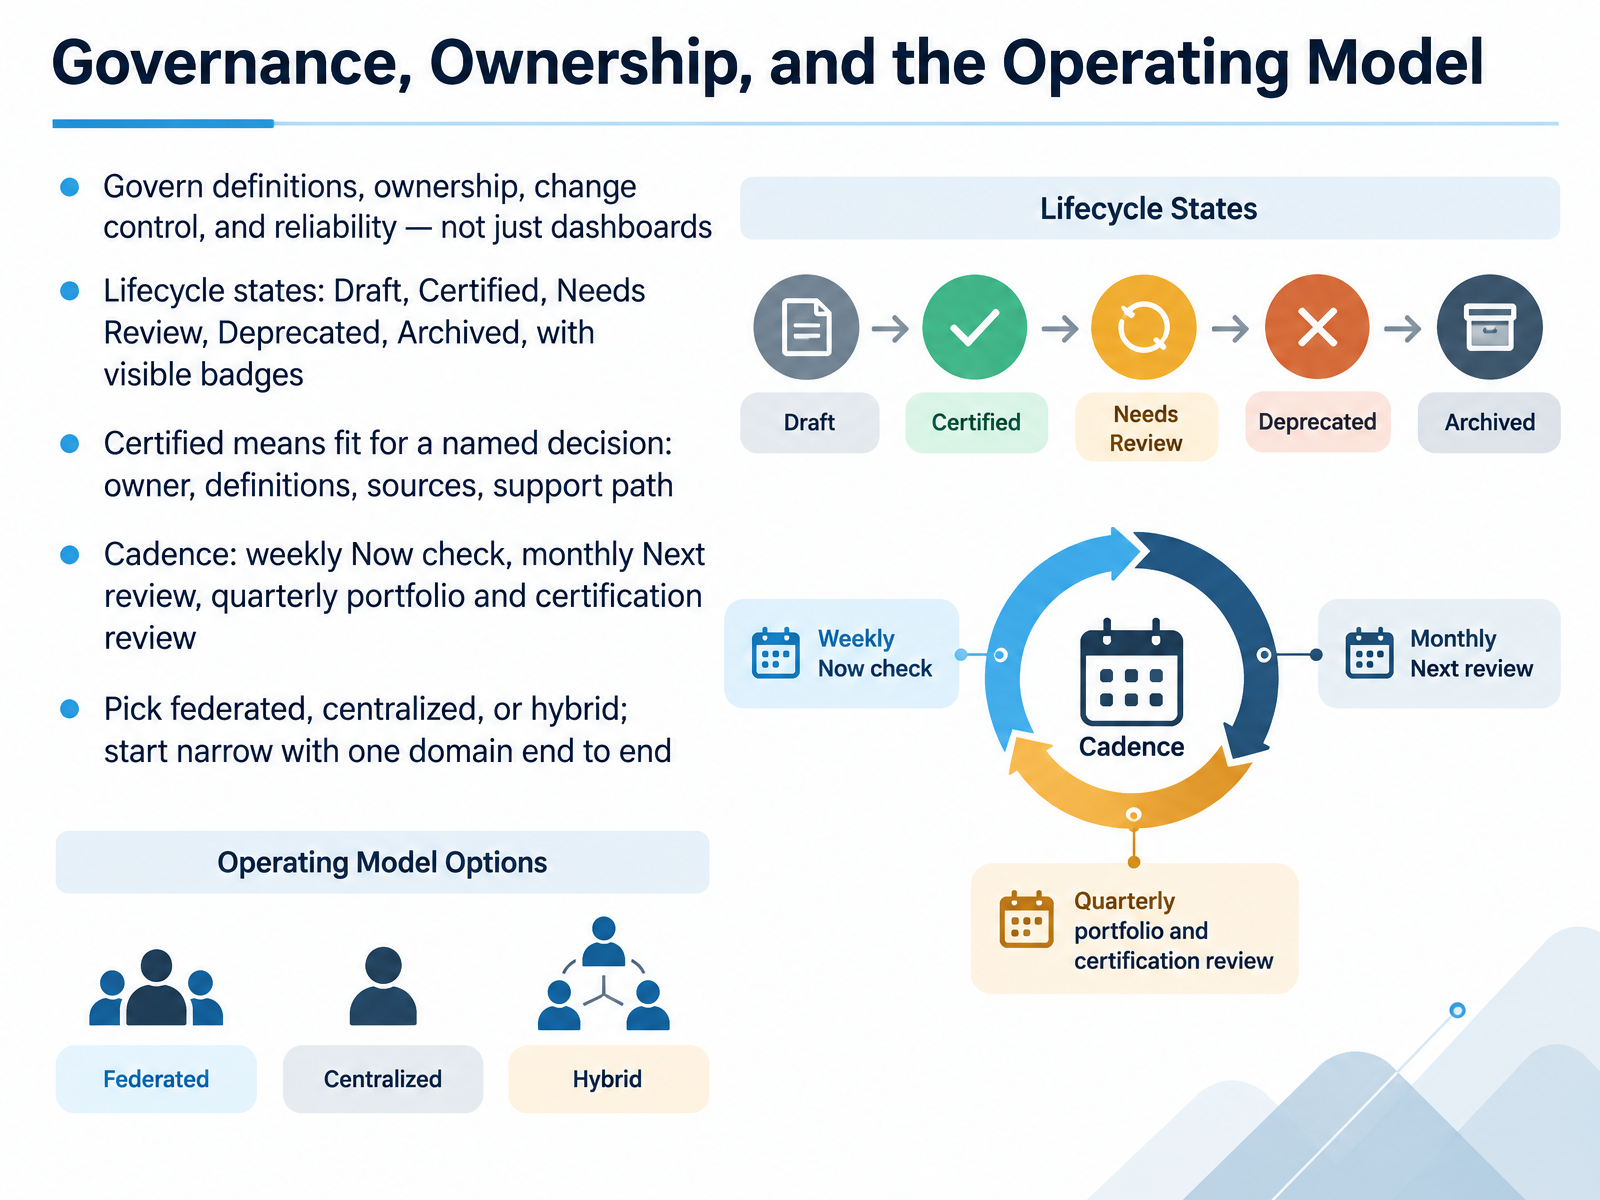
- 12Governance, Ownership, and the Operating ModelLet's talk operating model. The most common governance mistake is treating this as dashboard cleanup. That reduces clutter, but it does not fix the real problem. So govern definitions, ownership, change control, and reliability first. The dashboard is the last mile. By the time a number appears, it has passed through source systems, transformations, and business interpretation.
Use lifecycle states with visible badges. Draft, Certified, Needs Review, Deprecated, Archived. And be strict about what Certified means. It means fit for a named decision, with an owner, agreed definitions, known sources, and a support path. No owner, no certification. Certified is a trust boundary, not a cosmetic tag.
On cadence, keep it light. A weekly Now check on active issues. A monthly Next review on what is coming. A quarterly pass on the portfolio and certification. And on structure, you have three options. Federated, centralized, or hybrid. Hybrid is usually the credible starting point. Domain teams own business meaning. A central group owns standards and controls. Then start narrow. One domain, end to end, before you scale.
Next, we look at Measuring Maturity, ROI, and Roadmap Progress.
 coldstartdata.comcoldstartdata.comforrester.com+22 min
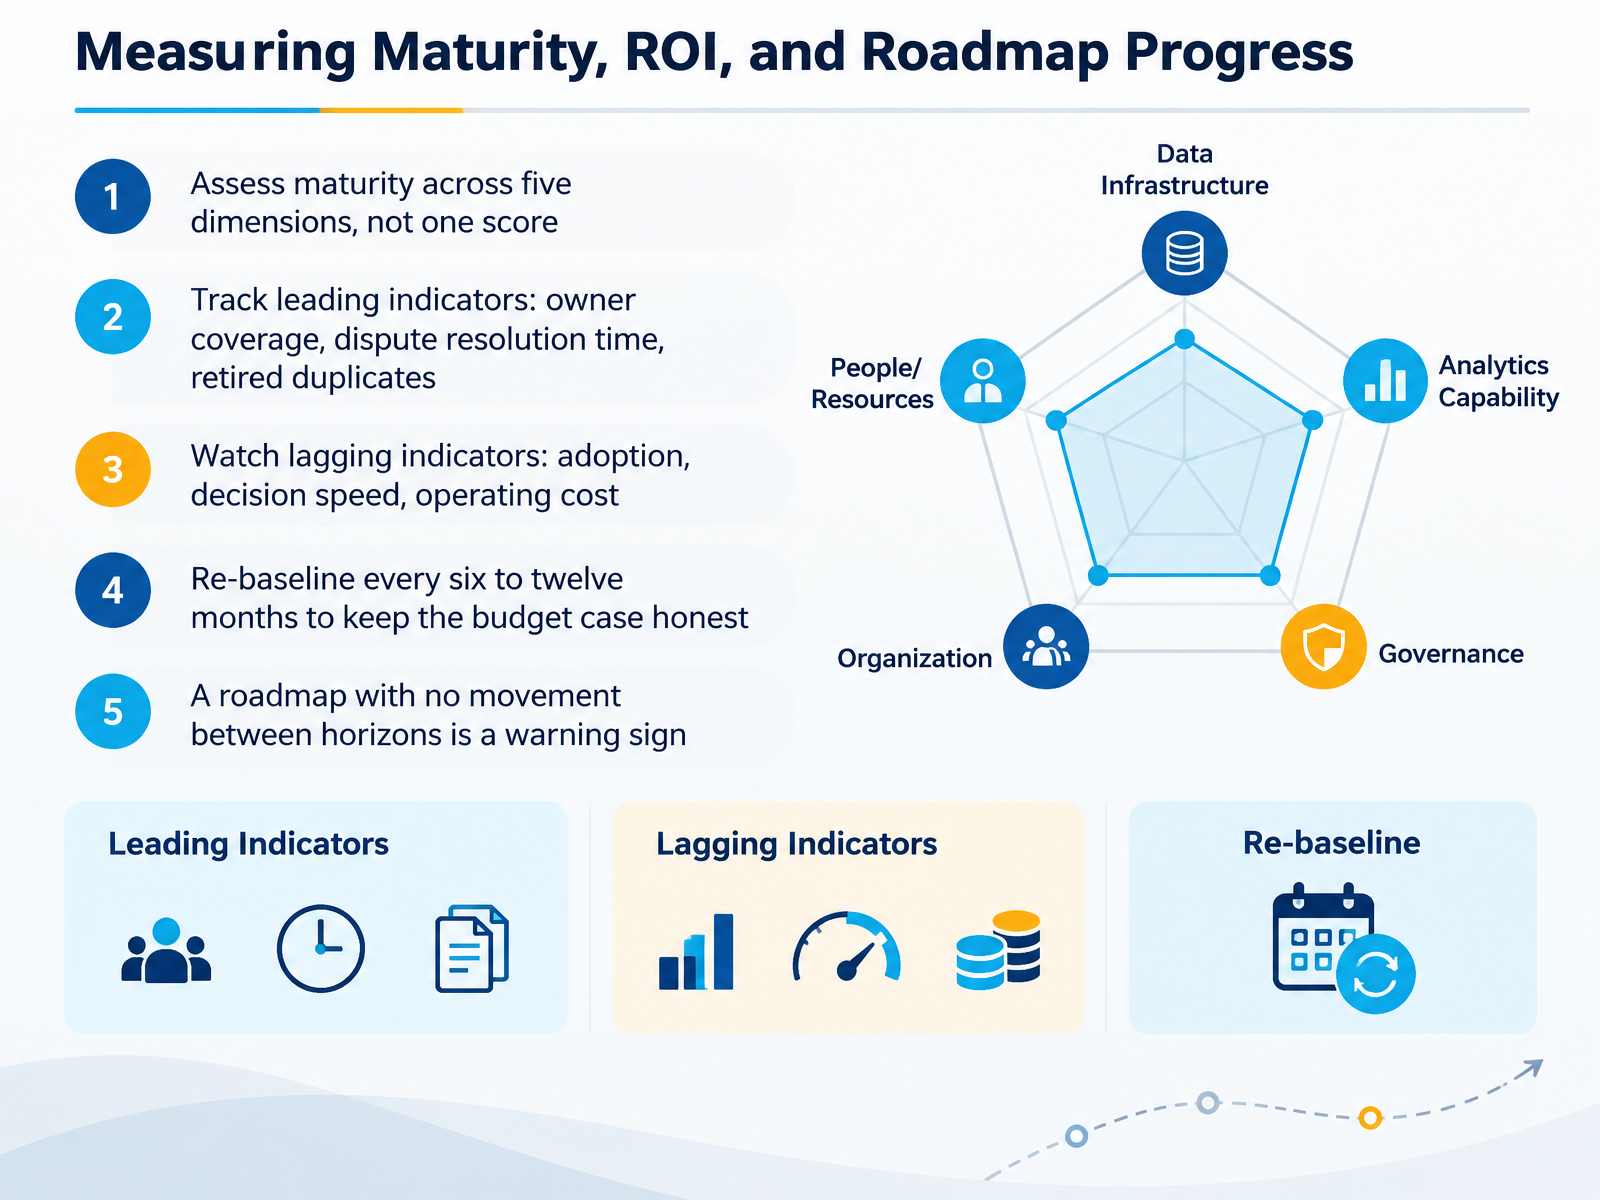
- 13Measuring Maturity, ROI, and Roadmap ProgressLet's move to measurement. This is where a roadmap earns its credibility. First, assess maturity across five dimensions, not one score. Data infrastructure, analytics, governance, organization, and resources. You will be uneven, and that is normal. A strong infrastructure with weak governance is a common pattern. Second, track leading indicators you can influence now. Owner coverage. Dispute resolution time. Retired duplicates. If a dashboard has no owner, adoption will stall. Third, watch lagging indicators. Adoption, decision speed, and operating cost tell you whether the work changed behavior. Fourth, re-baseline every six to twelve months. That keeps the budget case honest and shows real gains. So here is your takeaway. Measure the dimensions separately, move the leading indicators, and let the lagging ones confirm the value. And if nothing moves between horizons, treat that as a warning sign. Next, let's look at composing and communicating the roadmap.
 2 min
- 14Composing and Communicating the RoadmapLet's close with how you actually compose and communicate the roadmap. This is where a good plan earns credibility or loses it.
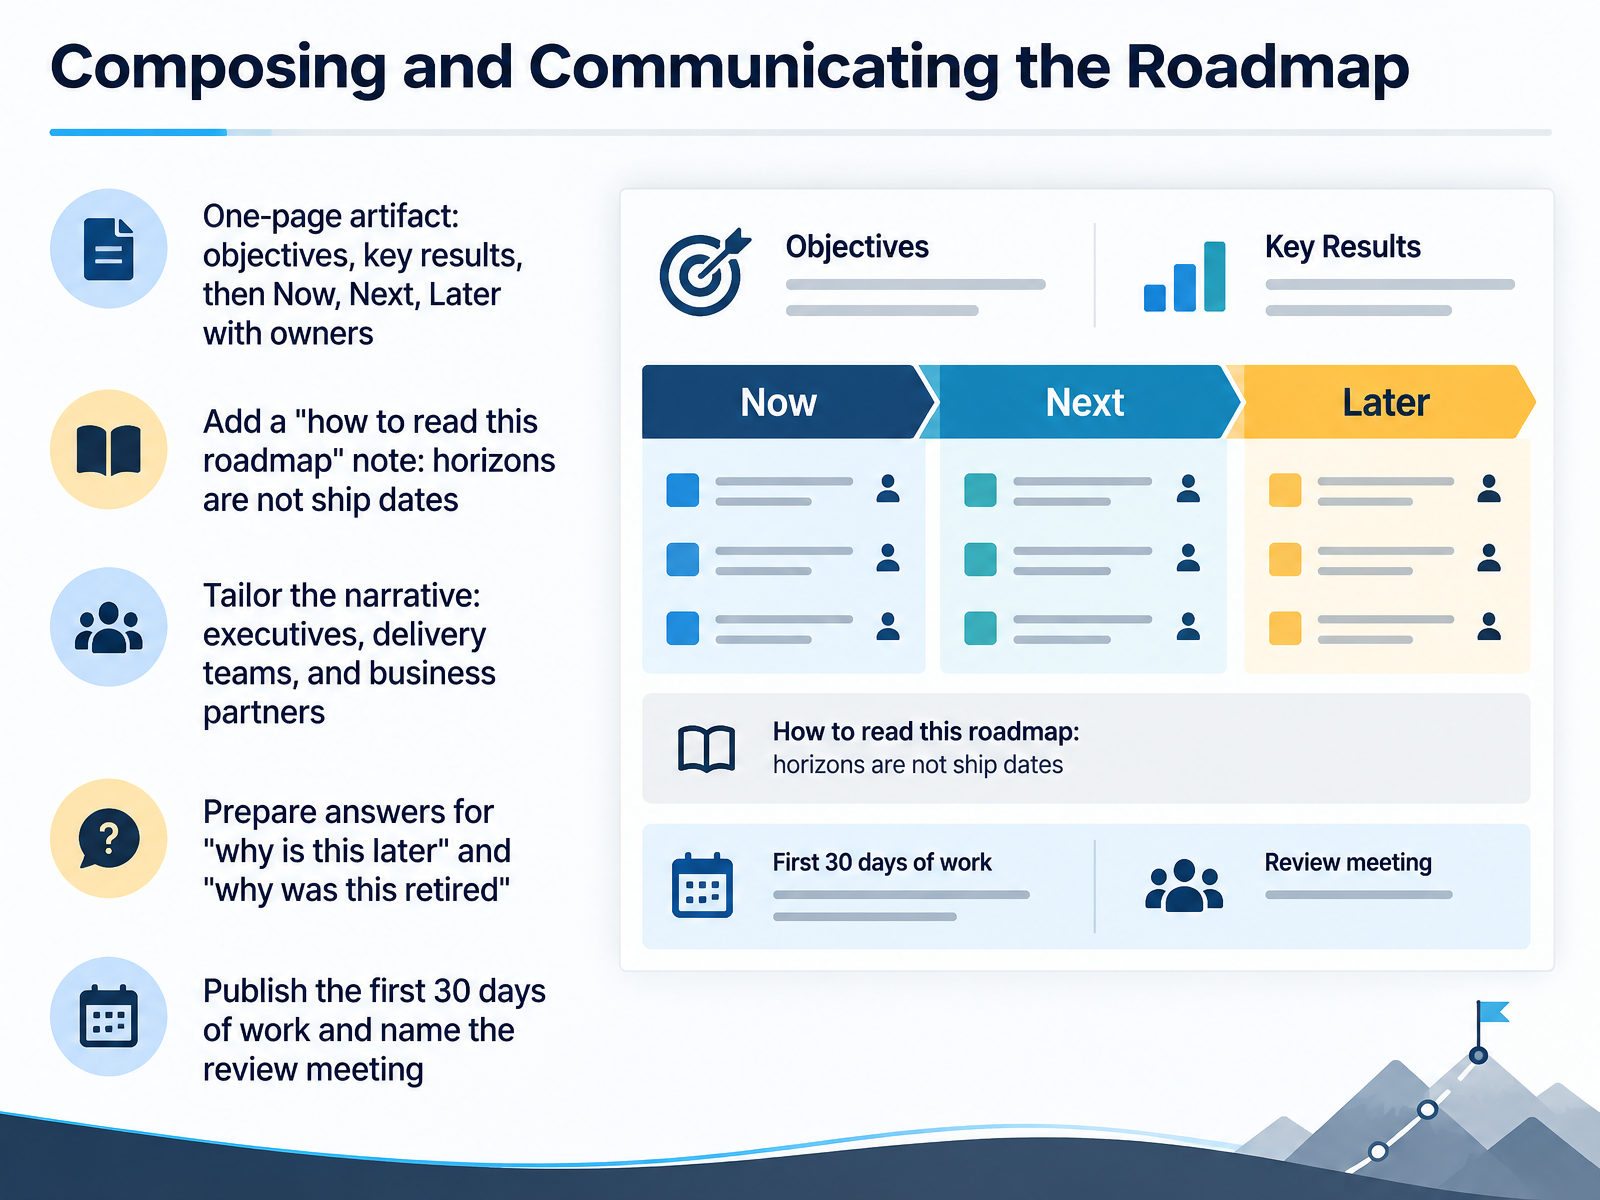
Start with a one-page artifact: objectives and key results at the top, then Now, Next, and Later, each item carrying a single named owner. One page forces the trade-offs into the open.
Add a short note: how to read this roadmap. The critical line is that horizons are not ship dates. Now means committed. Next means validated. Later means directional. Without that note, stakeholders read columns as quarters, and you're back to a Gantt chart with vaguer labels.
Then tailor the narrative. Executives want outcomes and priority rationale. Delivery teams want scope in Now and dependencies in Next. Business partners want direction and what's coming.
Prepare for two questions: why is this later, and why was this retired. Have evidence ready. A usage number, a linked key result, a dependency.
Finally, publish the first thirty days of work and name the review meeting. That's the cadence that keeps the artifact alive.
So, build the one-pager, define the horizons, tune the story per audience, and commit to a review rhythm. Do that, and your roadmap becomes a decision tool, not a slideshow. Thanks for sticking with this. Now go make yours real.
 techtarget.comdatabuzzltd.combasedash.com+22 min
Take the deck with you
Download this course as a file — free, no sign-up needed.
- PDF handoutEvery slide page, ready to print or share.15 pages · 3.2 MBDownload
- Narrated PowerPointThe deck that presents itself — every slide carries the digital human's narration video.15 pages · 13.8 MBDownload
- PowerPoint slidesThe full deck as a .pptx — open it in PowerPoint, Keynote, or Google Slides.15 pages · 3.1 MBDownload
Free to use in your own training — please keep the PersonWise credit page at the end.
Have your own deck? Turn it into a course
Sources consulted
Web sources consulted while building this course.
- How to Roadmap Data Visualization: What Works — johal.in — johal.in
- Data Visualization Best Practices in 2026 (Tools + Rules) | Dupple Blog — dupple.com
- What's the Roadmap to Data Visualization Success? (2026) — computertechreviews.com
- Data Visualization Best Practices: The Complete 2026 Guide — lumenore.com
- How to Roadmap Data Visualization: What Works — johal.in — johal.in
- Why a dashboard audit matters before BI cleanup | TechTarget — techtarget.com
- Dashboard rationalisation — cutting 400 dashboards to 70. | Databuzz Insights — databuzzltd.com
- Dashboard sprawl: audit, certify, retire guide | Basedash — basedash.com
- VizIQ: How to Audit, Consolidate, and Govern Your BI Estate — latentview.com
- BI Dashboard Implementation for a Portfolio Company: What to Decide and How to Judge It - SaaS BPM — saasbpm.com
- BI Governance: Operator Checklist | ColdStart Data — coldstartdata.com
- BI Governance: Common Mistake | ColdStart Data — coldstartdata.com
- The Data Governance RACI Matrix | Forrester — forrester.com
- Power BI Data Governance: Enterprise Framework | Power BI — powerbiconsulting.com
- How Do You Build an Analytics Governance Program That Actually Works in 2026? | bteanalytics.co — bteanalytics.co
- RICE Prioritization Framework for Product Managers [+Examples] — intercom.com
- RICE Score: A Prioritization Framework for PMs | Tempo — tempo.io
- How to Prioritize Feature Requests: A Complete Guide (2026) — finchpulse.com
- README.md — github.com
- RICE Score Calculator: Prioritize Your Product Roadmap With Product Analytics — userpilot.com