Data Science Process Essentials
Begin
15 pages · ~30 min
Data Science Process Essentials
This training introduces data science professionals to the end-to-end process, key roles, and deliverables across project stages, enabling learners to structure and manage data science projects effectively.
What you’ll learn
- 01Data Science Process: Stages, Roles, and DeliverablesWelcome. If you are here, you have probably seen it firsthand: a model that looks brilliant in a notebook but never survives contact with the real world. That gap between promise and delivery is almost never about math. It is about process. Today, we are going to map the full data science lifecycle, from problem framing all the way to monitoring and retraining. We will clarify who owns what at each stage, and we will pin down the specific deliverables that keep projects moving. This is designed for data science learners, data teams, and technical managers alike. By the end, you will be able to map stages to roles and know exactly what output is expected at each step. The goal is simple: to give you the structure that separates shipping models from stagnant notebooks. Let's get into why process discipline beats ad hoc analysis.analyticsinsight.netreviewpublically.comgithub.com+21 min
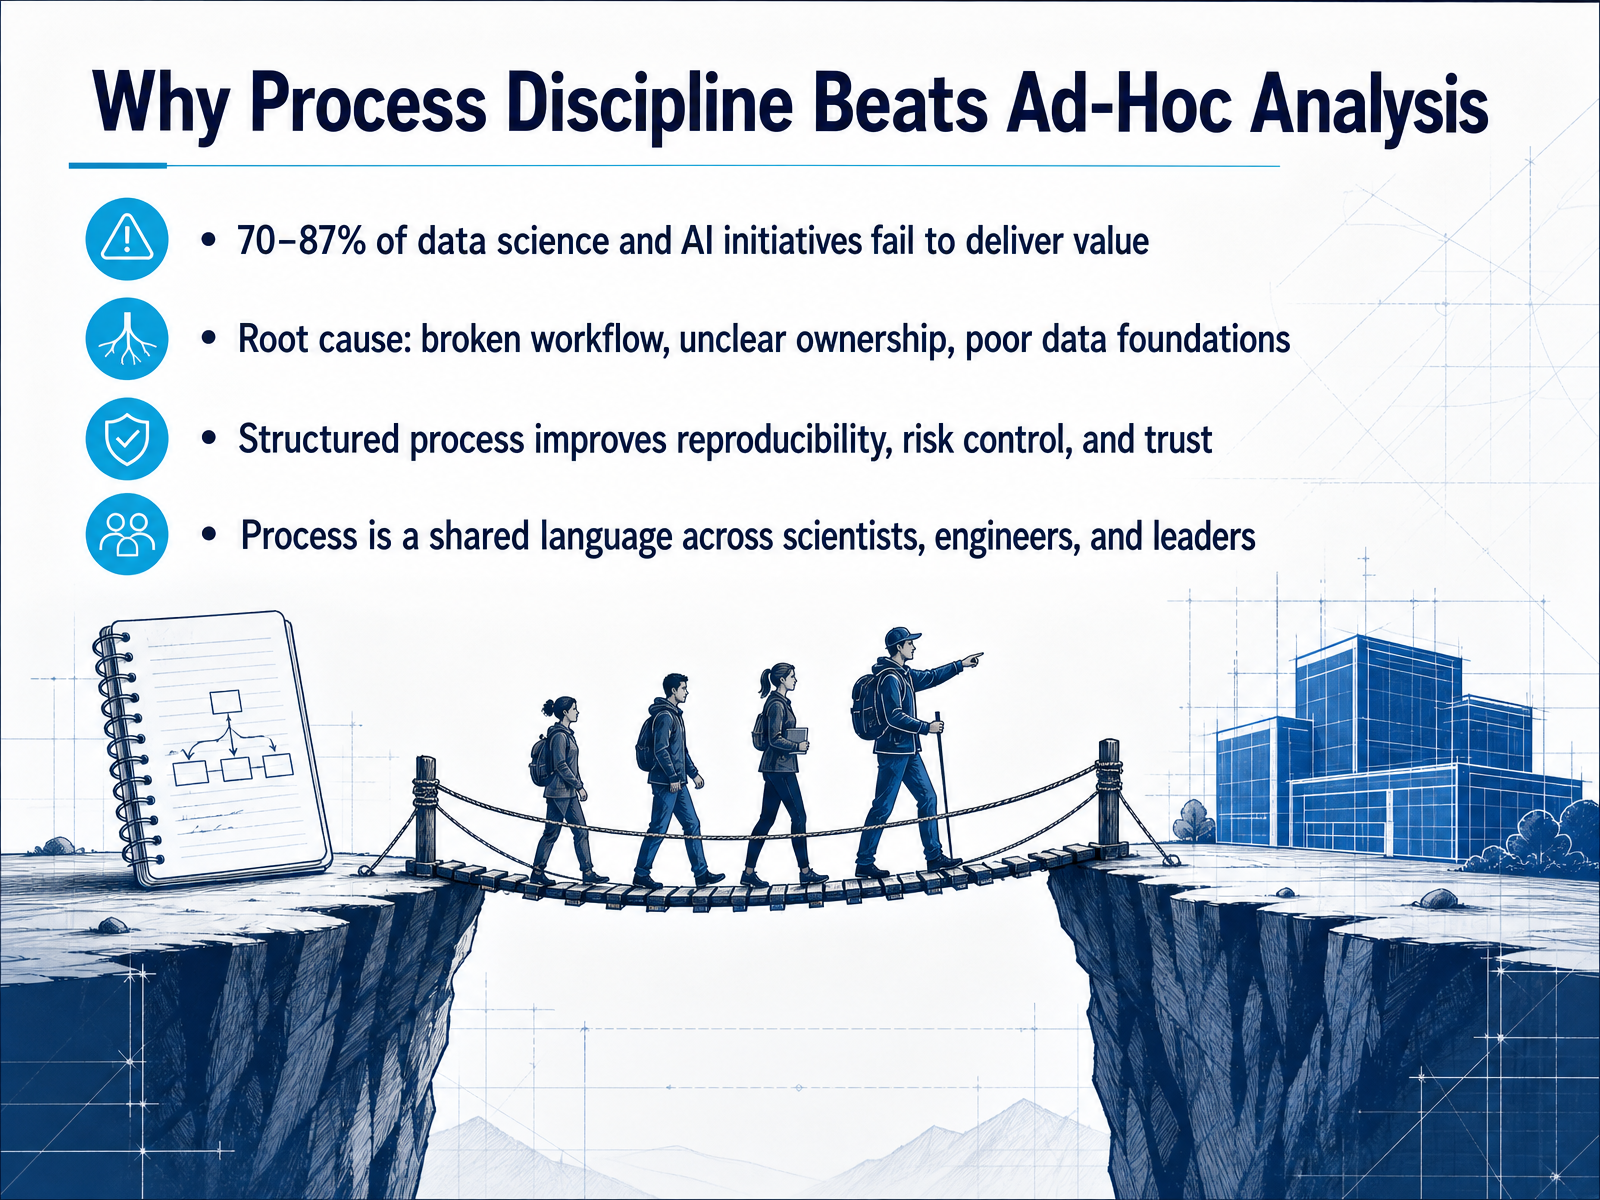
- 02Why Process Discipline Beats Ad-Hoc AnalysisLet's be direct about the stakes. Industry research consistently shows that between seventy and eighty-seven percent of data science and AI initiatives fail to deliver real business value. That's not a technology problem. The root causes are much more practical: broken workflows, unclear ownership, and weak data foundations. Projects stall, models never reach production, and trust erodes. A structured process changes that. It gives you reproducibility, so results can be verified. It gives you risk control, so problems surface early. And it builds trust, because stakeholders can see exactly how decisions are made. Think of process as a shared language. When data scientists, engineers, and business leaders all understand the same stages and handoffs, collaboration gets easier and outcomes get more predictable. You don't need to be perfect — you need to be deliberate. Next, let's look at the major lifecycle frameworks, starting with CRISP-DM and how it compares to TDSP and KDD.
 rand.orgdoi.orgsloanreview.mit.edu+22 min
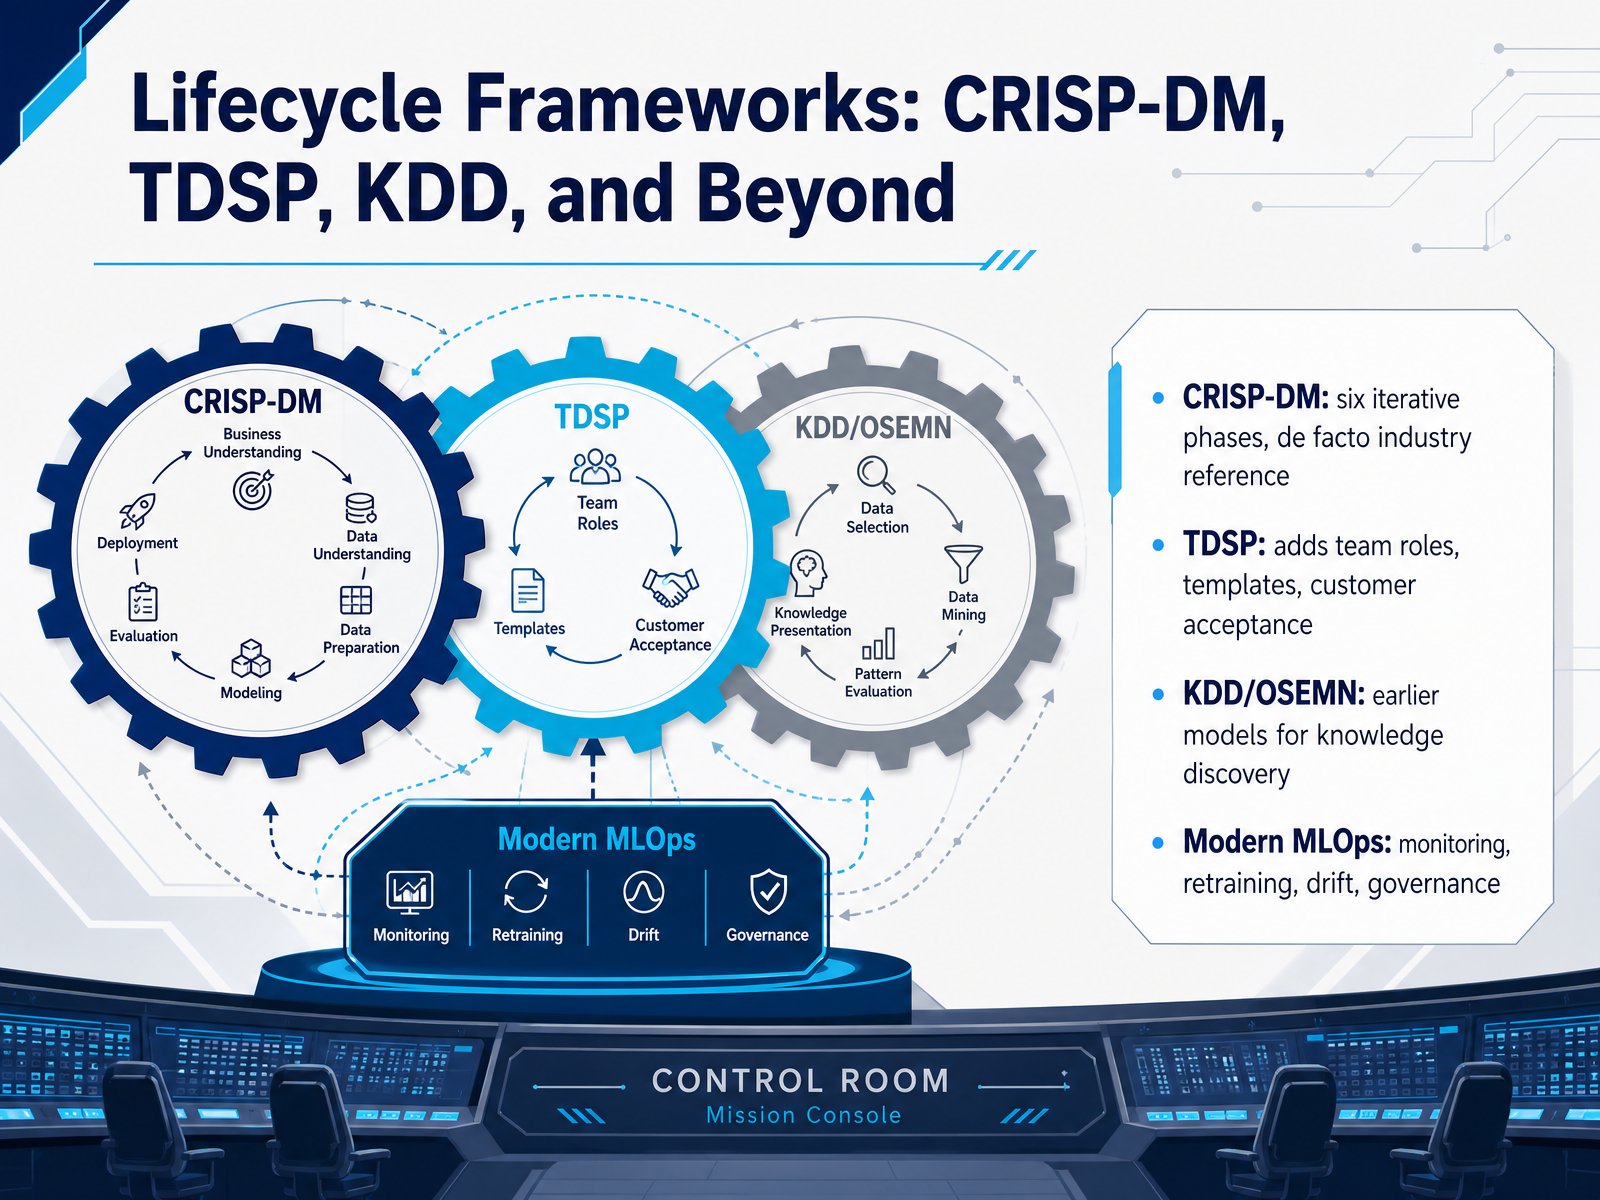
 - 03Lifecycle Frameworks: CRISP-DM, TDSP, KDD, and BeyondNow let's talk about the frameworks that structure all of this work. The most recognized is CRISP-DM, the Cross-Industry Standard Process for Data Mining. It's been around since the late nineties, and it's still the de facto reference with six iterative phases. But a word of caution: it doesn't tell you who does the work, and it was never designed for the modern operational challenges.
That's where Microsoft's TDSP, the Team Data Science Process, steps in. It shares the same DNA as CRISP-DM but adds what's missing: explicit team roles, documentation templates, and a dedicated customer acceptance stage. Frameworks like KDD and OSEMN came earlier, focusing on knowledge discovery from data, but they don't cover business understanding or deployment well.
Here's the key takeaway: in 2026, none of these alone are enough. A modern workflow extends beyond deployment to what we call MLOps, covering monitoring, drift detection, and automated retraining. So think of these frameworks as a solid foundation, but you'll need to build the operational layer on top. Next, let's look at how to choose and adapt a framework for your specific context.
 analyticsinsight.netreviewpublically.comgithub.com+22 min
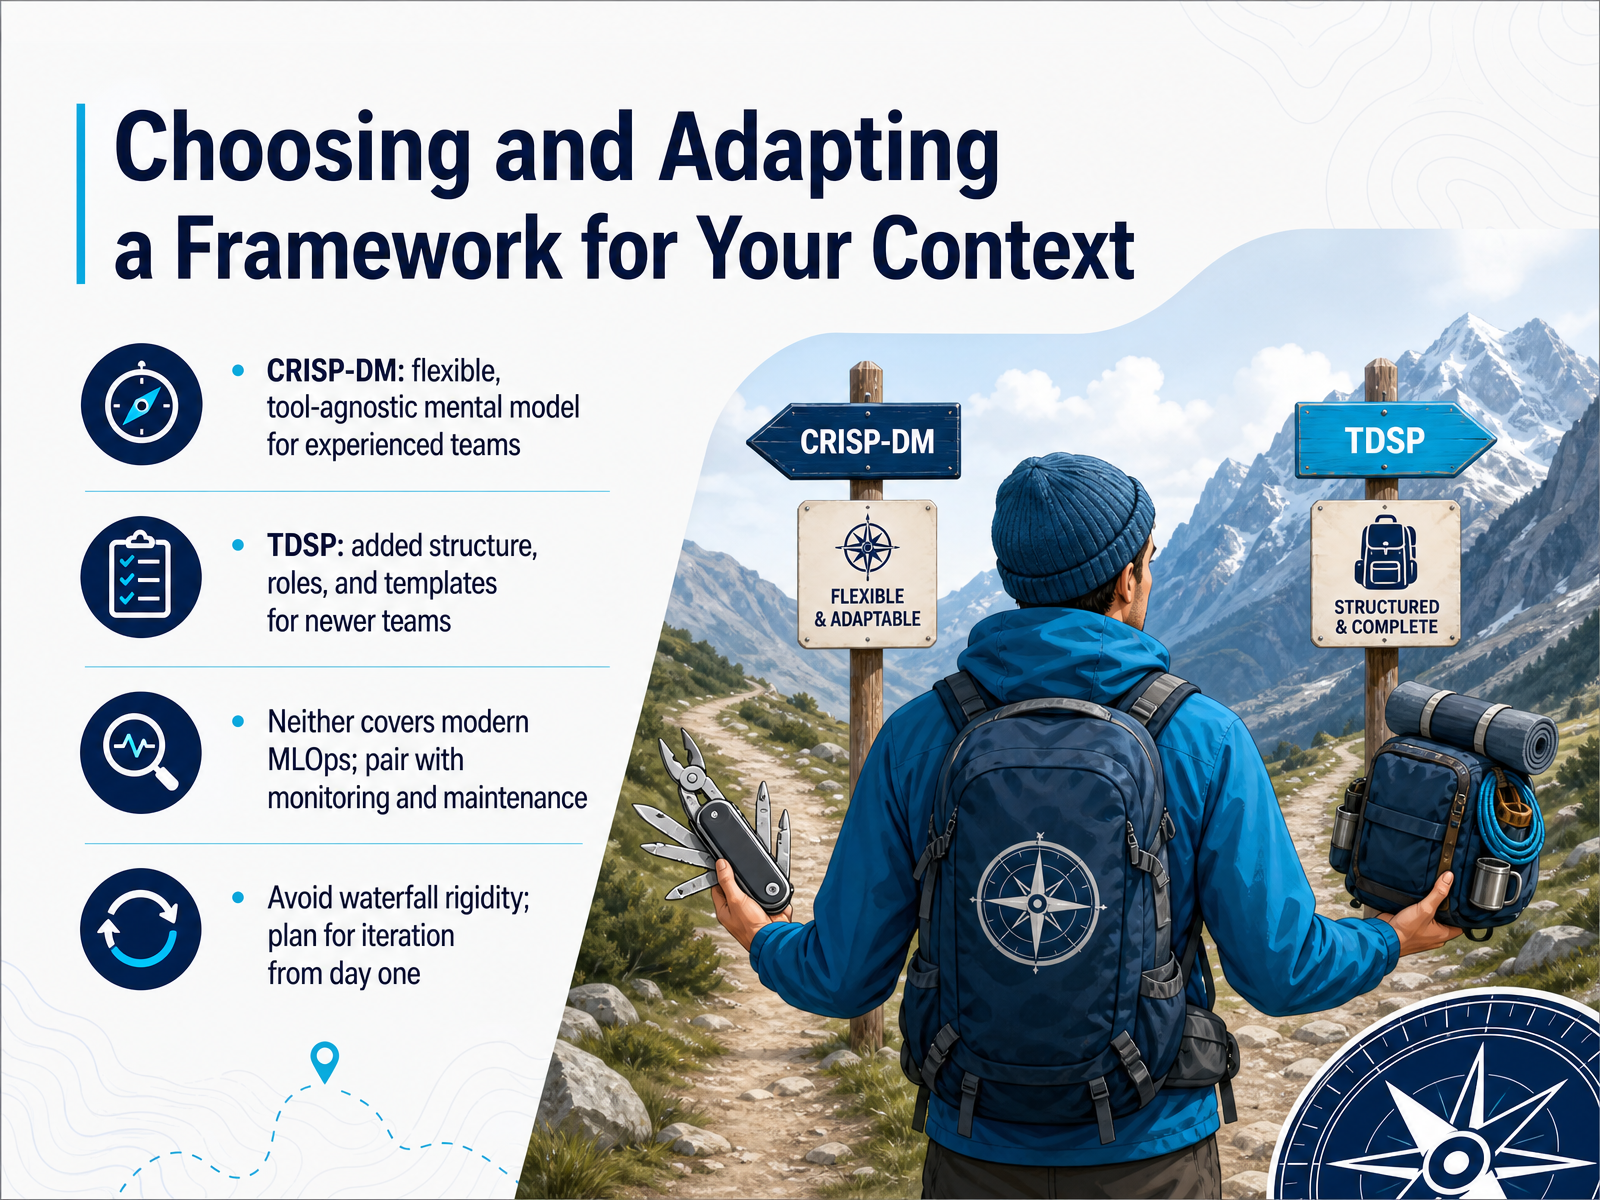
 - 04Choosing and Adapting a Framework for Your ContextChoosing the right framework isn't about picking a winner. It's about fit. CRISP-DM is flexible, tool-agnostic, and works well for experienced teams that need a mental model rather than a rulebook. TDSP, on the other hand, gives you structure: defined roles, templates, and a standardized project layout. That's invaluable when you're building a new team or standardizing across multiple squads. But here's the key point: neither framework was designed for modern MLOps. They predate continuous training, model monitoring, and drift detection. So if your model will live in production, you need to pair your chosen framework with monitoring and maintenance practices from day one. And one more warning: resist the urge to treat these phases like a linear waterfall. CRISP-DM's arrows point in every direction for a reason. Planning for iteration is not a failure of process, it's the reality of data science. The data will change your assumptions, and your framework should let you go back without bureaucratic friction. As we move into the core stages, keep that flexibility front and center.
 publica.fraunhofer.dedoi.orgai-solutions.wiki+21 min
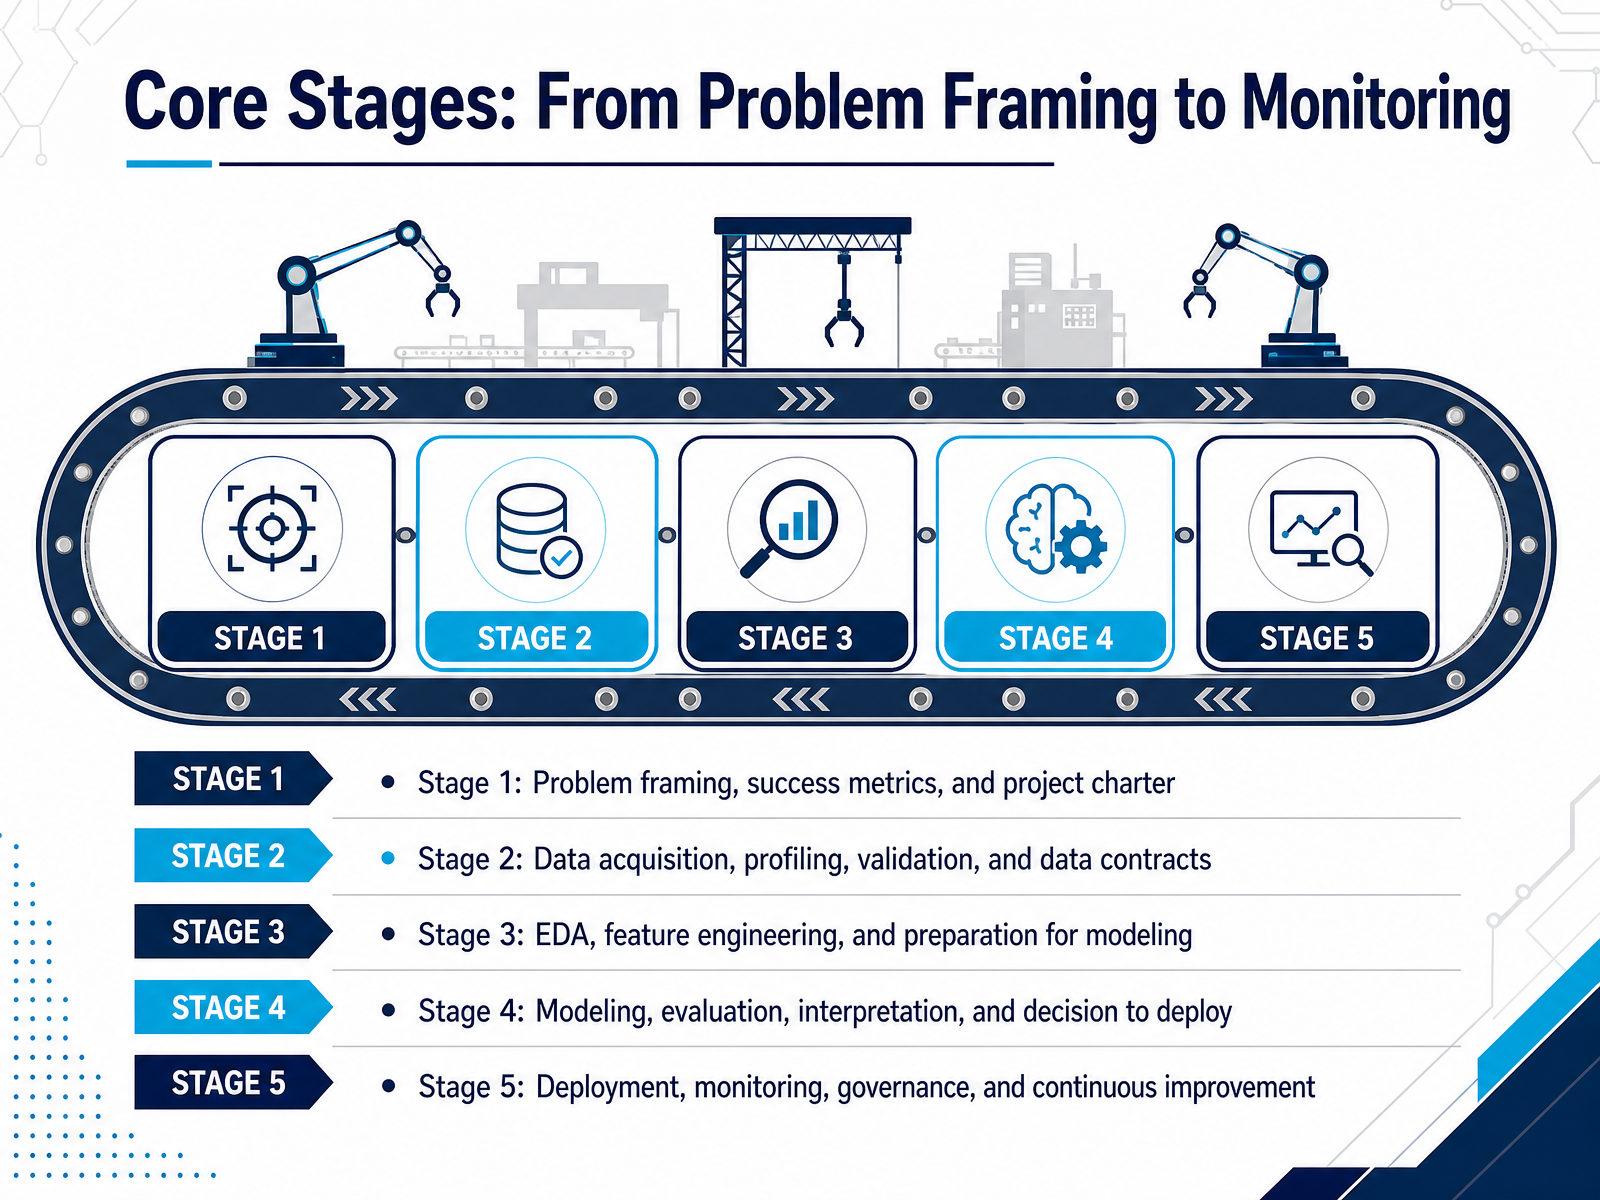
 - 05Core Stages: From Problem Framing to MonitoringLet’s walk through the core stages of a data science project, from the first conversation to long-term maintenance. It all starts with problem framing. This is where you define success metrics and create a project charter. This document is your north star; it keeps stakeholders aligned and prevents the classic mistake of building a technically impressive model that answers the wrong question. Once the problem is framed, you move to data acquisition. This isn't just pulling data; it's profiling it, validating quality, and formalizing expectations with data contracts so everyone agrees on definitions and update schedules. Then comes the hands-on phase: exploratory data analysis, feature engineering, and preparing the data for modeling. This is where you uncover patterns and build the variables your model will actually learn from. Next is modeling and evaluation. You experiment, compare baselines, and interpret results. Crucially, this is where you make the explicit decision to deploy. Finally, deployment is not the end. It opens stage five: monitoring, governance, and continuous improvement. Models degrade, so you watch for data drift and set up retraining triggers. This stage is what turns a one-off experiment into a lasting system. Now, let’s examine the specific inputs, activities, and outputs that define each of these stages.
 analyticsinsight.netreviewpublically.comgithub.com+22 min
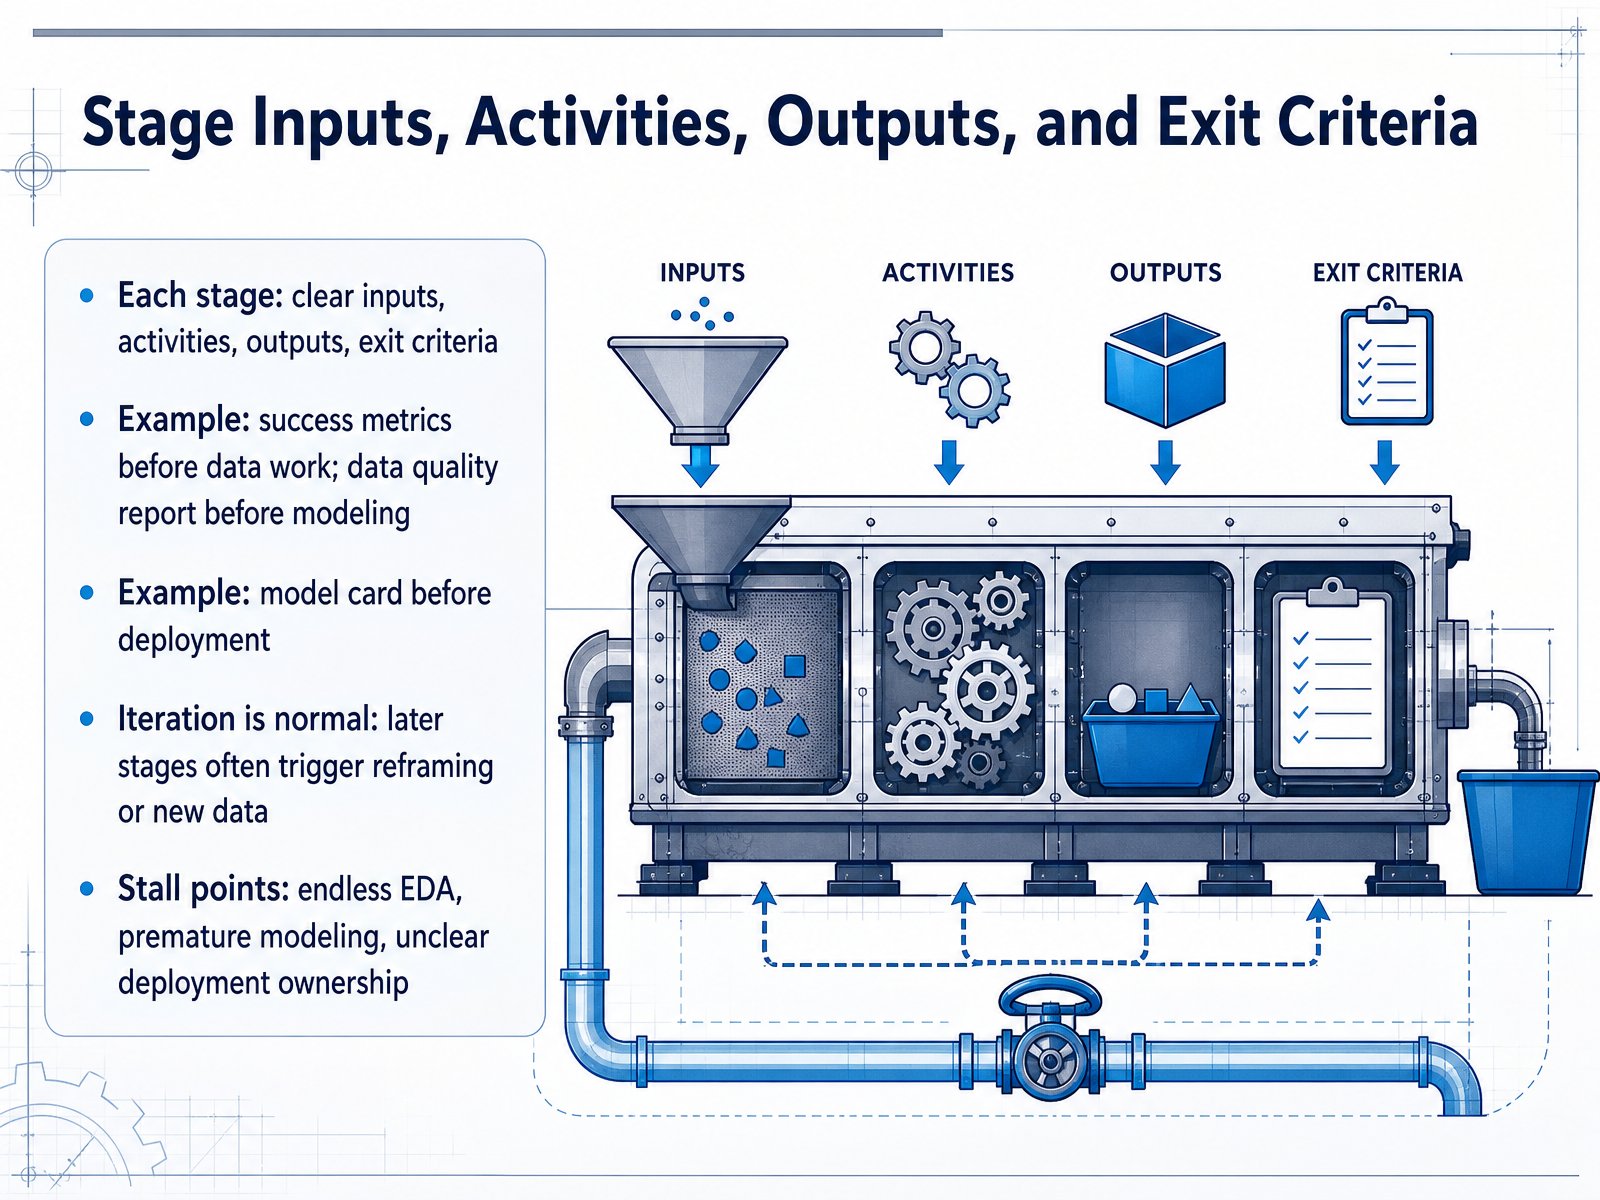
 - 06Stage Inputs, Activities, Outputs, and Exit CriteriaLet’s talk about what actually moves a project forward. Every stage in the data science lifecycle needs four things: clear inputs, defined activities, concrete outputs, and—most importantly—explicit exit criteria. Exit criteria are the conditions that tell you a stage is truly done. For example, you shouldn’t start any data work until success metrics are defined, and you shouldn’t start modeling until a data quality report is signed off. Likewise, a model card—a document that details how and why a model works—should exist before you even think about deployment. And remember, iteration is normal. Findings from later stages often force you to reframe the problem or pull in new data. That’s healthy, not a failure. What you do want to watch for are stall points: endless EDA with no conclusions, premature modeling on dirty data, or—very common—unclear ownership of deployment. Any of those will quietly kill a project. If you keep an eye on exit criteria, you keep the work moving. Up next, we’ll look at the roles that carry each stage of the process.
 analyticsinsight.netreviewpublically.comgithub.com+22 min
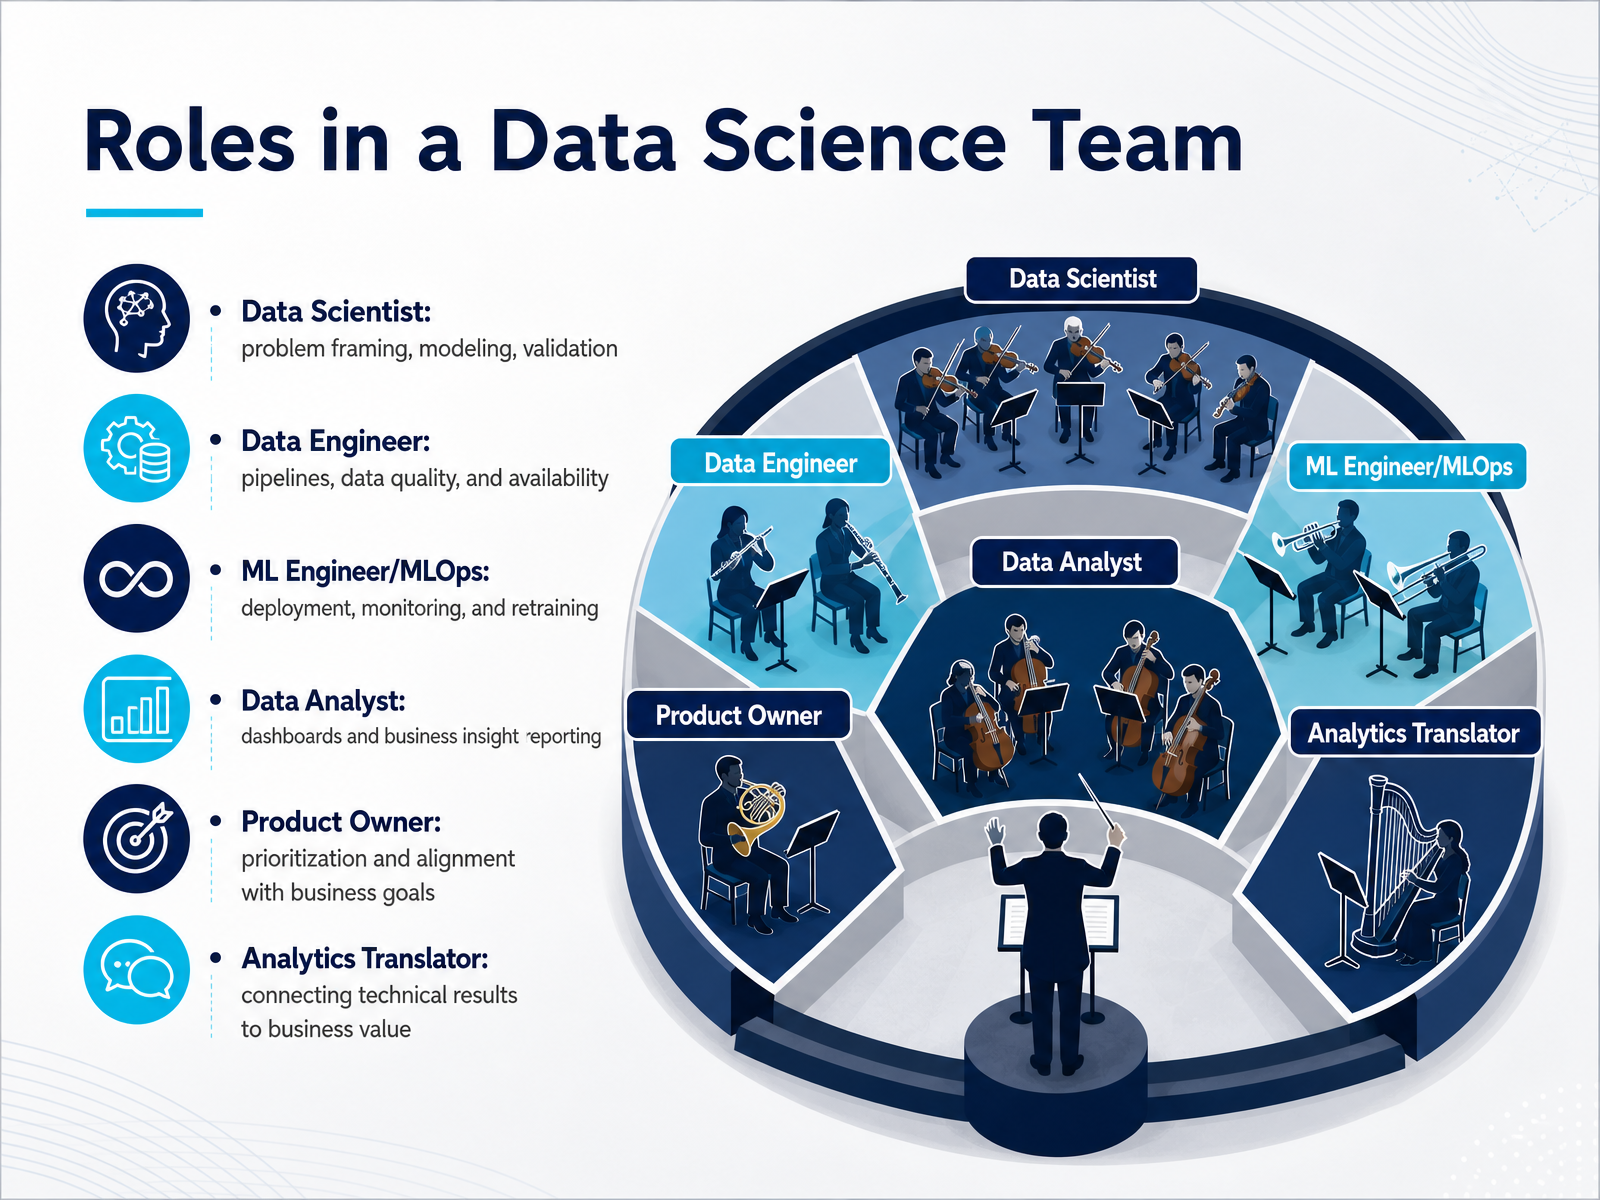
 - 07Roles in a Data Science TeamNow let's talk about the people who actually make data science work. Every role on a high-performing team has a distinct job, and clarity here prevents most project friction. The Data Scientist owns problem framing, modeling, and validation—they are the analytical core, turning questions into testable hypotheses. Next, the Data Engineer builds the pipelines and ensures data quality and availability. If the data is unreliable, nothing downstream matters. Then there's the ML Engineer or MLOps specialist, focused on deployment and monitoring. They keep the model alive in production, track drift, and manage retraining. On the business side, the Data Analyst handles dashboards and insight reporting for day-to-day decisions. The Product Owner prioritizes work and keeps everything aligned with business goals. And finally, the Analytics Translator—this is the bridge role connecting technical results to business value, making sure stakeholders understand what the model means and what to do about it. The key takeaway: the Data Scientist doesn't own the project alone. Each role carries responsibility, and successful teams design explicit handoffs between them. With that ownership in mind, let's look at how to map these roles across the lifecycle stages.
 language.foundationclickup.comcompelframework.org+22 min
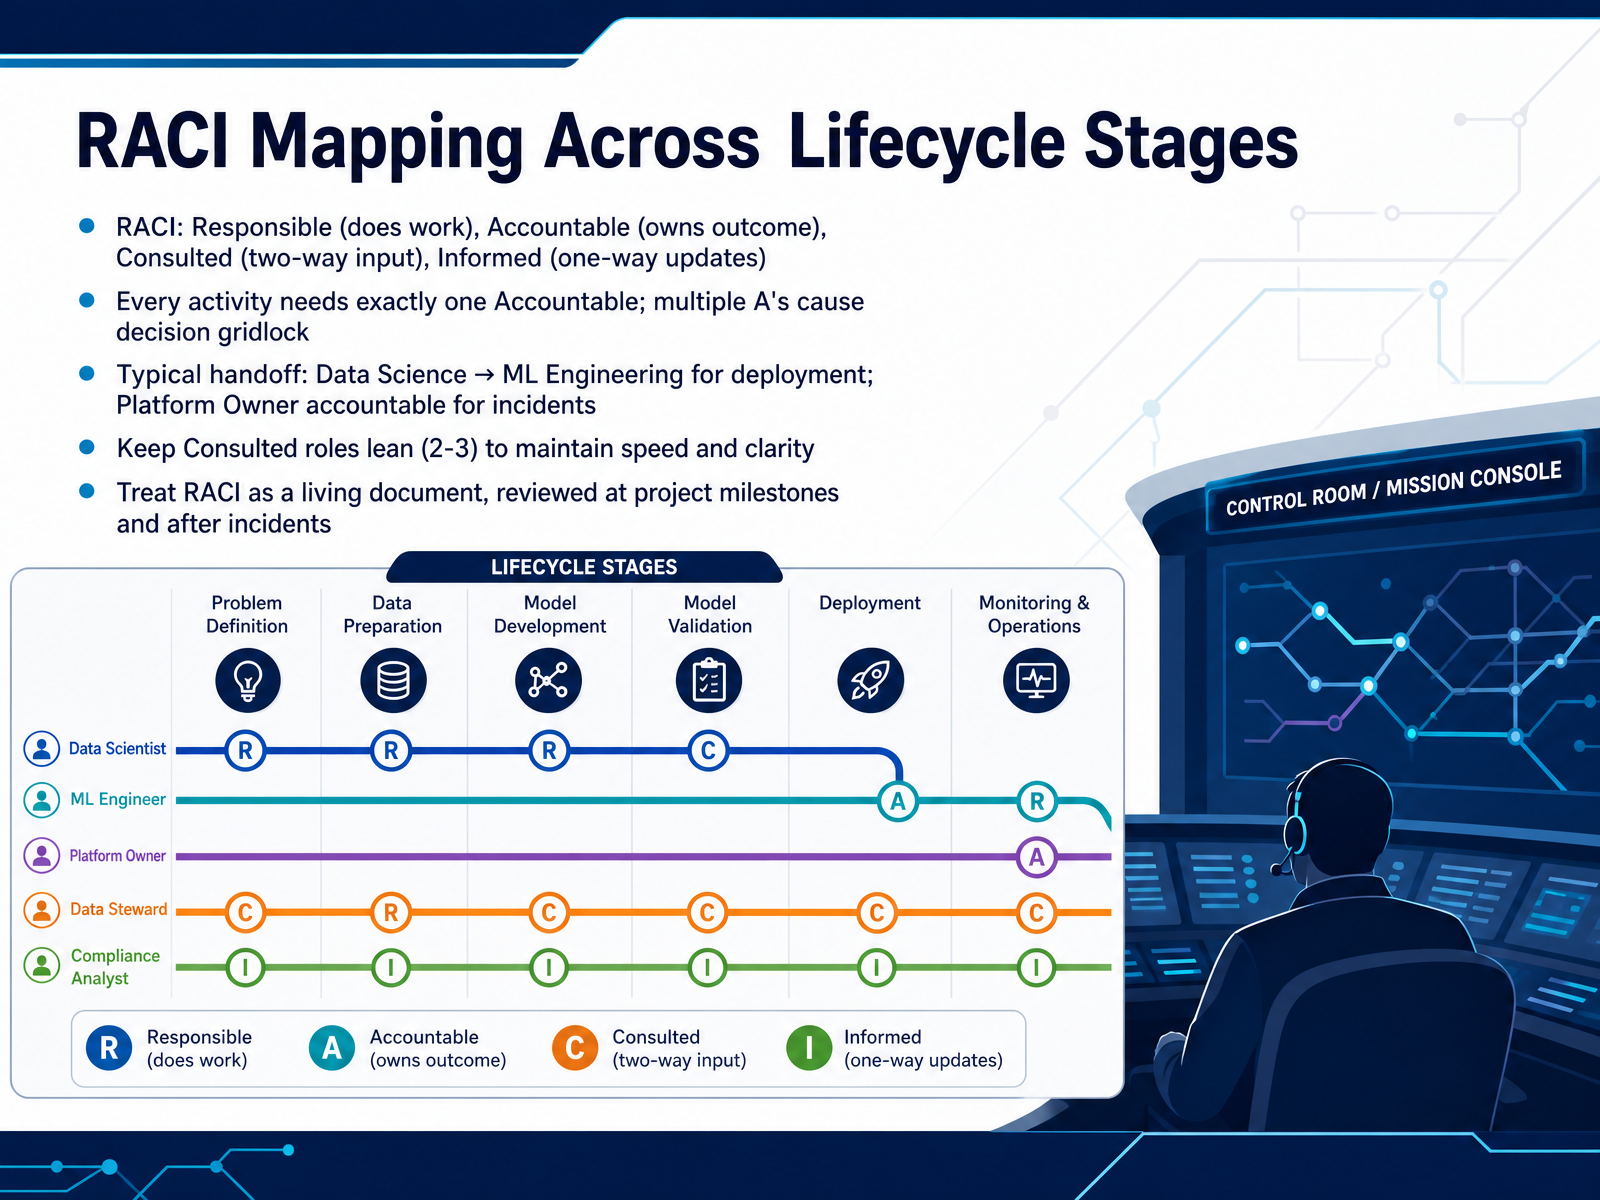
 - 08RACI Mapping Across Lifecycle StagesNow let’s talk about turning that lifecycle into clear ownership. A RACI matrix is the practical tool for this. RACI stands for Responsible, Accountable, Consulted, and Informed. Responsible means the person who does the work. Accountable is the single owner of the outcome. Consulted means two-way input before a decision, and Informed is a one-way update after the fact. Here’s the key rule: every activity needs exactly one Accountable. If you assign two A’s to one task, you’re not sharing ownership — you’re creating gridlock. So make the choice explicit. A typical handoff looks like this: Data Science is Responsible for building the model, but ML Engineering takes over as Accountable for deployment. And if an incident happens in production, the Platform Owner is Accountable, not the data scientist who trained the model. Keep your Consulted list lean, ideally two or three roles, so decisions don’t slow down. And treat the RACI as a living document. Review it at project milestones, and definitely after any incident, because that’s where gaps and overlaps surface. Next, let’s look at the actual deliverables each lifecycle stage produces.
 language.foundationclickup.comcompelframework.org+22 min
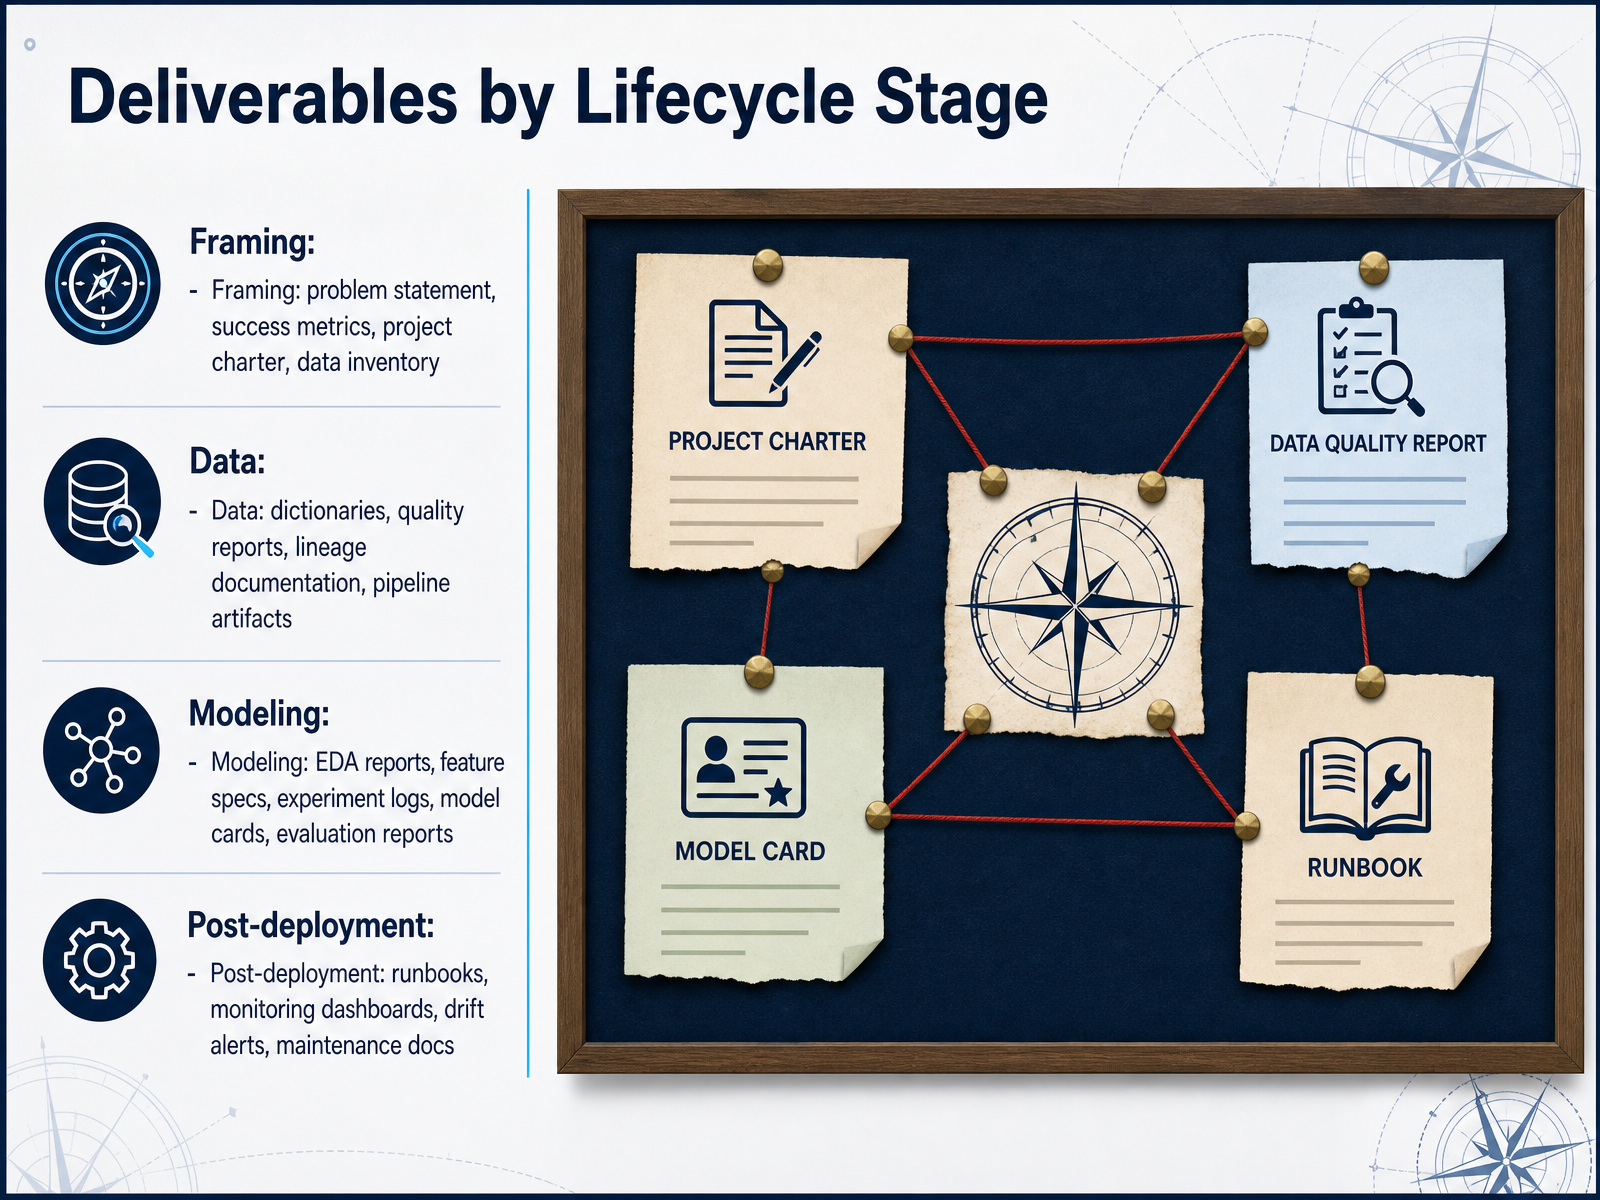
 - 09Deliverables by Lifecycle StageLet’s talk about what you actually hand off at each stage of the lifecycle. In framing, the deliverables are the problem statement, success metrics, the project charter, and a data inventory. These documents anchor the project and keep everyone aligned. During data acquisition, you’ll produce data dictionaries, quality reports, lineage documentation, and pipeline artifacts. These are your proof that the data is trustworthy. When you get to modeling, everything should be captured: EDA reports, feature specs, experiment logs, model cards, and evaluation reports. This is your audit trail—it tells the story of why you built what you built. And after deployment, the focus shifts to runbooks, monitoring dashboards, drift alerts, and maintenance docs. These are what keep the system alive and make sure issues are caught early. Remember, the deliverable isn’t just a file—it’s the clarity it provides to your team and stakeholders. Now, let’s look at what actually makes a deliverable usable.
 analyticsinsight.netreviewpublically.comgithub.com+21 min
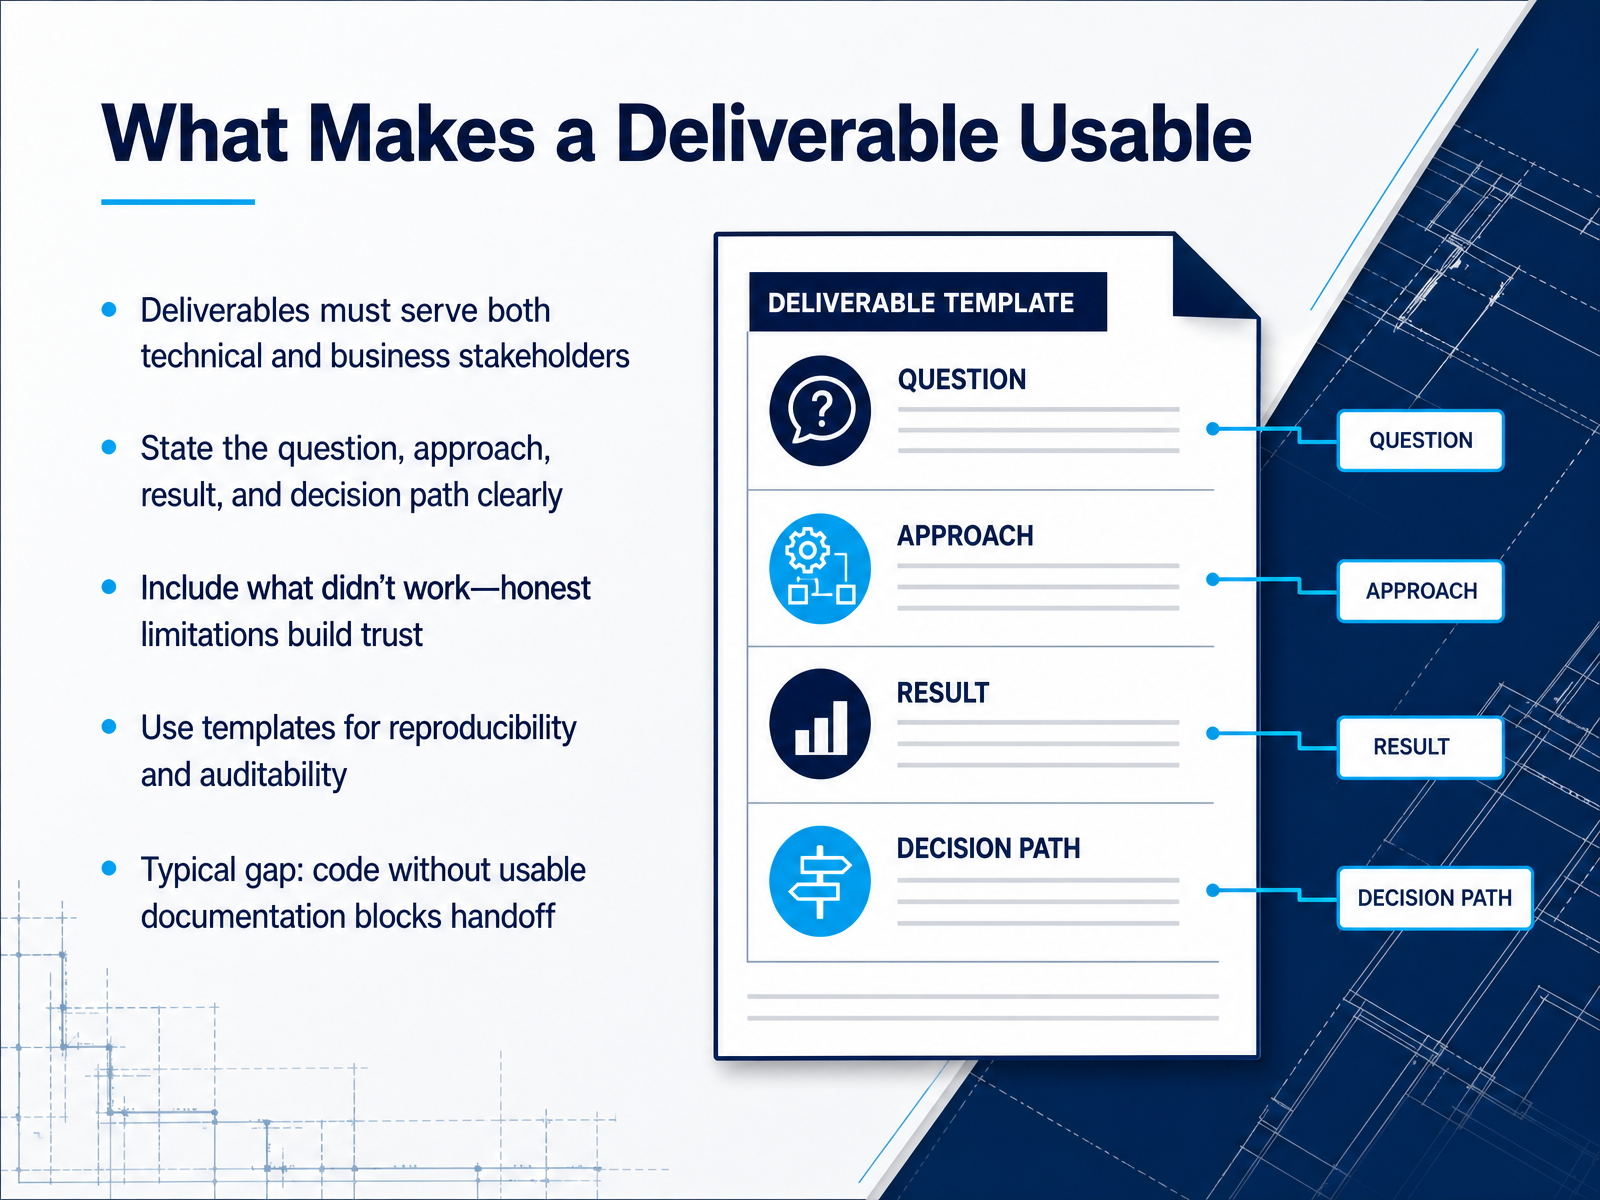
 - 10What Makes a Deliverable UsableLet’s talk about what actually makes a deliverable usable. It’s not just about code that runs. A deliverable has to serve both technical and business stakeholders. That means stating the question, the approach, the result, and the decision path clearly—so anyone can follow your logic. Don’t hide what went wrong. Honest limitations build trust, and a short section on what didn’t work shows you made deliberate choices. Use templates for everything—model reports, data dictionaries, even the final summary. Templates make your work reproducible and auditable, which matters downstream. The biggest gap I see in practice is code without usable documentation. That blocks handoff completely. Invest in the README, the comments, the context. It’s the difference between a model that ships and one that stalls. As we move into the process in practice, keep this standard in mind.
 analyticsinsight.netreviewpublically.comgithub.com+22 min
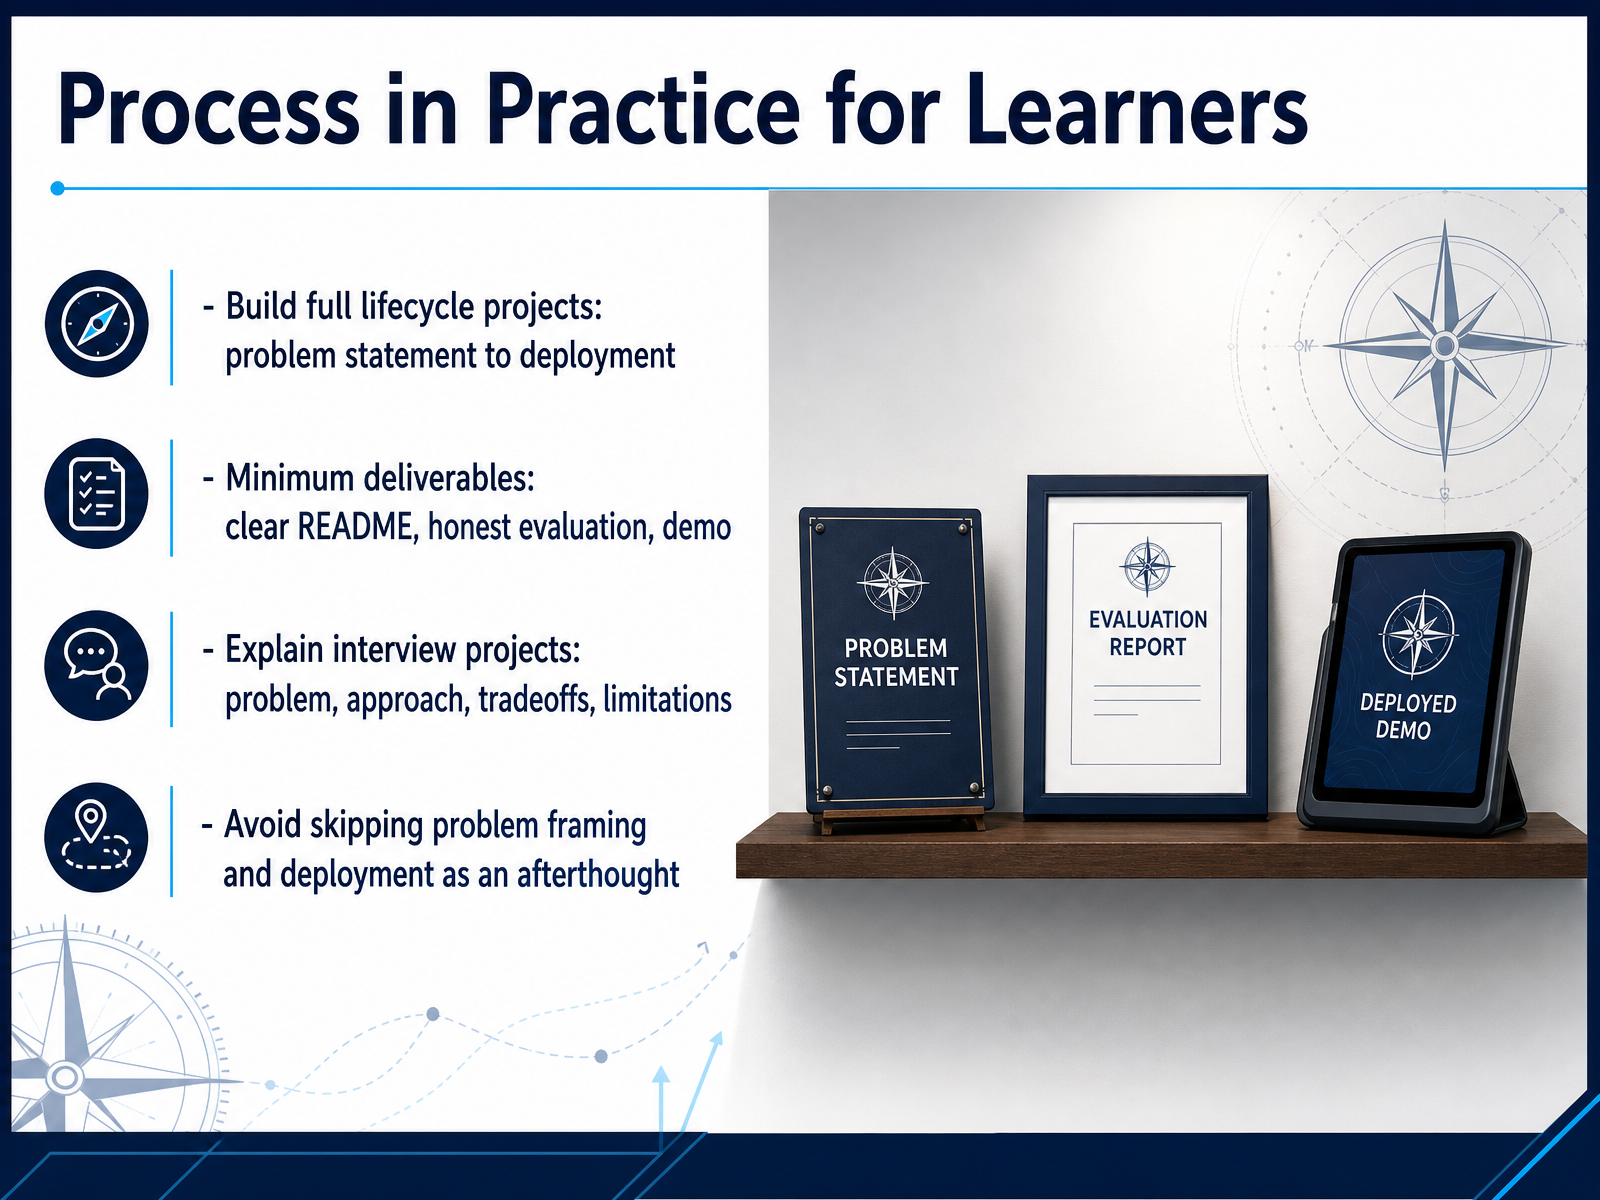
 - 11Process in Practice for LearnersLet’s turn this framework into something you can actually use. As a learner, the fastest way to internalize the data science process is to build full-lifecycle projects—from problem statement all the way to deployment. Not a notebook that stops at the model, but a complete story. For your minimum deliverables, keep it simple: a clear README that leads with the problem and result, an honest evaluation that shows what worked and what didn’t, and a demo someone can click on. That demo alone will set you apart. When you explain your project in interviews, cover the problem you were solving, your approach, the tradeoffs you made, and the limitations. That last one is key—being upfront about what breaks shows maturity. And above all, resist the urge to skip problem framing or treat deployment as an afterthought. Both are where the real learning happens. Next, we’ll look at how working data teams apply these same principles in practice.
 2 min
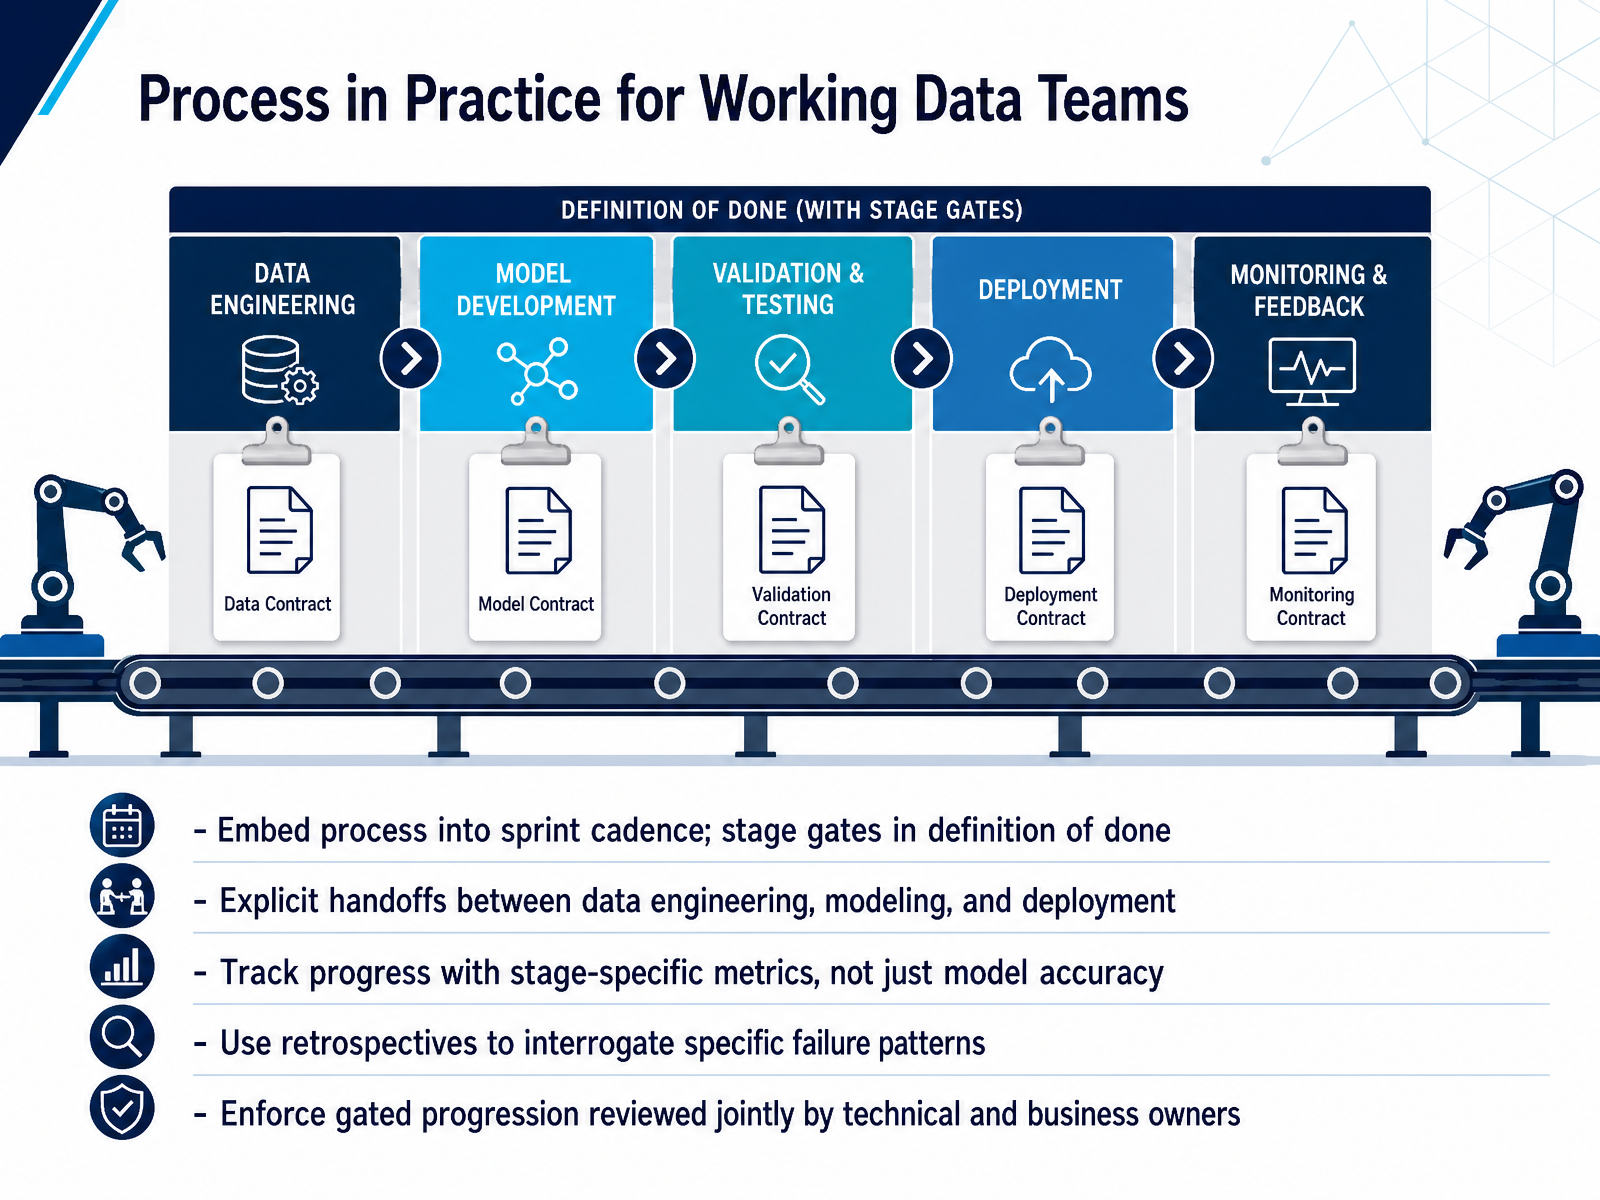
2 min - 12Process in Practice for Working Data TeamsSo how does this actually hold up in a working environment? For most mature teams, the answer is to embed the process directly into the sprint cadence. Stage gates become part of the definition of done, not separate paperwork. When a model moves from experimentation toward deployment, that handoff needs to be explicit — between data engineering, modeling, and deployment. A partially validated model can transfer early to engineering for pipeline testing, so work proceeds in parallel. But track progress with stage-specific metrics, not just accuracy. Data quality scores, coverage thresholds, validation status, these tell the real story of readiness. Retrospectives should interrogate specific failure patterns, like undocumented schema changes or surprising data quality issues, rather than the usual generic reflection. And above all, enforce gated progression, reviewed jointly by technical and business owners. That shared checkpoint is what keeps models advancing only when quality thresholds are truly met. Up next, we'll look at process in practice for technical managers.
 github.com2 min
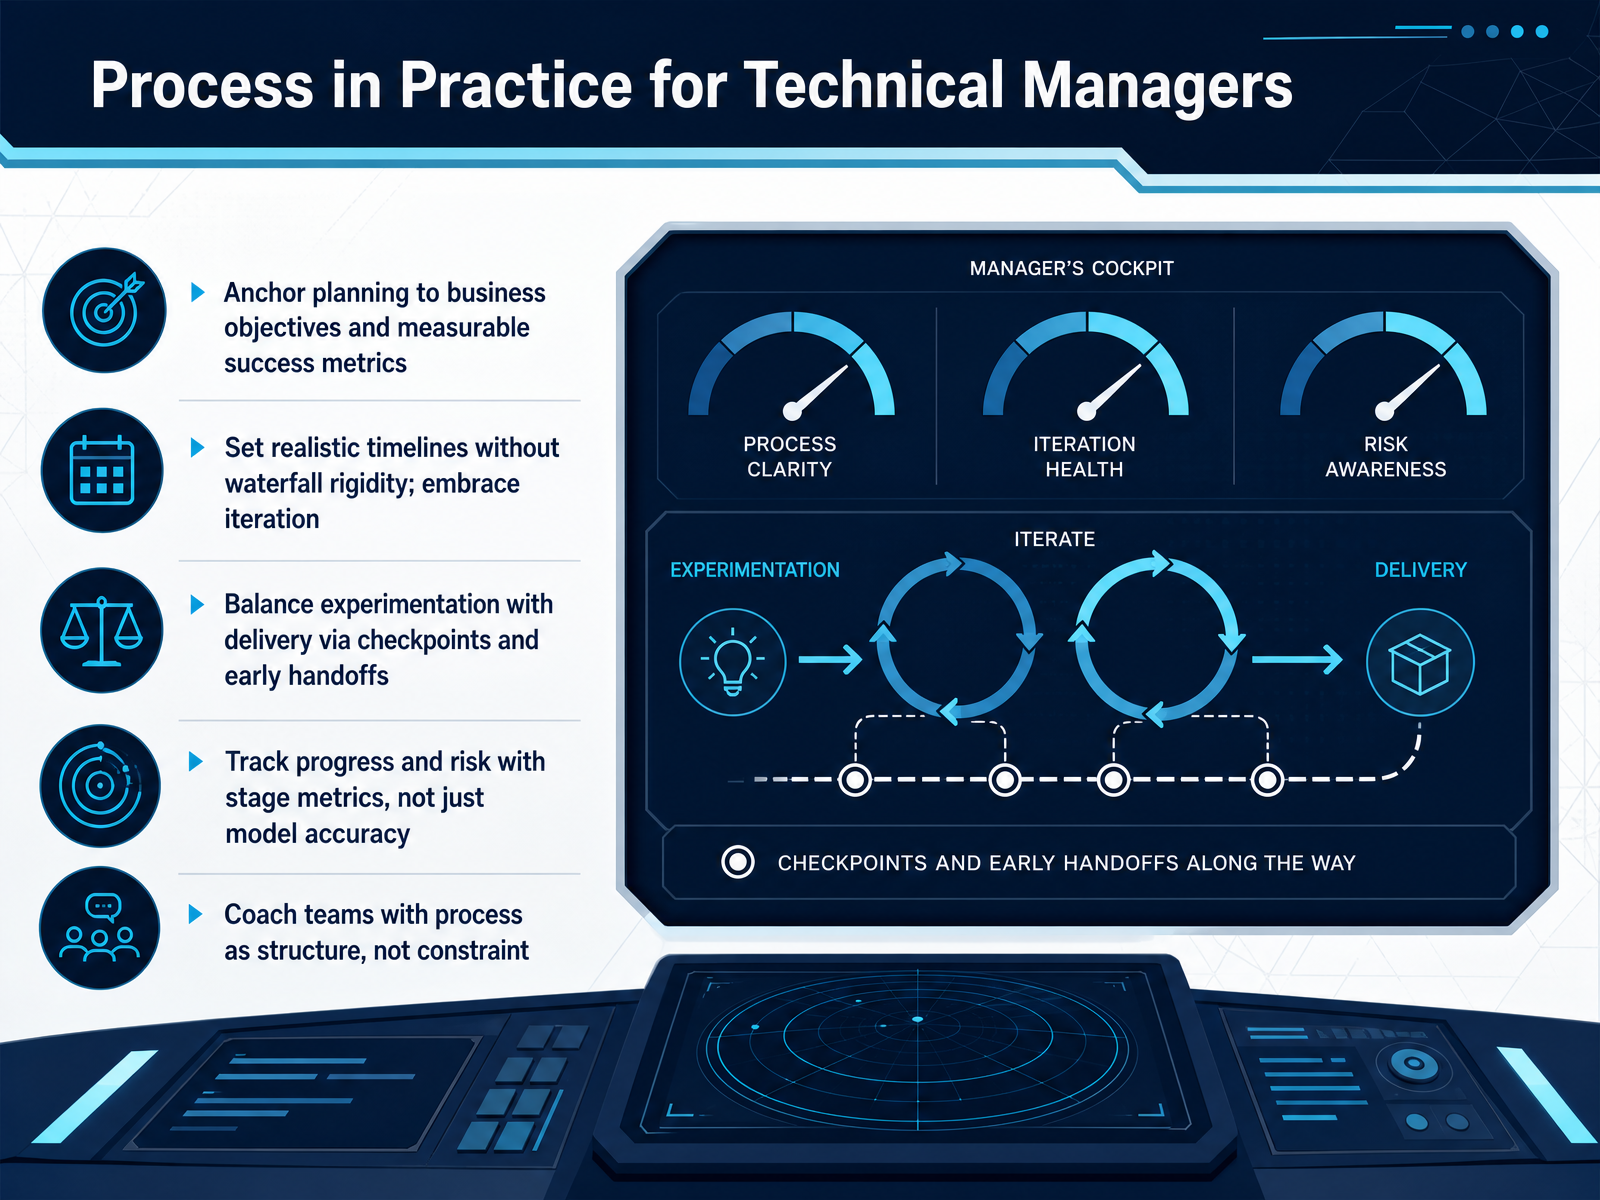
 - 13Process in Practice for Technical ManagersFor technical managers, the process only matters if it works in practice. So anchor your planning to business objectives and measurable success metrics from the very start. A model accuracy number alone won't sustain stakeholder confidence. Tie it to a tangible outcome, like reduced forecast error or optimized inventory levels. Set realistic timelines, but avoid waterfall rigidity. Embrace iteration, because data science is inherently experimental. You need checkpoints to balance exploration with delivery. Modularize the modeling work and hand off early. Once a model crosses baseline performance, let engineering test the pipeline in parallel while your scientists keep refining. Track progress with stage metrics, not just final accuracy. Monitor data quality scores, experiment velocity, and validation readiness. And above all, coach your team to see the process as structure, not constraint. It's a safety net that catches issues early, not a cage. Used well, it gives your team the freedom to explore without losing sight of delivery. Next, let's look at common pitfalls and process maturity.
 github.comrand.orgdoi.org+22 min
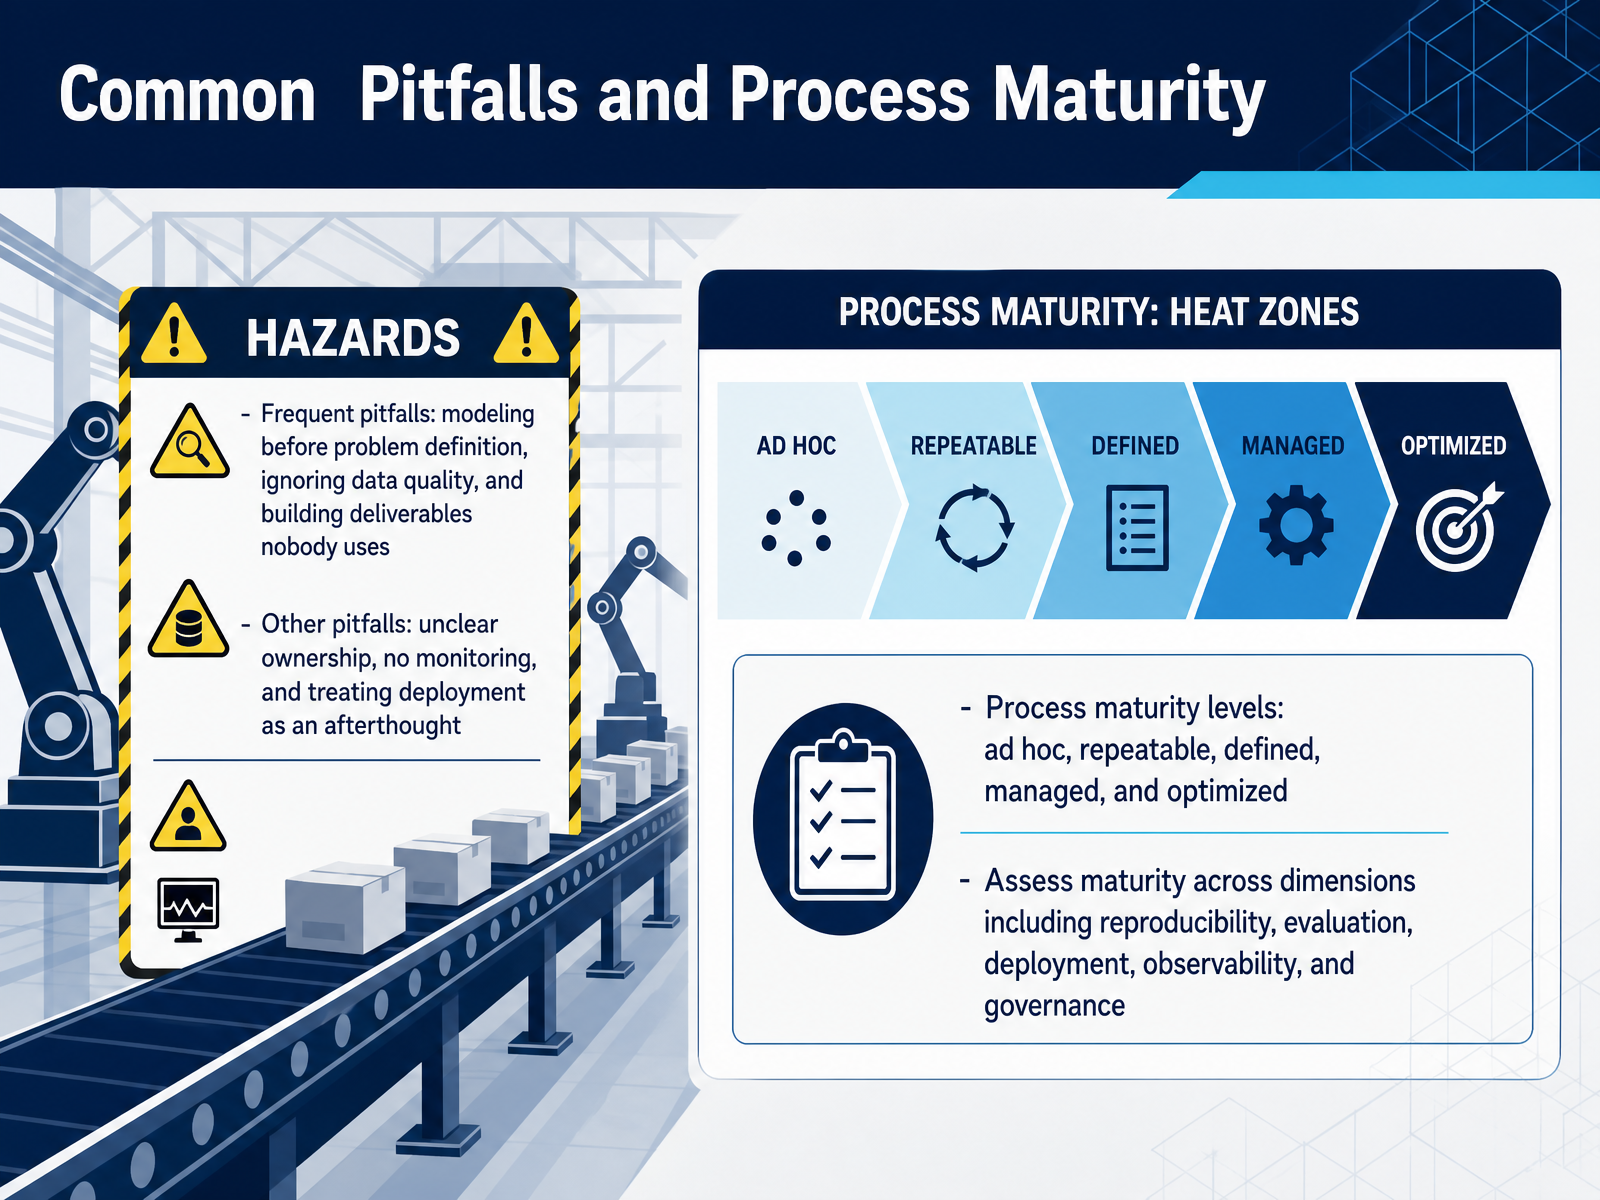
 - 14Common Pitfalls and Process MaturityLet’s be honest about where projects tend to go sideways. The most common pitfalls aren’t technical—they’re process-related. Modeling before defining the problem, ignoring data quality, or building deliverables that no one actually uses. Ownership gets murky, monitoring gets skipped, and deployment becomes an afterthought. Sound familiar? That’s where process maturity comes in. Think of it as a five-level progression: ad hoc, repeatable, defined, managed, and optimized. The goal isn’t perfection—it’s moving from heroic individual effort to a repeatable, disciplined workflow. To assess where you stand, look across five dimensions. Reproducibility—can you rebuild any model on demand? Evaluation—do you have a regression suite that catches quality drops? Deployment—are promotions automated and gated on evaluation? Observability—do you monitor drift and performance? And governance—is there a named owner and an audit trail? Most teams are strong in one or two areas and weak in others. That mismatch is where incidents happen. Don’t chase a single composite score. Identify your weakest dimension and make that your priority. That’s the first step toward a practical maturity roadmap, which we’ll get into next.
 rand.orgdoi.orgsloanreview.mit.edu+22 min
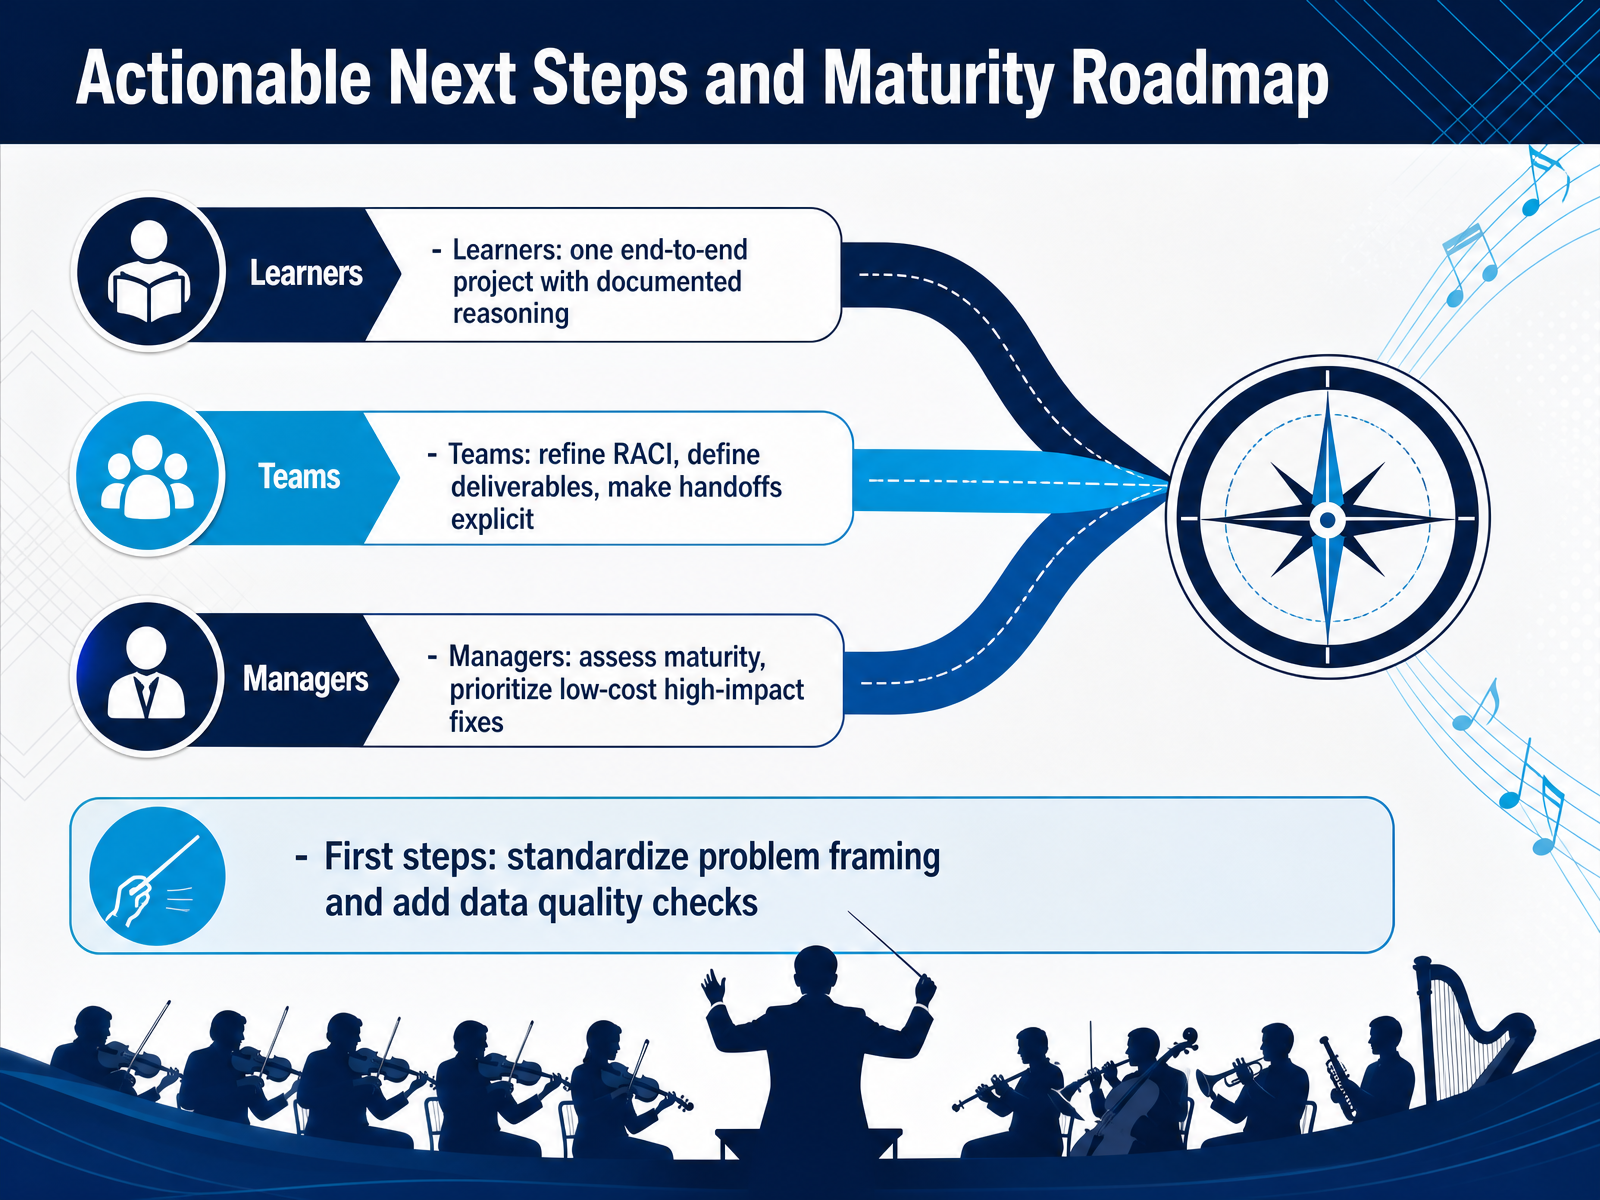
 - 15Actionable Next Steps and Maturity RoadmapAs we close this course, let's turn what you've learned into immediate action. For learners, the strongest step is clear: run one end-to-end project that documents your reasoning at every decision point. Not just the wins—what you tried, what failed, and why you chose the path you did. That transparency is what separates a portfolio from a collection of notebooks. For teams, the focus is a bit broader. Start by refining your RACI matrix—who's responsible and accountable for each deliverable. Then make handoffs explicit. When the analyst's work becomes the modeler's input, there should be a defined artifact and a brief review. For managers, the task is strategic. Assess your team's maturity honestly, and resist the urge to fix everything at once. Prioritize the low-cost, high-impact fixes first. In practice, that usually means standardizing how problems are framed, and adding data quality checks early in the pipeline—the stage where issues are cheapest to address. You don't need to reach level five maturity to deliver value. You need disciplined execution, clear ownership, and consistent evidence of value. Start with one project, one process fix, one governance tweak. Build momentum. Consistently following a solid process outranks intermittent perfection. Thank you for your attention, and good luck with your next steps.
 github.com2 min
Take the deck with you
Download this course as a file — free, no sign-up needed.
- PDF handoutEvery slide page, ready to print or share.16 pages · 4.5 MBDownload
- Narrated PowerPointThe deck that presents itself — every slide carries the digital human's narration video.16 pages · 16.0 MBDownload
- PowerPoint slidesThe full deck as a .pptx — open it in PowerPoint, Keynote, or Google Slides.16 pages · 4.3 MBDownload
Free to use in your own training — please keep the PersonWise credit page at the end.
Have your own deck? Turn it into a course
Sources consulted
Web sources consulted while building this course.
- The Modern Data Science Life Cycle: 9 Steps From Insight to Impact — analyticsinsight.net
- What Is Data Science Lifecycle? Steps, Diagram & Real Example (2026) — reviewpublically.com
- Docs/lifecycle-detail.md — github.com
- What is the Data Science Lifecycle? (2 of 28) — learn.microsoft.com
- Full Stack Data Scientist Responsibilities Across the Data ... — gsdcouncil.org
- The Root Causes of Failure for Artificial Intelligence Projects and ... — rand.org
- From data to impact: a multivocal review of success factors and criteria for data science projects — doi.org
- Why So Many Data Science Projects Fail to Deliver — sloanreview.mit.edu
- Why 80% of AI Projects Fail: The Complete 2026 Analysis | THE D*AI*LY BRIEF — beri.net
- Why Most AI Projects Fail, and How to Be in the 20% | 2026 Guide — frntir.ai
- [PDF] Comparative Analysis of Process Models for Data Science Projects — publica.fraunhofer.de
- Data Science Methodology for Cybersecurity Projects — doi.org
- CRISP-DM vs Microsoft TDSP - Data Science Project Methodologies Compared | AI Solutions Wiki — ai-solutions.wiki
- Computer Science & Information Technology — doi.org
- A Selective Comparative Review of CRISP-DM and TDSP Development Methodologies for Big Data Analytics Systems | springerprofessional.de — springerprofessional.de
- From RACI to Reality: Build a RACI Matrix Template for Data Science Delivery – Language.Foundation — language.foundation
- Data Science Project RACI Chart Template | Template by ClickUp™ — clickup.com
- AI Governance RACI Matrix for Enterprises: Decision Rights Across 30 Activities and 12 Roles | COMPEL Framework — compelframework.org
- RACI Matrix For Data Analytics — meegle.com
- AI Governance Roles & Responsibilities: The Complete RACI… — openempower.com