Business Analytics Types Overview
Begin
14 pages · ~28 min
Business Analytics Types Overview
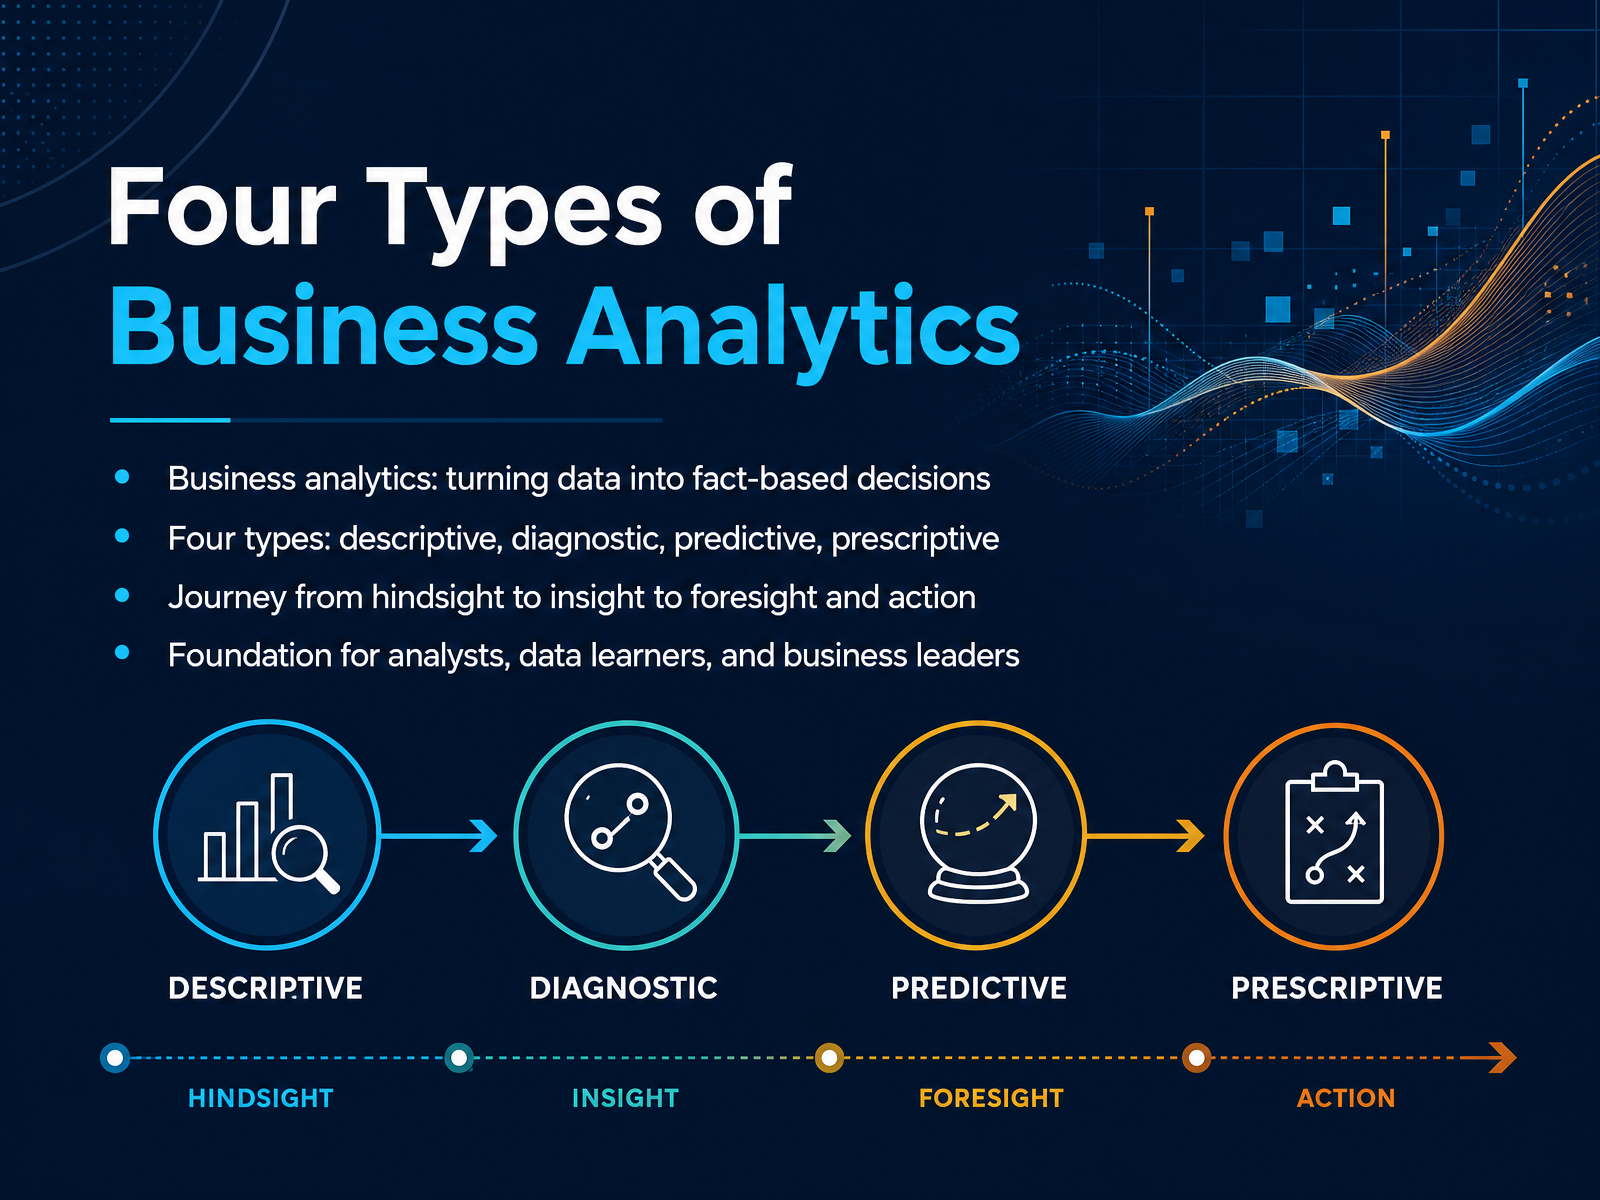
This training introduces the four types of business analytics—descriptive, diagnostic, predictive, and prescriptive—for professionals seeking to apply data-driven decision-making.
What you’ll learn
- 01Four Types of Business AnalyticsWelcome, everyone. Let's talk about the foundation of fact-based decision-making: the four types of business analytics. These are descriptive, diagnostic, predictive, and prescriptive. They form a journey moving from hindsight to insight, and then on to foresight and action. Descriptive analytics tells you what happened, diagnostic digs into why, predictive projects what might happen next, and prescriptive recommends what to do about it. Together, they help analysts, data learners, and business leaders turn raw numbers into confident decisions. Let's now see why analytics has shifted from simple reporting to driving action.thoughtspot.comdomo.comonline.hbs.edu+21 min
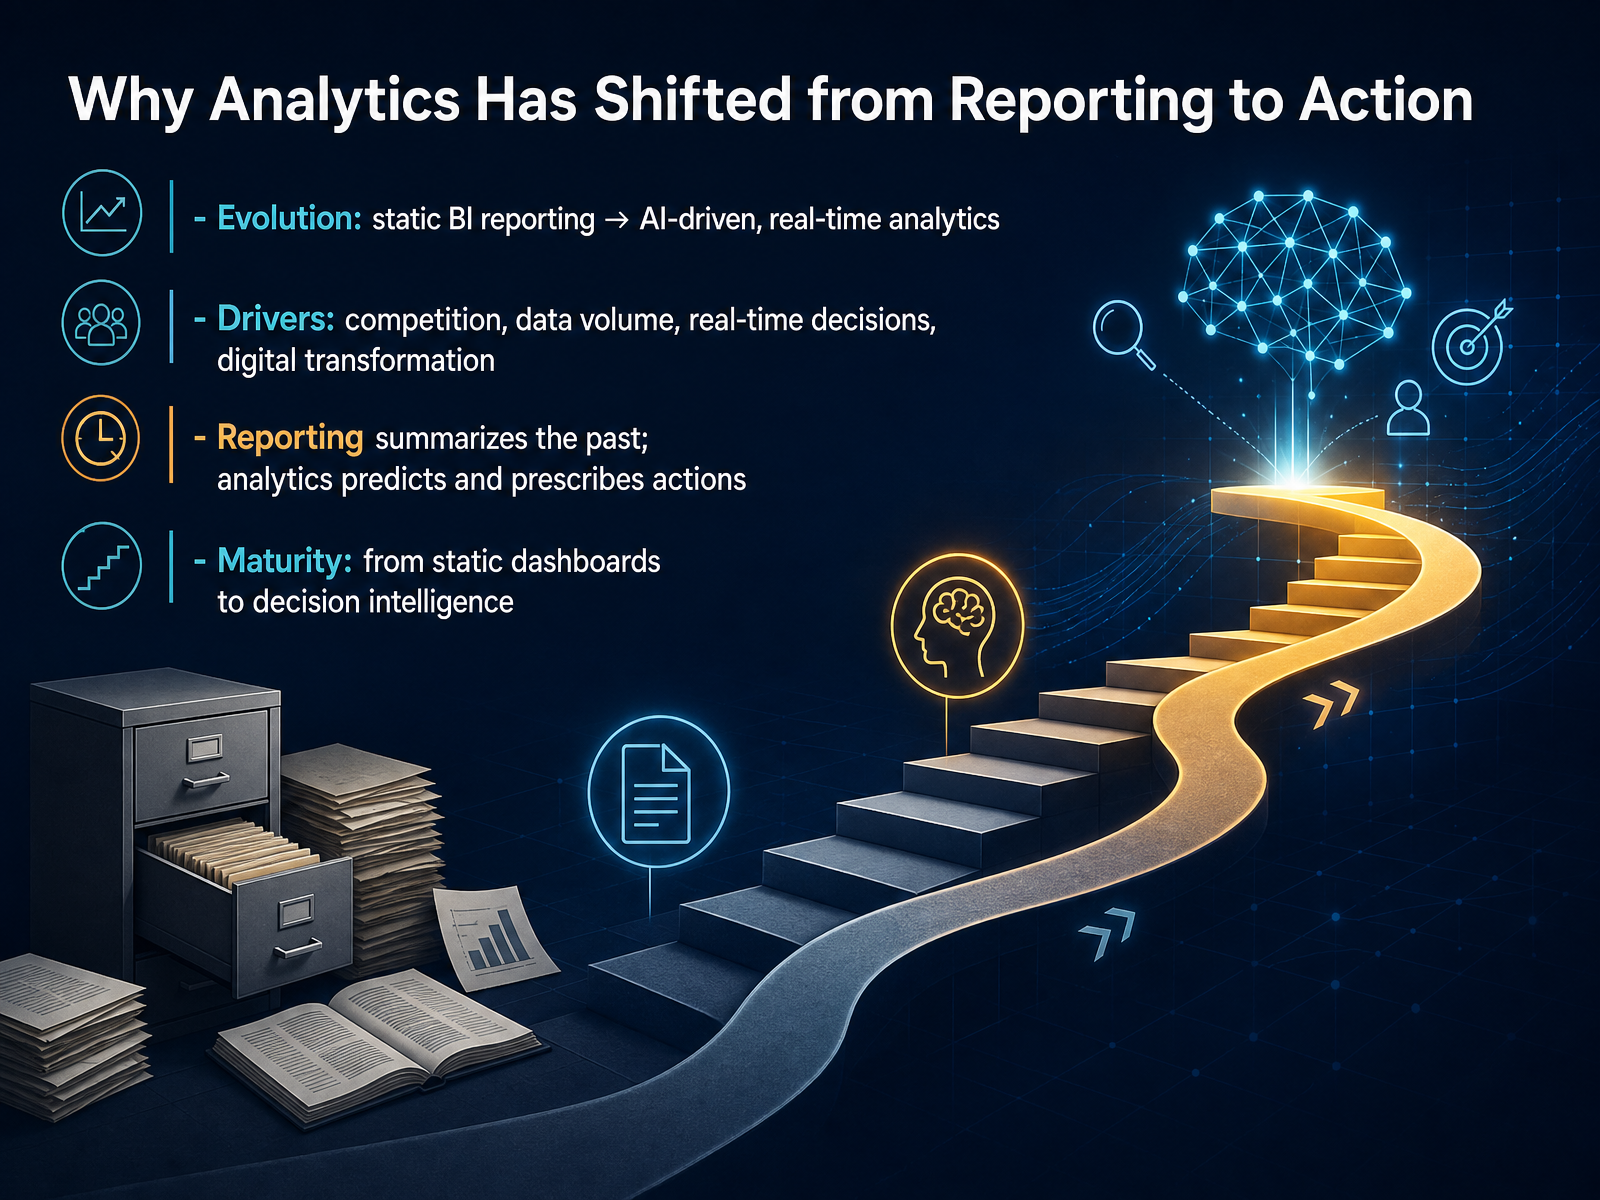
- 02Why Analytics Has Shifted from Reporting to ActionLet’s look at why analytics has shifted so dramatically from simple reporting to driving real action across the business. For years, business intelligence meant static dashboards and weekly reports that told us what already happened. That approach is no longer enough. Competition is fiercer, data is exploding in volume, and decisions now need to be made in real time. Digital transformation has pushed analytics out of the back office and into the operational frontline. Reporting summarizes the past, but analytics predicts what comes next and prescribes the best actions to take. So we’re moving along a maturity curve, from static reporting, up through diagnostic and predictive analytics, toward what we now call decision intelligence, where insights are embedded directly into workflows and decisions happen automatically at scale. As we move into the core framework, remember this shift: it’s no longer about building a better report, it’s about building a better decision.
 doi.orglink.springer.comsapinsider.org+22 min
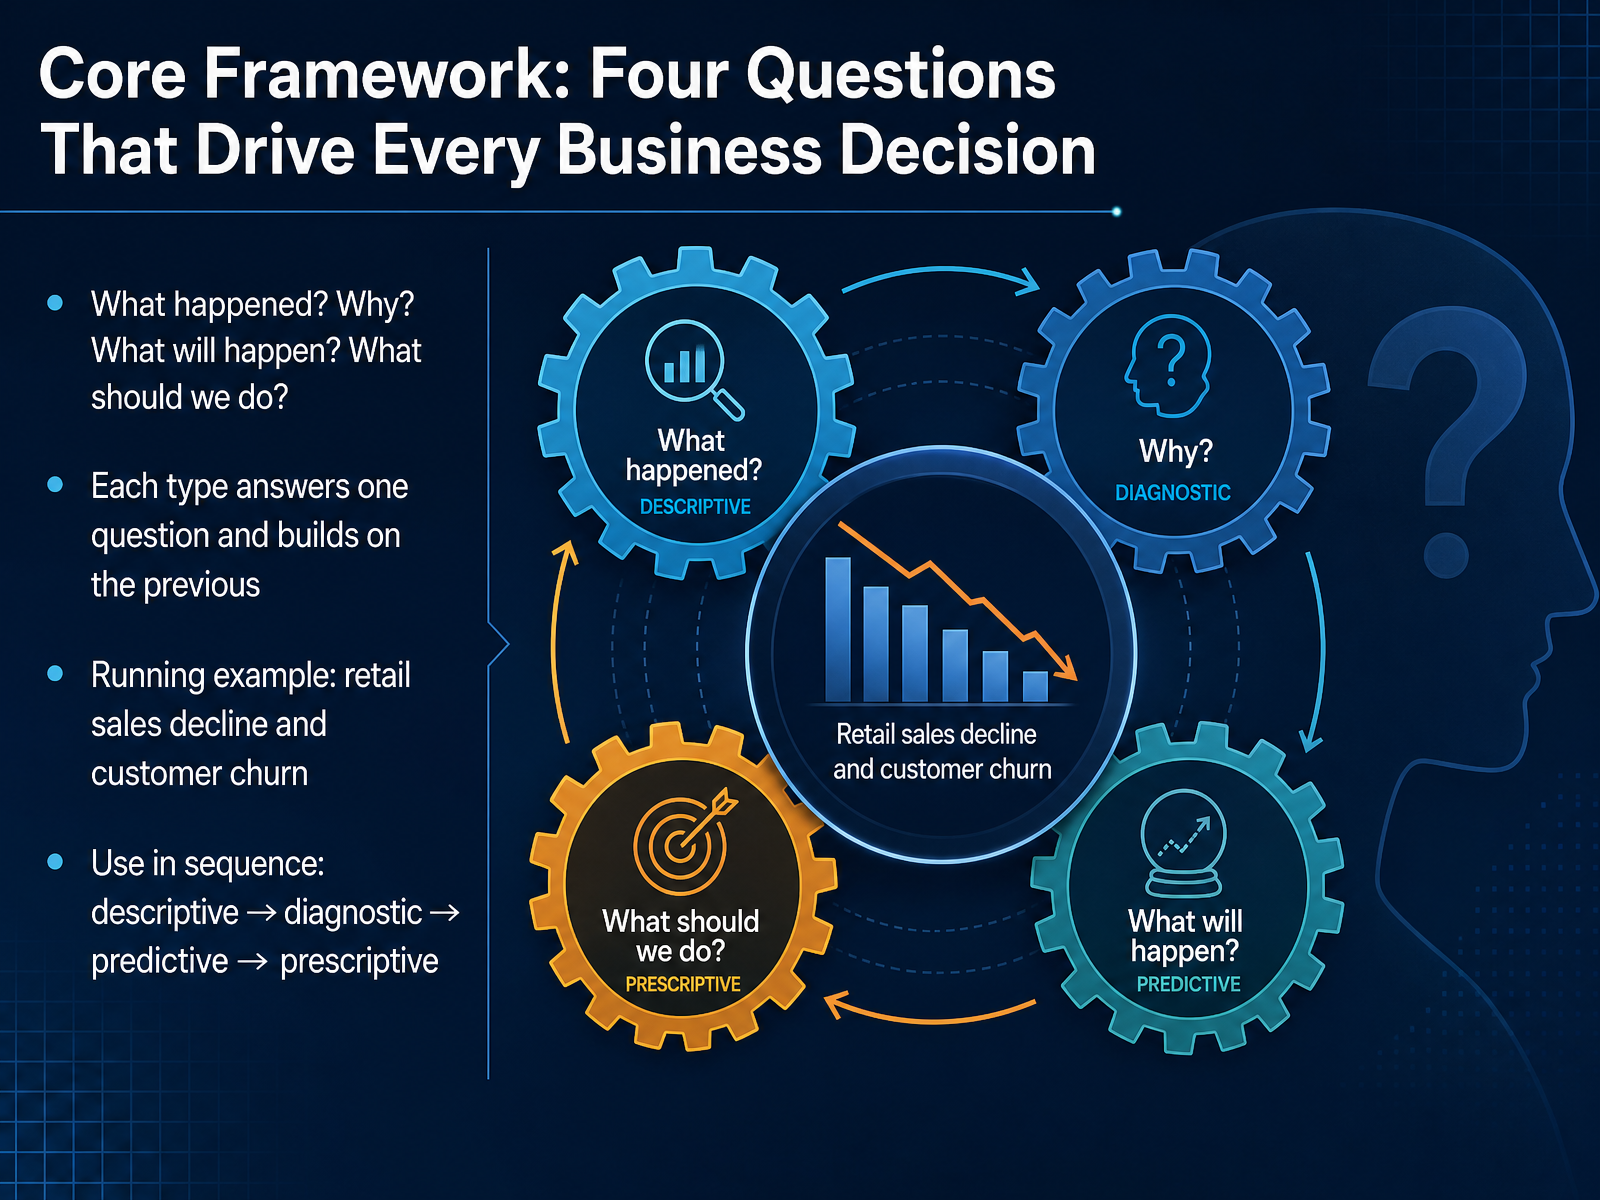
 - 03Core Framework: Four Questions That Drive Every Business DecisionSo, let's get to the heart of how business analytics works. All four types of analytics are really about one thing: answering important business questions. Specifically, they break down into four core questions: What happened? Why did it happen? What will happen? And, what should we do about it? Each type of analytics maps to one of these questions, building on the previous one to take you from simple insight to confident action. Think of a retail scenario. Sales have declined, and customer churn is rising. You start with descriptive analytics to see what happened, then move to diagnostic to understand why. Predictive analytics tells you what might happen next, and prescriptive analytics suggests the action to take. The key is to use them in sequence, moving from descriptive, to diagnostic, to predictive, and finally to prescriptive. This method lets you move from knowing the problem, to understanding it, and finally, to solving it. Let's look more closely at that first step: Descriptive Analytics.
 thoughtspot.comdomo.comonline.hbs.edu+21 min
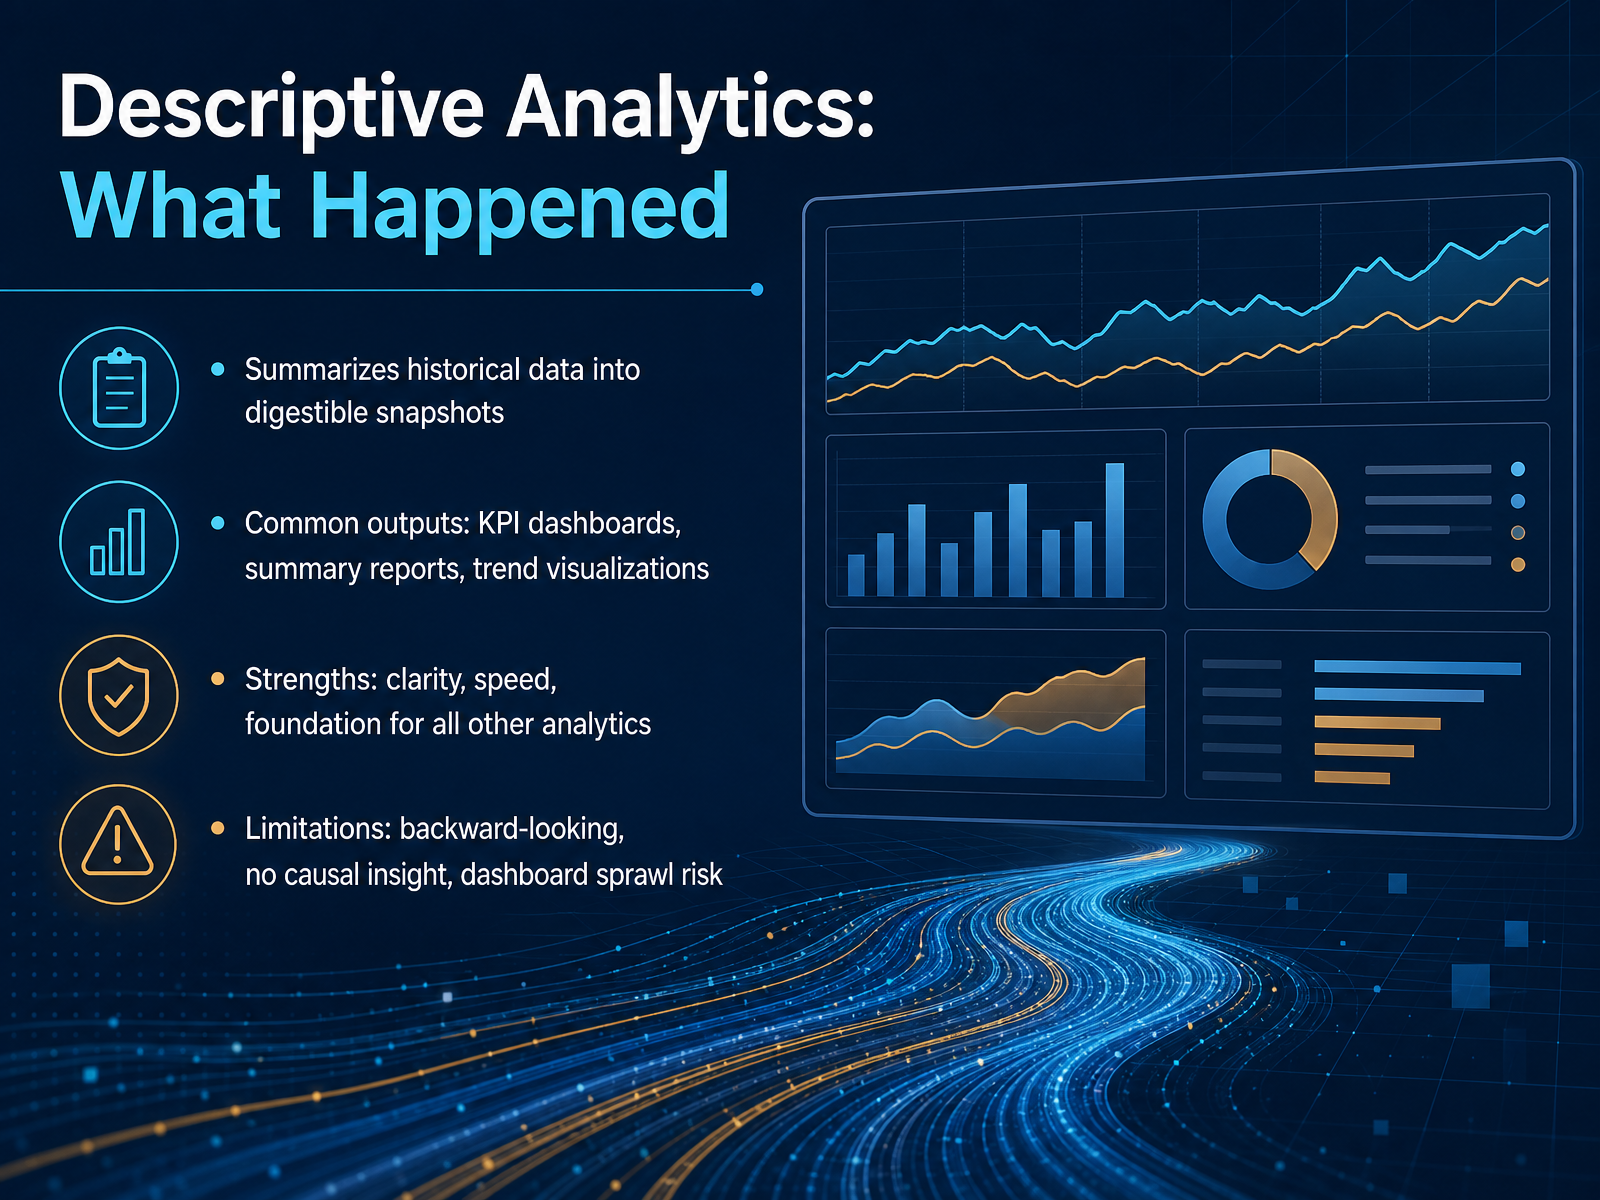
 - 04Descriptive Analytics: What HappenedLet’s begin with the foundation of everything we do: descriptive analytics. This is the practice of summarizing historical data into clear, digestible snapshots. It answers the most straightforward question in business—what happened? Think of your KPI dashboards, your monthly summary reports, and your trend visualizations. Those are all classic outputs of descriptive analytics. Its real strength is clarity and speed. It gives you an accurate picture of past performance in seconds, and it forms the base that every other type of analytics builds upon. But it’s important to understand its limits. Descriptive analytics is strictly backward-looking. It tells you what happened, but it won’t tell you why it happened, and it certainly won’t tell you what to do next. There’s also a real risk of dashboard sprawl, where you have so many metrics that you lose sight of the signal. Now that we’ve set the baseline of what happened, let’s move on to the next logical question: why did it happen? That’s where diagnostic analytics comes in.
 thoughtspot.comdomo.comonline.hbs.edu+22 min
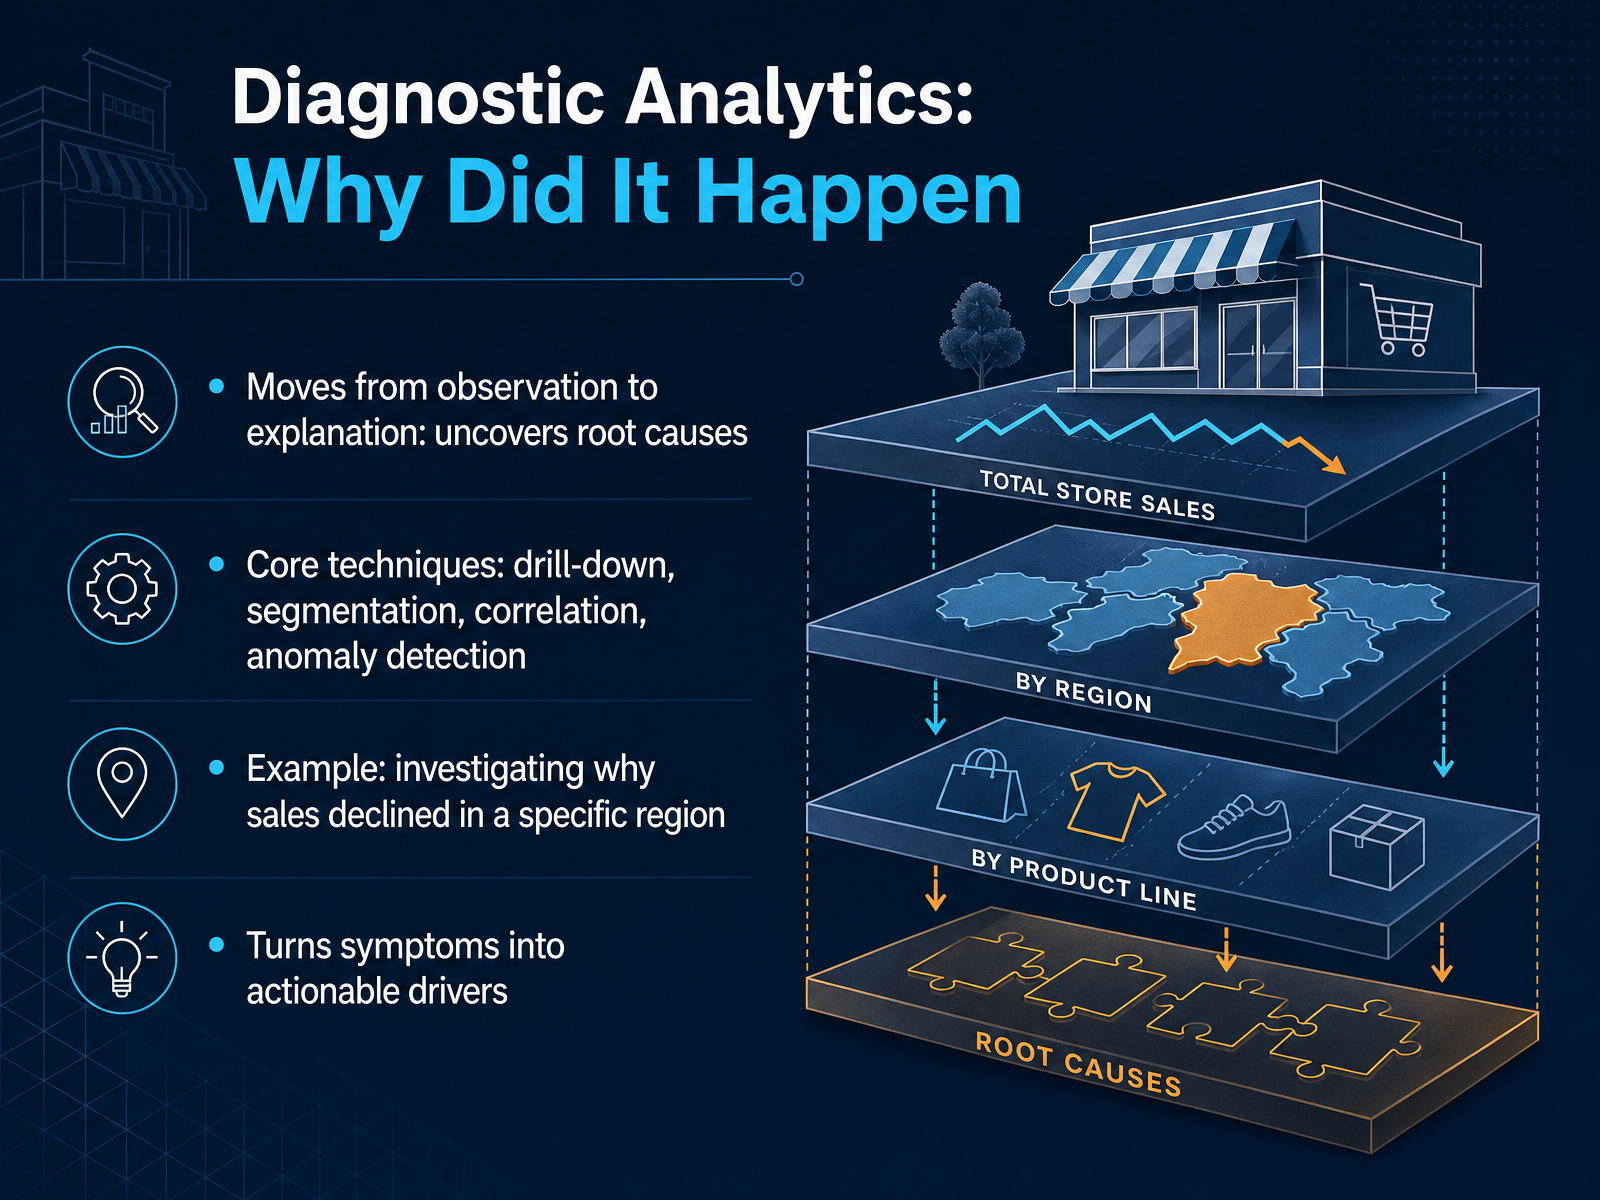
 - 05Diagnostic Analytics: Why Did It HappenNow that we know what happened, it's time for the much more interesting question: why did it happen? This is where diagnostic analytics takes over. It moves us from observation to explanation by uncovering the root causes behind a trend or event. Instead of just staring at a dashboard that shows a sales decline, you start drilling down into the data. You segment it by region, by product line, or by customer type. You look for correlations and anomalies that point to the real story. So, for example, imagine sales dropped sharply in the Southeast region. Diagnostic analytics helps you discover that a major competitor launched an aggressive promo right in that market, or maybe a key supplier had a shipping disruption. It turns your symptom into an actionable driver. You now know where the problem started and what caused it. That's the real power of this layer. And once you understand the causes, the next natural step is to ask: what is likely to happen next? Which brings us to predictive analytics.
 thoughtspot.comdomo.comonline.hbs.edu+22 min
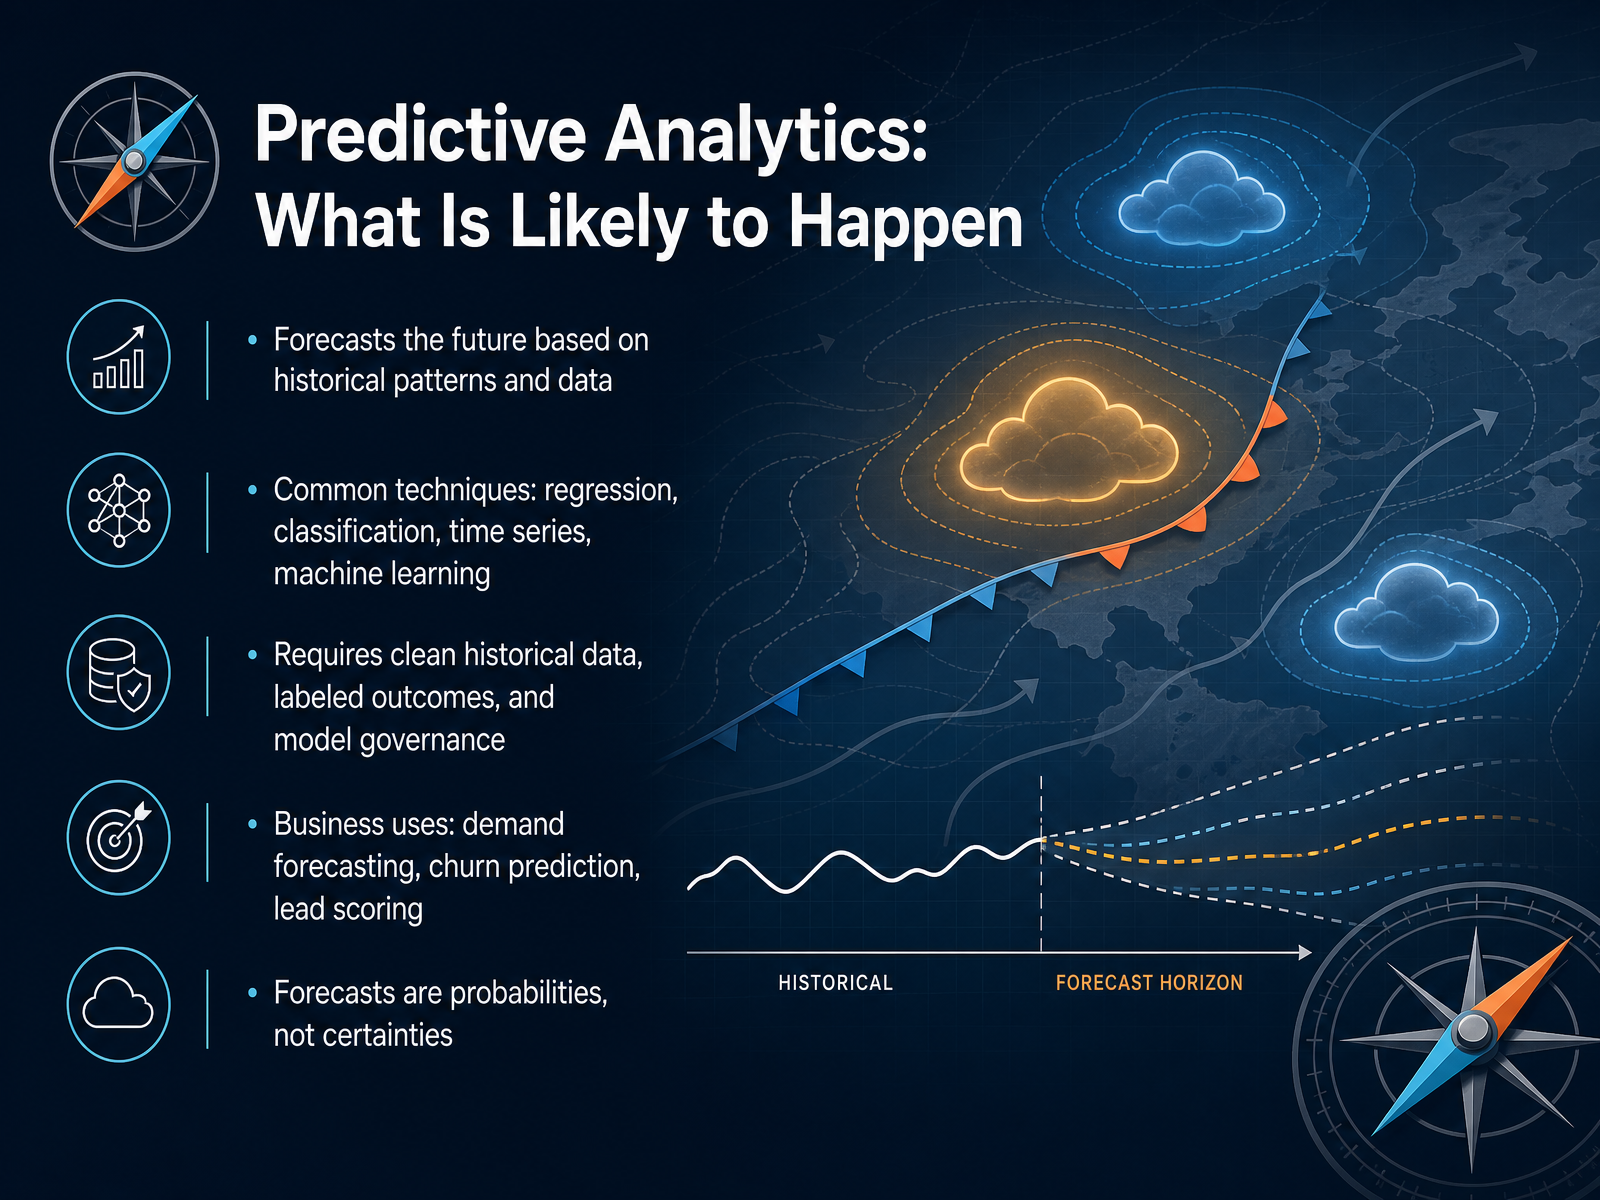
 - 06Predictive Analytics: What Is Likely to HappenNow let's shift forward and talk about predictive analytics. This is where we go from understanding what happened to asking what is likely to happen next. Predictive analytics uses historical data to forecast future outcomes, not with certainty, but with probability. Common techniques include regression, time series analysis, and machine learning models that scan years of data to find patterns and project them forward. For example, a retailer can predict demand for a seasonal product and avoid stockouts, or a subscription service can score each customer's churn risk before they even think about leaving. However, these forecasts only work when you have clean, consistent historical data and clear defined outcomes. And importantly, these are probabilities, not certainties. A forecast is a sophisticated estimate, so smart teams use it as a planning guide, not as a crystal ball. With predictive analytics, you're no longer reacting to the past; you're anticipating the future. So what should you do with that insight? That brings us to our final type, prescriptive analytics, which tells you exactly what actions to take.
 credencys.comnews.sap.comnorvik.ai+22 min
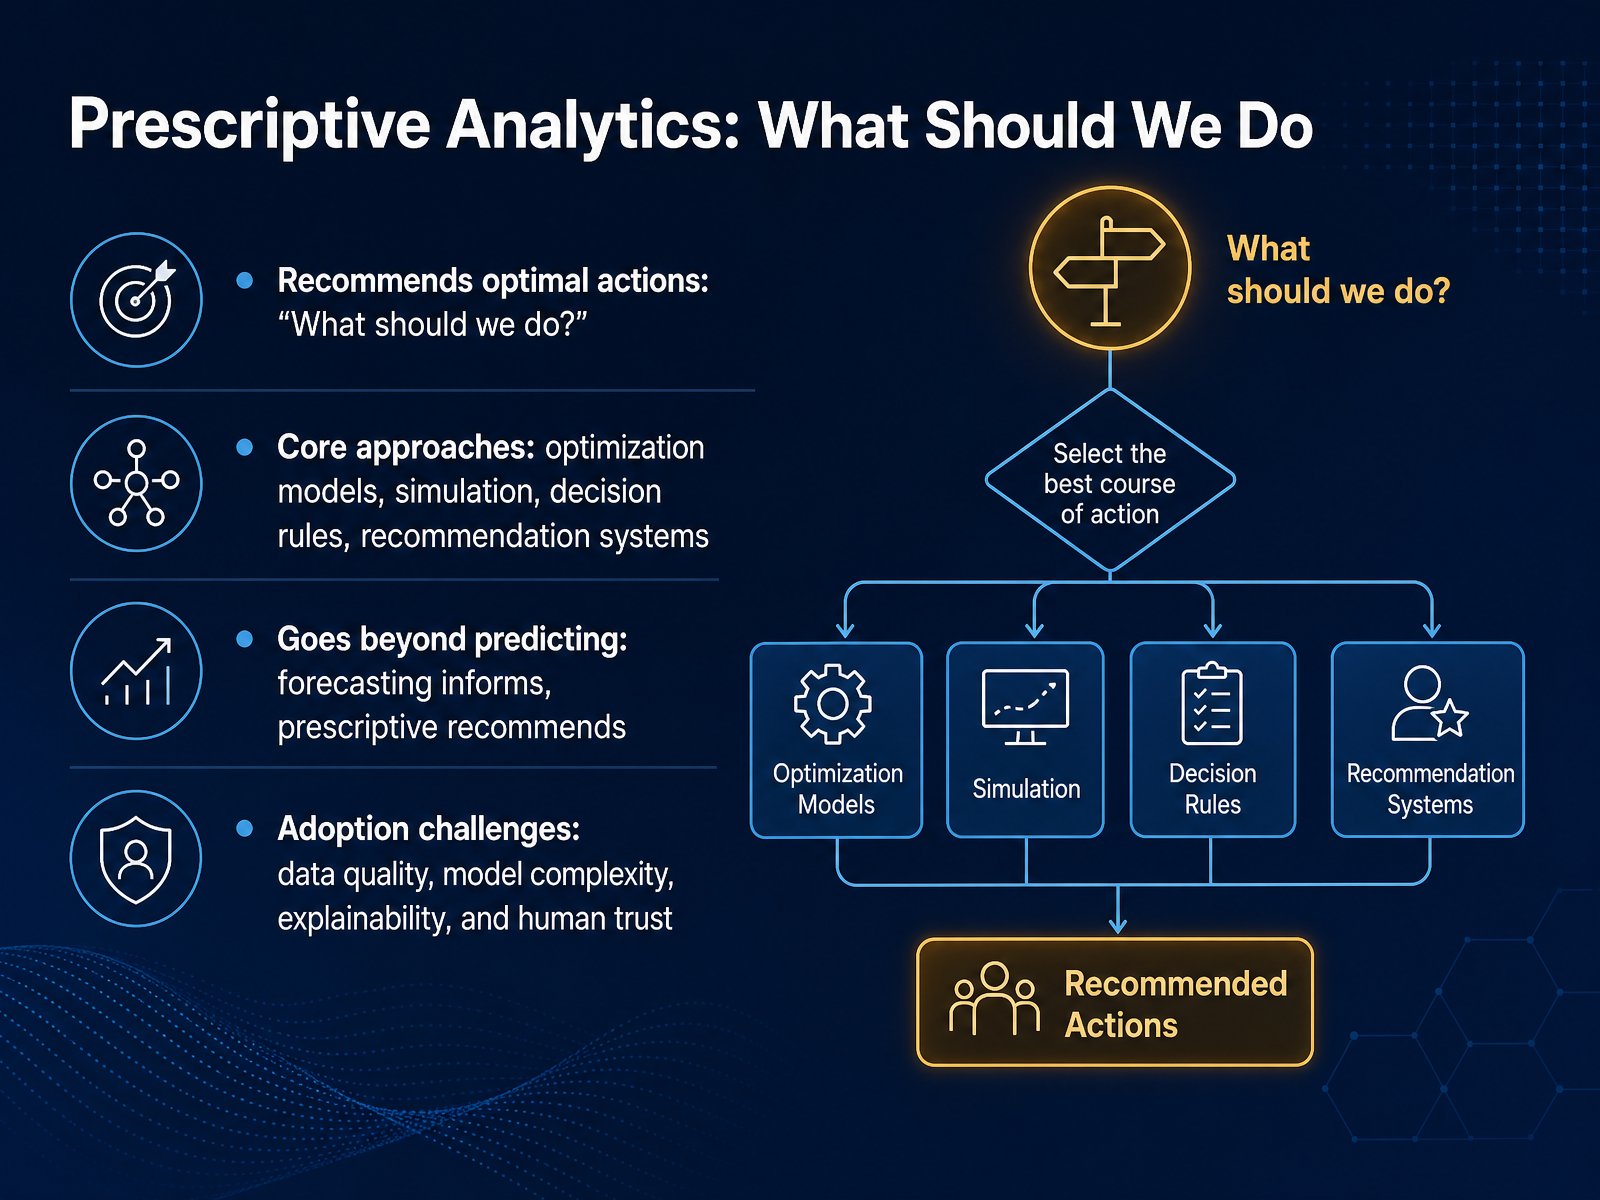
 - 07Prescriptive Analytics: What Should We DoNow we reach the most advanced level: prescriptive analytics. While predictive analytics tells us what is likely to happen, prescriptive analytics goes further and tells us what we should do about it. It recommends optimal actions. The core techniques here are optimization models, simulation, and decision rules. Recommendation systems in e-commerce are a common example, but the real power shows in complex operations. Seagate Technology, for instance, uses prescriptive analytics to plan production targets hours in advance, improving on-time delivery. Daikin Industries uses simulation to test supply chain scenarios before they happen. The key distinction is this: forecasting informs, while prescriptive recommends. A forecast says demand will spike; a prescriptive system says to increase production at specific plants, shift inventory, and adjust pricing. That said, adoption is not easy. The main challenges are data quality, model complexity, and explainability. And of course, human trust. People need to understand why a model recommends a specific action before they will act on it. Up next, we will compare the four types on value versus complexity. Let’s take a look.
 informs-sim.orgoptilogic.comsimio.com+21 min
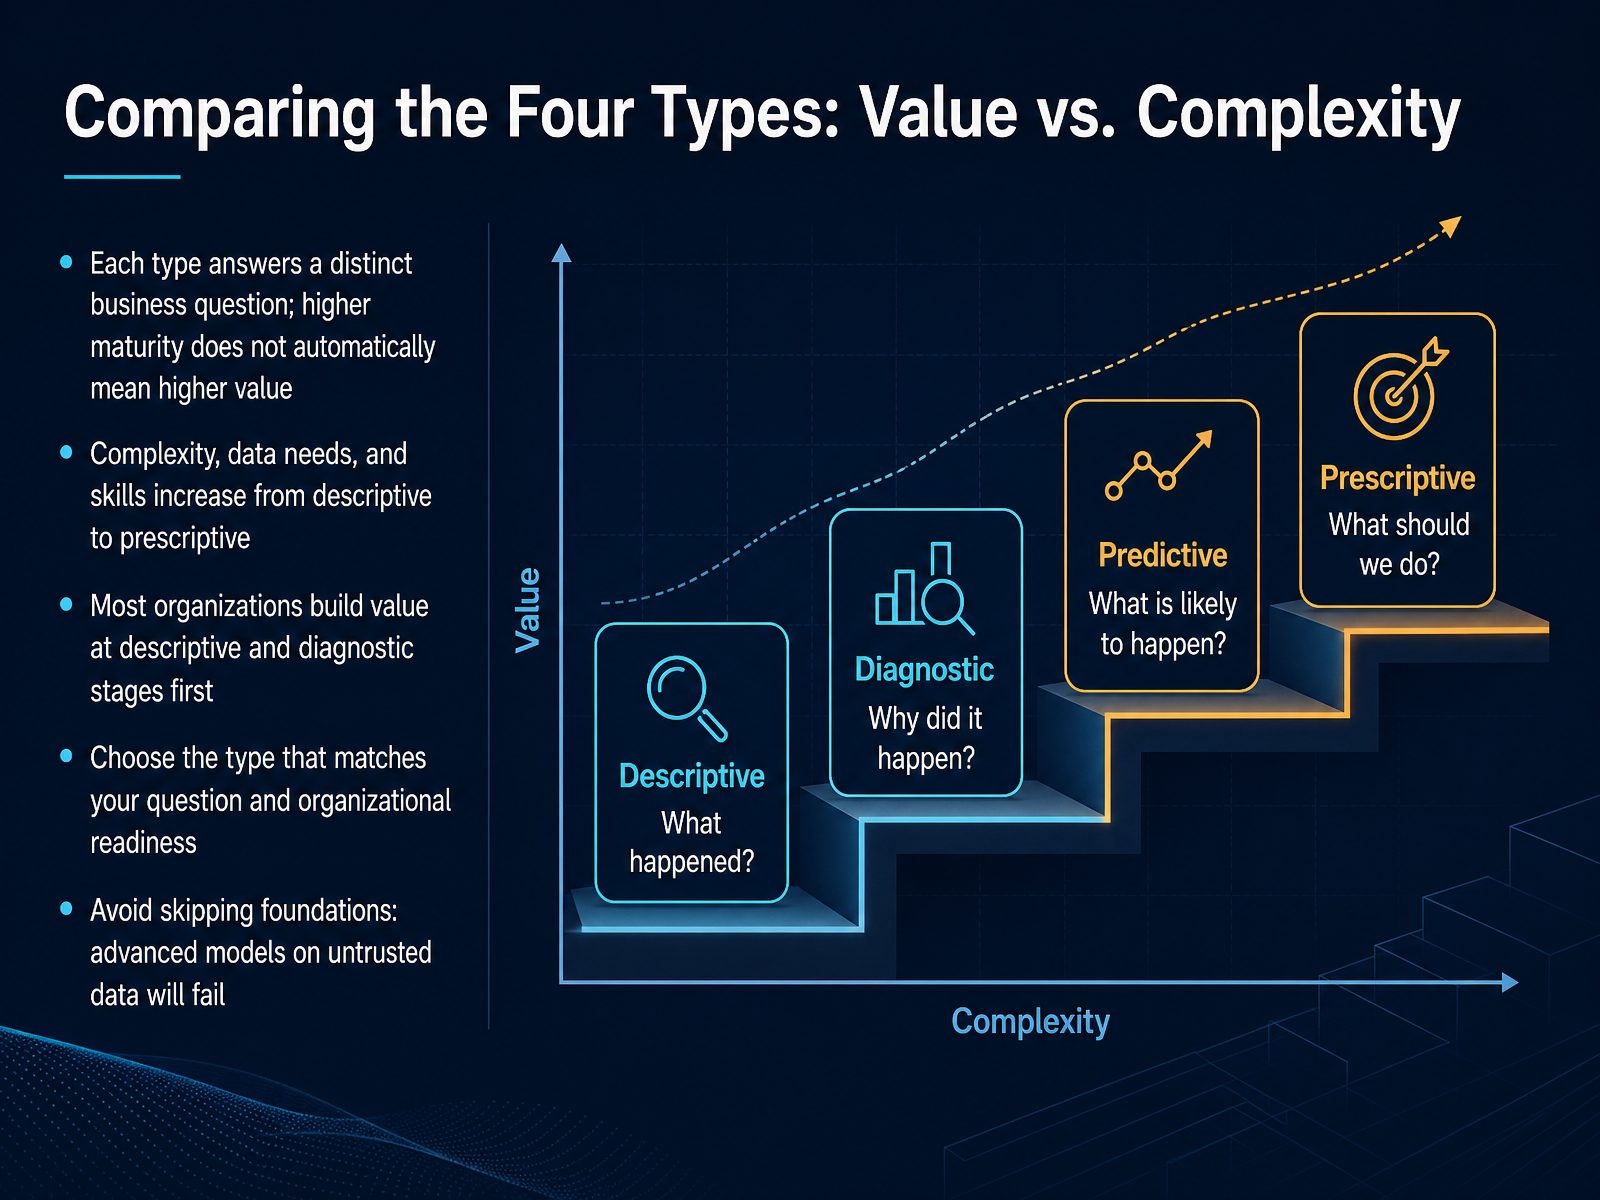
 - 08Comparing the Four Types: Value vs. ComplexityNow let's put all four types side by side and think about value versus complexity. Each type answers a different business question, and here's the key point: moving up the maturity curve doesn't automatically mean more value. It means more complexity, more data requirements, and more specialized skills. Descriptive and diagnostic analytics are where most organizations build their foundation. They answer what happened and why, and they do it with tools and data most teams already have. Predictive and prescriptive analytics are powerful, but they only deliver value when the foundation beneath them is solid. So choose the type that matches your question and your organization's readiness. And don't skip the fundamentals. Advanced models built on untrusted data will fail every time. Garbage in, garbage out. Next, we'll walk through how this maturity model plays out in real-world scenarios.
 domo.comonline.hbs.eduthoughtspot.com+21 min
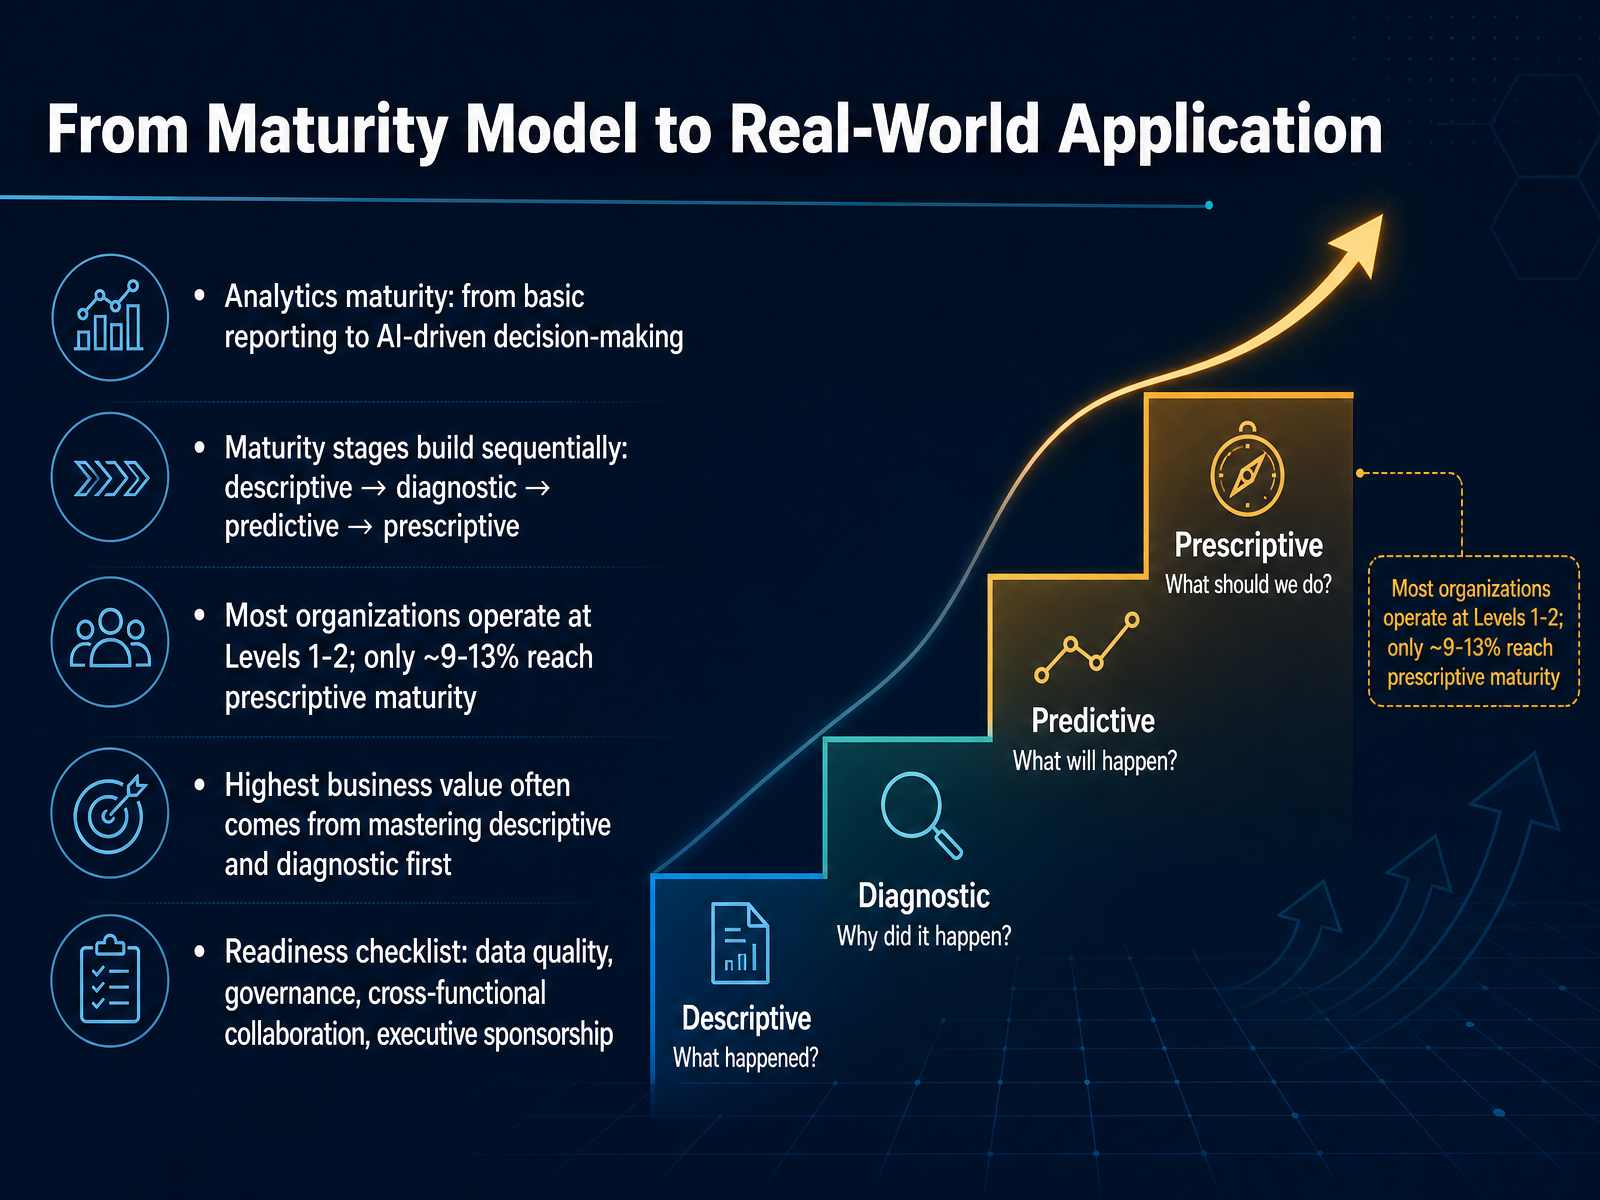
 - 09From Maturity Model to Real-World ApplicationNow that we've covered the four types, let's talk about how they fit into an organization's analytics maturity. Think of it as a progression, starting with basic reporting and evolving toward AI-driven decision-making. The stages build sequentially: descriptive, diagnostic, predictive, and prescriptive. Each one relies on the foundation of the one before it. Here's the reality though: most organizations operate at the first two levels. Only about nine to thirteen percent have truly reached prescriptive maturity. That might sound low, but here's the key takeaway—the highest business value often comes from mastering descriptive and diagnostic first. You need solid, trusted reporting and a clear understanding of why things happened before you can forecast the future or automate decisions. So, before aiming for advanced AI, run through a readiness checklist. Ask yourself: is our data quality good enough? Do we have clear data governance? Are we collaborating across functions? And crucially, do we have executive sponsorship? These fundamentals are what actually move you up the maturity curve. That's the big picture. Next, let's look at a practical adoption roadmap for your organization.
 domo.comonline.hbs.edu2 min
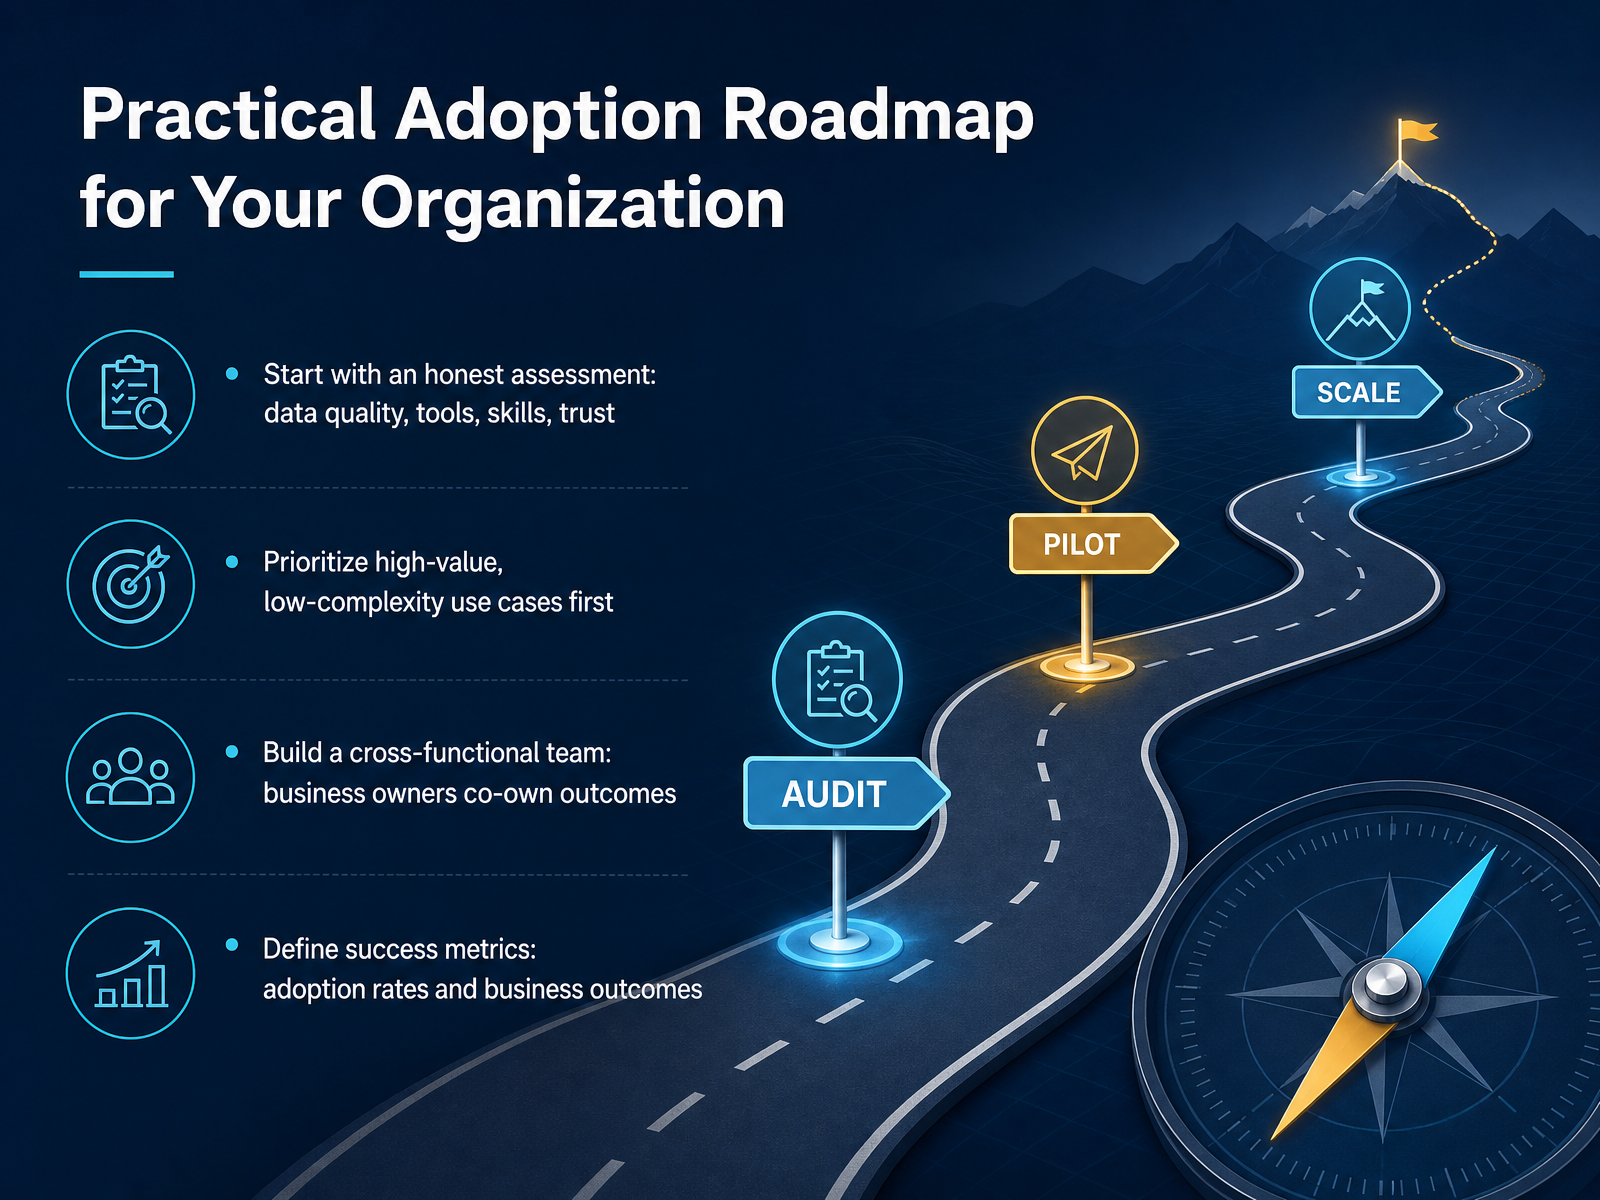
 - 10Practical Adoption Roadmap for Your OrganizationLet's turn that theory into action with a practical adoption roadmap. Start with an honest assessment of where you stand today. Look at your data quality, your tools, your team's skills, and crucially, the level of trust people have in the numbers. Most initiatives fail not because the technology is wrong, but because the organization isn't ready. Next, resist the urge to boil the ocean. Prioritize high-value use cases that are also low in complexity. Your first win should be something visible and useful within sixty to ninety days. This builds momentum and proves the value of the approach. Don't build this in a silo. Create a cross-functional team where business owners co-own the outcomes. When the business unit shares accountability with IT, adoption rates climb dramatically. Finally, define what success looks like. Don't just measure whether dashboards are opened. Track adoption rates, but also the business outcomes those dashboards influence. That's the difference between an expensive report and a real decision-making tool. Before we move on, let's talk about the critical foundation all of this depends on.
 1 min
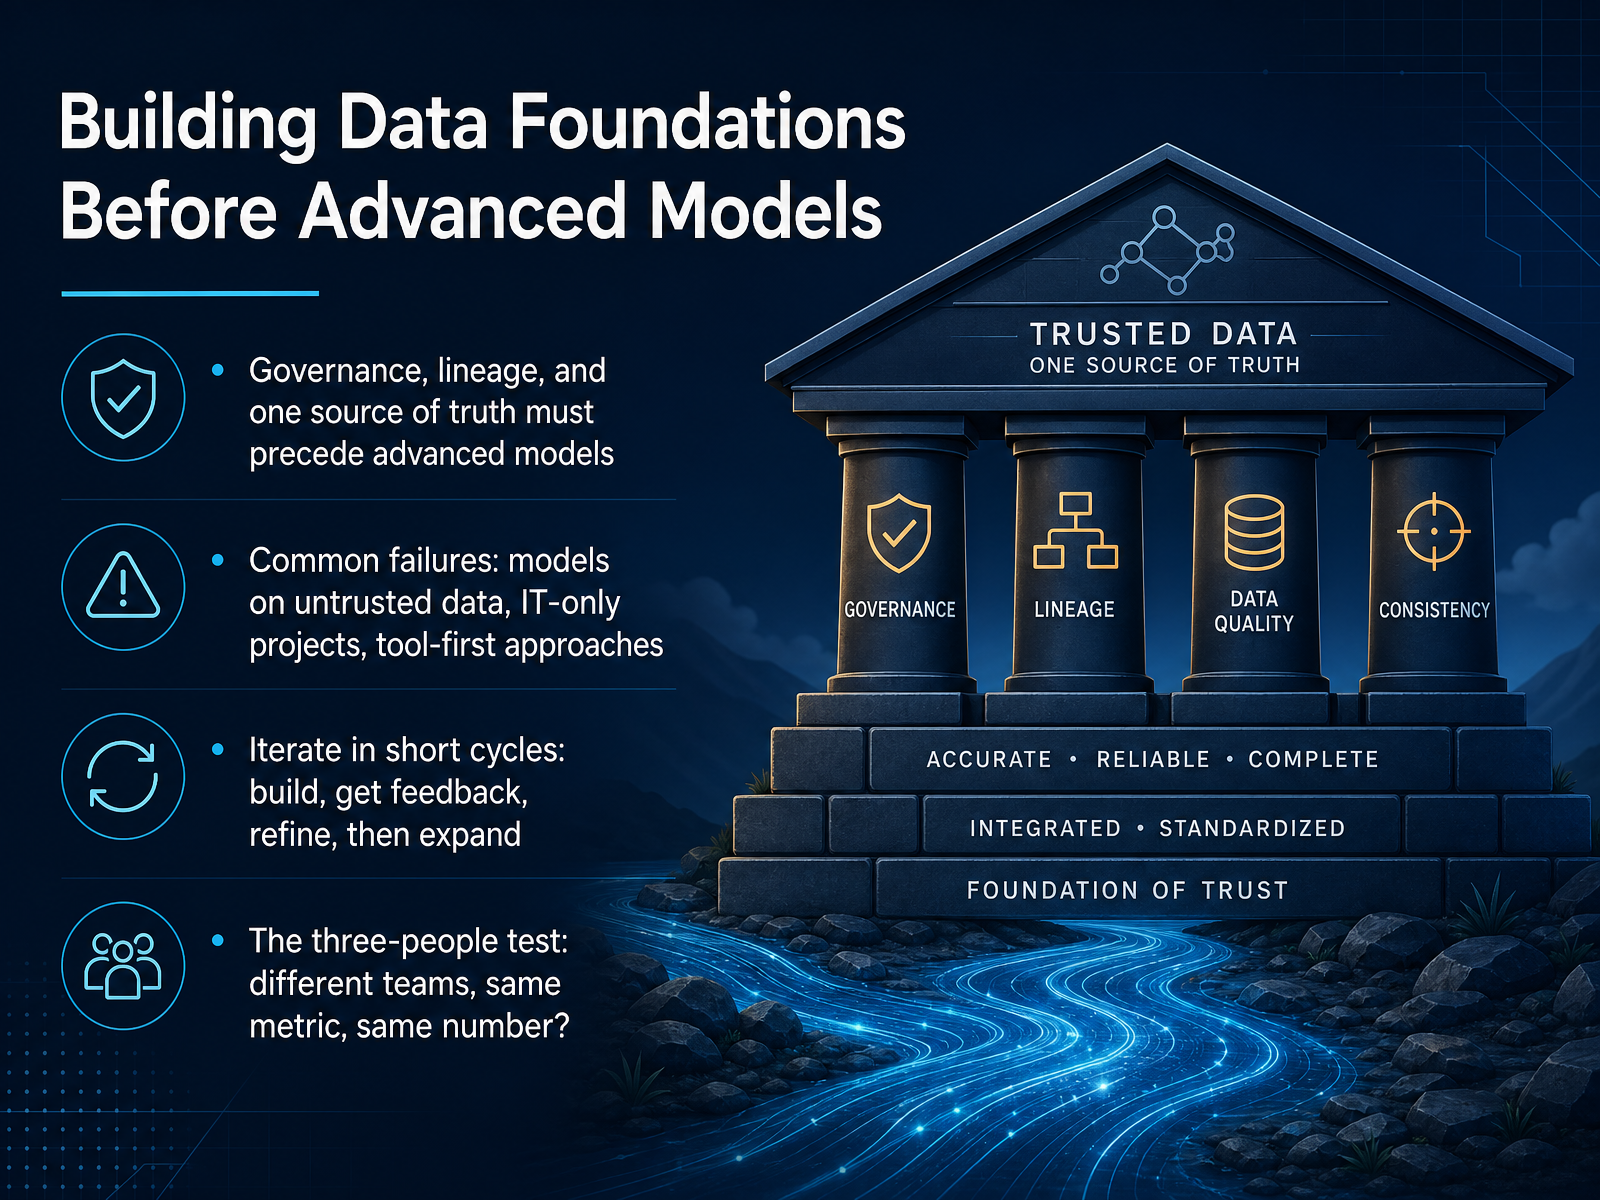
1 min - 11Building Data Foundations Before Advanced ModelsHere's the critical point that separates successful analytics initiatives from failed ones: you cannot build advanced models on shaky foundations. Before you touch predictive or prescriptive analytics, you need governance, data lineage, and a single source of truth. Without these, your models will be built on untrusted data—and nobody will act on them. Now, let's talk about what commonly goes wrong. First, teams try to model on data that hasn't been validated. Second, they treat analytics as an IT-only project, disconnected from business goals. And third, they fall into the tool-first trap, buying technology before they understand their data landscape. Instead, iterate in short cycles: build a small model, get feedback from real users, refine it, then expand. This keeps you grounded and prevents massive rework. Here's a simple test I want you to remember. It's called the three-people test. Ask three people from different teams for the exact same metric. If you get three different numbers, you're not ready for advanced models. You need to fix your data foundations first. So, as you think about advanced analytics, remember: governance is your floor, not your ceiling. The businesses that succeed build data trust before data science. Up next, we'll bring this to life with a case study on predictive analytics in demand forecasting. Let's see how a real company navigates these very challenges.
 1 min
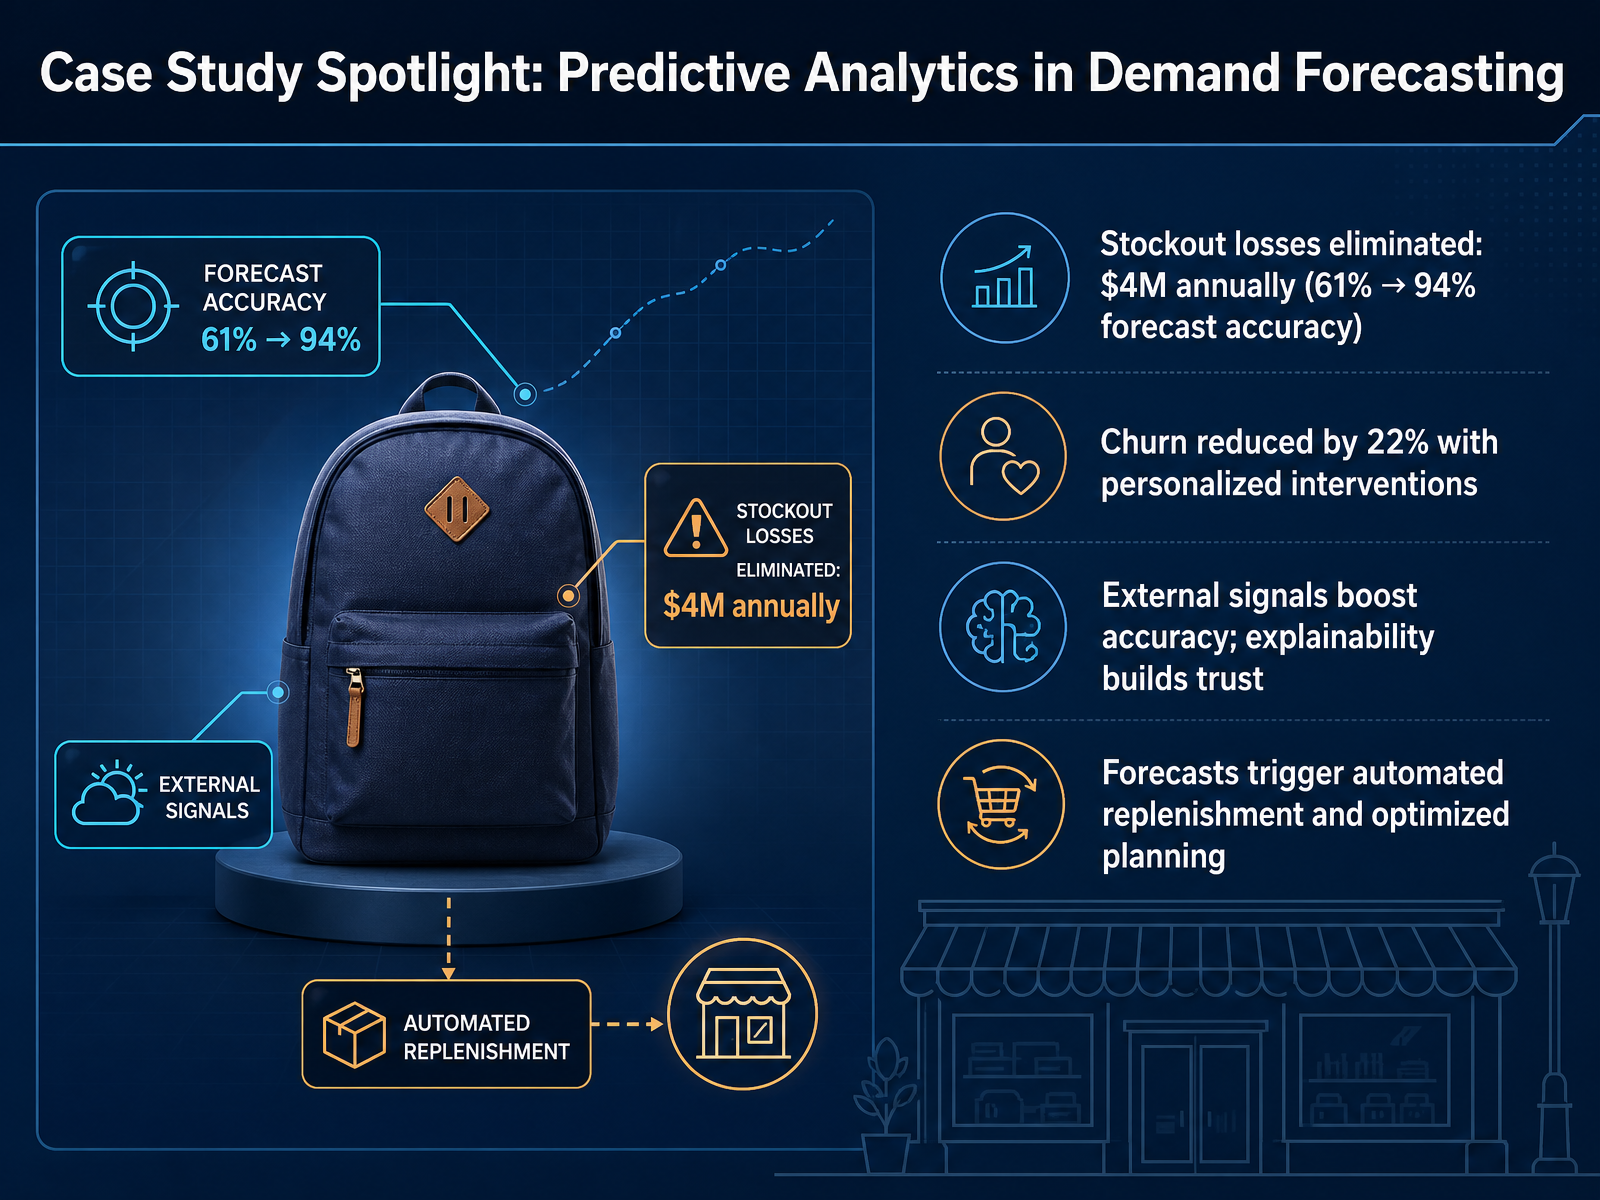
1 min - 12Case Study Spotlight: Predictive Analytics in Demand ForecastingNow let's bring predictive analytics to life with two real-world examples. A national retail chain with 340 stores was losing four million dollars a year to stockouts because their spreadsheet models couldn't account for weather or competitor signals. After building machine learning forecasts trained on five years of sales data, their accuracy jumped from 61 percent to 94 percent. That removed the four million dollar loss entirely. The key? They integrated external signals, and they gave planners an override interface with clear reasoning, which built trust and sped up adoption. On the customer side, a global consumer goods brand used journey prediction to detect early churn signals, then delivered personalized offers at exactly the right moment. The result was a 22 percent reduction in churn and a 15 percent lift in campaign ROI. So what's the takeaway? Predictive analytics doesn't just forecast. It connects directly to action. Whether it's triggering automated replenishment orders or timing a retention offer, the value comes from turning foresight into better decisions. Next, let's summarize the key takeaways and the four questions you should always ask.
 credencys.comnews.sap.comnorvik.ai+21 min
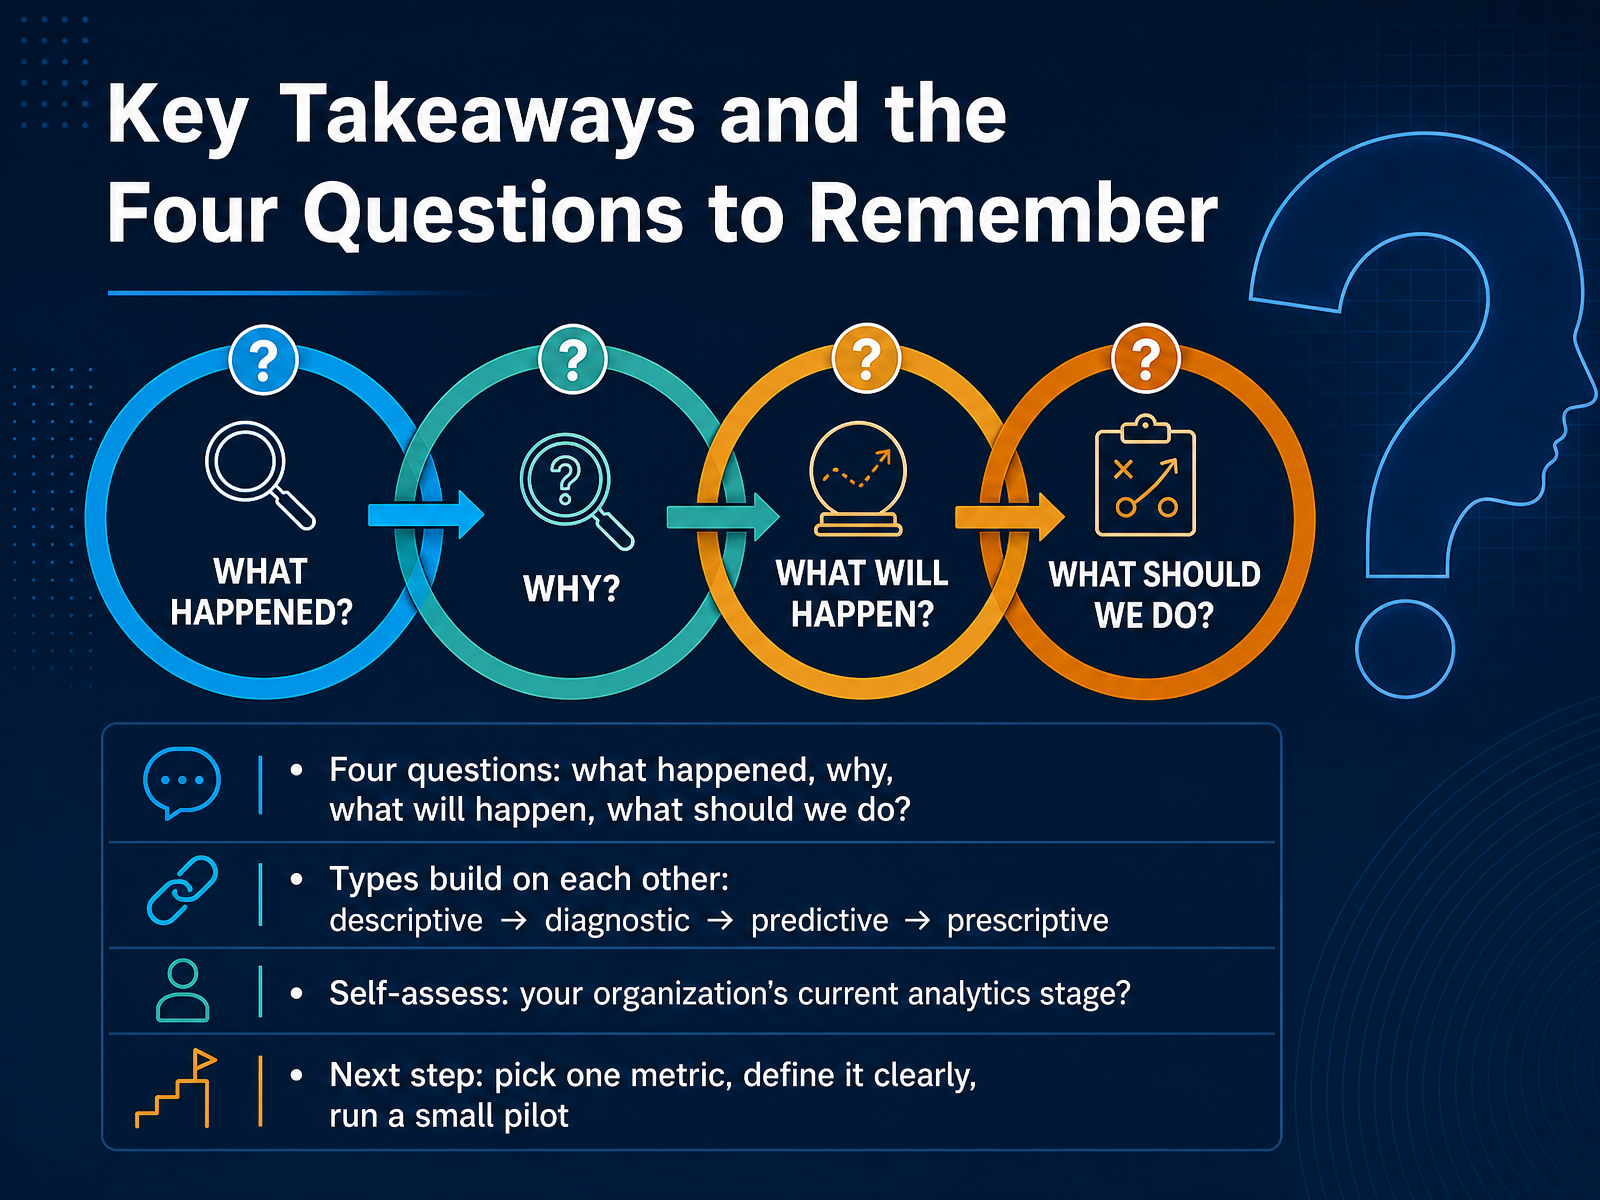
 - 13Key Takeaways and the Four Questions to RememberHere’s what I want you to carry forward. Four questions. What happened? Why did it happen? What will happen? And what should we do about it? Each question maps to one type of analytics, and they build on each other in order. Descriptive leads to diagnostic, which feeds predictive, and finally prescriptive. You can’t diagnose what you haven’t described, and you can’t prescribe without a prediction. So take a moment to self-assess. Where is your organization right now? Are you still building reliable dashboards, or are you already forecasting what’s next? Be honest about your starting point. Here’s your next step. Pick one metric that matters to your business. Define it clearly so everyone agrees on what it means. Then run a small pilot using descriptive analytics to track it. That’s all you need to begin moving up the maturity ladder. One clean metric, one focused test. Coming up next, we’ll walk through actionable next steps and some quick wins you can get started on right away.
 thoughtspot.comdomo.comonline.hbs.edu+22 min
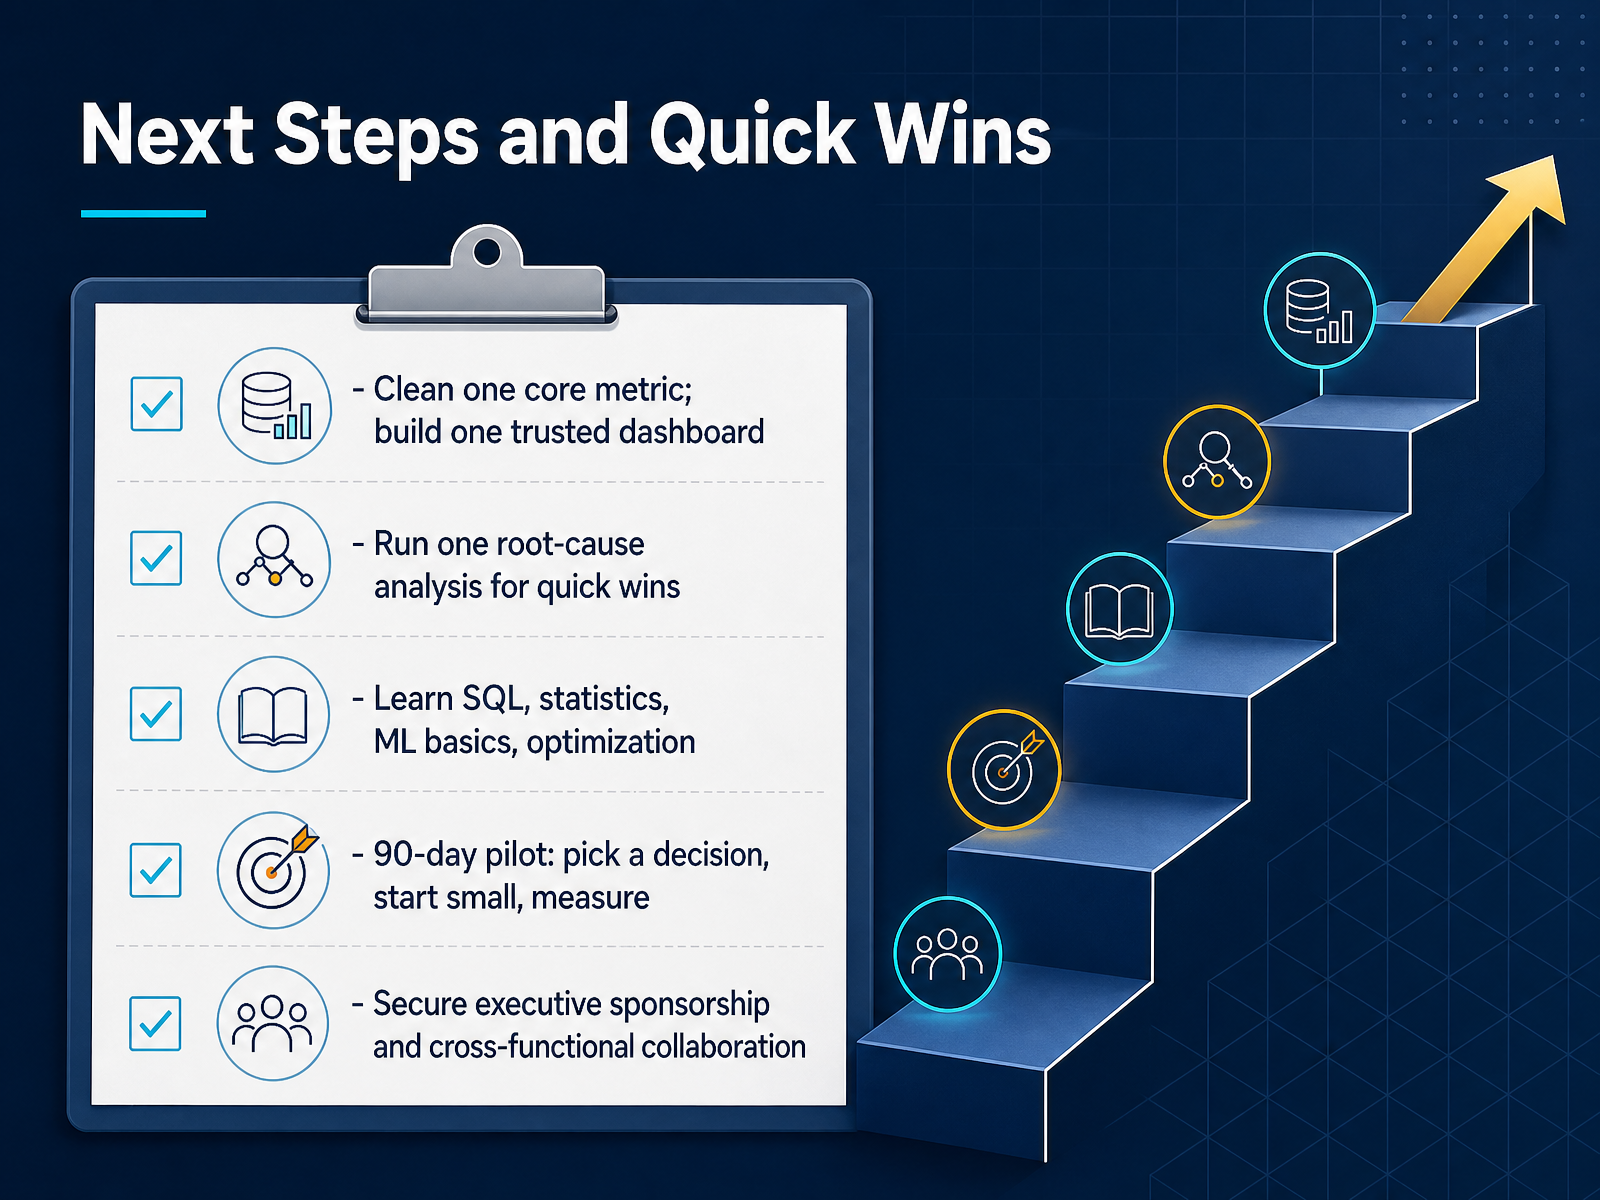
 - 14Next Steps and Quick WinsWe have covered a lot of ground, so let’s boil it down to your next steps and quick wins. First, pick one core metric that everyone agrees on, and build a single, trusted dashboard around it. That is your foundation. Next, run one root-cause analysis to find and fix a quick win. Nothing builds momentum like a fast, visible improvement. Then, invest in yourself: learn SQL, statistics basics, and how to frame optimization problems. In a ninety-day pilot, select one business decision, start small, measure the outcome, and learn from it. Finally, secure executive sponsorship and collaborate across functions. Analytics is a business discipline, not an IT project. The key takeaway is simple: start small, focus on one decision, and build on that success. Thank you for your time and attention. Now go make your data work for you.
 domo.comonline.hbs.edu2 min
Take the deck with you
Download this course as a file — free, no sign-up needed.
- PDF handoutEvery slide page, ready to print or share.15 pages · 3.8 MBDownload
- Narrated PowerPointThe deck that presents itself — every slide carries the digital human's narration video.15 pages · 16.1 MBDownload
- PowerPoint slidesThe full deck as a .pptx — open it in PowerPoint, Keynote, or Google Slides.15 pages · 3.7 MBDownload
Free to use in your own training — please keep the PersonWise credit page at the end.
Have your own deck? Turn it into a course
Sources consulted
Web sources consulted while building this course.
- The 4 Types of Data Analytics: Uses & Examples — thoughtspot.com
- The 4 Types of Data Analytics Explained + Examples — domo.com
- 4 Types of Data Analytics to Improve Decision-Making — online.hbs.edu
- Contemporary Business Analytics: An Overview — doi.org
- 4 Types of Business Analytics for Making Better Decisions — onlinedegrees.scu.edu
- From Business Intelligence to Intelligent Analytics: Evolution of Enterprise Data Platforms — doi.org
- Frontiers of business intelligence and analytics 3.0: a taxonomy-based literature review and research agenda — link.springer.com
- Evolving Business Intelligence and Analytics to Create the Intelligent Enterprise — sapinsider.org
- Business Intelligence Analytics: A Complete Guide for the AI Era — databricks.com
- Business Intelligence and Business Process Management in the Era of Generative AI: A Review of Big Data Analytics, Process Mining, and Decision Support Systems — mdpi.com
- How a Global CPG Brand Reduced Customer Churn by 22% with Predictive Journey Insights — credencys.com
- BRF Uses AI for Transformative Supply Chain Planning | SAP News Center — news.sap.com
- ML Demand Forecasting Eliminating $4M in Annual Stockouts | Norvik — norvik.ai
- Tchibo Case Study | Google Cloud — cloud.google.com
- Transforming Label Manufacturing with Demand Forecasting, Inventory, and Customer Analytics — decision-tree.com
- DEPLOYMENT OF A NOVEL PRODUCTION PLANNING AND PRESCRIPTIVE ANALYTICS SOLUTION: A SEAGATE TECHNOLOGY USE CASE — informs-sim.org
- How Daikin Industries Is Using Supply Chain Simulation to Drive Smarter Decisions Globally — optilogic.com
- Optimizing Manufacturing Production Scheduling Through Intelligent Digital Twin Systems — simio.com
- NVIDIA Cuts Supply Chain Planning Time by 144x | NVIDIA Case Study — nvidia.com
- ESAN Eczacıbaşı Industrial Raw Materials Company (ESAN) | IBM — ibm.com