Begin
14 pages · ~28 min
Conversion Rate Optimization Process
This training guides marketers and analysts through the conversion rate optimization process, covering its key stages, team roles, and deliverables.
A digital instructor presents all 14 pages. Hold “Ask” at any point and ask out loud — the answer comes from this course. No sign-up needed.
What you’ll learn
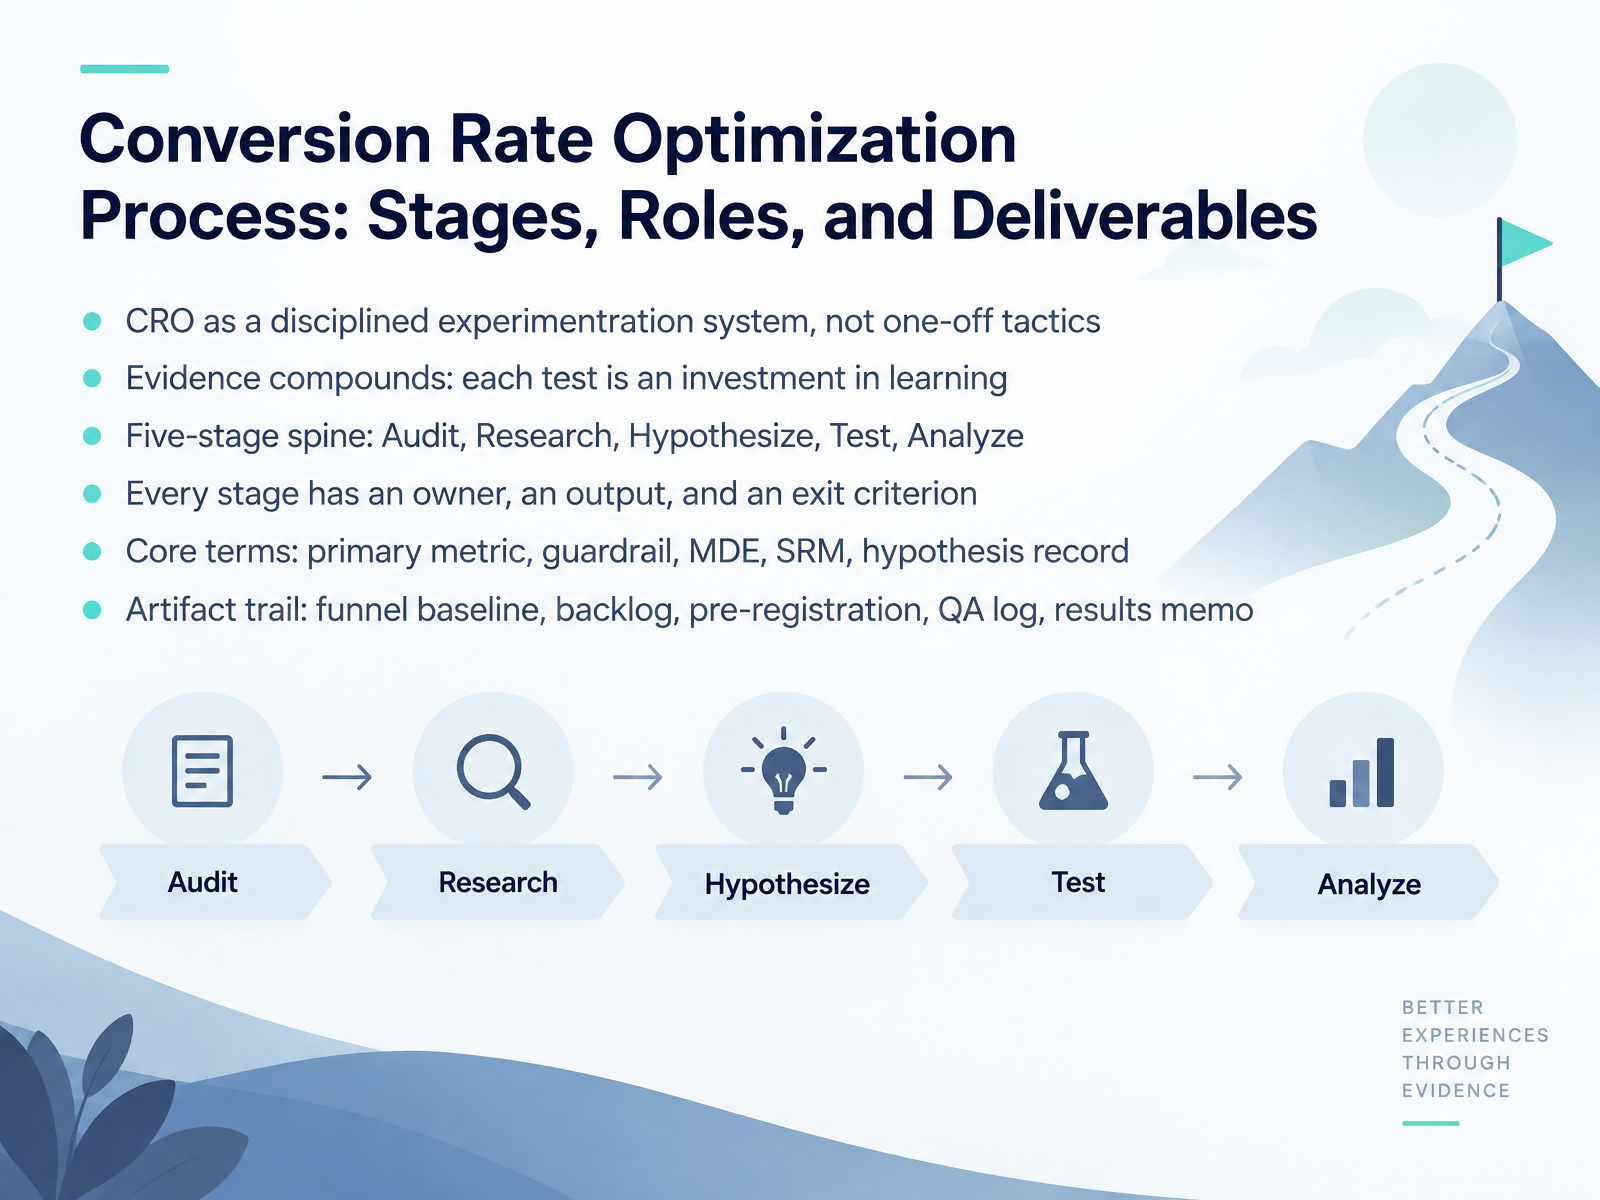
- 01Conversion Rate Optimization Process: Stages, Roles, and DeliverablesWelcome. This course is about running conversion rate optimization as a disciplined experimentation system, not a grab bag of one-off tactics. Our goal is simple: by the end, you'll know the five-stage spine, who owns each stage, what they produce, and what tells you the stage is done. Those stages are Audit, Research, Hypothesize, Test, and Analyze. Two ideas frame everything. First, evidence compounds. Every test is an investment in learning, and losing variants teach you as much as winners. Second, every stage has an owner, an output, and an exit criterion. You'll also pick up the core terms: primary metric, guardrail, minimum detectable effect, sample ratio mismatch, and hypothesis record. And you'll build an artifact trail: funnel baseline, backlog, pre-registration, QA log, and results memo. That trail is what makes handoffs clean across CRO leads, growth, researchers, designers, developers, and product managers. Next, let's look at why the process beats the tactic.foundrycro.comchristopholivierconsulting.comvolument.com+22 min
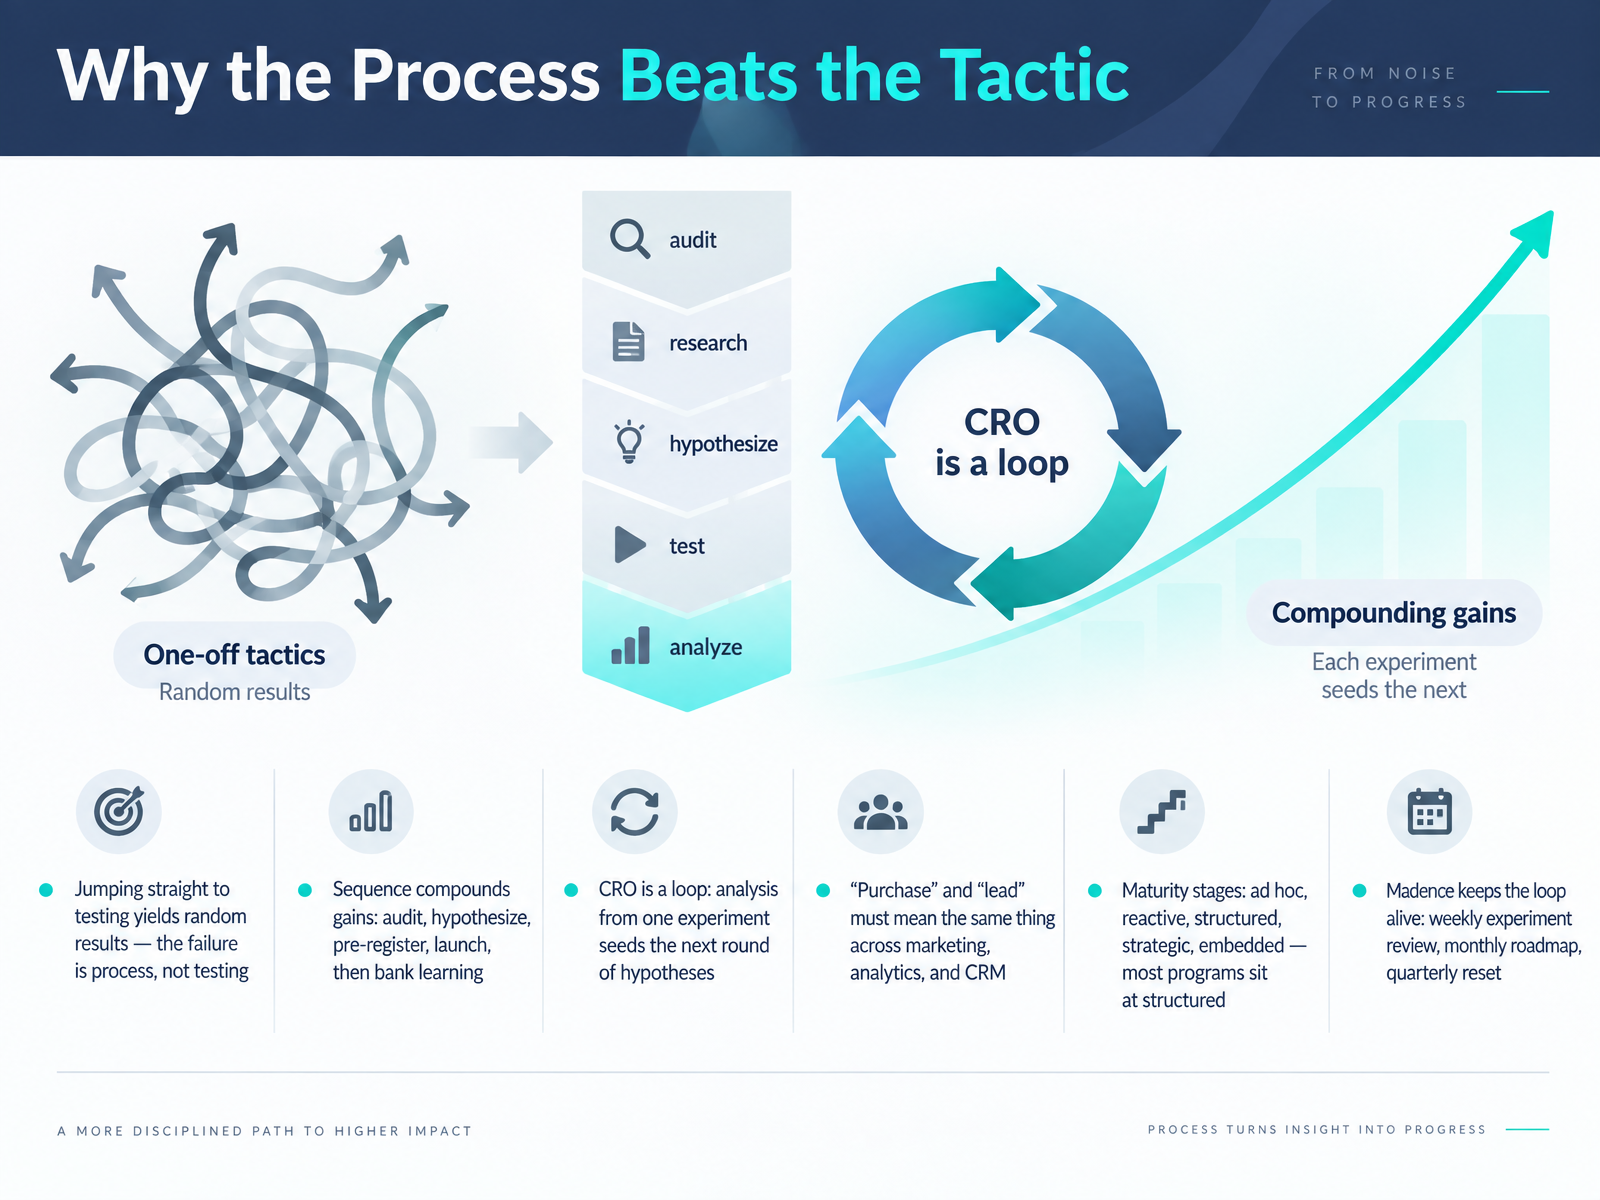
- 02Why the Process Beats the TacticLet's talk about why the process beats the tactic. Jumping straight to testing gives you random results, and the failure is almost never the test itself. It's the missing process. Sequence is what compounds. Audit, hypothesize, pre-register, launch, then bank the learning. CRO is a loop, not a line, so the analysis from one experiment seeds the next round of hypotheses. One thing you must settle early: 'purchase' and 'lead' have to mean exactly the same thing across marketing, analytics, and C R M. If definitions drift, your results are noise. On maturity, most programs sit at structured, somewhere between reactive and strategic. That is normal. What keeps the loop alive is cadence: a weekly experiment review, a monthly roadmap, and a quarterly reset. Miss the cadence and the program decays. Next, we start at the foundation: Stage 1, Audit Measurement and Provenance Before Optimizing.
 foundrycro.comchristopholivierconsulting.comvolument.com+22 min
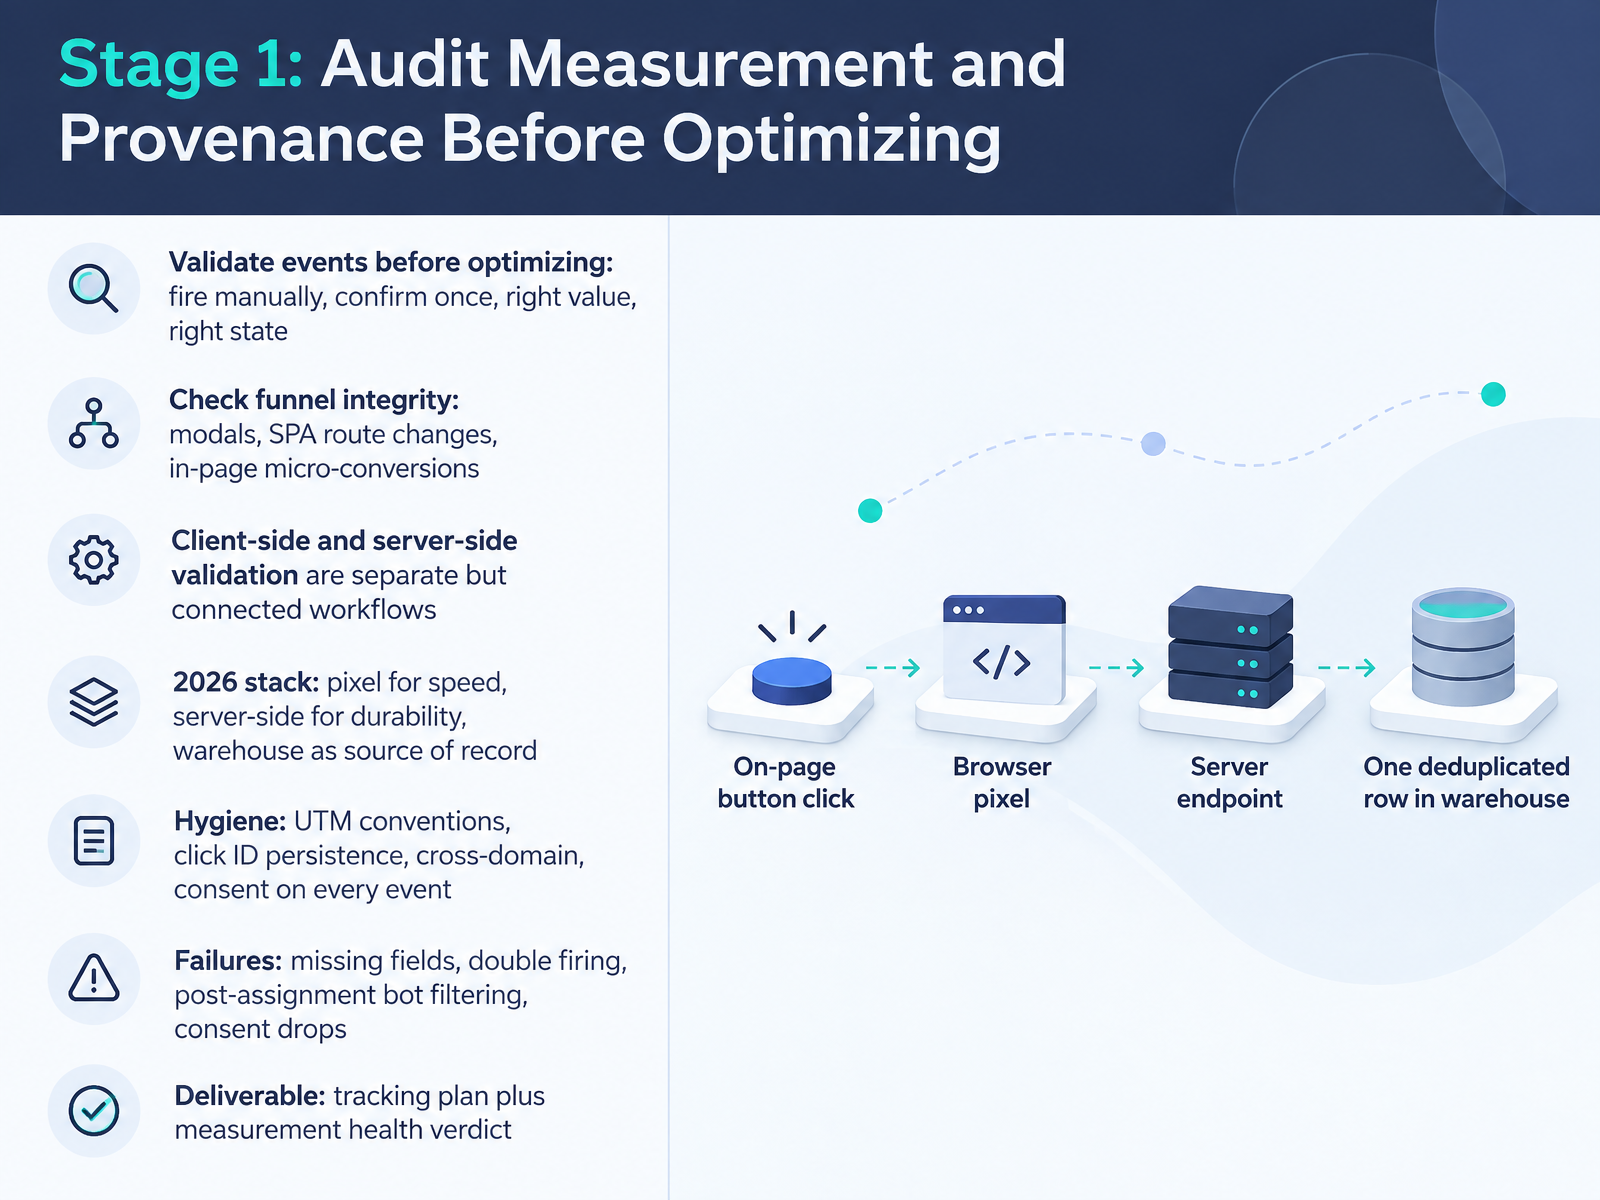
- 03Stage 1: Audit Measurement and Provenance Before OptimizingLet's start where every credible CRO program should start: the audit. Before you optimize anything, you validate that your measurement is trustworthy. First, events. Fire each conversion event manually and confirm it fires once, with the right value, in the right state. Confirm it on the success state, not on a button click that can fail.
Next, funnel integrity. Do modals, single-page-app route changes, and in-page micro-conversions actually show up in your funnel, or do they disappear?
Then, split your validation. Client-side and server-side checks are separate but connected workflows. In the 2026 stack, the pixel gives you speed, server-side gives you durability, and the warehouse is your source of record. They must deduplicate on a shared event ID, or you will inflate conversions by fifteen to thirty percent.
Hygiene matters too: UTM conventions, click ID persistence, cross-domain, and consent on every event. Watch the common failures, like missing fields, double firing, bot filtering after assignment, and consent drops.
The deliverable here is a tracking plan plus a measurement health verdict. Document the event, trigger, owner, and destinations before you trust a single number.
Mapping the Funnel and Sizing the Opportunity.
 trackingplan.comcometly.comblog.openutm.app+22 min
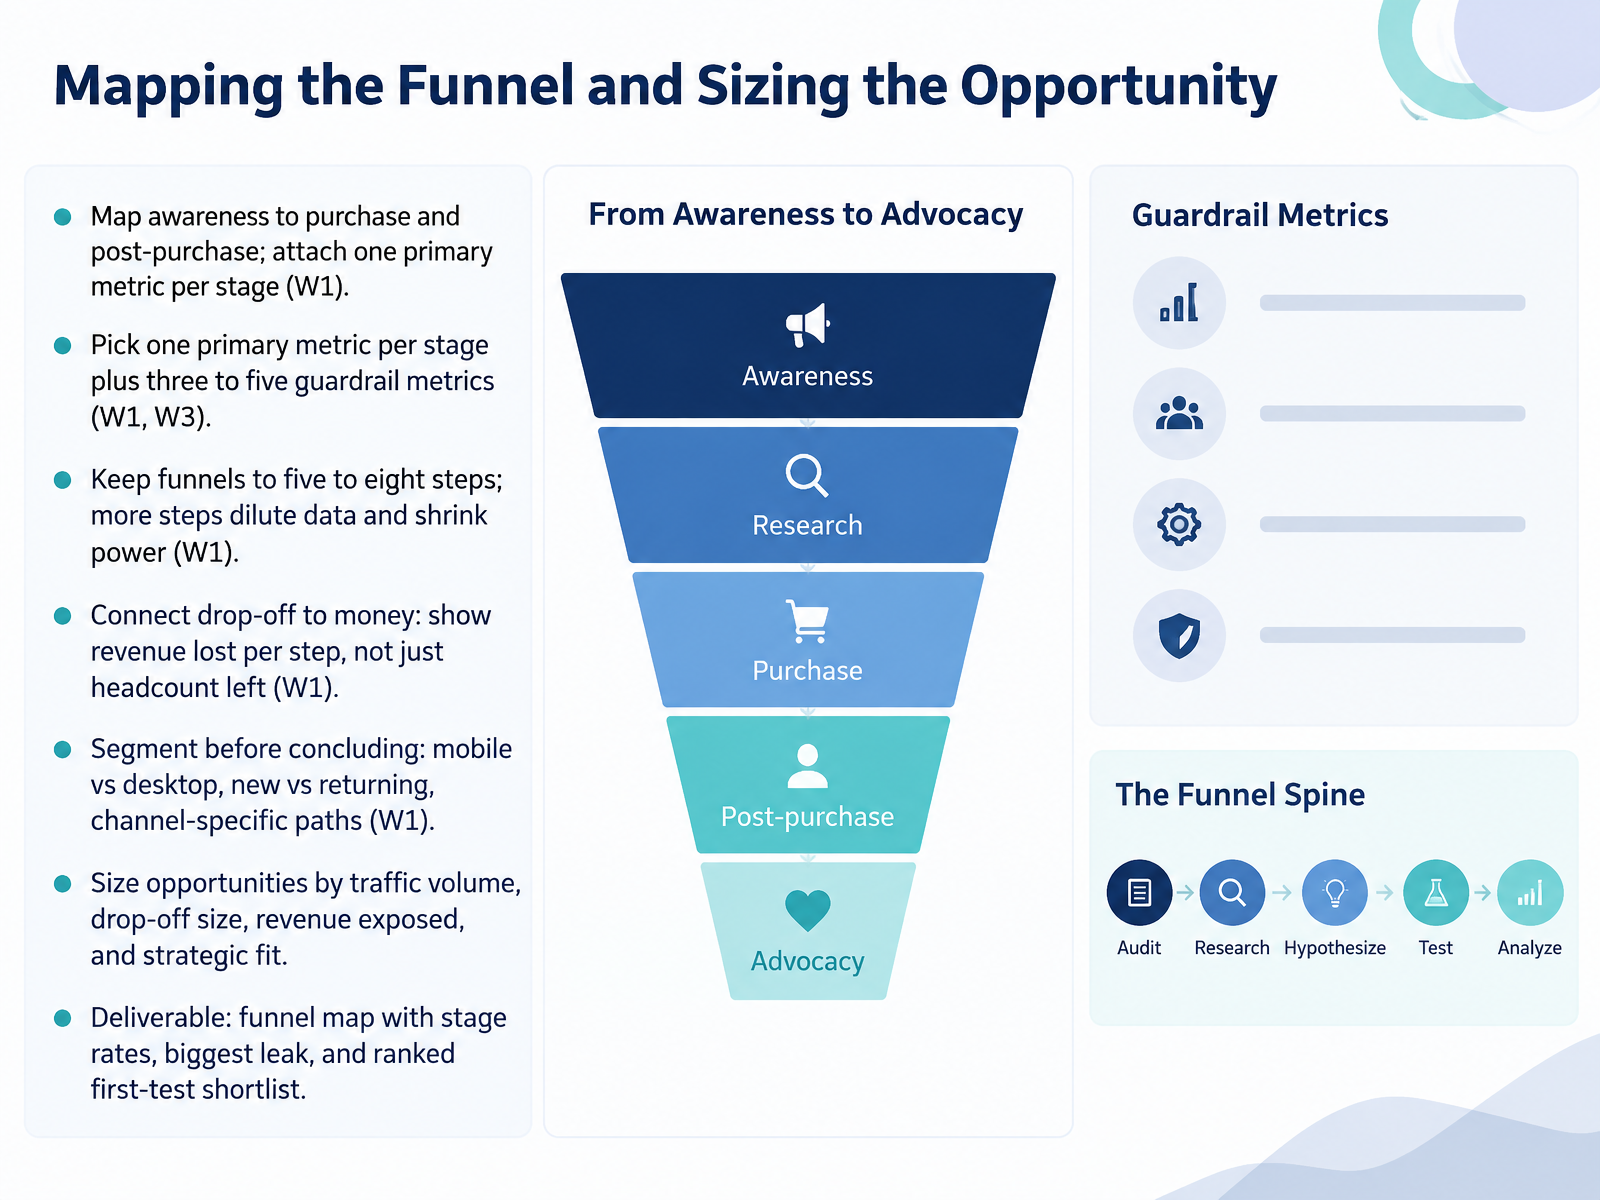
- 04Mapping the Funnel and Sizing the OpportunityNow, before you write a single test, you map the funnel and size the opportunity. Start by mapping awareness through purchase, and on to post-purchase. Attach one primary metric per stage, plus three to five guardrail metrics so you catch collateral damage. Keep the funnel to five to eight steps. Fifteen steps splits your data until no step is significant. Next, connect drop-off to money. Don't just show that 300 people left a step. Show the revenue exposed at that step. Segment before you conclude: mobile versus desktop, new versus returning, and channel-specific paths often tell opposite stories. Then size each opportunity by traffic volume, drop-off size, revenue exposed, and strategic fit. The deliverable for this stage is a funnel map with stage rates, the single biggest leak, and a ranked first-test shortlist. That shortlist is your handoff into research. So let's move into Stage 2: Research and Insight, Quantitative and Qualitative.
 trackingplan.comcometly.comblog.openutm.app+22 min
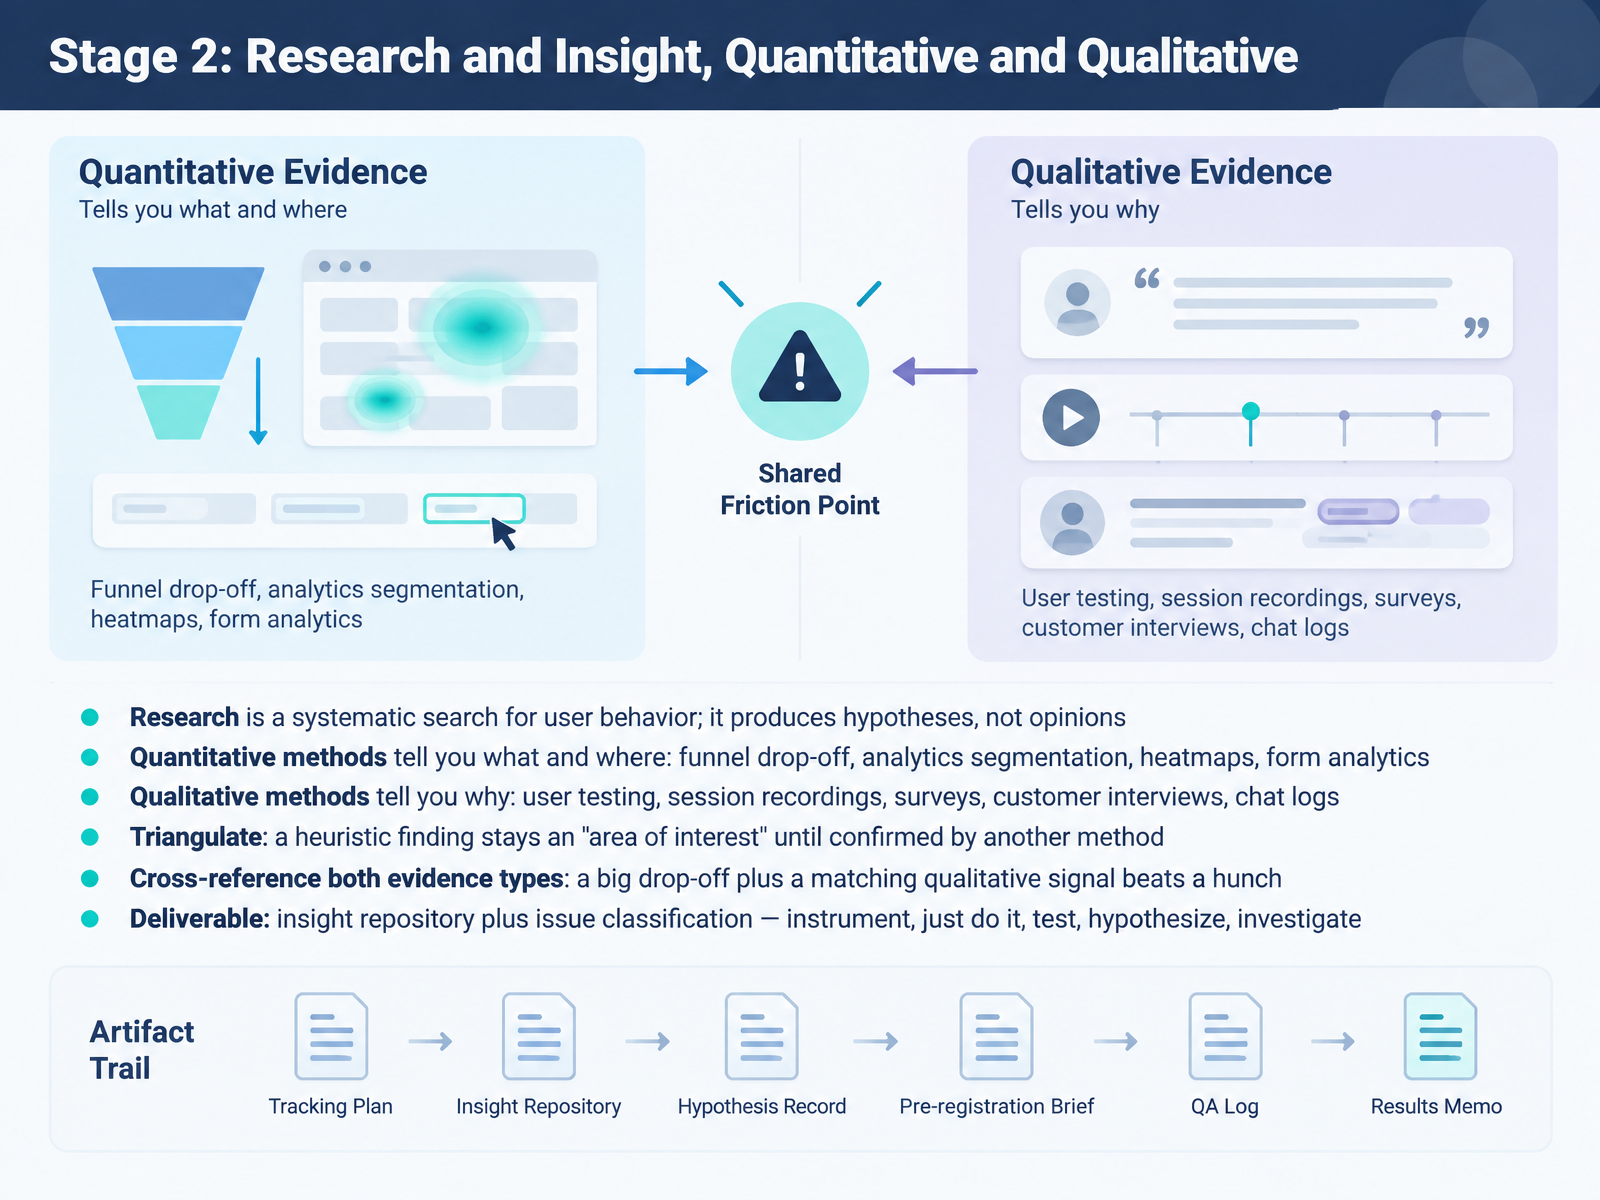
- 05Stage 2: Research and Insight, Quantitative and QualitativeNow let's get into Stage Two: Research and Insight, quantitative and qualitative. Research is a systematic search for user behavior, and its output is hypotheses, not opinions. Quantitative methods tell you what and where: funnel drop off, analytics segmentation, heatmaps, form analytics. Qualitative methods tell you why: user testing, session recordings, surveys, customer interviews, chat logs. Here is the rule that keeps you honest. Triangulate. A heuristic finding stays an area of interest until another method confirms it. Cross reference both evidence types. A big drop off plus a matching qualitative signal beats a hunch every time. Your deliverable is an insight repository plus issue classification, sorted into instrument, just do it, test, hypothesize, and investigate. Next, Stage Three: Writing Hypotheses That Can Be Falsified.
 cxl.comcxl.comspeero.com+21 min
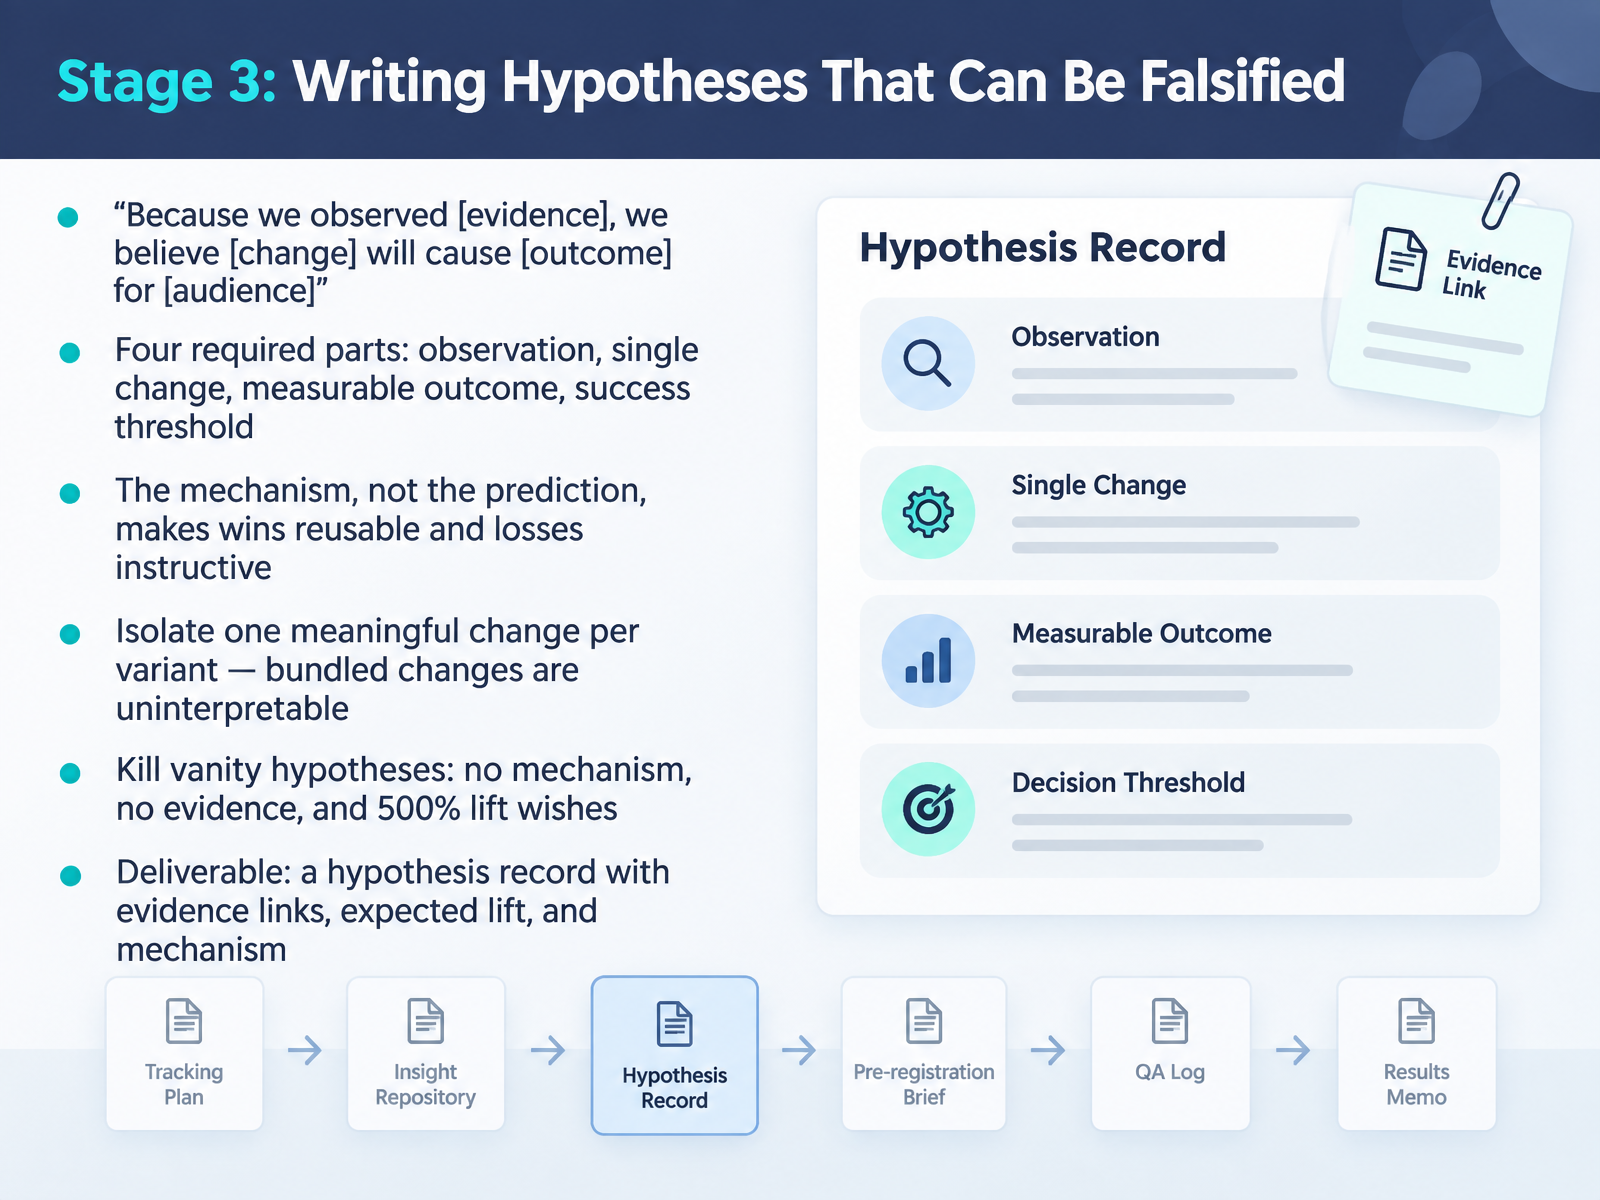
- 06Stage 3: Writing Hypotheses That Can Be FalsifiedNow let's make those hypotheses falsifiable. The format is: because we observed this evidence, we believe this change will cause this outcome for this audience. Four parts are required. The observation, one single change, a measurable outcome, and a success threshold. For example, because heatmaps show seventy percent of visitors never scroll past the hero, we believe moving the pricing table above the fold will raise trial signups by fifteen percent for first time visitors. Notice the success threshold is stated up front. The mechanism is what makes wins reusable and losses instructive. Without a reason like that, a win is a one off you cannot repeat and a loss teaches you nothing. Isolate one meaningful change per variant. If you bundle three changes and win, you cannot tell which one worked, and if you lose, you cannot tell which one hurt. So kill vanity hypotheses. No mechanism, no supporting evidence, or a wish for a five hundred percent lift. In practice, the researcher or CRO lead drafts the hypothesis, the growth team confirms the metric, and design and engineering scope the change. The deliverable is a hypothesis record with evidence links, expected lift, and a stated mechanism. Next, we turn that record into a pre-registration with sample size, duration, and decision rules.
 metaflow.lifeatticusli.comideaplan.io+22 min
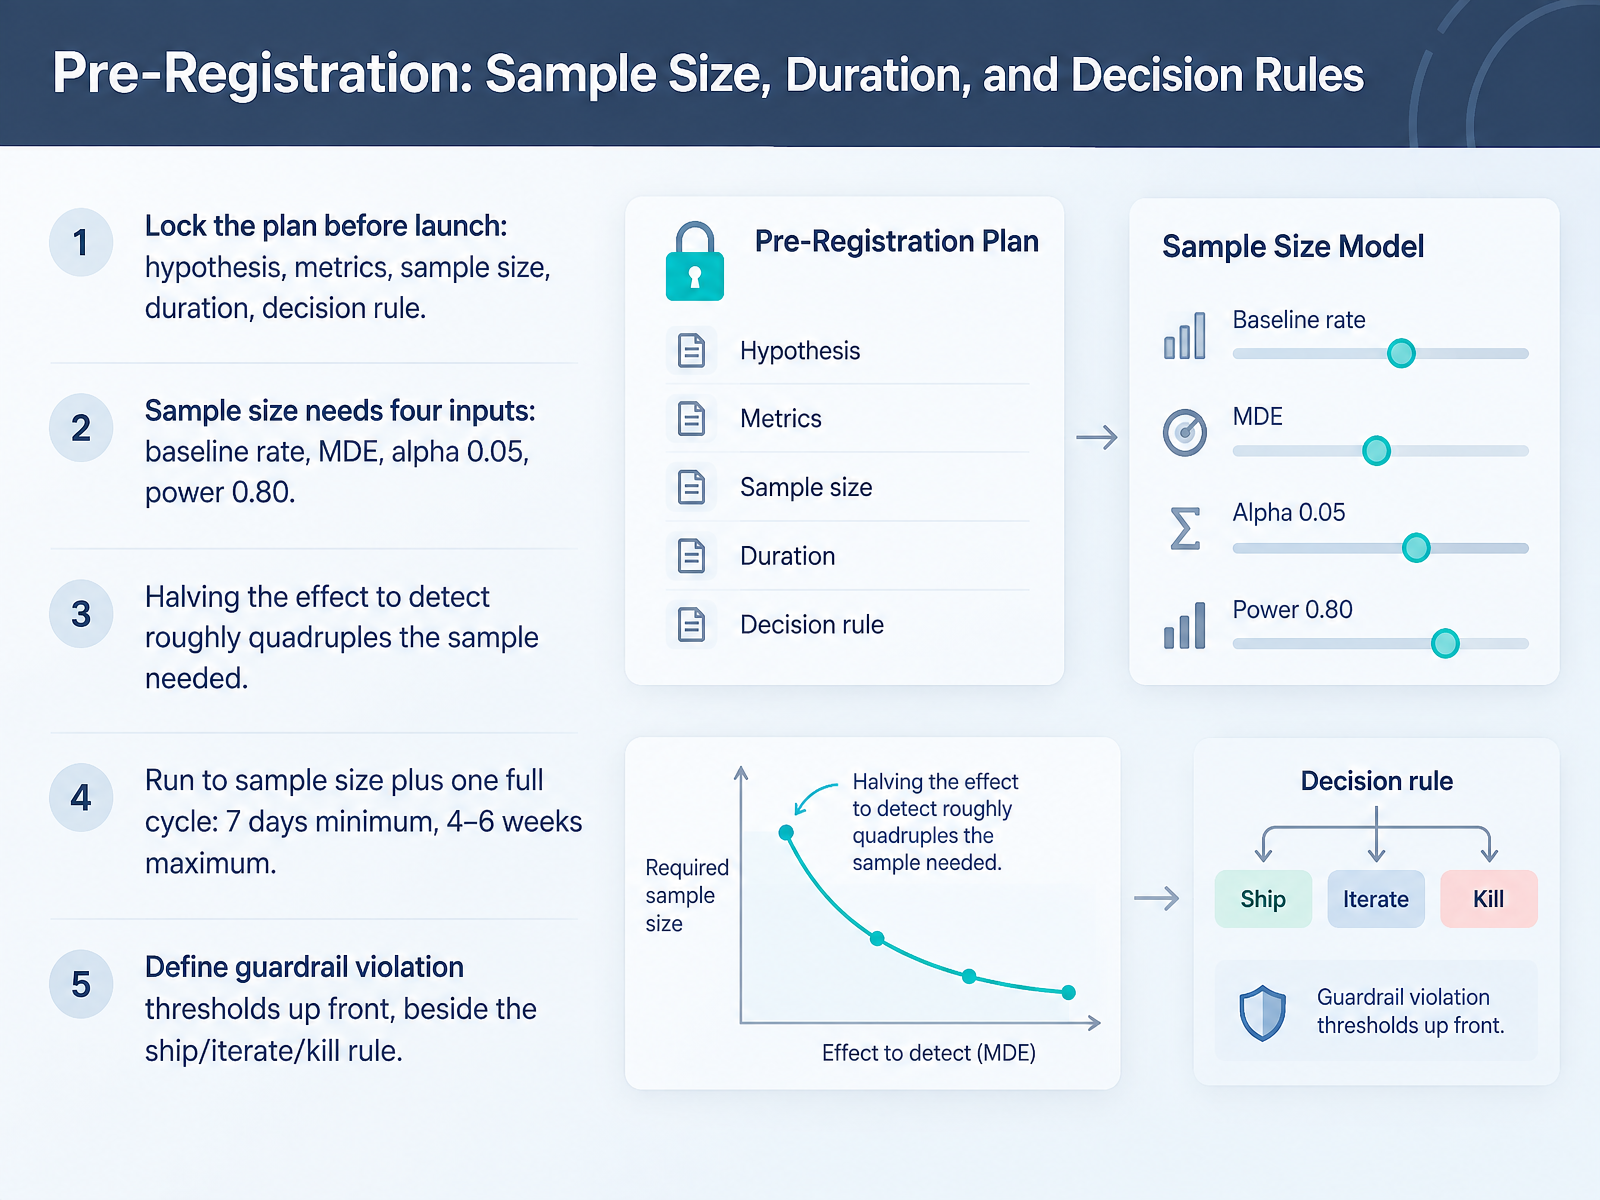
- 07Pre-Registration: Sample Size, Duration, and Decision RulesNow let's lock the experiment before it launches. Pre-registration means writing down the hypothesis, the primary metric, the sample size, the duration, and the decision rule before you see any data. If you skip this, an ambiguous result will get reinterpreted to fit whatever you were hoping for.
Sample size needs four inputs: your baseline conversion rate, the minimum detectable effect, alpha at zero point zero five, and power at zero point eight zero. One thing to internalize here. If you halve the effect you want to detect, the sample roughly quadruples. So a page that needs nine thousand sessions per arm for a twenty percent lift might need closer to thirty seven thousand to catch a ten percent lift.
Run to your computed sample size, plus one full business cycle. Seven days minimum, four to six weeks maximum. Stopping early because the numbers look good is the fastest way to manufacture a false positive.
Finally, define your guardrail violation thresholds right alongside the ship, iterate, or kill rule. Ship above plus fifteen percent, iterate between zero and fifteen, kill below zero. That is what makes the outcome unambiguous for designers, developers, and the product manager waiting on the call.
Next, we'll look at how to choose between competing test ideas using prioritization frameworks like ICE, PIE, PXL, and hybrids.
 metaflow.lifeatticusli.comideaplan.io+22 min
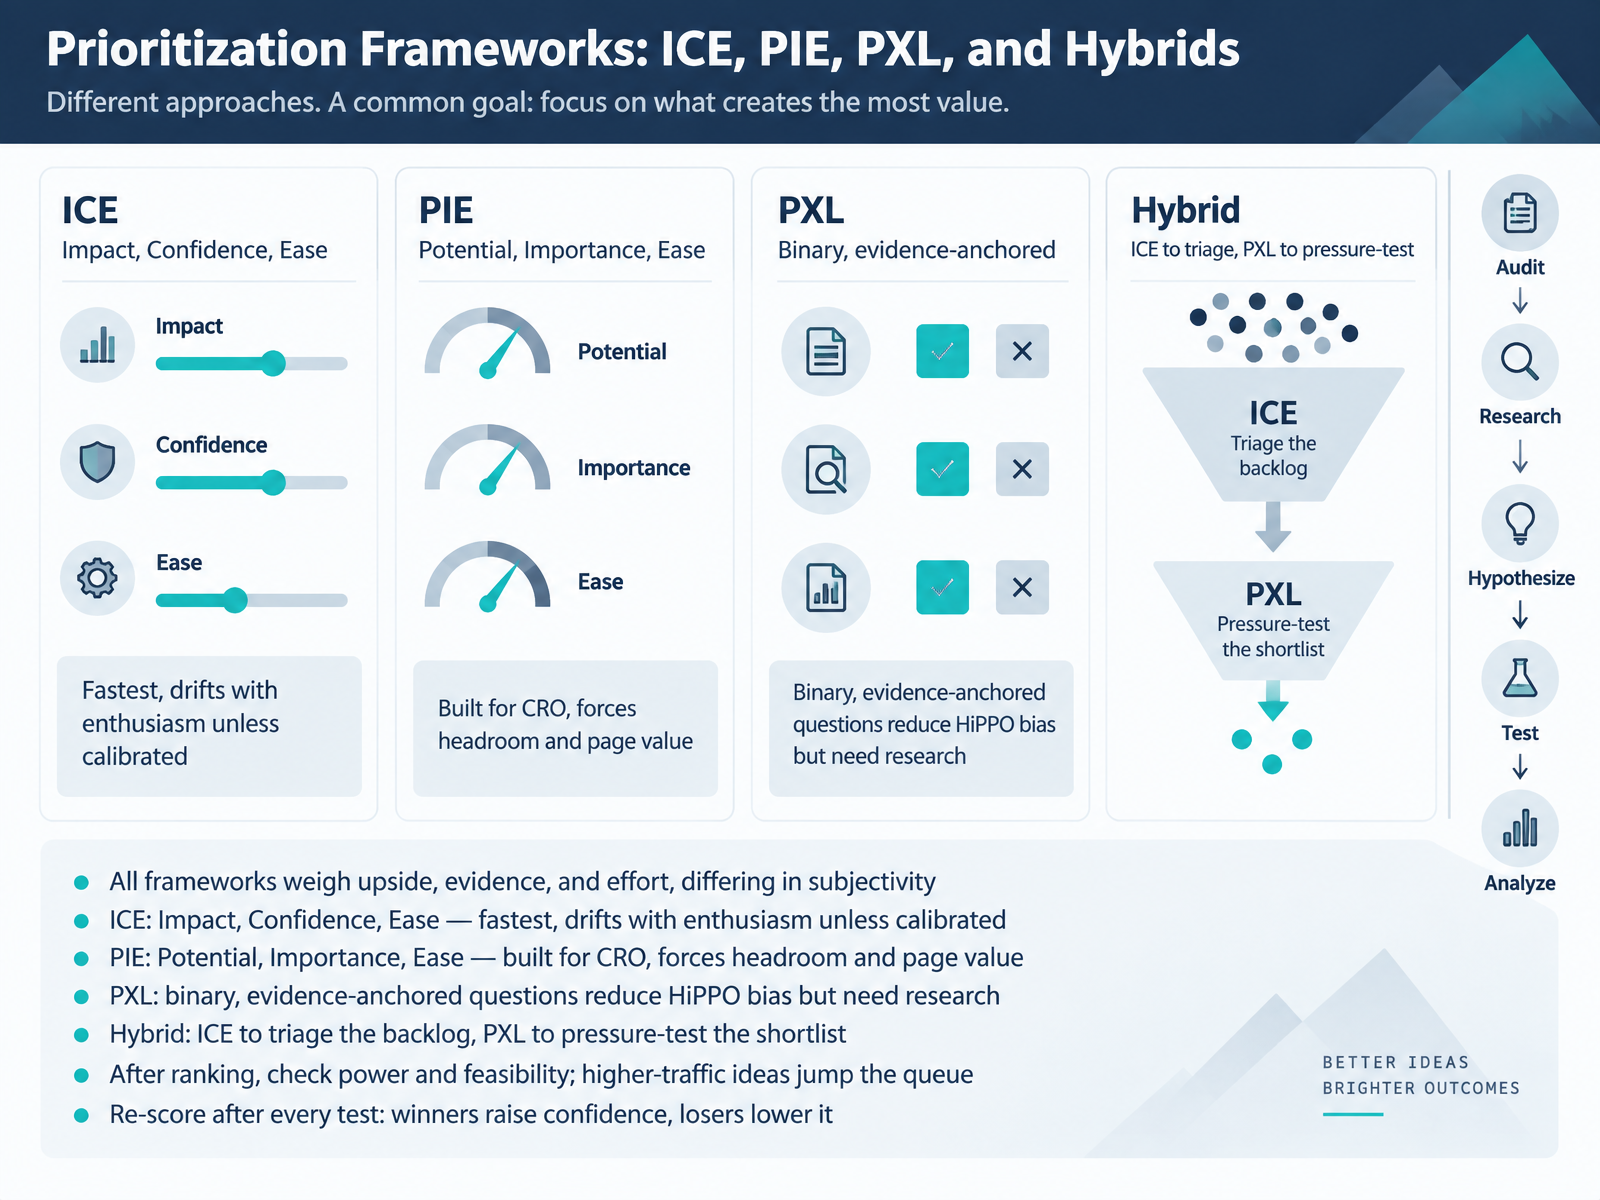
- 08Prioritization Frameworks: ICE, PIE, PXL, and HybridsNow let's talk prioritization frameworks. ICE, PIE, PXL, and hybrids all weigh three things, upside, evidence, and effort. Where they differ is how much subjectivity they leave you.
ICE is Impact, Confidence, Ease. It's the fastest, and it drifts with enthusiasm unless you calibrate the scale together. PIE, Potential, Importance, Ease, was built for conversion work. It forces you to look at headroom and page value, so you stop over-testing low-traffic pages.
PXL replaces the one-to-ten guess with binary, evidence-anchored questions. Two people scoring the same idea usually land on the same total, but you need real research to answer those questions.
In practice, many mature teams run a hybrid. Use ICE to triage the backlog, then pressure-test the shortlist with PXL.
After ranking, check power and feasibility. A higher-traffic idea reaches significance sooner, so it jumps the queue on that alone. And re-score after every test. Winners raise confidence on related ideas, losers lower it.
That sets up what comes next: Building and Governing the Experiment Roadmap.
 2 min
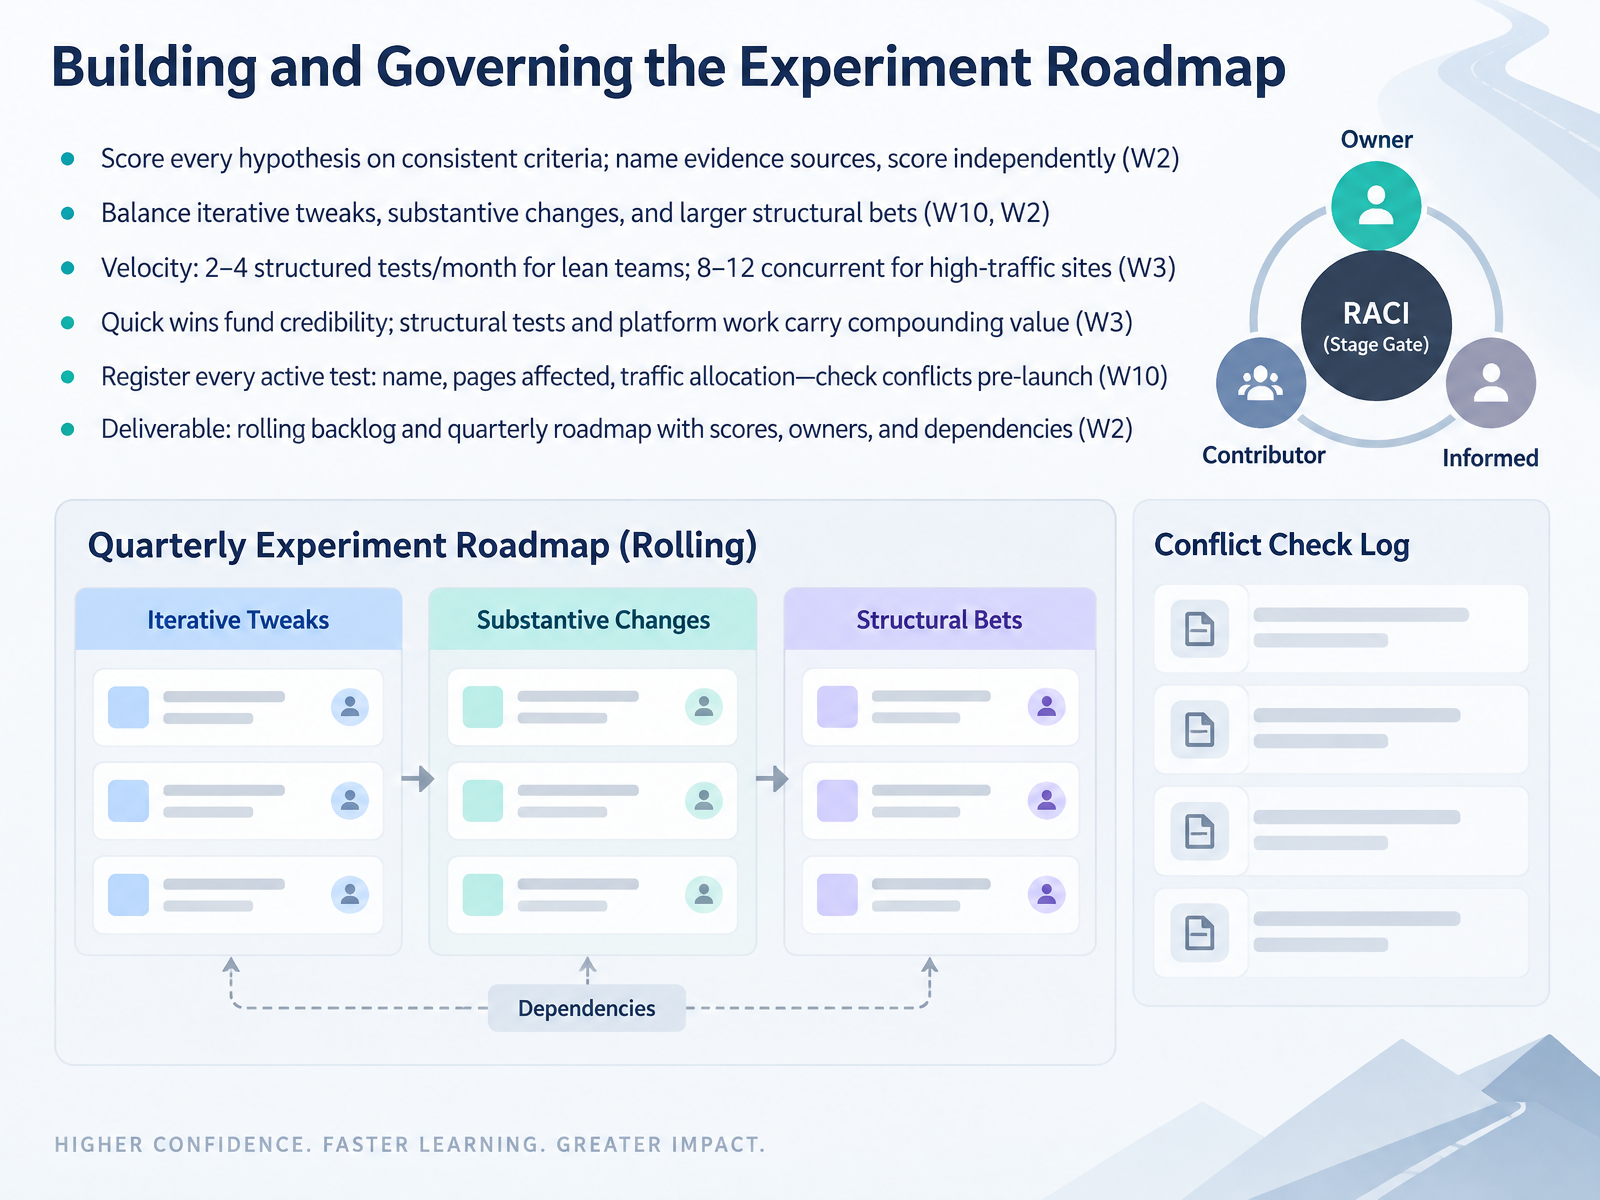
- 09Building and Governing the Experiment RoadmapNow let's talk about building and governing the experiment roadmap. Every hypothesis gets scored on consistent criteria, with evidence sources named. And crucially, people score independently before you reconcile, so one loud voice does not anchor the room. Balance matters too. Mix iterative tweaks, substantive changes, and larger structural bets. The tweaks keep learning moving, the structural bets carry compounding value. On velocity, lean teams should target two to four structured tests per month. High-traffic sites can run eight to twelve concurrent tests across different pages, as long as they do not interfere. Quick wins fund credibility and buy you room for the bigger work. Governing the roadmap means registering every active test with its name, the pages affected, and traffic allocation, then checking conflicts before launch. And your deliverable here is a rolling backlog plus a quarterly roadmap, each item carrying its score, its owner, and its dependencies. Next, we move into Stage 4: Execution, Build Paths, and Launch QA.
 foundrycro.comchristopholivierconsulting.comvolument.com+22 min
- 10Stage 4: Execution, Build Paths, and Launch QANow let's move into Stage Four: execution, build paths, and launch QA. This is where your decisions become real code and real risk.
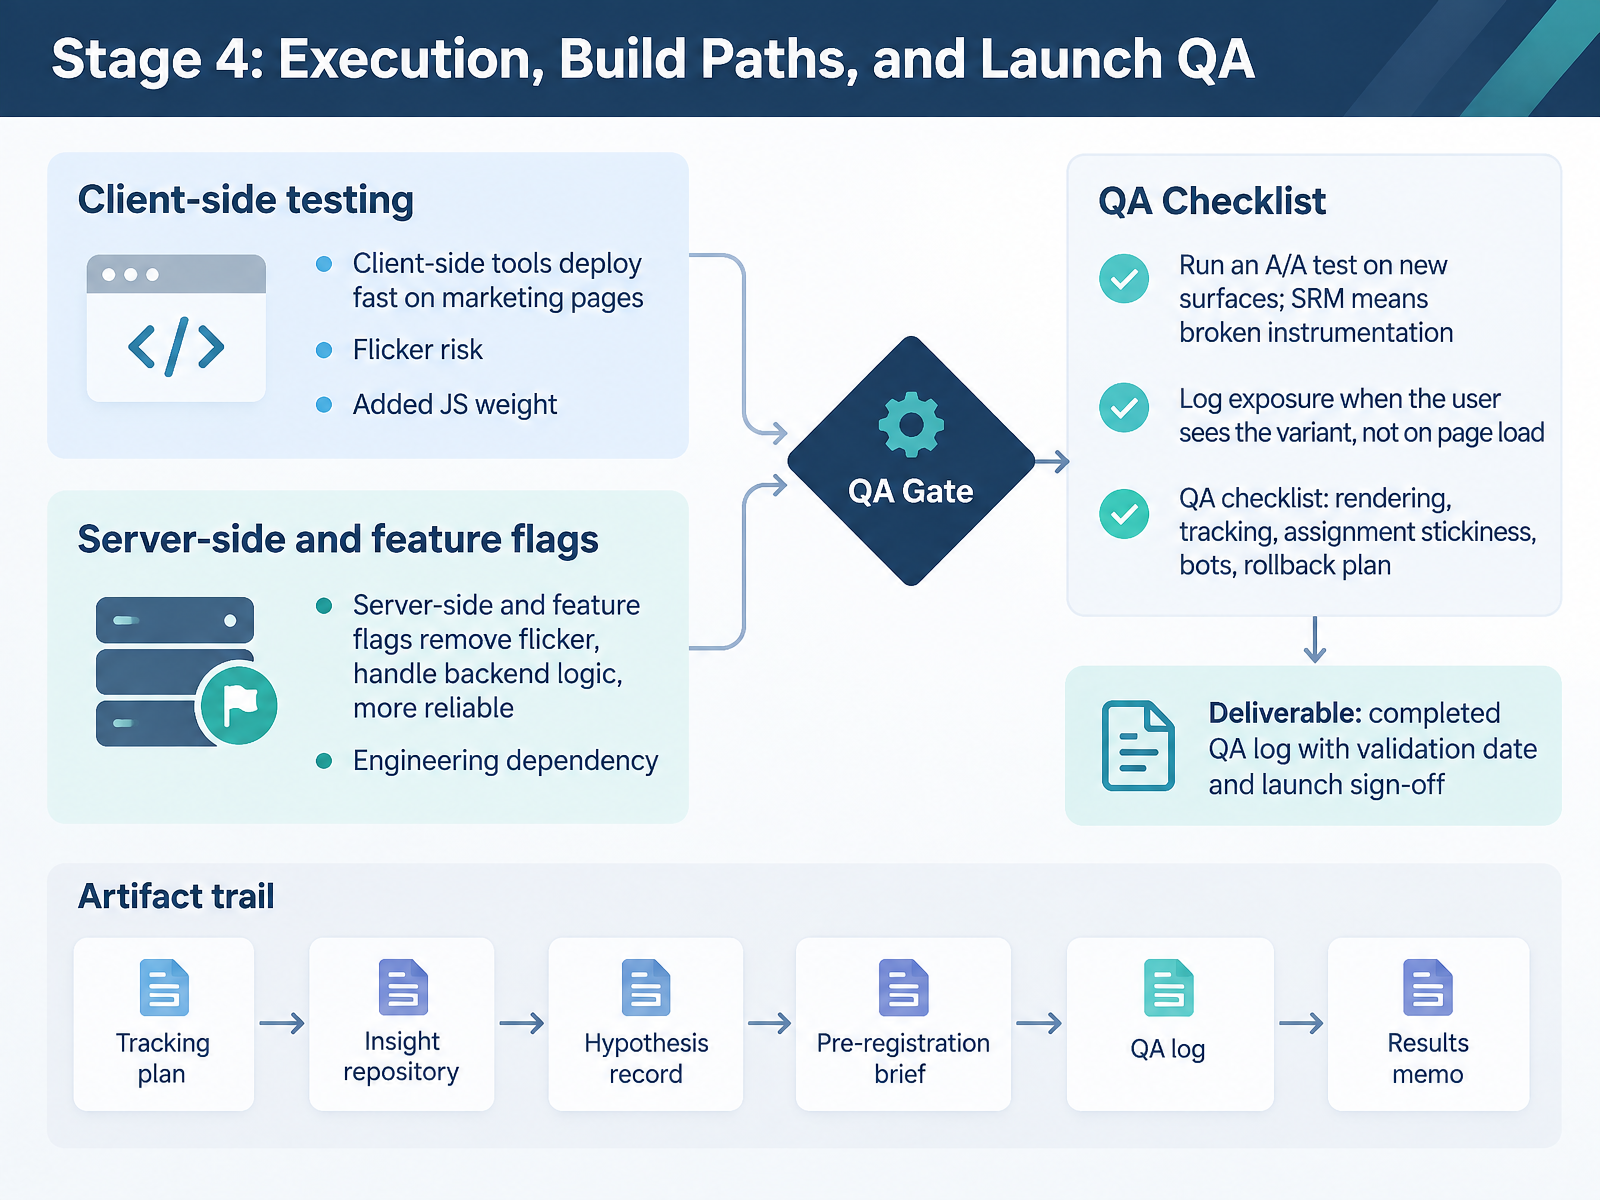
First, pick the right build path. Client-side tools deploy fast on marketing pages, so they're fine for copy and layout tests. But server-side implementation and feature flags remove flicker, handle backend logic, and are simply more reliable. Use them for pricing, algorithms, and anything that depends on server state.
Before you trust a new surface, run an A/A test. Two identical variants should show a clean split. If you see Sample Ratio Mismatch, or SRM, your instrumentation is broken before you've tested anything real.
Log exposure when the user actually sees the variant, not on page load. Otherwise you inflate the denominator and dilute your metric.
Your QA checklist should cover rendering, tracking, assignment stickiness, bot filtering, and a tested rollback plan. Designers and developers verify the build, researchers and analysts validate tracking, and the CRO lead owns the go or no-go call.
The deliverable is a completed QA log with a validation date and a launch sign-off. No sign-off, no launch. Next, we'll go deeper into Sample Ratio Mismatch and Live-Test Integrity.
 customfit.ai2 min
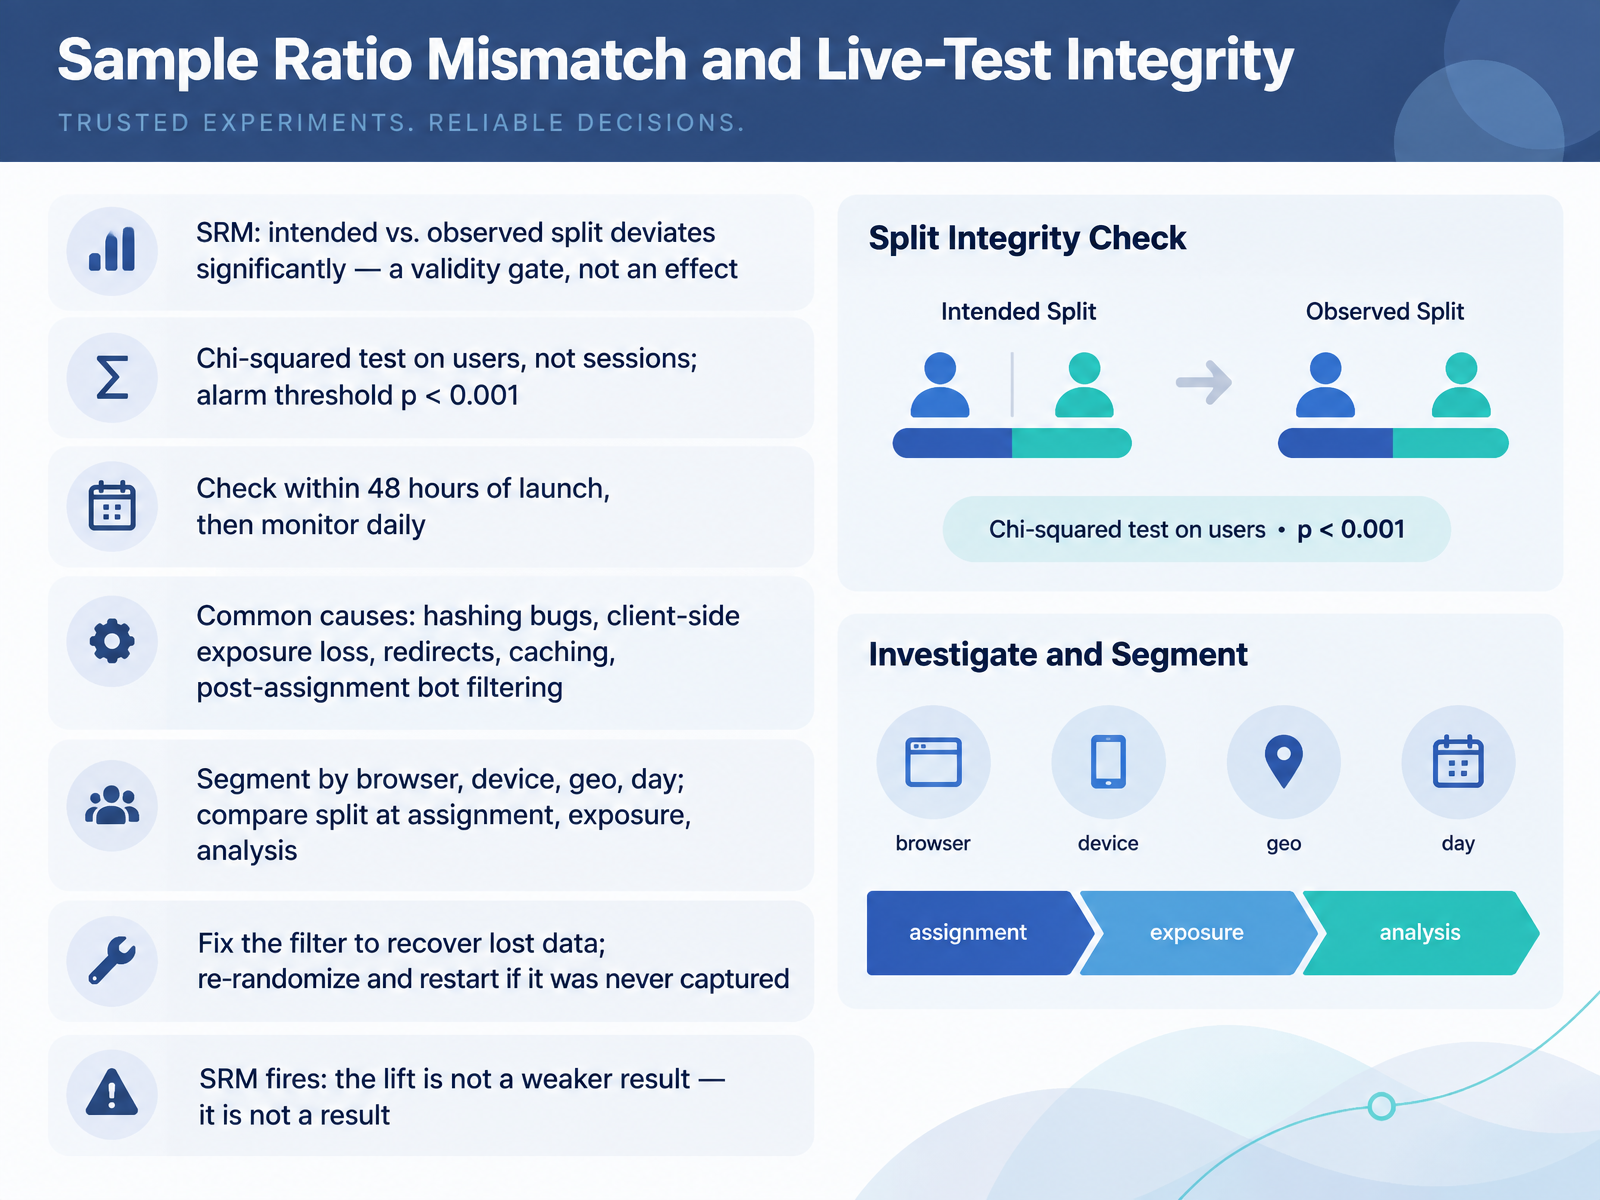
- 11Sample Ratio Mismatch and Live-Test IntegrityLet's talk about live-test integrity, because this is the gate that protects everything downstream. Sample ratio mismatch, or SRM, is when your observed split deviates significantly from the intended one. Treat it as a validity gate, not an effect. Test it with a chi-squared check on users, never sessions, at a p-value threshold of zero point zero zero one. Run your first check within forty-eight hours of launch, then monitor daily. The usual causes: hashing bugs, client-side exposure loss, redirects, caching, and bot filtering applied after assignment. So segment by browser, device, geo, and day, and compare your split at assignment, at exposure, and at analysis. If a filter removed real users, fix the filter and recover the data. If the units were never captured, re-randomize with a new salt and restart. When SRM fires, the lift is not a weaker result. It is not a result. That leads us to Stage Five: Reading Results Without Fooling Yourself.
 cxl.comcxl.comspeero.com+22 min
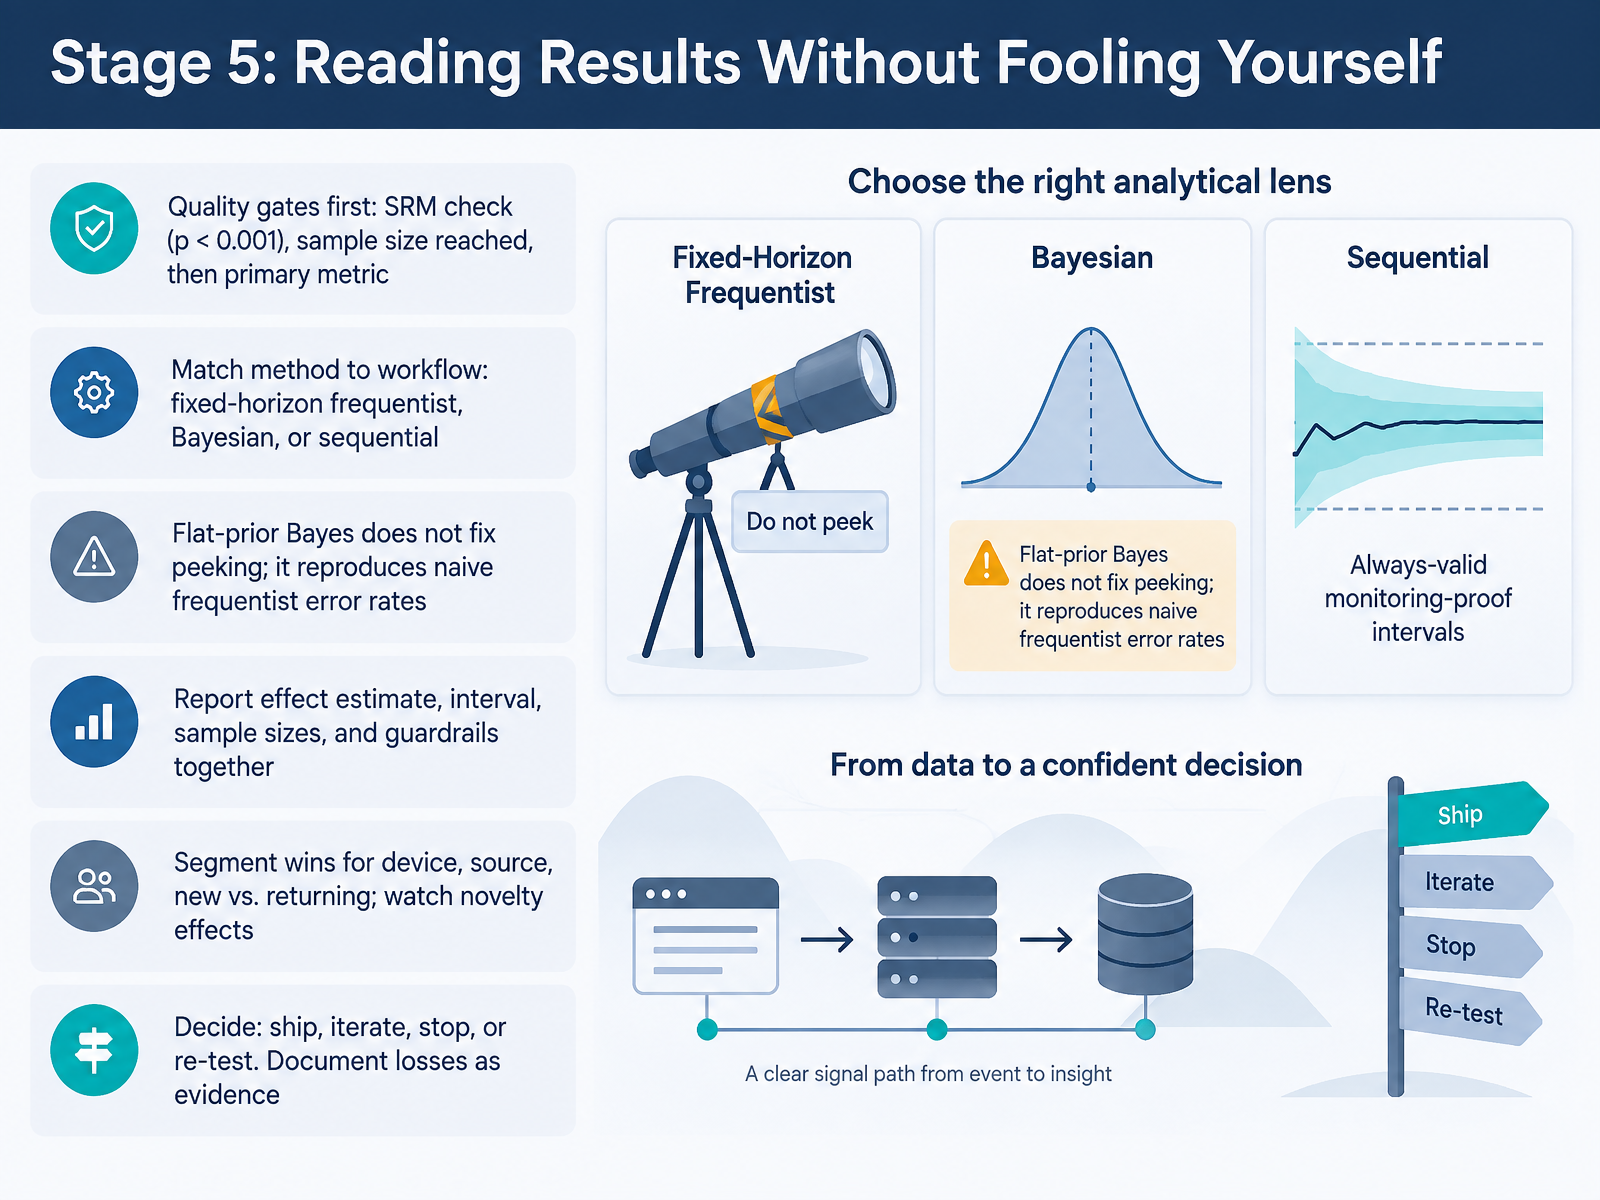
- 12Stage 5: Reading Results Without Fooling YourselfNow let's talk about reading results without fooling yourself. Run your quality gates before you look at the primary metric. First, the sample ratio mismatch check. If the split between variants is off, with a p-value below zero point zero zero one, stop. The test is invalid, no matter how good the lift looks. Second, confirm you actually hit your planned sample size. Only then read the primary metric. Match your method to how your team really works. If you can wait for one fixed analysis, fixed-horizon frequentist is fine. If you need continuous monitoring, use a sequential method or Bayes factor stopping. Here's the trap: a flat-prior Bayesian readout does not fix peeking. It reproduces the same error rates as naive frequentist peeking. Many platform defaults work this way, so know which configuration you're running. In your readout, report the effect estimate, its interval, sample sizes, and guardrails together. A lift with no interval tells you nothing about risk. Then segment: device, traffic source, new versus returning users. Watch for novelty effects, where a win fades after a few weeks. Finally, decide. Ship, iterate, stop, or re-test. Document losses as evidence. A recorded null result stops the next person from repeating it. That's the discipline. Deliverables, Documentation, and Program Reporting. That's where we look at what you hand off and how the program proves its impact.
 customfit.ai2 min
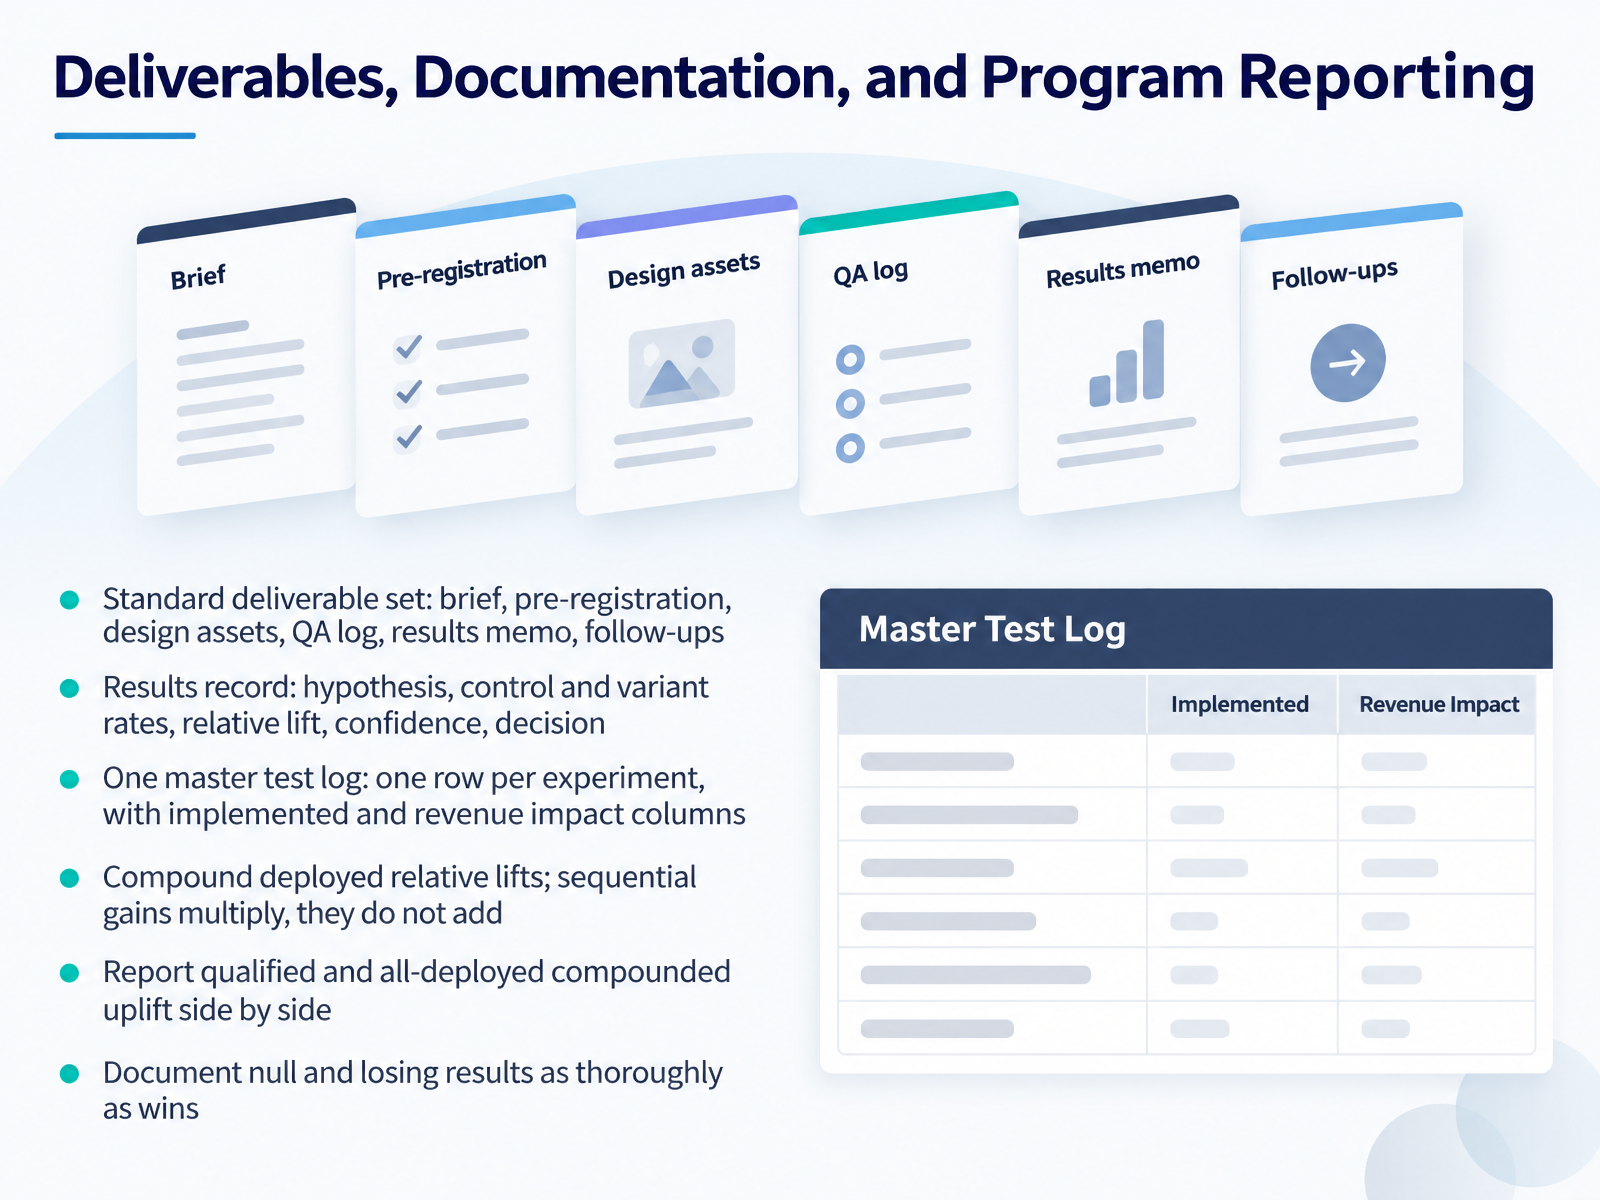
- 13Deliverables, Documentation, and Program ReportingNow let's close the loop on deliverables, documentation, and program reporting. Your standard deliverable set is a brief, a pre-registration, design assets, a QA log, a results memo, and a follow-ups list. One person owns each artifact, and the results memo is what formally ends the test. The results record holds the hypothesis, control and variant rates, relative lift, confidence, and the decision. Keep one master test log, one row per experiment, with implemented and revenue impact columns, because those two columns show program value. A critical math point: compound deployed relative lifts. Sequential gains multiply, they do not add. A ten percent lift followed by a twenty percent lift is thirty two percent, not thirty. Report qualified compounded uplift and all deployed compounded uplift side by side, since the gap exposes smaller or negative deployments. And document null and losing results as thoroughly as wins.
 customfit.aimetaflow.lifeatticusli.com+22 min
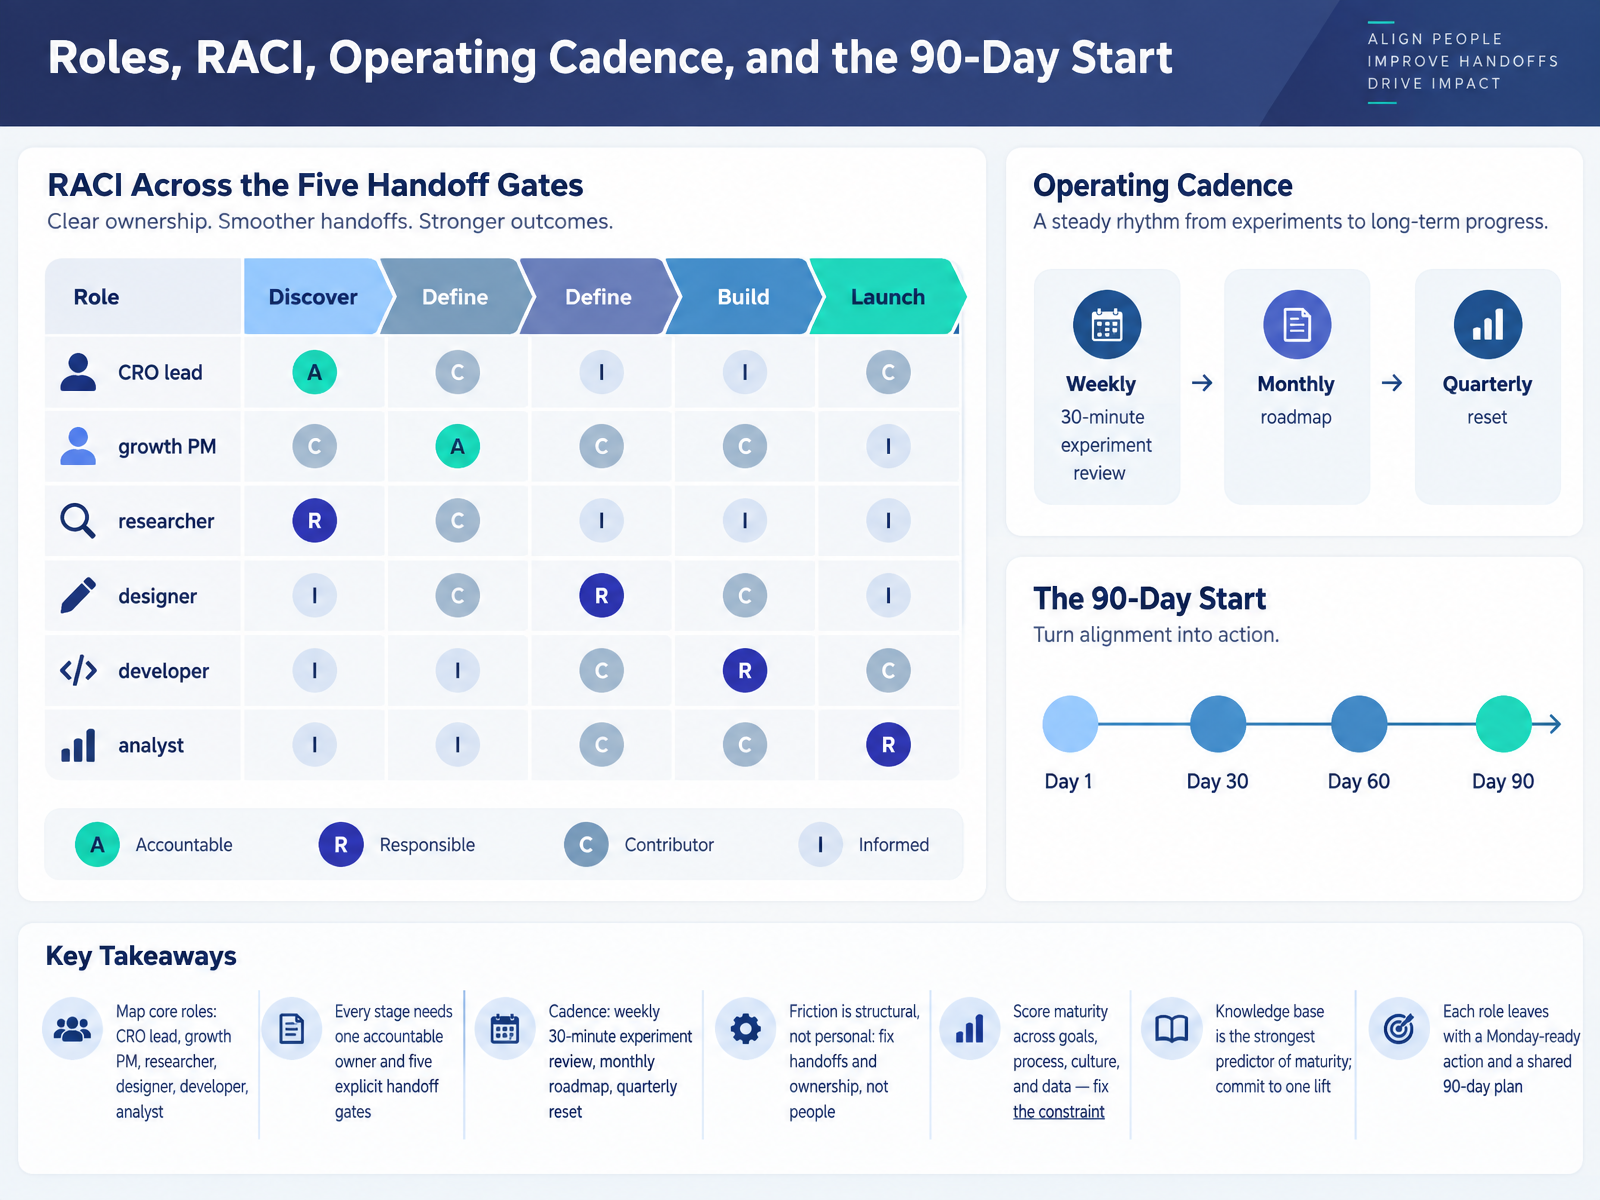
- 14Roles, RACI, Operating Cadence, and the 90-Day StartLet's close out the program with the operating model that holds everything together. First, map your core roles: the CRO lead, growth PM, researcher, designer, developer, and analyst. Every stage needs exactly one accountable owner. That is the difference between a program that ships and one that produces reports nobody reads. Also define five explicit handoff gates: strategy, design, analytics, QC, and launch. If you remember one thing, make it this: friction is structural, not personal. When tests stall, fix the handoffs and the ownership, not the people. Run a cadence that everyone respects: a weekly thirty-minute experiment review, a monthly roadmap session, and a quarterly reset. Then score your maturity across goals, process, culture, and data. Find your weakest area and fix that constraint first, because the chain is only as strong as its weakest link. One honest warning: the strongest predictor of maturity is whether you maintain a knowledge base. So commit to one lift, document every test, and make sure each role leaves today with a Monday-ready action and a shared ninety-day plan. Thank you for your attention. You now have the full process, the roles, and the deliverables. Start with one owner, one cadence, and one documented test, and build from there. Good luck.
 foundrycro.comchristopholivierconsulting.comvolument.com+22 min
Take the deck with you
Download this course as a file — free, no sign-up needed.
- PDF handoutEvery slide page, ready to print or share.15 pages · 3.2 MBDownload
- Narrated PowerPointThe deck that presents itself — every slide carries the digital human's narration video.15 pages · 15.4 MBDownload
- PowerPoint slidesThe full deck as a .pptx — open it in PowerPoint, Keynote, or Google Slides.15 pages · 3.1 MBDownload
Free to use in your own training — please keep the PersonWise credit page at the end.
Have your own deck? Turn it into a course
Sources consulted
Web sources consulted while building this course.
- Agency CRO Plan: 12-Week Engagement Playbook (2026) — foundrycro.com
- CRO Process for 2026 — Practical Guide - CO Consulting — christopholivierconsulting.com
- Conversion Rate Optimization: Complete Guide to Higher Conversions 2026 - Volument — volument.com
- CRO Roadmap: Building a 90-Day Plan | CustomFit.ai — customfit.ai
- The Complete Guide to Conversion Rate Optimisation (CRO) in 2026 — apexure.com
- Conversion Tracking Validation: Your 2026 Playbook | Trackingplan — trackingplan.com
- Conversion Funnel Tracking: Complete Setup Guide 2026 — cometly.com
- Conversion Tracking Guide 2026: Setup, Audit & Best Practices | OpenUTM — blog.openutm.app
- Measurement Blueprint 2026: JSON Schema & Data Contract — datascale.de
- Conversion Tracking Plan: How to Build a Measurement Framework That Survives Cookie Deprecation — stackmatix.com
- Conversion Research to Identify Better A/B Tests | CXL — cxl.com
- How to Come Up with More Winning Tests Using Data [ResearchXL model] — cxl.com
- How to create an optimized experimentation strategy using the ResearchXL model — speero.com
- The Advanced Guide to Qualitative Research — cxl.com
- How to Create a Conversion Rate Optimization (CRO) Process — cxl.com
- A/B Test Template with Hypothesis and Decision Rule | Metaflow — metaflow.life
- Pre-Registration for A/B Tests | Atticus Li — atticusli.com
- Experiment & A/B Test Hypothesis Template — ideaplan.io
- A/B Testing Plan Template for Product Teams | CleverX Blog — cleverx.com
- A/B Testing Documentation Template (Free) | CustomFit.ai — customfit.ai